cellulose nanocrystal reinforced epoxy vinyl ester resins ... · resin network. the addition of...
TRANSCRIPT
1
Cellulose Nanocrystal Reinforced Epoxy Vinyl Ester Resins:
Fabrication and Mechanical Properties
L. Thompson, M. Nikzad*, I. Sbarski, J. Miller and A. Yu
Faculty of Science, Engineering and Technology; Swinburne University of Technology,
Melbourne, Australia
Abstract
Cellulose nanocrystals (CNC) were surface modified with (3-aminopropyl)triethoxysilane
(APTES) to convert their native hydrophilic nature into hydrophobic. This Functionalization
was found to be effective in improving the dispersion of CNC within the epoxy vinyl ester
resin network. The addition of functionalised CNC enhanced mechanical properties of the vinyl
ester based nanocomposites. Nanoscale dispersion of the CNC particles was proved to be a key
factor in maximising mechanical properties of the matrix and keeping the nanofiller content to
an optimal minimum. Tensile strength and modulus of the matrix was found to have peaked
around 1-1.5% w/v loading of the CNC whereas higher loading had negative impact on the
properties due to agglomeration of the nanoparticles and formation of micro inclusions.
Dynamic mechanical analysis showed an approximate 1 GPa rise in the storage modulus of the
CNC reinforced vinyl ester matrix compared to the neat resin. Loss modulus of the matrix of
the rubbery phase beyond 100 °C remained unaffected indicating little impact on the complex
viscosity of the resultant composite at lower loading of CNC. APTES based surface treatment
of CNC particles was proved to be a promising route to enhance the dispersion of CNC as
reinforcing fillers in vinyl ester based composite structures which have a variety of industrial
applications.
Keywords
Cellulose nanocrystals, polymer nanocomposites, surface modification

2
1. Introduction
Cellulose has obtained a global interest in various industries including textiles, papers and as
an additive in foods. Part of this can be attributed to cellulose being the most readily abundant
biopolymer. This availability is enhanced by the fact that the primary sources of cellulose are
plant materials, meaning that it is are renewable and green. The cellulose polymer is comprised
of a repeating unit of two glucoses in a β 1-4 orientation known as cellobiose, the length of this
repeating unit varies depending on the individual source material used with n reaching as high
as 15,000 units. Cellulose fibres are comprised of two separate parts, the more organised
(crystalline) and disorganised (amorphous) regions. (Habibi et al., 2010, Moon et al., 2011)
Nanocrystalline cellulose is primarily obtained via hydrolysis; either through acids (Oksman
et al., 2006, Junior de Menezes et al., 2009, Pasquini et al., 2010, Chen et al., 2015, Li et al.,
2015, Dong et al., 2016, Guo et al., 2016) or enzymes (Pääkkö et al., 2007). The treatment leads
to the removal of amorphous regions, leaving only the crystalline parts. Typically, the
hydrolysis method is performed using concentrated sulphuric acid (varying around 50 to 70
wt%) (Chen et al., 2015, Dong et al., 2016). The sulphuric acid treatment has the added benefit
of creating a negative charge on the surface of the remaining crystalline regions. The remaining
crystalline cellulose can be further broken down by the application of mechanical energy The
process involves the shearing of the cellulose fibrils cleaving across an axis, creating long
singular chains which are then reduced via repeated processing, breaking down into individual
nanowhiskers (Braun and Dorgan, 2009, Junior de Menezes et al., 2009, Csiszar et al., 2016).
Mechanical processing is somewhat limited due to the creation of hydrogen bonds between the
individual nanocrystals forming large agglomerates.
The production of nanocellulose has been an area of interest in recent years due to multiple
positive properties such as high aspect ratio, low density, high affinity to water, high tensile
modulus and easy modification due to hydroxyl groups present (Moon et al., 2011). Due to
these positive properties cellulose nanocrystals have gained interest in the use as a nanofiller
in polymer networks.
A controlled dispersion of CNC in a thermoset resin matrix has the commercial attractiveness
of enabling a low cost boost to the performance for structural composite applications. Specific
benefits such as improved thermal stability, increased stiffness and resilience as well as the
potential to reduce the volume of material and hence reduce mass, are highly valued properties
in composite components used for transport applications. Developments in low cost
3
nanocomposites have the potential to open the floodgates to a mainstream market for the
replacement of medium to high strength steels in chassis and other structural parts in
automotive applications and may also bridge the performance gap in some high end aerospace
applications where carbon fibre reinforced composites are typically used. Other possible
applications include wind turbine blades and marine craft structures.
The addition of the nanocrystals has been explored in various different polymers including
polyvinyl alcohol (Mbhele et al., 2003, Roohani et al., 2008, Liang et al., 2009), polyethylene
(Goetz et al., 2009, Junior de Menezes et al., 2009), polyurethane (Petrović et al., 2000, Cao et
al., 2007, Girouard et al., 2016), unsaturated polyester resin (Kargarzadeh et al., 2015a,
Kargarzadeh et al., 2015c), poly(lactic acid) (Oksman et al., 2006), chitosan (Celebi and Kurt,
2015), epoxy resin (Girouard et al., 2015, Khelifa et al., 2016, Ma et al., 2016) and rubber
(Pasquini et al., 2010).
It has been some reports on the incorporation of CNC into polymer network to improve the
properties of nanocomposites. For example, previous work has explored the use of CNC in
water based epoxies (Xu et al., 2013, Girouard et al., 2015) showing that it was a successful
method for improving the intended properties. It has also been shown that the addition of pure
CNC to an organic based resin does lead to some improvement however it is very limited to
low volume fractions of the filler due to the formation of agglomerates. Till now, the direct use
of CNC has been rather limited due to its highly hydrophilic nature which makes difficult to
be dispersed within anything that isn’t water based.
For CNC to be properly incorporated into an organic system it requires surface modification to
reduce the hydrophilic properties. This functionalization is typically done by
removing/replacing the hydroxyl groups which are present on the surface of the CNC.
Research has previously explored various pathways of modifying CNC to improve the
dispersion, these pathways include TEMPO oxidation (Montanari et al., 2005, Li et al., 2015,
Sun et al., 2015), use of surfactants (Heux et al., 2000), polymer grafting (Junior de Menezes
et al., 2009), isocyanates (Siqueira et al., 2010, Girouard et al., 2016) and as was also looked
at in this paper the use of silane coupling agents (de Oliveira Taipina et al., 2013, Kargarzadeh
et al., 2015a, Kargarzadeh et al., 2015c).
In this work, the use of a silane coupling agent ((3-aminopropyl)triethoxysilane) was decided
as it was hoped to use a one pot method of production allowing for a simple modification
4
process which could potentially be scaled up to levels of productions that would be found in
industry.
2. Materials and Methods
2.1 Materials
(3-aminopropyl)triethoxysilane (APTES, 95%), methyl methacrylate (MMA), absolute ethanol
and acetic acid (99%) were obtained from Sigma Aldrich. Vinyl ester resin and initiator methyl
ethyl ketone peroxide composition (Norox MEKP-H925) were obtained from Nuplex
Composites, Australia. Cellulose nanocrystals (CNC) were donated by the United States
Department of Agriculture’s Forest Products Laboratory in association with the Cooperative
Research Centre for Advanced Automotive Technologies and the Australian based automotive
interiors manufacturer.
2.2 Functionalization of CNC
CNC functionalization was performed using a modified method from Kargarzadeh et al
(Kargarzadeh et al., 2015c). CNC was dispersed into an ethanol solution containing 2% v/v
APTES which then had its pH reduced to be approximately 4 using acetic acid. The solution
was sonicated for 15 minutes and left to rest for 3 hours at room temperature. The resulting
modified CNC was collected via centrifugation followed by washing with absolute ethanol to
remove any excess silane. The APTES modified CNC was then dried in oven for future usage.
2.3 Production of Vinyl Ester Resin/CNC hybrids
The desired amount of the APTES modified CNC was mixed into 10 mL MMA. After
sonication for 10 minutes, the CNC/MMA solution was added into 90 mL vinyl ester resin.
The mixture was sonicated in an ice bath for 30 minutes with some stirring.
The resin then had 1.25% MEKP-H 925 added into it under vigorous stirring. The mixture was
left to rest for 10 minutes to remove any bubbles that were produced. Any additional bubbles
that remained on the surface were popped by grouping them to the edge of the container used
using a glass rod.
After settling the resin was poured into mould and placed in the oven to cure at 80 °C for 5
hours. After cooling to room temperature, samples were buffed with 120 and then 480 grain
sand papers using an orbital sander at 400 RPM.

5
Thick film samples with an approximate thickness of 2 mm for dynamic mechanical thermal
analysis (DMA) were also produced by mixing 14.4 mL of the resin with 1.6 mL of the mixed
solution of MMA and APTES/CNC. After sonication the resin had the same process for
activation and was poured into petri dishes and left to cure for 2 hours at room temperature.
Samples were then removed from dishes and cured in the oven for 5 hours at 80°C.
The produced thick films were then buffed to obtain a consistent width and were then cut to
size of approximately 35 by 12 mm.
2.4 Characterisation
2.4.1 Fourier Transfer Infra-Red Spectroscopy
Fourier Transfer Infra-Red Spectroscopy (FTIR) was carried out to explore whether the APTES
was successfully grafted to the CNC. It was performed using a Thermo Scientific Nicolet iS5
FT-IR Spectrometer, with 10 scans being performed per test.
2.4.2 Zeta Potential
Zeta Potential and particle sizing of CNC and APTES/CNC were measured in water, ethanol
and MMA, these different solvents were selected based on their polarity. MMA was primarily
selected as an organic solvent due to its common use in polymers as an additive.
To explore the stability of the dispersion, 0.1 g APTES/CNC was placed into approximately
2.5 mL of each solvent. It was then sonicated for 30 minutes before being left to sit for two
days to look at how well the particles would stay dispersed within the solution.
2.4.3 Tensile Tests
Tensile tests of the produced resin samples were performed on a Zwick Z010 universal testing
machine. According to American Society for Testing and Materials standard (ASTM D638),
the test speed and gauge length were set at 5 mm/min and 100 mm respectively. Small test
speed was used due to brittleness of the thermoset samples. A minimum number of 5 test
specimens were used to check for the reproducibility of the results.
2.4.4 Scanning Electron Microscopy
Surface morphology of produced resin hybrids was inspected using a ZEISS Supra 40VP
Scanning Electron Microscope (SEM). SEM scans were performed on cross sections of resin
samples which had been broken during the tensile tests. Prior to scanning, samples were coated
with a thin layer of gold to improve the conductivity.
6
2.4.5 Transmission Electron Microscopy
TEM was performed to examine the dispersion of the APTES/CNC at the nanoscale within the
resin. Samples were first cut into 1 cm x 3 cm pieces and washed with copious amount of
nanopure H2O (with a resistivity of 18.2 MW cm–1), dried with 99.99% purity nitrogen gas.
These pieces were then trimmed, cut into ultrathin sections (80 nm thickness) using a Leica
EM UC7 ultramicrotome (Leica Microsystems, Wetzlar, Germany) with a diamond knife
(Diatome, Pennsylvania, USA). Sections were placed onto 300 mesh copper grids and
examined using a JEM 1010 instrument (JEOL, Frenchs Forest, Australia). Approximately 15
TEM images taken at ×10000 and ×20000 magnifications for each sample were analysed.
2.4.6 Dynamic Mechanical Thermal Analysis
DMA was performed on the produced thick films on a 2980 DMA machine from TA
Instruments. The parameters were set to be 35 °C for the starting temperature increasing at a
rate of 5 °C per minute to a maximum of 150 °C. The test performed was a single cantilever
test with a gap width of 17.5 mm on pieces of thick film with dimensions being roughly 12 mm
wide and 35 mm long.
2.4.7 Thermogravimetric Analysis
TGA was performed on an SDT 2960 Simultaneous DSC-TGA from TA Instruments.
Approximately 5 mg of each sample was used to perform the test; the starting temperature was
set to be 50 °C increasing with a rate of 10 °C per minute to a maximum of 500 °C using air as
the gas.
3. Results and Discussion
3.1 Functionalization of CNC with APTES

7
Figure 1: FTIR spectra of (A) CNC and (B) APTES modified CNC.
After being modified with APTES, there was a noticeable colour change of CNC, turning from
white to a light brown. FTIR spectra (Figure 1) further confirmed that the functionalization has
occurred. Compared to the spectrum of unmodified CNC (curve A), additional peaks appear
after reaction with APTES (curve B). The new peak around 1100 cm–1 can be attributed to the
Si–O bonding formed between APTES and the hydroxyl groups of CNC. Additional peak of
amino groups from APTES could be seen at approximate 1600 cm–1. At 1300 cm–1 the Si-C
bonding from APTES can be found as well. These peaks confirm that APTES has been
successfully grafted onto CNC. It is noticed that there is still a distinct peak around 3400 cm–1
that is related to the hydroxyl group of CNC. This indicates that there are still some hydroxyl
groups unreacted after APTES modification.
Visually alone there was a noticeable difference in dispersibility between the modified and
unmodified CNC. As can be seen in Figure 2, the unmodified CNC forms a stable and uniform
dispersion in water due to the abundant hydroxyl groups on surface. Because some hydroxyl
groups still remain after APTES modification (see above FTIR results), the APTES/CNC is
also able to form a water dispersion. However, the dispersion is not stable and APTES/CNC
settles very quickly to the bottom of the centrifuge tube. This result further supports the
successful functionalization of APTES on CNC. When comparing the dispersion in other two

8
organic solvents including ethanol and MMA, the APTES modified CNC performed much
better in forming stable dispersions. This is especially noticeable within MMA where there was
no visible agglomeration (Figure 2F).
Figure 2: Images of CNC and APTES/CNC dispersed in different solvents. CNC in (A) water,
(B) ethanol, (C) MMA, and APTES/CNC in (D) water, (E) ethanol and (F) MMA.
Table 1: Zeta Potentials of CNC and APTES/CNC in different solvents.
Zeta Potential (mV) H2O Ethanol MMA
CNC –39.5 –30.2 –0.5
APTES/CNC –13.3 –14.3 –3.9
Table 1 shows the Zeta potentials of CNC and APTRES/CNC measured in three different
solvents. CNC have a very high negative zeta potential (–39 mV) in water, again due to the
hydroxyl groups on surface. This also explains its excellent dispersibility in water. The zeta
potential of APTES/CNC in water is –13.3 mV which is much lower than CNC in comparison,
showing that there had been a reduction in the number of hydroxyl groups on surface. Similar
results were found in ethanol; this isn’t too surprising as ethanol is still a rather polar solvent.
However, the zeta potential in MMA gives a different result, with the APTES/CNC having a
more negative value. This might explain the better dispersity of APTES/CNC in MMA.
However, further tests may be needed to confirm the exact Zeta potentials in MMA as it
partially polymerised during testing, which could impact its zeta potential reading.
Table 2: Particle size of CNC and APTES/CNC measured in different solvents.
Particle Size (nm) H2O Ethanol MMA
CNC 14 679 79
9
APTES/CNC 3044 513 130
Table 2 shows the particle size of CNC and APTES/CNC measured in the same three solvents.
In water the particle size for the CNC was about 14.4 nm which is within the range provided
by the company. The true size of CNC particles would be difficult to accurately obtain from
particle sizing due to their more rod-like structure. Compared to CNC, the APTES/CNC sample
had a much larger particle size in water which now measured in the microscale. The result
would be due to the reduced surface charge leading to large agglomerates. The particle size of
CNC in ethanol increased significantly, which relates to the reduction in the zeta potential and
the creation of agglomerates between the individual particles. The fact that the sizes of
APTRES/CNC in ethanol and MMA were much less than it in water indicates that the surface
modification of APTRES greatly improves the dispersibility of CNC in organic solvents such
as MMA.
From both tests there was found to be a change after functionalization, indicating that it had
been successful in reducing the hydrophilic nature of cellulose. The reduction however was not
perfect as there were still some hydroxyl groups present. This result was backed by the FTIR
which shows the remaining presence of some hydroxyl groups which are believed cause for
the overall hydrophilicity of CNC.
4.2 Resin/CNC composite materials
4.2.1 Preparation of Resin/CNC films
During the production of resin samples, it was noticed that the colour of the resin would change
as the concentration of the APTES/CNC increased in the sample. Starting as an orange colour,
over time would become darker eventually becoming closer to brown. This was an indication
of the difference between the produced samples as the loading ratios were altered.
It was proposed that this colour change was due to the interactions between the amine group
of APTES with metal ions present within the resin. This could be an issue as it is unclear if this
interaction did happen and what effects it had on the curing process of the resin used.
The samples were cured in a regular oven due to worries that the process being performed in a
vacuum oven would lead to further increases of the inherent stress within the produced resins.
4.2.2 Morphology of Resin/CNC films

10
Figure 3: Cross-section SEM images of the composites with varying loading of the
APTES/CNC in VER. (A) Blank Resin, B 0.1% APTES/CNC and C 1% APTES/CNC.
Figure 3 shows the cross-section SEM images of the blank resin and resin composites with 0.1%
and 1% APTES/CNC loading. There was noticeable difference in surface feature as the
concentration of CNC increased. The surface roughness of the resin also appeared to increase
showing more signs of imperfections. This can be explained by the APTES/CNC taking up
parts within the polymer network disrupting the overall packing of the polymer.
From the SEM results it was difficult to confirm whether or not the modified CNC was properly
distributed throughout the resin network. TEM was then used to confirm the incorporation of
CNC into the resin network. As can be seen in Figure 4, there was poor distribution of CNC
within the epoxy vinyl ester with large agglomerates being formed. The diameter of particles
ranged from being greater than 200 nm down to under 50 nm.
Figure 4: TEM images of produced plastics with (A) 0.5% and (B) 1% APTES/CNC loading.
Thus the concentration increase of CNC could induce the agglomerates of CNC particles.
These agglomerates could be potentially points of weakness within the formed plastics, leading
to premature breaking of samples when testing the mechanical properties. The un-uniform
11
distribution helps explain the variation within individual results (see below), as the
concentration would be different depending on the tested area for the produced samples.
4.2.3 Mechanical Properties
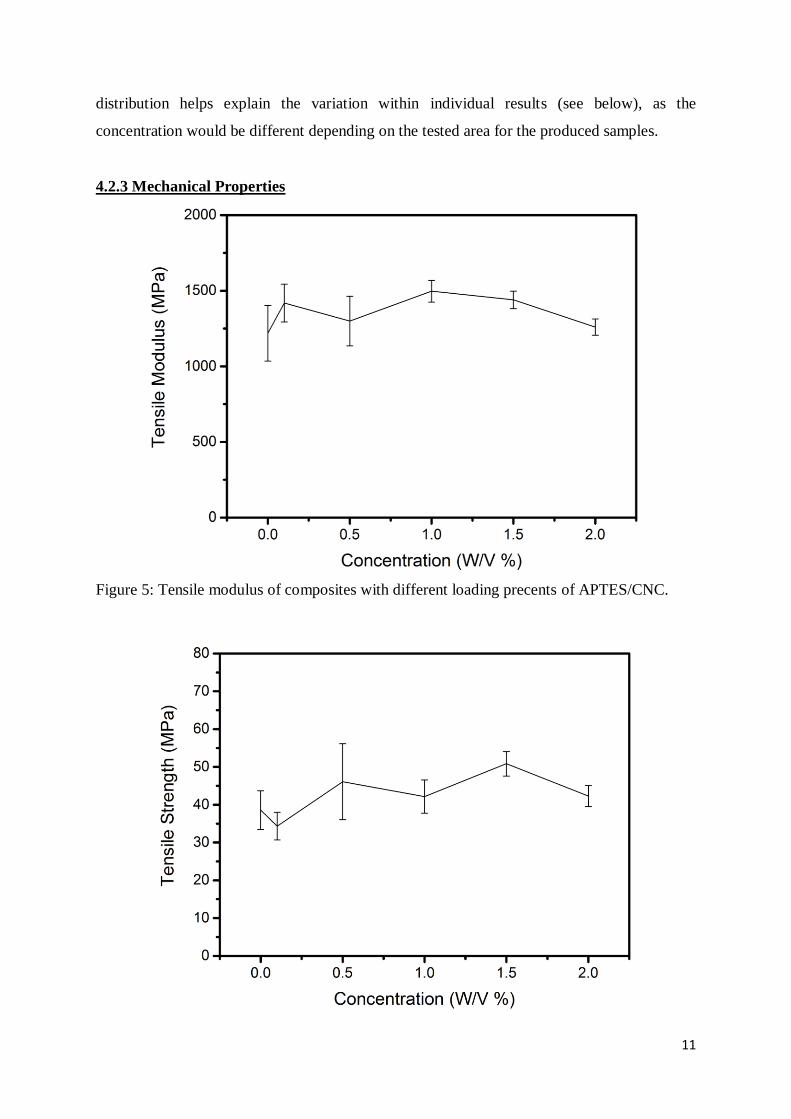
Figure 5: Tensile modulus of composites with different loading precents of APTES/CNC.
12
Figure 6: Tensile strength of the resin composites with different loading of APTES/CNC.
Figure 5 and 6 represent the tensile strength and modulus for the resin composites with
different loading of APTES/CNC. The data show a rather inconsistent trend where it would
increase overall until eventually decreasing. The problem with this arises from the fact that
there was the opposite occurring; where an increase from the previous in the modulus was met
by a decrease in the tensile strength. The only sample that this problem does not occur is the
composite with 2% loading where both tensile strength and modulus had a decrease, suggesting
that it was beyond the limit for effective loading.
It is difficult to say whether this trend is consistent due to the substantial error found within
these tests, especially for the modulus. With the blank resin having a variation significant
enough to cover at least part of the variation in nearly each sample that was tested. As the
disparity was so significant, it cannot be confirmed how much of the improvement was from
the addition of the APTES/CNC instead of just being the blank resin.
However, when considering the error, it can be found that there is not that great an improvement
in the tensile modulus. The greatest improvement compared to the base resin was still under
300 MPa difference and is roughly a 18% improvement overall. It is very likely that the
obtained maximum tensile strength is not the true maximum due to the break down.
The tensile strength had a more noticeable improvement than the modulus; it was found to have
a maximum that was about 31% better than the base resin. The variation within the tensile
strength was also much lower in comparison to the modulus.
4.2.4 Thermal Properties
DMA was performed to explore the stress/strain and rheological properties of the plastics
produced. From the DMA graph in Figure 7, it was found that compared to the base resin there
was an improvement in the storage modulus. Even with the lowest loading of 0.1% it still had
close to a 0.7 GPa increase for the maximum value. There was a general increase in the storage
modulus up to 1.5% loading after which there was a decrease. The sample with 2% loading
has the similar modulus to that of the 0.1% sample.

13
Figure 7: DMA graphs of composites with different APTES/CNC loadings. A: Vinyl ester resin
only, B: 0.1 % APTES/CNC, C: 0.5% APTES/CNC, D: 1% APTES/CNC, E: 1.5%
APTES/CNC and F 2% APTES/CNC.
All the tested samples appeared to have a drop at around the same temperature (about 110 °C)
without much significant variation between these results. This showed there was little effect on
the point at which mechanical failure begins; implying that there was not a great effect on the
thermal stability and glass transition from the addition of the APTES/CNC. However, it is
worth noting that samples with 1 and 1.5 % loading (which had the highest storage modulus)
also had the earliest onset for the mechanical failure. But this onset is still a rather negligible
difference in comparison.
It was proposed that part of the limitation leading to a decrease in the storage modulus at such
a low loading was due to the presence of amine groups from APTES. These amine groups could
interact with metal ions present in the VER which inhibit the initiation of the curing process.
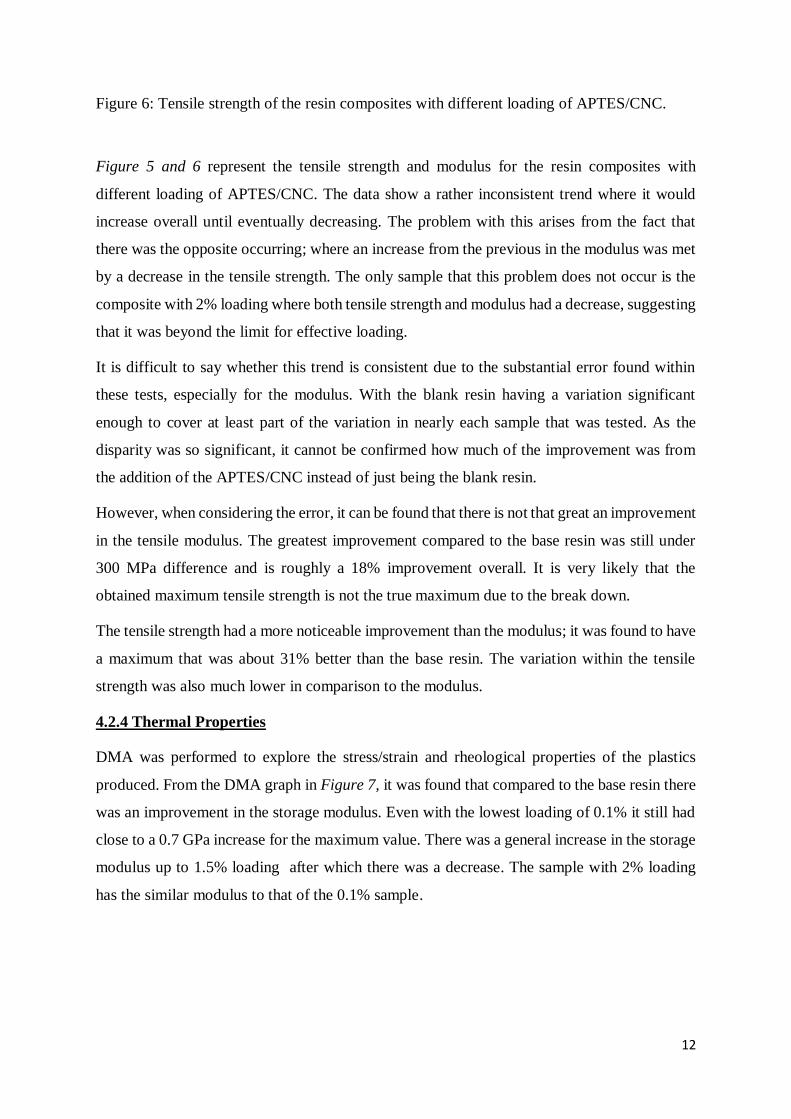
From the Tan Delta Peak shown in Figure 8, it was found that there was a reduction in the
temperature required for the resin used to obtain its glass transition. The Tan Delta gives a
much clearer indication of the glass transition compared to the storage modulus. There was a
notable decrease in the storage modulus from the start of the experiment until it reached what
was approximately the beginning of the glass transition. Some of this alteration could be
14
explained by the addition of the nanofiller leading to a less cohesive crosslinking occurring
within the resin network.
What is interesting to note is that the movement of the peak is related to the storage modulus
as the 2% loading had a higher value compared to the two previous samples which suggests
that the addition of the CNC was not the direct effect causing the reduction.
Figure 8: Comparison of Tan Delta information for produced resin samples. A: Vinyl ester
resin only, B: 0.1 % APTES/CNC, C: 0.5% APTES/CNC, D: 1% APTES/CNC, E: 1.5%
APTES/CNC and F 2% APTES/CNC.
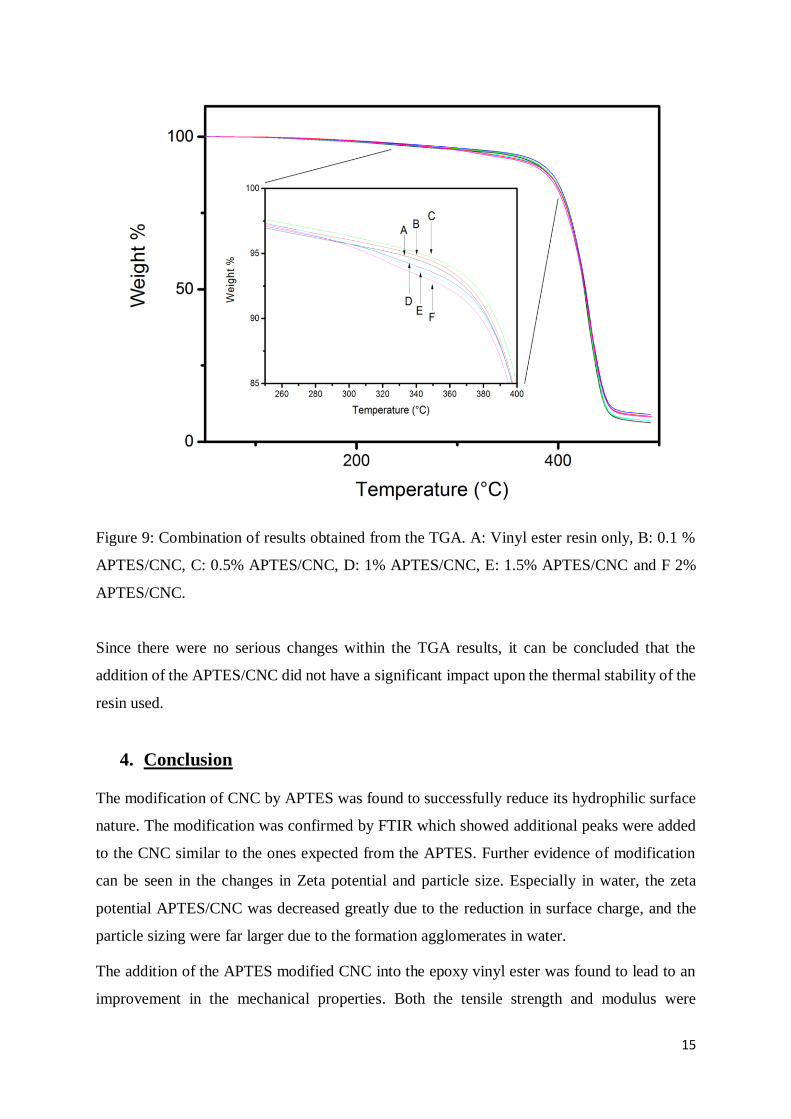
Figure 9 represents the TGA graph of the resin composites. There was little difference between
individual samples. CNC would burn at about approximately 300 °C which can be seen in the
insert of Figure 9 where there is a small drop in the percentage. However, this difference is not
very discernible in comparison to the blank vinyl ester resin. This small distinction would also
be due to the fact that the samples had such a small loading of the APTES/CNC. This would
be at best a 2% difference in weight which is rather negligible in the total graph.
15
Figure 9: Combination of results obtained from the TGA. A: Vinyl ester resin only, B: 0.1 %
APTES/CNC, C: 0.5% APTES/CNC, D: 1% APTES/CNC, E: 1.5% APTES/CNC and F 2%
APTES/CNC.
Since there were no serious changes within the TGA results, it can be concluded that the
addition of the APTES/CNC did not have a significant impact upon the thermal stability of the
resin used.
4. Conclusion
The modification of CNC by APTES was found to successfully reduce its hydrophilic surface
nature. The modification was confirmed by FTIR which showed additional peaks were added
to the CNC similar to the ones expected from the APTES. Further evidence of modification
can be seen in the changes in Zeta potential and particle size. Especially in water, the zeta
potential APTES/CNC was decreased greatly due to the reduction in surface charge, and the
particle sizing were far larger due to the formation agglomerates in water.
The addition of the APTES modified CNC into the epoxy vinyl ester was found to lead to an
improvement in the mechanical properties. Both the tensile strength and modulus were
16
improved even with a 0.1% loading. The maximum possible loading was found to be around
1.5%, above which a decrease was found in comparison to the blank sample. The tensile testing
was rather limited due to the individual variation during the production of the sample. The
DMA results indicated that there was a significant improvement to the storage modulus, with
both samples of 1 and 1.5% loading reaching close to a 1 GPA increase over the blank. There
was no significant difference in the loss modulus indicating that the thermal stability was not
greatly impacted by the further addition of CNC.
From the mechanical data it could be argued that 1% loading was the preferred option as
negligible difference was found between samples of 1% and 1.5% loading. Because 1% loading
only requires two thirds of CNC, it has the advantage on larger scale production.
Whilst modification with APTES was successful, the current method still has the limitation
due to the formation of CNC agglomerates. These agglomerates prevent the uniform
distribution of CNC within the polymer network to form a desirable nanocomposite material.
Further studies on the improvement of the dispersibility of CNC in resin are currently underway
in our lab.
Acknowledgement:
Authors would like to thank Mr Peter Nguyen for his assistance in obtaining TEM images of
the samples. The support of Commonwealth Research Centre for Automotive, Australia in
obtaining CNC materials from UFPL is also greatly appreciated.
References
BRAUN, B. & DORGAN, J. R. 2009. Single-step method for the isolation and surface
functionalization of cellulosic nanowhiskers. Biomacromolecules, 10, 334-341.
CAO, X., DONG, H. & LI, C. M. 2007. New Nanocomposite Materials Reinforced with Flax
Cellulose Nanocrystals in Waterborne Polyurethane. Biomacromolecules, 8, 899-904.
CELEBI, H. & KURT, A. 2015. Effects of processing on the properties of chitosan/cellulose
nanocrystal films. Carbohydrate Polymers, 133, 284-293.
CHEN, L., WANG, Q., HIRTH, K., BAEZ, C., AGARWAL, U. P. & ZHU, J. Y. 2015.
Tailoring the yield and characteristics of wood cellulose nanocrystals (CNC) using
concentrated acid hydrolysis. Cellulose, 22, 1753-1762.
CSISZAR, E., KALIC, P., KOBOL, A. & FERREIRA, E. D. P. 2016. The effect of low
frequency ultrasound on the production and properties of nanocrystalline cellulose
suspensions and films. Ultrasonics Sonochemistry, 31, 473-480.

17
DE OLIVEIRA TAIPINA, M., FERRAREZI, M. M. F., YOSHIDA, I. V. P. & GONÇALVES,
M. C. 2013. Surface modification of cotton nanocrystals with a silane agent. Cellulose,
20, 217-226.
DONG, S., BORTNER, M. J. & ROMAN, M. 2016. Analysis of the sulfuric acid hydrolysis
of wood pulp for cellulose nanocrystal production: A central composite design study.
Industrial Crops and Products.
GIROUARD, N., SCHUENEMAN, G. T., SHOFNER, M. L. & MEREDITH, J. C. 2015.
Exploiting colloidal interfaces to increase dispersion, performance, and pot-life in
cellulose nanocrystal/waterborne epoxy composites. Polymer (United Kingdom), 68,
111-121.
GIROUARD, N. M., XU, S., SCHUENEMAN, G. T., SHOFNER, M. L. & MEREDITH, J. C.
2016. Site-Selective Modification of Cellulose Nanocrystals with Isophorone
Diisocyanate and Formation of Polyurethane-CNC Composites. ACS Applied Materials
and Interfaces, 8, 1458-1467.
GOETZ, L., MATHEW, A., OKSMAN, K., GATENHOLM, P. & RAGAUSKAS, A. J. 2009.
A novel nanocomposite film prepared from crosslinked cellulosic whiskers.
Carbohydrate Polymers, 75, 85-89.
GUO, J., GUO, X., WANG, S. & YIN, Y. 2016. Effects of ultrasonic treatment during acid
hydrolysis on the yield, particle size and structure of cellulose nanocrystals.
Carbohydrate Polymers, 135, 248-255.
HABIBI, Y., LUCIA, L. A. & ROJAS, O. J. 2010. Cellulose Nanocrystals: Chemistry, Self-
Assembly, and Applications. Chemical Reviews, 110, 3479-3500.
HEUX, L., CHAUVE, G. & BONINI, C. 2000. Nonflocculating and Chiral-Nematic Self-
ordering of Cellulose Microcrystals Suspensions in Nonpolar Solvents. Langmuir, 16,
8210-8212.
JUNIOR DE MENEZES, A., SIQUEIRA, G., CURVELO, A. A. S. & DUFRESNE, A. 2009.
Extrusion and characterization of functionalized cellulose whiskers reinforced
polyethylene nanocomposites. Polymer, 50, 4552-4563.
KARGARZADEH, H., SHELTAMI, R. M., AHMAD, I., ABDULLAH, I. & DUFRESNE, A.
2015a. Cellulose nanocrystal reinforced liquid natural rubber toughened unsaturated
polyester: Effects of filler content and surface treatment on its morphological, thermal,
mechanical, and viscoelastic properties. Polymer (United Kingdom), 71, 51-59.
KARGARZADEH, H., SHELTAMI, R. M., AHMAD, I., ABDULLAH, I. & DUFRESNE, A.
2015c. Cellulose nanocrystal: A promising toughening agent for unsaturated polyester
nanocomposite. Polymer (United Kingdom), 56, 346-357.
KHELIFA, F., HABIBI, Y., BONNAUD, L. & DUBOIS, P. 2016. Epoxy Monomers Cured
by High Cellulosic Nanocrystal Loading. ACS Applied Materials and Interfaces, 8,
10535-10544.
LI, B., XU, W., KRONLUND, D., MÄÄTTÄNEN, A., LIU, J., SMÅTT, J. H., PELTONEN,
J., WILLFÖR, S., MU, X. & XU, C. 2015. Cellulose nanocrystals prepared via formic
acid hydrolysis followed by TEMPO-mediated oxidation. Carbohydrate Polymers, 133,
605-612.
LIANG, J., HUANG, Y., ZHANG, L., WANG, Y., MA, Y., CUO, T. & CHEN, Y. 2009.
Molecular-level dispersion of graphene into poly(vinyl alcohol) and effective
reinforcement of their nanocomposites. Advanced Functional Materials, 19, 2297-2302.
MA, H., HU, N., WU, C., ZHU, Y., CAO, Y. & CHEN, Q. Q. 2016. Synthesis and research of
epoxy resin toughening agent. SpringerPlus, 5, 1-10.
MBHELE, Z. H., SALEMANE, M. G., VAN SITTERT, C. G. C. E., NEDELJKOVIĆ, J. M.,
DJOKOVIĆ, V. & LUYT, A. S. 2003. Fabrication and Characterization of Silver-
Polyvinyl Alcohol Nanocomposites. Chemistry of Materials, 15, 5019-5024.
18
MONTANARI, S., ROUMANI, M., HEUX, L. & VIGNON, M. R. 2005. Topochemistry of
carboxylated cellulose nanocrystals resulting from TEMPO-mediated oxidation.
Macromolecules, 38, 1665-1671.
MOON, R. J., MARTINI, A., NAIRN, J., SIMONSEN, J. & YOUNGBLOOD, J. 2011.
Cellulose nanomaterials review: structure, properties and nanocomposites. Chemical
Society Reviews, 40, 3941-3994.
OKSMAN, K., MATHEW, A. P., BONDESON, D. & KVIEN, I. 2006. Manufacturing process
of cellulose whiskers/polylactic acid nanocomposites. Composites Science and
Technology, 66, 2776-2784.
PÄÄKKÖ, M., ANKERFORS, M., KOSONEN, H., NYKÄNEN, A., AHOLA, S.,
ÖSTERBERG, M., RUOKOLAINEN, J., LAINE, J., LARSSON, P. T., IKKALA, O.
& LINDSTRÖM, T. 2007. Enzymatic Hydrolysis Combined with Mechanical Shearing
and High-Pressure Homogenization for Nanoscale Cellulose Fibrils and Strong Gels.
Biomacromolecules, 8, 1934-1941.
PASQUINI, D., TEIXEIRA, E. D. M., CURVELO, A. A. D. S., BELGACEM, M. N. &
DUFRESNE, A. 2010. Extraction of cellulose whiskers from cassava bagasse and their
applications as reinforcing agent in natural rubber. Industrial Crops and Products, 32,
486-490.
PETROVIĆ, Z. S., JAVNI, I., WADDON, A. & BÁNHEGYI, G. 2000. Structure and
properties of polyurethane-silica nanocomposites. Journal of Applied Polymer Science,
76, 133-151.
ROOHANI, M., HABIBI, Y., BELGACEM, N. M., EBRAHIM, G., KARIMI, A. N. &
DUFRESNE, A. 2008. Cellulose whiskers reinforced polyvinyl alcohol copolymers
nanocomposites. European Polymer Journal, 44, 2489-2498.
SIQUEIRA, G., BRAS, J. & DUFRESNE, A. 2010. New Process of Chemical Grafting of
Cellulose Nanoparticles with a Long Chain Isocyanate. Langmuir, 26, 402-411.
SUN, X., WU, Q., REN, S. & LEI, T. 2015. Comparison of highly transparent all-cellulose
nanopaper prepared using sulfuric acid and TEMPO-mediated oxidation methods.
Cellulose, 22, 1123-1133.
XU, S., GIROUARD, N., SCHUENEMAN, G., SHOFNER, M. L. & MEREDITH, J. C. 2013.
Mechanical and thermal properties of waterborne epoxy composites containing
cellulose nanocrystals. Polymer (United Kingdom), 54, 6589-6598.