ceng 407 · Çankaya university faculty of engineering computer engineering deparment ceng 407...
TRANSCRIPT
ÇANKAYA UNIVERSITY
FACULTY OF ENGINEERING
COMPUTER ENGINEERING DEPARMENT
CENG 407
SOFTWARE DESIGN DOCUMENT
(SDD)
Version 2
DETECTION OF OBSTRUCTIONS IN THE VESSELS IN
FUNDUS IMAGES
By
201311018 - AYKUT ER
201411045 - EGEBERK ÖZBERK
Fall, 2017-2018

2
Table of Contents
LIST OF FIGURES............................................................................................................................... 3
LIST OF TABLES................................................................................................................................. 3
1. INTRODUCTION ............................................................................................................................. 4
1.1 Purpose .......................................................................................................................................... 4
1.2 Scope ............................................................................................................................................. 4
1.3 Glossary ......................................................................................................................................... 4
1.4 Overview of the Document ........................................................................................................... 5
1.5 Motivation ..................................................................................................................................... 5
2. DESIGN OVERVIEW ......................................................................................................................5
2.1 Description of Problem .................................................................................................................. 5
2.2 Technologies Used ........................................................................................................................ 5
2.3 Architecture Design ...................................................................................................................... 6
2.3.1 Simulation Design Approach ................................................................................................. 6
2.3.1.1 Class Diagram..................................................................................................................6
2.3.2 Architecture Design of Obstruction Detection System .......................................................... 6
2.3.2.1 Options Menu ..................................................................................................................6
2.3.2.2 Find Congestion ...............................................................................................................7
2.3.3 Project Plan ............................................................................................................................ 8
2.4 System Operation ........................................................................................................................ 10
3. USE CASE REALIZATIONS ........................................................................................................11
3.1 Obstruction Detection System Project ......................................................................................... 11
3.1.1 Brief Description of Figure 3.1.1 ......................................................................................... 11
3.1.1.1 GUI Design ....................................................................................................................11
3.1.1.2 Image Processing ...........................................................................................................12
3.2 User Interface .............................................................................................................................. 12
3.2.1 Overview of User Interface .................................................................................................. 12
3.2.1.1 Main Menu Layout ........................................................................................................12
3.2.1.2 Upload Image Button.....................................................................................................13
3.2.1.3 Find Congestion Button .................................................................................................14
3.2.1.4 Customize Markings Button ..........................................................................................15
3.2.1.5 Save Results Button .......................................................................................................17
4. REFERENCES ................................................................................................................................19
3
List of Figures
Figure 2.3.1 Class Diagram of Obstruction Detection System ................................................................6
Figure 2.3.2 Gantt chart of Work Plan ....................................................................................................8
Figure 3.1.1 Project Components of Obstruction Detection System ......................................................11
Figure 3.2.1 Main Menu Layout System ................................................................................................13
Figure 3.2.2 Upload Image Button .........................................................................................................14
Figure 3.2.3 Find Congestion Button .....................................................................................................15
Figure 3.2.4 Change Shape Button .........................................................................................................16
Figure 3.2.5 Change Color Button .........................................................................................................17
Figure 3.2.6 Save Results Button ...........................................................................................................18
Figure 3.2.7 Results Folder ....................................................................................................................18
List of Tables
Table 1.3.1 Glossary of SDD ..................................................................................................................4
4
1. INTRODUCTION
This document provides detailed information about the design of the obstructions detection
system software. It will explain the working principles of the proposed method, and design of
the user interface of this method. This document prepared to guide to users.
1.1 Purpose
The purpose of this document is providing the details of the proposed project "Detection of
obstruction in the vessels in fundus images".
Fundus images (aka eye angiogram images) are the photographs that have been taken by
fundus cameras after injecting a chemical called fluorescein inside patient's veins to provide
better visuality by enhancing brightness of the vessels. Even with the latest technology is used
to take angiographic photographs, the amount of human error and lack of precision is
considerable while trying diagnosing the disease.
Our goal is to show the obstructions in vessels visible in the fundus images to the doctor who
uses the software better than he/she can see himself/herself. The software to be developed will
also be able to interpret the image to the user with the help of pre-prepared diagnostic
estimates gathered from doctors who are our project partners.
1.2 Scope
During the work hours, considering the frequency of patient arrivals is excessive, a doctor has
a very short period to commentate every single image brought in front of him/her. Main aim
here in this project is to reduce the time spent on diagnosis to almost an instant.
The main motivation for the ophthalmologist to use this software is to allow the software to
interpret the image much more quickly with immense accuracy and precision to reduce the
time spent on a single patient so that the doctor can deal with more patients in the same time.
Image processing algorithms and methods that software needs will be implemented by using
Matlab and the software itself will be developed using C#.
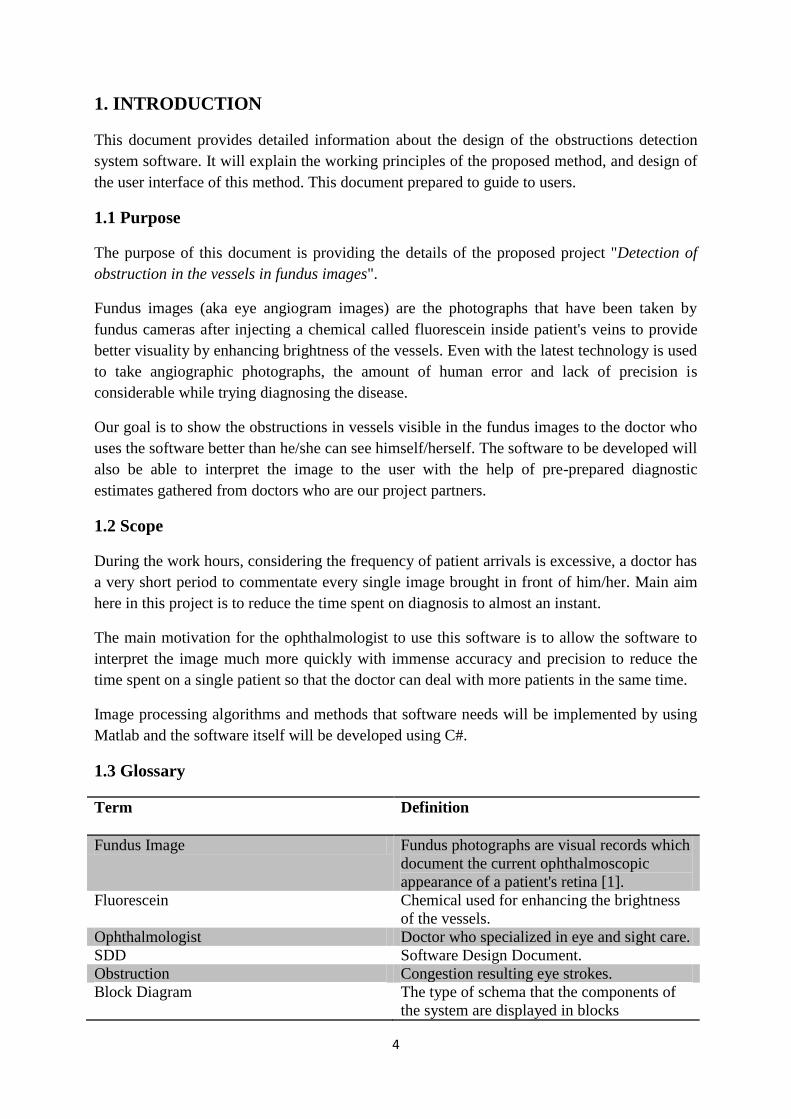
1.3 Glossary
Term Definition
Fundus Image Fundus photographs are visual records which
document the current ophthalmoscopic
appearance of a patient's retina [1].
Fluorescein Chemical used for enhancing the brightness
of the vessels.
Ophthalmologist Doctor who specialized in eye and sight care.
SDD Software Design Document.
Obstruction Congestion resulting eye strokes.
Block Diagram The type of schema that the components of
the system are displayed in blocks

5
Matlab Program to calculate mathematical
operations and functions. Table 1.3.1 Glossary of SDD
1.4 Overview of the Document
This section provides information about the contents of the rest of the document as follows:
Section 2 describes the problem and details the design of this project along with the class
architecture and shows the work load plan of the project. Section 3 displays and explains the
block diagram of the system, which is designed according to use cases in SRS document.
1.5 Motivation
We are a group of senior students in computer engineering department who are interested in
image processing. As a group, in this project we aimed to help the doctors in the treatment of
the patients. Since we do not have knowledge about medical science, we received help from
an ophthalmologist working in this area and we read the documents about this topic to find
out the diseases in the eye. In order to find out where the illnesses in the eye are, we have
been working on image processing and we have searched how to use Matlab to develop the
necessary processes for this topic.
2. DESIGN OVERVIEW
2.1 Description of Problem
The length of time that doctors are able to deal with a patient is significantly reduced in the
early hours of the day, especially when the hospital is crowded with waiting patients. Due to
lack of time for diagnosis, doctors often miss important details. The software mentioned in
this SDD shortens the time required to diagnose single patient and even show more accurate
results than a doctor by showing even slightest details about the possible disease.
2.2 Technologies Used
This software will communicate with Matlab to run its image processing functions. Software
itself will be developed with C# language. Software also requires a fundus camera to obtain
high quality retinal images for best performance and this device is determined to be a Zeiss
VISUCAM 500, capable of obtaining fundus images with resolution up to 5MP.
The target platform will be Microsoft Windows and development environment will be
Microsoft Visual Studio 2013. Functions and methods for processing fundus image will be
implemented on Matlab 2016.

6
2.3 Architecture Design
2.3.1 Simulation Design Approach
2.3.1.1 Class Diagram
Figure 2.3.1 Class Diagram of Obstruction Detection System
Figure 2.3.1 displays classes used in this system. GUI, master class here, is responsible of all
main operations. It also runs main image processing operations segmentation and congestion
detection. GUI class also generates a diagnosis for the processed image and creates a result
file to be saved. The ImageProcessing class includes Segmentation and Congestion which are
responsible for their individual image processing methods. Segmentation class runs first in
order to give the location map of the vessels to the Congestion class. Congestion then
processes the image with the vessel map and its congestion spot map to return processed
image to the ImageProcessing class. Both Segmentation and Congestion classes will run their
functions with the help of Matlab. Lastly, point class represents a single coordinate for the
congestion spots.
2.3.2 Architecture Design of Obstruction Detection System
2.3.2.1 Options Menu
Summary: This system is used by participant. Participant can upload a new image file to the
main screen, save the image and change marking shape and color.
Actor: User / doctor.

7
Precondition: Software system must be running.
Basic Sequence:
1. User can upload a new image file by selecting new image button.
2. User can save the image by selecting save button.
3. User can customize markings by selecting customize marking button.
4. User can customize color and shape of the marking by selecting shape or color button
individually under customize marking button.
Exception: Save the image without any operations performed.
Post Conditions: None.
Priority: Medium
2.3.2.2 Find Congestion
Summary: This system is used by participant. Participant wants to see congestion spots in the
fundus image.
Actor: User / doctor.
Precondition: Image must be uploaded.
Basic Sequence:
1. User pressed find congestions button.
2. System shows each congestion point.
3. Feedback mechanism starts running.
4. User can select each of the congestion point to give feedback.
Exception: No image has uploaded to perform operation.
Post Conditions: Feedback mechanism starts.
Priority: High.

8
2.3.3 Project Plan
Figure 2.3.2 Gantt chart of Work Plan
Above Gantt chart shown in figure 2.3.2 represents our whole development plan of the
project. Plan mostly includes testing since this project is medical software thus it needs to be
flawless. This is the main reason that why every implementation steps has its own testing
steps afterwards. Descriptions for the work packages and their assignees are presented in
below table. We decided that we can obtain best results if we distribute the workload evenly.
Some steps are made up of sub-steps and they can be distributed among us.
Work Package Brief Description Assignee(s)
Code Lookup and
Research
Searching new algorithms and techniques along with
their compatibility to the rest of our project. Aykut Er &
Egeberk Özberk
Review of Codes Deciding the best algorithm after testing gathered source
codes in terms of accuracy and sensitivity. Aykut Er &
Egeberk Özberk
Preparing Work Load
Plan
Arrangement of monthly and weekly distributions of
work packages. Updating SDD and website accordingly. Aykut Er &
Egeberk Özberk

9
Work Package Brief Description Assignee(s)
SRS and SDD
Finalization
Modification and updating of the SDD and SRS with
respect to the changing needs and renewed design.
Aykut Er &
Egeberk Özberk
Preparing Test Plan
Writing down test cases in the Test Design
Specifications document after designing and classifying
them.
Aykut Er &
Egeberk Özberk
Segmentation
Algorithm
Implementation
Creating and implementing segmentation function to
extract retinal vessel skeleton. Classifying vessels as
artery and vein and generating a vessel map accordingly.
Aykut Er &
Egeberk Özberk
Segmentation Accuracy
Testing and
Improvement
Accuracy and computational time wise improvements
until the main success rate of our algorithm reaches
desired value.
Aykut Er &
Egeberk Özberk
Testing and
Maintenance
Bug hunt for the segmentation function, testing the
extreme cases and implementing exception handlers. Aykut Er &
Egeberk Özberk
Software Design Front end designing and functionality planning according
to end user requirements. Aykut Er &
Egeberk Özberk
Implementing
Functions For Retinal
Emboli Detection
Creating an Emboli detection application which will be
combined with the segmentation function afterwards. Aykut Er &
Egeberk Özberk
Software
Implementation and
Testing
Connecting the software with the image processing
functions. Creating the software components and testing
their functionality.
Aykut Er &
Egeberk Özberk
Testing and Release
Testing the main functionalities of the segmentation and
emboli detection functions. Calculating the
success/failure ratio. Bug fixes and necessary
improvements over the software. Releasing the final
product.
Aykut Er &
Egeberk Özberk
Final Project Report
and Demo Video
Creating and uploading a video to the YouTube where
the software developed will be shown in a demo format. Aykut Er &
Egeberk Özberk
Project Presentation
Preparation
Presentation slide designing and scripting the
presentation flow. Aykut Er &
Egeberk Özberk

10
2.4 System Operation
This system achieves its purpose by performing two major image processing operations when
user clicks the find congestion button after uploading the patient’s fundus image. One
operation is the blood vessel segmentation where system extracts vessel locations and other
one is the congestion detection operation. Software performs these operations with using
Matlab functions.
Segmentation part simply returns a vector of coordinates of the vessels to the find congestion
function. After segmentation process is finished, congestion detection part creates another
vector which consists of congestion spot coordinates. Then congestion detection eliminates
false congestion spots by checking whether if congestion spot coordinate matches with the
coordinates of the vessels and mark the actual congestion spots with desired marking shape or
color.
After the completion of the image processing operations system will display the processed
image with all congestion markings and process results to the user. User is now allowed to
choose between either accept the given results or remove false markings with the feedback
mechanism. After user gives his/her final feedbacks user can now save the results.
After user clicks save results button, system creates a package with user specified name
(patient’s name expected) which consists of processed image file and a text file which
includes number of markings, save date and estimated diagnosis recommended by the
software.

11
3. USE CASE REALIZATIONS
3.1 Obstruction Detection System Project
Figure 3.1.1 Project Components of Obstruction Detection System
3.1.1 Brief Description of Figure 3.1.1
Components of the Obstruction Detection System Project are shown in the Figure 3.1.1. All
designed systems of the system are displayed in the block diagram in the figure. There are two
main components of the system which have their own sub-systems.
3.1.1.1 GUI Design
GUI design is responsible for interaction between the actors and the system. There is one sub-
system in this design which has Main Menu and Main Menu has its own subsystem called
Toolbar and Toolbar has three subsystems which are Customize Markings, Upload Image,
and Save Results which also has its own subsystem called Create Result Folder and also

12
finally Customize Markings has its own subsystems which are change shape and change
color.
Main Menu is a start page, participant can do various operations which are uploading a new
image file to be processed, change markings and save the results after the congestion
detection operation has done.
3.1.1.2 Image Processing
Image Processing is responsible for all sorts of main image operations and composed of two
main parts which are segmentation part and congestion detection part. Vessel Segmentation
has its own subsystem called Extract Vessel Location and Find Congestion has its own
subsystem called Match Congestion Locations with Vessel Locations.
Vessel Segmentation simply returns a vector of coordinates of the vessels which will be used
by congestion detection function. Find Congestion first finds all spots where possible
congestion occurs then uses the vector returned from Vessel Segmentation to eliminate all
congestion spots which are not inside of any blood vessel.
3.2 User Interface
In this section of the document, buttons and layout of the main menu is presented in below
figures.
3.2.1 Overview of User Interface
3.2.1.1 Main Menu Layout
The main menu is the interface that the user of the software will see when opening the
program. The user can access all the main operations through this user-friendly interface. The
upper part of the interface contains basic operations. The middle pane contains the image with
a button that will trigger the main action "Find Congestion". Finally, the bottom of the
interface is responsible for showing the results to the user.
Main menu layout is shown below.

13
Figure 3.2.1 Main Menu Layout of the System
3.2.1.2 Upload Image Button
The upload image button allows the user to upload the fundus image. This operation will not
be completed unless the image format is appropriate to the software.

14
Figure 3.2.2 Upload Image Button
3.2.1.3 Find Congestion Button
The find congestion button allows the user to initiate the main operation. The operation will
not start unless an image has already been loaded into the software. When the process is
complete, the software will display the processed image, and in this image, the congestions
will be marked like shown in below image, if any.

15
Figure 3.2.3 Find Congestion Button
3.2.1.4 Customize Markings Button
The general purpose of the button is to allow user to select the geometric shape and color of
the markings of the point of congestion when the obstruction is present in the vein.
3.2.1.4.1 Change Shape Button
The purpose of the button is to ask the user what geometrical shape he/she wants software to
show the obstruction. Shapes include triangle, circle and square.

16
Figure 3.2.4 Change Shape Button
3.2.1.4.2 Change Color Button
The purpose of the button is to ask the user what color for the shape he/she wants software to
show the obstruction. Any RGB supported color will be selectable.

17
Figure 3.2.5 Change Color Button
3.2.1.5 Save Results Button
The Save Results button allows user to save the results in a desired location and with a desired
name after the image is processed.

18
Figure 3.2.6 Save Results Button
When the save process is performed, the software creates a folder including a text file in
which the diagnostic and results are stored, and the processed image.
Figure 3.2.7 Results Folder

19
4. REFERENCES
1. Yang-Williams, K. (2002). Ophthalmic Photography: Retinal Photography,
Angiography, and Electronic Imaging, 2nd ed. Optometry and Vision Science, 79(8),
478. Doi: 10.1097/00006324-200208000-00008.
2. B. Sujithkumar, and V. Singh, (2012) “Automatic Detection of Diabetic Retinopathy
in Non-dilated RGB Retinal Fundus Images”, International Journal of Computer
Applications, Vol. 47, No. 19, pp. 26-32.
3. F. Zana, J. Klein, A multimodal registration algorithm of eye fundus images using
vessels detection and Hough transform, IEEE Trans. Med. Imaging 18 (5) (1999) 419–
429.
4. S. Chaudhuri, S. Chatterjee, N. Katz, M. Nelson, M. Goldbaum, Detection of blood
vessels in retinal images using two-dimensional matched filters, IEEE Trans. Med.
Imaging 8 (3) (1989) 263–269.
5. R. Nekovei, Y. Sun, Back-propagation network and its configuration for blood vessel
detection in angiograms, IEEE Trans. Neural Networks 6 (1) (1995) 64–72.
6. Júnior, S. B., & Welfer, D. (2013). Automatic Detection of Microaneurysms and
Hemorrhages in Color Eye Fundus Images. International Journal of Computer Science
and Information Technology, 5(5), 21-37. doi:10.5121/ijcsit.2013.5502.
7. T. A. Ciulla, A. G. Amador, and B. Zinman, (2003) “Diabetic Retinopathy and
Diabetic Macular Edema: Pathophysiology, screening, and novel therapies”, Diabetes
Care, Vol. 26, No. 9, pp. 26532664.
8. Y. Hatanaka, T. Nakagawa, Y. Hayashi, T. Hara, and H. Fujita, (2008) “Improvement
of Automated Detection Method of Hemorrhages in Fundus Images”, Proceedings:
30th Annual International IEEE EMBS Conference, pp. 5429 - 5432.
9. T. Kauppi, V. Kalesnykiene, J. K. Kamarainen, L. Lensu, I. Sorri, A. Raninen, R.
Voutilainen , H. Uusitalo, H. Kalviainen, and J. Pietila, (2007), “DIARETDB1:
diabetic retinopathy database and evaluation protocol,” Technical report, Faculty of
Medicine, University of Kuopio, Finland.