center for interdisciplinary economics discussion paper 2/2018 · bor-dignon, cerniglia, and...
TRANSCRIPT

Center for Interdisciplinary Economics Discussion Paper
2/2018
Fiscal Disparity, Institutions and Asymmetric Yardstick Competition
Alfa Farah
Center for Interdisciplinary Economics Discussion Paper Series

Center for Interdisciplinary Economics Discussion Paper
2/2018
April 2018
ISSN 2191-4419
Fiscal Disparity, Institutions and Asymmetric Yardstick Competition
Alfa Farah
Abstract Fiscal disparity leads to a yardstick bias, in that incumbents in fiscally-rich jurisdictions can provide more public goods, extract more rents and yet have a higher probability to be reelected. This study further emphasizes disparity among jurisdictions, not only in terms of fiscal re-sources but also of costs of rent appropriation. In a setting in which jurisdictions with a higher fiscal capacity have lower costs of rent appropriation whilst those with a lower fiscal capacity have higher costs of rent appropriation, the difference in costs of rent appropriation might mod-erate the bias caused by the fiscal disparity. JEL-Codes: H71, H72, H77, D72

All CIW Discussion Papers can be found here:
https://www.wiwi.uni-muenster.de/ciw/de/forschung/ciw-diskussionspapiere
University of Münster CIW – Center for Interdisciplinary Economics
Scharnhorststrasse 100 D-48151 Münster
phone: +49-251/83-25329 (Office)
e-Mail: [email protected] Internet: www.wiwi.uni-muenster.de/ciw

Fiscal disparity, institutions
and asymmetric yardstick competition
Alfa Farah
University of Munster
Center for Interdisciplinary Economics
Very Preliminary. Do not quote.
Abstract
Fiscal disparity leads to a yardstick bias, in that incumbents in fiscally-
rich jurisdictions can provide more public goods, extract more rents and
yet have a higher probability to be reelected. This study further emphasizes
disparity among jurisdictions, not only in terms of fiscal resources but also of
costs of rent appropriation. In a setting in which jurisdictions with a higher
fiscal capacity have lower costs of rent appropriation whilst those with a
lower fiscal capacity have higher costs of rent appropriation, the difference
in costs of rent appropriation might moderate the bias caused by the fiscal
disparity.
Keywords: accountability, rent, fiscal capacity, institutions, yardstick com-
petition,
JEL classification: H71, H72, H77, D72
1 Introduction
Decentralization is argued to improve accountability of government. This argu-
ment necessitates that decentralization should encompass administrative, fiscal
and political spectrum, in which the government of decentralized jurisdiction has
authorities to manage and allocate their budget, is elected by and, thus, account-
able to its own electorates. Here, accountability refers to “the degree to which
institutions allow the government to divert rents” (Lockwood 2005). If the exist-
ing institutions allow for a higher rent appropriation, then accountability is lower,
vice versa.
One mechanism through which decentralization improves accountability is via an
increased competition among jurisdictions. In particular, the existence of decen-
tralized jurisdictions brings about yardstick competition (Besley and Case 1995;
Bordignon, Cerniglia, and Revelli 2004). Asymmetric information between incum-
bent government and voters hinders voters from assessing the true performance
of their government. In this situation, voters can take advantage of information
spillovers from the neighboring jurisdictions. Voters of comparable jurisdictions
facing the same exogenous shock might perform yardstick voting, that is they use
the performance of incumbents in neighboring jurisdictions as a yardstick to re-
elect or replace their incumbent. This eventually induces yardstick competition,
in that incumbents seeking reelection will compare themselves to incumbents in
other jurisdictions. This in turn creates an incentive for the incumbent to limit
rent diversion. In this respect, yardstick competition increases the costs of rent
appropriation and, thus, restricts the predatory behavior of government.
In the context of decentralization in many developing countries, yardstick compe-
titions can be much more of significance for the overall success of decentralization
agenda. This is because major arguments for decentralization such as preference
matching (Oates 1972), exit options and tax competition (Tiebout 1956) are less
likely in place.
Empirical evidence has also supported the existence of yardstick competition.
The empirical investigations generally attempted to show that the reelection out-
1
comes are correlated with fiscal variables of the neighboring jurisdictions. Bor-
dignon, Cerniglia, and Revelli (2003), for example, observed a positive spatial
auto-correlation in local tax rates only in Italian jurisdictions whose mayors run for
reelection and are not backed by large majorities. Along the same line, Allers and
Elhorst (2005) found that Dutch municipalities governed by small majorities tax-
mimic more than those governed by large majorities. Bosch and Sole-Olle (2007)
investigated Spanish municipalities and their findings suggested that a property
tax increase, both at the municipal and neighborhood level, affects the incumbent’s
vote share.
For the case of developing countries, Martinez-Vazquez, Del Granado, and Simatu-
pang (2008) found evidence of yardstick competition among Indonesian districts,
that is incumbent’s popularity is negatively correlated with its own tax revenue
while positively correlated with that of neighboring districts. Modeling a yardstick
from the top and testing using China data set, Caldeira (2012) also confirmed a
strategic complementarity of public goods.
While the empirical evidence shows the existence of yardstick competition, it does
not necessarily confirm its welfare consequences. In fact, Allers (2012) shows
that yardstick competition might not adequately curb government’s predatory
behavior and, thus, might not improve citizens’ welfare. The disciplining effect
of yardstick competition becomes ineffective if jurisdictions are not identical. In
this situation, yardstick mechanism works in favor of incumbents in more fiscally-
rich jurisdictions, leading to a yardstick bias. Incumbent in those jurisdictions is
able to extract more rent and still considered as a good performer and reelected
accordingly. By contrast, incumbent in fiscally-poor jurisdictions might behave
responsibly and yet is seen as an under-performer.
As one would expect, jurisdictions vary greatly. In terms of fiscal resources, for
example, some jurisdictions might have a larger tax base or a higher revenue-
rising capacity. Since jurisdictions are granted some authorities to manage their
own affairs, decentralization might likely exacerbate fiscal disparity. In this regard,
fiscal equalization scheme plays a huge role. However, fiscal equalization design is
rarely ideal and its implementation is frequently so complicated as to distort local
2
decision makings (Kotsogiannis and Schwager 2008) and, thus, counterproductive
with the notion of improving accountability.
In addition to fiscal disparity, institutions also differ among jurisdictions. For
instance, using education as an indicator of institutions, voters in one jurisdiction
might be more literate and well informed. Empirical research has shown that
political involvement is positively related to income and education. Educated
people are more likely to be politically literate and stay politically involved. As a
result, they are more willing to pay attention to corruptions and government miss-
conducts and, thus, making rent appropriation more costly (Glaeser and Saks
2006). This implies that differences in institutions bring about different limit to
government behavior.
A brief example might be useful to clarify this notion. We consider the imple-
mentation of decentralization policies in Indonesia in 2001. The decentralization
policies were adopted immediately following the fall of centralist regime. One
of the motives for this abrupt reform is to respond to threats of secession from
resource-abundant provinces, such as East Kalimantan, Riau, Papua and Aceh,
which demanded a larger control over their own resources. Consequently, the au-
tonomous districts in these provinces are relatively fiscally-rich in the sense that
their per capita revenue are among the highest in the country. Nevertheless, hav-
ing been long neglected by the centralist regime, at the starting of decentralization
quality of institutions were relatively worse. Furthermore, albeit fiscally rich, the
revenue is mostly spent to finance administrative expenditure, the type of expen-
diture that is prone to corruption and miss-use. Hence, fifteen years after the
implementation of decentralization policies, institutions in these districts remain
relatively less developed. Looking at selected development indicators, poverty rate
is among the highest and education indicators are among the lowest in the country,
indicating active citizen participation is less likely, making rent appropriation less
costly.
This study enriches the existing literature on yardstick competition by emphasiz-
ing disparities among jurisdictions, not only in terms of fiscal resources but also
institutions, and demonstrates that yardstick bias might be moderated in a specific
3

setting. Borrowing from Indonesia’s decentralization experience and defining fiscal
capacity as merely potential resources that can be taxed bring about a distinctive
mixture of fiscal capacity-costs of rent appropriation, in which jurisdictions having
a higher fiscal capacity tend to exhibit lower costs of rent appropriation whilst
those having a lower fiscal capacity tend to exhibit higher costs of rent appropri-
ation. Allowing for yardstick competition in this setup, the difference in costs of
rent appropriation might moderate the bias caused by fiscal disparity. So long as
fiscal disparity higher than costs of rent appropriation disparity, the costliness of
rent appropriation in fiscally-poor jurisdiction restricts the predatory behavior of
incumbent in the fiscally-rich jurisdiction, in that he must increase his supply of
public goods and give up some part of his rent and yet has a lower probability
of reelection. When fiscal disparity lower than costs of rent appropriation dis-
parity, the costliness of rent appropriation in the neighboring jurisdiction hinders
incumbent in the relatively fiscally-rich jurisdiction to even exploit his fiscal ad-
vantages. In order to appropriate more rent, he must decrease public goods and
thus his probability of reelection is lower than his counterpart in the fiscally-poor
district.
The remainder of the paper is organized as follows. In order to provide a back-
ground for our theoretical model, the subsequent section details institutional con-
text of decentralization in Indonesia. The third section describes the model setup.
The fourth section presents the equilibrium of asymmetric yardstick competition.
The fifth section tailors the model presented in section 3 with the case of asym-
metric costs of rent appropriation and presents the main results of the paper. The
final section summarizes the main findings.
2 Institutional context
The fall of Soeharto’s regime not only marked Indonesia’s transition from autoc-
racy to democracy, but also restructured central-regions relations (Aspinall and
Fealy 2003). During the regime, regions merely served the interests of the central
government, in that most policies were mandated from the top. This extreme
centralization created a severe regional imbalances and gave rise to regional dis-
4
BantenWest Jawa
Central JawaEast Jawa
DI YogyakartaLampung
West Nusa TenggaraSouth Sulawesi
BaliEast Nusa Tenggara
North SumateraSouth Sumatera
West KalimantanJambi
West SulawesiSouth Kalimantan
Central SulawesiGorontalo
Kepulauan Bangka BelitungBengkulu
West SumateraRiau
Southeast SulawesiNorth Sulawesi
AcehMaluku
Central KalimantanNorth Maluku
East KalimantanKepulauan Riau
PapuaWest Papua
North Kalimantan
0 5 10Per capita revenue
(Million Rupiah, Average districts, 2001 - 2014)
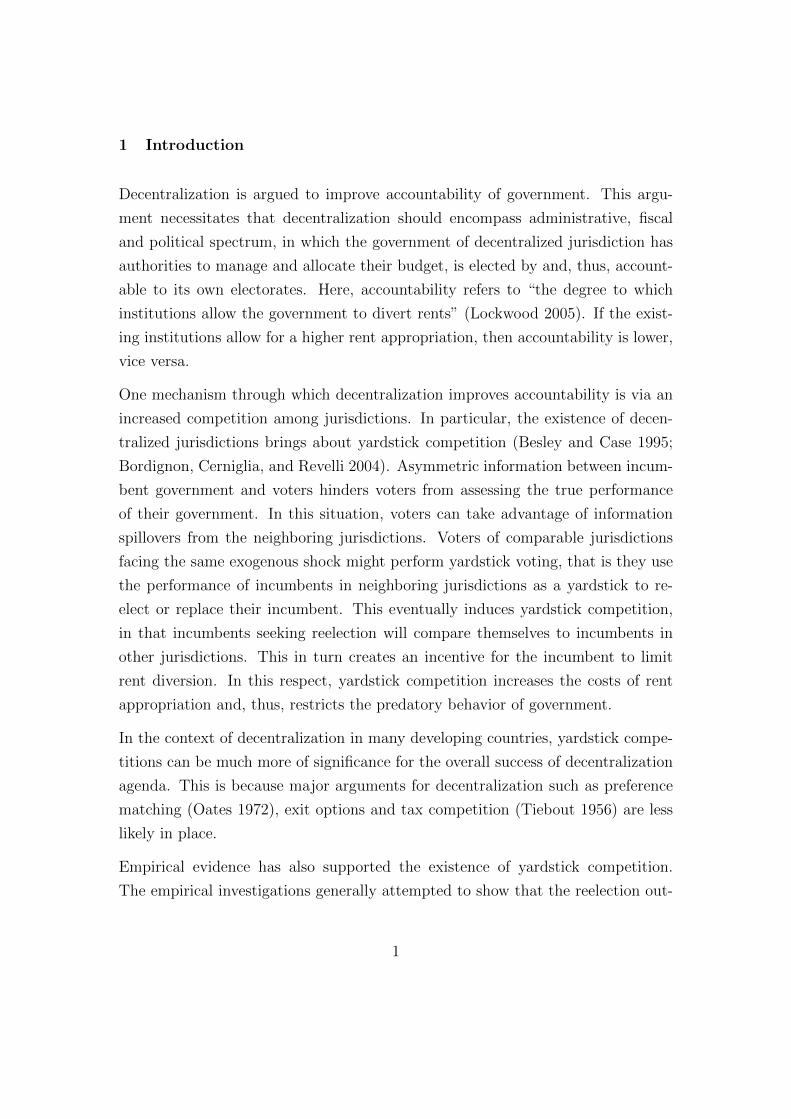
Figure 1: Average district revenue per capita (Source: the Directorate General of FiscalBalance, Ministry of Internal Affairs, Author’s calculation)
contents. The call for democracy has prompted regions to demand larger control
over their own affairs, leading to threats of secession from the resource-abundant
provinces. In the middle of crisis, decentralization was seen as the best means to
disperse power and avoid disintegration.
As a consequence, following the adoption of decentralization, districts located in
resource-abundant provinces are relatively fiscally rich. Figure 1 shows that dis-
tricts in Province North Kalimantan, West Papua, Papua, Kepulauan Riau and
East Kalimantan, have higher per capita revenue in average. Nevertheless, almost
50 percent of the revenue is spent for personnel expenditure and only 25 percent is
allocated for investment. As displayed in Figure 2, revenue is negatively related to
investment spending while positively related to personnel spending. This implies
5

0.2
0.4
0.6
0.8
Total revenue
Inve
stm
ent
spen
din
g(p
erce
nt
ofex
pen
dit
ure
)
(a)
0.0
0.2
0.4
0.6
12 13 14 15 16Total revenue
Per
son
nel
spen
din
g(p
erce
nt
ofex
pen
dit
ure
)
(b)
Figure 2: Total revenue, Investment spending and personnel spending, average 2001 -2014 (Source: the Directorate General of Fiscal Balance, Ministry of InternalAffairs, Author’s calculation)
that the population in those fiscally-rich districts might not necessarily benefit
from this fiscal advantage because the revenue is not largely allocated to directly
improve public services. In addition, the large share of personnel spending can be
prone to corruption and other type of budget miss-use. As a result, infrastructures
and development outcomes in those districts are only slowly improving.
Figure 3 illustrates the relation between revenue per capita, poverty rate and
secondary school enrollment rate. It shows that revenue per capita is positively
related to poverty rate while negatively related to secondary school enrollment.
This means that the fiscally-rich districts perform worse in alleviating poverty and
improving education attainment.
As suggested by Glaeser and Saks (2006), education facilitates people to learn and
understand politics more easily. Education also encourages people to stay politi-
cally involved. Accordingly, educated people are more willing to pay attention to
corruptions and government miss-conducts and, thus, making rent extraction more
costly. Therefore, jurisdictions with more prosperous and educated populations are
expected to be less corrupt.
6

0
10
20
30
40
13 14 15 16 17 18Per capita revenue (log)
Pov
erty
rate
(a)
20
40
60
80
13 14 15 16 17 18Per capita revenue
Sec
ond
ary
sch
ool
enro
llm
ent
(b)
Figure 3: Per capita revenue, poverty rate and school enrollment (Source: the Direc-torate General of Fiscal Balance, Ministry of Internal Affairs, Statistics In-donesia (BPS), World Bank, Author’s illustration)
We collected data from Indonesian Corruption Eradication Commission (KPK) to
see a general pattern of citizen participation in fighting against corruption. The
commission has established a whistle-blower-system to allow citizen to report any
indication of corruption. In its 2012 Annual report, KPK recorded that people in
Jawa Island and Sumatera Island are the most active in reporting corruption cases
during the year 2004 to 2012. Table 1 particularly informs five provinces with
the highest number of citizens reporting corruption, four of which are located in
Jawa Island. Districts in both islands, albeit having moderate revenue per capita
in average, have relatively more developed institutions and better development
outcomes.
The annual report also documented the number of corruption cases according to
province. Table 2 summarizes five provinces with the highest number of corruption
cases during the period of 2004 to 2012. Similar to the citizens’ report, corruption
cases investigated by the KPK are mostly located in Java Island and Sumatera
Island.
The fact that corrupt acts mostly occur in Jawa Island and Sumatera Island does
not necessarily mean that districts in both islands are more corrupt than those in
7

Table 1: Provinces with highest number of citizensreporting corruption case (2004 - 2012)
Province Number of reports
DKI Jakarta 10738East Jawa 5655North Sumatera 5207West Jawa 4725Central Jawa 3814
Source: KPK (2012)
Table 2: Provinces with the highest numberof corruption cases (2004 - 2012)
Province Number of cases
West Jawa 24Riau & Kepulauan Riau 23DKI Jakarta 17Central Jawa 13East Kalimantan 11
Source: KPK (2012)
other islands. Referring to the data on citizen reporting corruption case, provinces
with the highest number of corruption cases tend to have the highest number
of citizens actively participating in curbing corrupt acts. This might suggest that
the actively involved population increases the probability of corrupt behavior being
caught, making rent appropriation more costly.
The Indonesian experience presented in this section allows us to derive a kind of
relation between fiscal capacity and the costs of rent appropriation. Jurisdictions
with a higher fiscal capacity tend to have relatively lower costs of rent appropriation
and, conversely, jurisdictions with a lower fiscal capacity tend to have higher costs
of rent appropriation.
8

3 The Model
Consider two identical jurisdictions i ∈ {1, 2}, in which the population of each
jurisdiction is normalized to unity. They differ only in their fiscal capacity, which
is defined simply as the available resources that can be taxed. We will later relax
this assumption by introducing differences in the costs of rent appropriation. Both
jurisdictions face common exogenous shocks. Furthermore, there are no spillovers
between two jurisdictions except for informational spillovers.
Voters in both jurisdictions are identical and have no different taste of public
good. They elect their government via local democratic elections. The informa-
tional spillovers allow voters in each jurisdiction to compare performance of their
incumbent and vote accordingly. Thus, voters do yardstick voting. The premise
is that yardstick voting eventually leads to yardstick competition.
The elected governments (hereafter refer to as he for jurisdiction 1 and she for
jurisdiction 2) collect taxes to provide a certain level of public goods. Nevertheless,
the elected governments care for only rent and reelection. For simplicity, there is
no minimum required level of public goods and voters cannot anticipate the level of
public goods. Thus, if possible, government will appropriate all of the tax revenues
and leave nothing for public goods provision.
The tax rate is exogenously determined, by the central government for instance,
and equal over jurisdictions. This is not uncommon, particularly in developing
countries, in which the central government places explicit limits on the taxing
authority of local governments. This also demonstrates that tax competition is
often absent in those countries.
There is a term limit for governments, stipulating the incumbents are allowed to
remain in the office for a maximum of two periods. In the first period of the
game, both incumbents are in their first term and face threat of being replaced.
Furthermore, the incumbents cannot be ejected in the middle of the term. This
means the government cannot be contractually directly punished; what voters
can do at best is replacing the government via democratic elections. Therefore,
incumbents provide public goods in the first period in order to increase their
9
reelection probability.
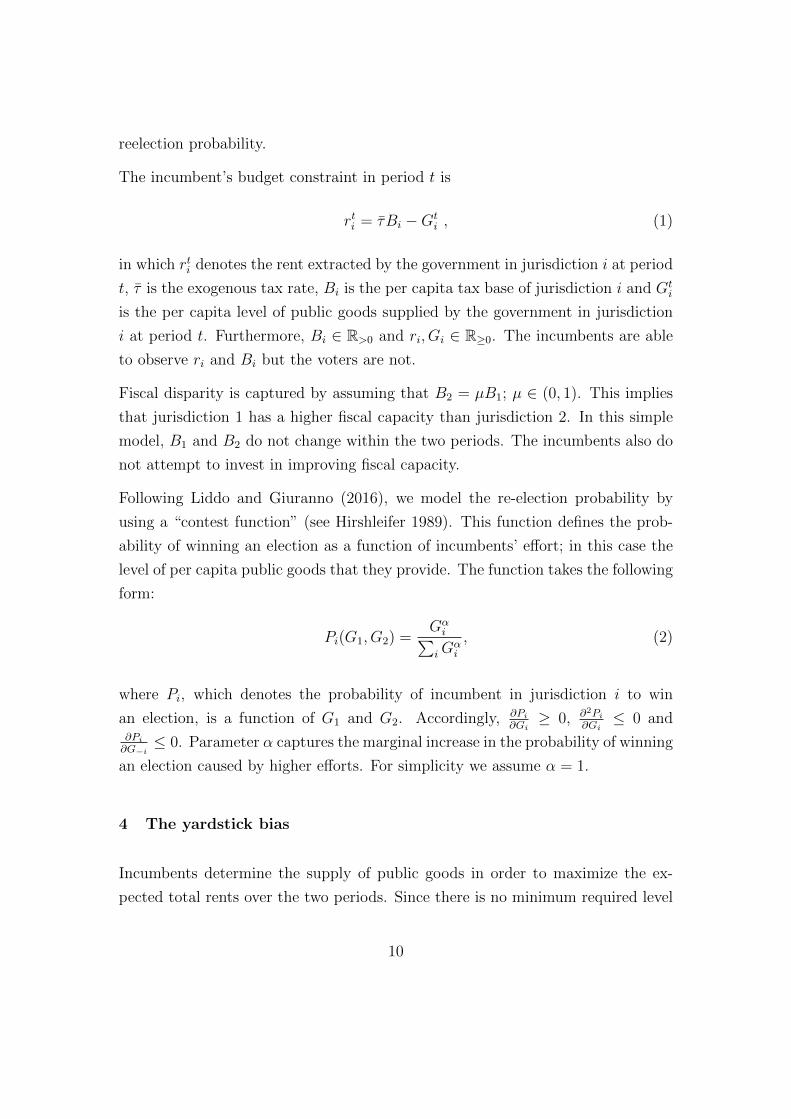
The incumbent’s budget constraint in period t is
rti = τBi −Gti , (1)
in which rti denotes the rent extracted by the government in jurisdiction i at period
t, τ is the exogenous tax rate, Bi is the per capita tax base of jurisdiction i and Gti
is the per capita level of public goods supplied by the government in jurisdiction
i at period t. Furthermore, Bi ∈ R>0 and ri, Gi ∈ R≥0. The incumbents are able
to observe ri and Bi but the voters are not.
Fiscal disparity is captured by assuming that B2 = µB1; µ ∈ (0, 1). This implies
that jurisdiction 1 has a higher fiscal capacity than jurisdiction 2. In this simple
model, B1 and B2 do not change within the two periods. The incumbents also do
not attempt to invest in improving fiscal capacity.
Following Liddo and Giuranno (2016), we model the re-election probability by
using a “contest function” (see Hirshleifer 1989). This function defines the prob-
ability of winning an election as a function of incumbents’ effort; in this case the
level of per capita public goods that they provide. The function takes the following
form:
Pi(G1, G2) =Gαi∑
iGαi
, (2)
where Pi, which denotes the probability of incumbent in jurisdiction i to win
an election, is a function of G1 and G2. Accordingly, ∂Pi
∂Gi≥ 0, ∂2Pi
∂Gi≤ 0 and
∂Pi
∂G−i≤ 0. Parameter α captures the marginal increase in the probability of winning
an election caused by higher efforts. For simplicity we assume α = 1.
4 The yardstick bias
Incumbents determine the supply of public goods in order to maximize the ex-
pected total rents over the two periods. Since there is no minimum required level
10
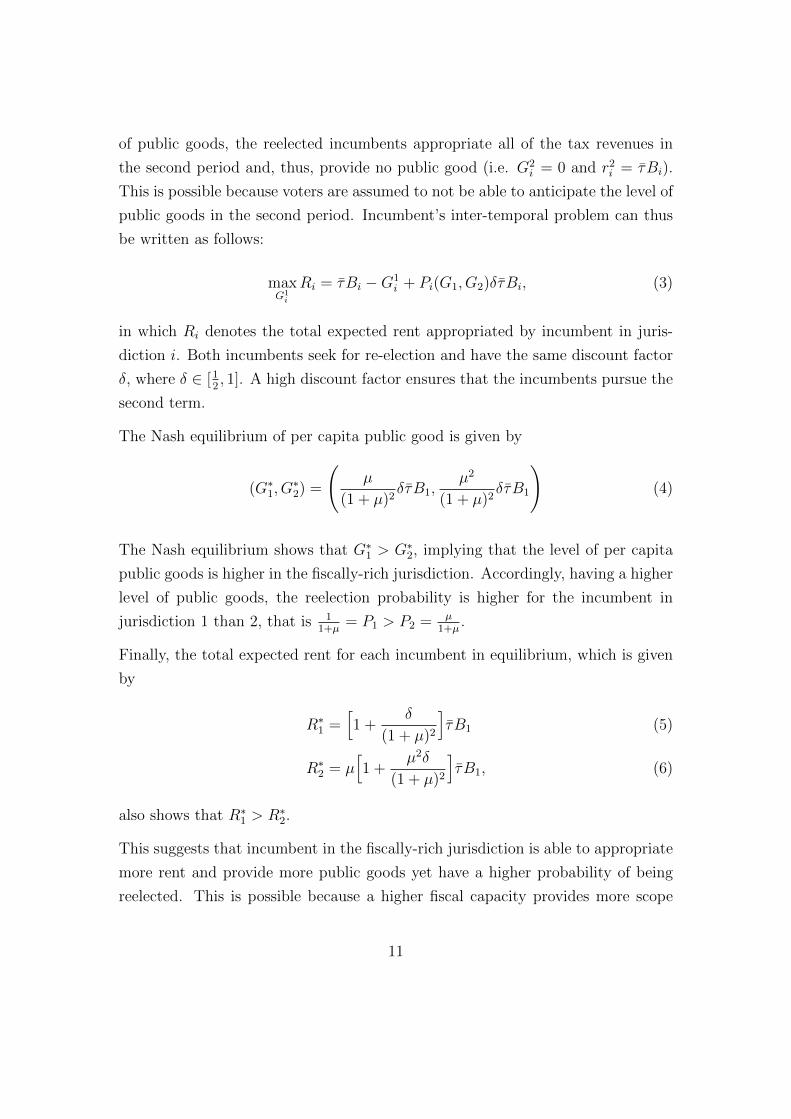
of public goods, the reelected incumbents appropriate all of the tax revenues in
the second period and, thus, provide no public good (i.e. G2i = 0 and r2i = τBi).
This is possible because voters are assumed to not be able to anticipate the level of
public goods in the second period. Incumbent’s inter-temporal problem can thus
be written as follows:
maxG1
i
Ri = τBi −G1i + Pi(G1, G2)δτBi, (3)
in which Ri denotes the total expected rent appropriated by incumbent in juris-
diction i. Both incumbents seek for re-election and have the same discount factor
δ, where δ ∈ [12, 1]. A high discount factor ensures that the incumbents pursue the
second term.
The Nash equilibrium of per capita public good is given by
(G∗1, G
∗2) =
(µ
(1 + µ)2δτB1,
µ2
(1 + µ)2δτB1
)(4)
The Nash equilibrium shows that G∗1 > G∗
2, implying that the level of per capita
public goods is higher in the fiscally-rich jurisdiction. Accordingly, having a higher
level of public goods, the reelection probability is higher for the incumbent in
jurisdiction 1 than 2, that is 11+µ
= P1 > P2 = µ1+µ
.
Finally, the total expected rent for each incumbent in equilibrium, which is given
by
R∗1 =
[1 +
δ
(1 + µ)2
]τB1 (5)
R∗2 = µ
[1 +
µ2δ
(1 + µ)2
]τB1, (6)
also shows that R∗1 > R∗
2.
This suggests that incumbent in the fiscally-rich jurisdiction is able to appropriate
more rent and provide more public goods yet have a higher probability of being
reelected. This is possible because a higher fiscal capacity provides more scope
11

for him to provide slightly higher per capita public goods and, at the same time,
appropriate a higher rent. With yardstick voting in place, he is seen as more
responsible than his counterpart in fiscally-poor jurisdction and, thus, is more
likely to be reelected.
The first derivative with regard to µ shows that∂G∗
1
∂µ> 0,
∂P ∗1
∂µ< 0, and
∂R∗1
∂µ< 0,
meaning a higher fiscal disparity lowers per capita public goods provided by incum-
bent in jurisdiction 1 but increases his rent and reelection probability. In contrast,∂G∗
2
∂µ> 0,
∂P ∗2
∂µ> 0 and
∂R∗2
∂µ> 0, implying a higher fiscal disparity lowers per capita
public goods, the reelection probability, and the rent extracted in jurisdiction 2.
This suggests fiscal disparity causes yardstick competition to be bias toward the
more fiscally-rich jurisdictions, making it less effective to discipline incumbent in
those jurisdictions (see Allers (2012)).
In order to permit an unbiased relative performance assessment, Allers (2012) fur-
ther suggests the necessity for fiscal equalization such as through a system of inter-
governmental transfers. The crux of the matter is that fiscal equalization design is
rarely ideal and its implementation is frequently so complicated as to distort local
decision makings (Kotsogiannis and Schwager 2008) and, thus, counterproductive
with the notion of improving accountability.
The following section illustrates a possibility in which the costliness of rent ap-
propriation might hinder incumbent in the fiscally-rich jurisdiction to exploit his
fiscal advantage.
5 Equilibrium with asymmetric costs of rent appropriation
As we illustrate earlier, jurisdictions differ not only in terms of fiscal capacity but
also in terms of institutions. Differences in institutions in turn create a difference
limit to government behavior, leading to some jurisdictions having higher costs of
rent appropriation than others. We introduce exogenous costs of rent appropriation
in the government budget constraint
rti = γti(τBi − Gti ) , (7)
12

where γi ∈ (0, 1) indicates costs associated with rent appropriation (Persson and
Tabellini 2000, p. 70). The higher is γi, the lower are costs of rent appropriation,
the easier is the incumbent to appropriate rent. Conversely, the lower is γi, the
higher are costs of rent appropriation, the harder is rent appropriation. We might
also interpret γti more clearly by considering (1 − γti)(τBi − Gti ) as a part of rent
that the incumbents should lose to hide their rent seeking activities. How much
cost they should bear depends on many factors; among other things, citizen active
involvement in politics.
We modify the notation of per capita public goods, total expected rent and proba-
bility of reelection to distinguish the equilibrium under asymmetric fiscal capacity
and the equilibrium under both asymmetric fiscal disparity and asymmetric costs
of rent appropriation, in which the calligraphic notation Gi, Ri, and Pi denote
the latter. Nonetheless, notations are defined as in section 4.
We retain the assumption that B1 = µB2; µ ∈ (0, 1). In addition, we introduce
a difference in the costs of rent appropriation into the model. Referring to an
example provided in section 2, in which revenue per capita is negatively related to
citizens’ active involvement in reporting corruption and also negatively related to
the number of corruption found, we assume γ2 = σγ1; σ ∈ (0, 1)1. If σ ∈ (0, 1),
then γ1 > γ2. This implies that the fiscally-rich jurisdiction has lower costs of
rent appropriation and, thus, incumbent in jurisdiction 1 puts less efforts to hide
his rent seeking activities than his counterpart in jurisdiction 2. Furthermore, the
lower σ is, the higher is the difference in costs of rent appropriation.
In this simple model, we retain the assumption that the incumbents cannot be
discharged in the middle of the term and there is no minimum required level of
public good. Because the incumbents cannot be discharged in the middle of the
term, they do not need to take any action to conceal their rent-seeking behavior
at period 2. Therefore, we assume that there are no costs of rent appropriation in
1. We might also consider a less attractive case in which σ ∈ (1, 1γ1
), implying that jurisdiction1, the fiscally-rich jurisdiction has higher costs of rent appropriation. In this setting, incumbentin 1 will necessarily curb his predatory behavior due to the costliness of rent appropriation inhis own jurisdiction.
13
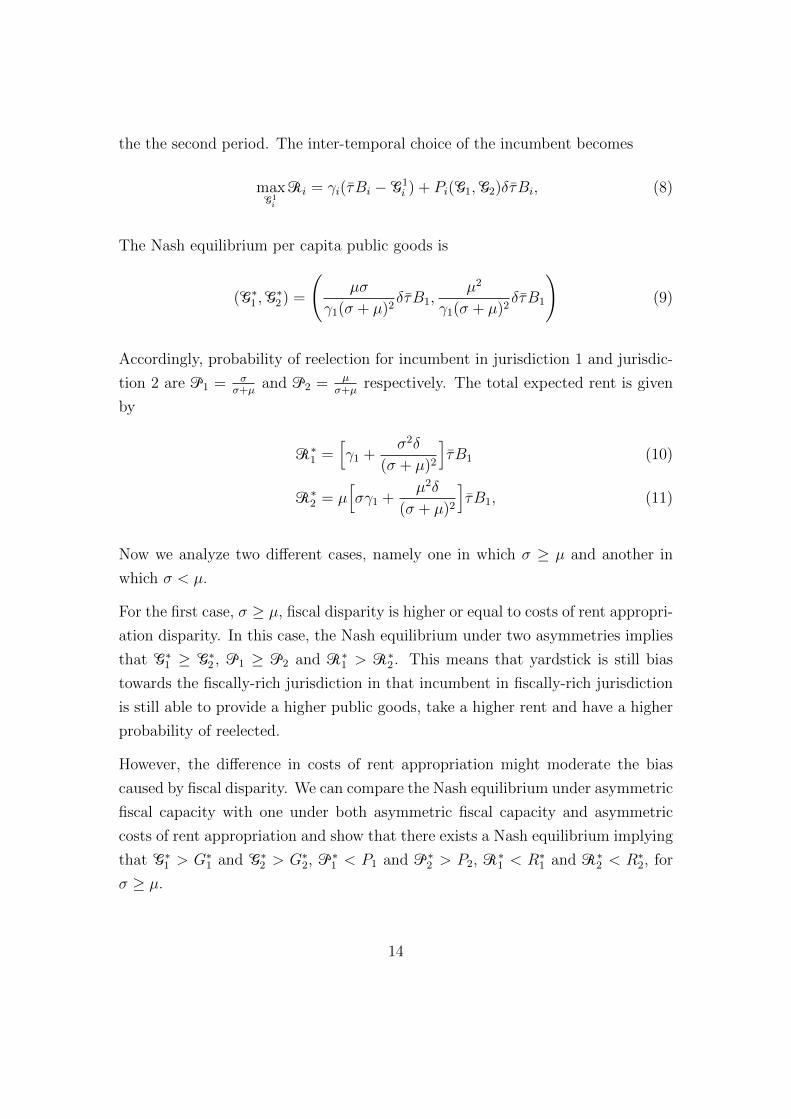
the the second period. The inter-temporal choice of the incumbent becomes
maxG1i
Ri = γi(τBi − G1i ) + Pi(G1, G2)δτBi, (8)
The Nash equilibrium per capita public goods is
(G∗1 , G
∗2) =
(µσ
γ1(σ + µ)2δτB1,
µ2
γ1(σ + µ)2δτB1
)(9)
Accordingly, probability of reelection for incumbent in jurisdiction 1 and jurisdic-
tion 2 are P1 = σσ+µ
and P2 = µσ+µ
respectively. The total expected rent is given
by
R∗1 =
[γ1 +
σ2δ
(σ + µ)2
]τB1 (10)
R∗2 = µ
[σγ1 +
µ2δ
(σ + µ)2
]τB1, (11)
Now we analyze two different cases, namely one in which σ ≥ µ and another in
which σ < µ.
For the first case, σ ≥ µ, fiscal disparity is higher or equal to costs of rent appropri-
ation disparity. In this case, the Nash equilibrium under two asymmetries implies
that G∗1 ≥ G∗
2 , P1 ≥ P2 and R∗1 > R∗
2 . This means that yardstick is still bias
towards the fiscally-rich jurisdiction in that incumbent in fiscally-rich jurisdiction
is still able to provide a higher public goods, take a higher rent and have a higher
probability of reelected.
However, the difference in costs of rent appropriation might moderate the bias
caused by fiscal disparity. We can compare the Nash equilibrium under asymmetric
fiscal capacity with one under both asymmetric fiscal capacity and asymmetric
costs of rent appropriation and show that there exists a Nash equilibrium implying
that G∗1 > G∗
1 and G∗2 > G∗
2, P∗1 < P1 and P∗
2 > P2, R∗1 < R∗
1 and R∗2 < R∗
2, for
σ ≥ µ.
14

An intuitive interpretation would be as follows. With higher costs of rent ap-
propriation, incumbent in jurisdiction 2 should put more efforts to hide her rent
seeking activities, that is by increasing the level of public goods. The lower is σ,
the larger is the disparity in costs of rent appropriation, the more public goods she
should provide in order to catch up with the neighboring jurisdiction. On the one
hand a higher level of public goods lowers her first period rent, but on the other,
it increases her probability of reelection. The total expected rent thus depends on
how much rent she gives up in the first period and the increase in the probability
of reelection.
Allowing for yardstick competition, voters in jurisdiction 1 might also benefit from
the costliness of rent appropriation in jurisdiction 2. The increased level of public
goods in jurisdiction 2 induces a higher level of public goods in jurisdiction 1 so
long as fiscal disparity higher than costs of rent appropriation disparity. However,
the reelection probability of incumbent in jurisdiction 1 lowers because the increase
of public goods in 2 is relatively higher than in 1. This leads to a lower expected
rent in the second period. Since γ1 < 1, the total expected rent appropriated by
incumbent in jurisdiction 1 decreases. Therefore, in this setting the costliness of
rent appropriation in fiscally-poor jurisdiction restricts the predatory behavior of
incumbent in the fiscally-rich jurisdiction, in that he must increase his supply of
public goods and give up some part of his rent and yet has a lower probability of
reelection.
For the second case, σ < µ, fiscal disparity is less severe than costs of rent appro-
priation disparity. The Nash equilibrium under both asymmetries shows G∗1 < G∗
2
and P1 < P2. However, the effect on total expected rent is ambiguous, in which
R1 < R2 only if (1 − µσ)γi <(µ3−σ2)δσ+µ
. Furthermore, comparing the Nash equi-
librium under asymmetric fiscal capacity with one under both asymmetries, there
exists a Nash equilibrium implying that G∗1 < G∗
1 and G∗2 > G∗
2, P∗1 < P1 and
P∗2 > P2, R
∗1 < R∗
1 and R∗2 < R∗
2, for σ < µ.
Intuitively, this suggests that when both jurisdictions are relatively fiscally iden-
tical, the costliness of rent appropriation in the neighboring jurisdiction hinders
incumbent in the relatively fiscally-rich jurisdiction to exploit his fiscal advantages.
15

In order to appropriate more rent, he must decrease public goods and thus lowers
his probability of reelection.
Figure 4 and 5 illustrate one possibility of the mechanisms at work, in which
σ = 0.5 and γ1 = 1. Figure 4 shows that, holding µ constant, the solid line is
generally higher than the dashed line, implying per capita public goods in both
jurisdictions are generally higher with disparity in costs of rent appropriation in
place. So long as σ ≥ µ, per capita public goods in both jurisdictions increases.
Further to the right, fiscal disparity is lower relative to the difference in the costs
of rent appropriation (σ < µ). Hence, due to higher cost of rent appropriation,
incumbent in jurisdiction 2 must provide even higher per capita public goods than
incumbent in jurisdiction 1. This lowers her her first period rent but grants her
a higher probability of reelection than her counterpart, leading to a higher total
expected rent.
µ0.5 1
G1, G2,
G1, G2
0
σ = 0.5, γ1 = 1
G2
G1
G1
G2
σ = µσ > µ σ < µ
under fiscal disparityunder fiscal and costs of rent diversion disparity
Figure 4: Per capita public goods in which σ ∈ (0, 1)
Figure 5 shows the associated total expected rent. Incumbent in fiscally-rich ju-
risdiction generally can appropriate more rent. However, the costliness of rent
appropriation in the fiscally-poor neighboring jurisdiction limits his predatory be-
havior, compelling him to reduce his rent. With costs of rent appropriation in
place, the overall welfare increases.
16

µ0.5 1
R1, R2,
R1, R2
0
σ = 0.5, γ1 = 1
R1
R2
R1
R2
under fiscal disparityunder fiscal and costs of rent diversion disparity
Figure 5: Total expected rent in which σ ∈ (0, 1)
6 Concluding remarks
When fiscal disparity exists, Allers (2012) shows that yardstick competition is bias
toward fiscally-rich jurisdictions and, thus, cannot sufficiently curb the predatory
behavior of incumbent in those jurisdictions. This study emphasizes disparities
among jurisdictions further, that is not only in terms of fiscal but also in term of
costs of rent appropriation.
In particular, in a setting in which jurisdictions with high fiscal capacity having low
costs of rent appropriation whilst those having low fiscal capacity having higher
costs of rent appropriation, if voters are able to asses the relative performance
of their government, the difference in costs of rent appropriation might moderate
the bias caused by fiscal disparity. So long as fiscal disparity higher than costs
of rent appropriation disparity, the costliness of rent appropriation in fiscally-
poor jurisdiction restricts the predatory behavior of incumbent in the fiscally-rich
jurisdiction, in that he must increase his supply of public goods and give up some
part of his rent and yet has a lower probability of reelection. When fiscal disparity
lower than costs of rent appropriation disparity, the costliness of rent appropriation
in the neighboring jurisdiction hinders incumbent in the relatively fiscally-rich
17

jurisdiction to exploit his fiscal advantages. In order to appropriate more rent, he
must decrease public goods and thus lowers his probability of reelection.
18

References
Allers, Maarten A. 2012. “Yardstick competition, fiscal disparities, and equaliza-
tion.” Economics Letters 117 (1): 4–6.
Allers, Maarten A., and J. Paul Elhorst. 2005. “Tax Mimicking and Yardstick
Competition Among Local Governments in the Netherlands.” International
Tax and Public Finance 12, no. 4 (August): 493–513.
Aspinall, Edward, and Greg Fealy. 2003. “Introduction: Decentralization, Democ-
ratization and the Rise of the Local.” In Local power and politics in Indone-
sia: Democratisation and decentralisation. ISEAS-Yusof Ishak Institute. Sin-
gapore.
Besley, Timothy, and Anne Case. 1995. “Incumbent Behavior: Vote-Seeking, Tax-
Setting, and Yardstick Competition.” American Economic Review 85 (1): 25–
45.
Bordignon, Massimo, Floriana Cerniglia, and Federico Revelli. 2003. “In search of
yardstick competition: a spatial analysis of Italian municipality property tax
setting.” Journal of Urban Economics 54 (2): 199–217.
. 2004. “Yardstick competition in intergovernmental relationships: theory
and empirical predictions.” Economics Letters 83 (3): 325–333.
Bosch, Nuria, and Albert Sole-Olle. 2007. “Yardstick competition and the polit-
ical costs of raising taxes: An empirical analysis of Spanish municipalities.”
International Tax and Public Finance 14, no. 1 (February): 71–92.
Caldeira, Emilie. 2012. “Yardstick competition in a federation: Theory and evi-
dence from China.” China Economic Review 23 (4): 878–897.
Glaeser, Edward L., and Raven E. Saks. 2006. “Corruption in America.” Journal
of Public Economics 90 (6): 1053–1072.
Hirshleifer, Jack. 1989. “Conflict and Rent-Seeking Success Functions: Ratio vs.
Difference Models of Relative Success.” Public Choice 63 (2): 101–112.
19

Kotsogiannis, Christos, and Robert Schwager. 2008. “Accountability and fiscal
equalization.” New Directions in Fiscal Federalism, Journal of Public Eco-
nomics 92 (12): 2336–2349.
KPK. 2012. Annual Report. Technical report. Komisi Pemberantasan Korupsi
(KPK).
Liddo, Giuseppe Di, and Michele G. Giuranno. 2016. “Asymmetric yardstick com-
petition and municipal cooperation.” Economics Letters 141:64–66.
Lockwood, Ben. 2005. “Fiscal Decentralization: A Political Economy Perspective.”
Warwick Economic Research Papers, no. 721.
Martinez-Vazquez, J., F. J. A. Del Granado, and R. R. Simatupang. 2008. “Lo-
cal Government Fiscal Competition in Developing Countries: The Case of
Indonesia.” Urban Public Economics Review: 13–45.
Oates, W. E. 1972. Fiscal Federalism. New York: Harcourt Brace Yovanovich.
Persson, Torsten, and Guido Tabellini. 2000. Political Economics. The MIT Press.
Tiebout, Charles M. 1956. “A Pure Theory of Local Expenditures.” Journal of
Political Economy 64 (5): 416–424.
World Bank. Indonesia Database for Policy and Economic Research (INDOE-
DAPOER).
20

A Appendix
A.1 The yardstick bias
The government’s maximization problem is
maxG1
i
τBi −G1i + Pi(G1, G2)δτBi
The maximization yields:
−1 +δτBi(G1 +G2)− δτBiGi
(G1 +G2)2!
= 0
δτBi(G1 +G2)− δτBiGi = (G1 +G2)2
With B2 = µB1, the reaction function of incumbent in jurisdiction 1 and 2 are
respectively:
δτB1G2 = (G1 +G2)2 (A.1.1)
δτµB1G1 = (G1 +G2)2 (A.1.2)
By manipulating equation (A.1.1) and (A.1.2), we get
G2 = µG1
(G2 + µG1)δτB1 = 2(G1 +G2)2
We derive the Nash equilibrium of public goods as follows
2µG1δτB1 = 2(G1 + µG1)2
2µG1δτB1 = 2G21(1 + µ)2
µδτB1 = G1(1 + µ)2
G∗1 =
µ
(1 + µ)2δτB1 (A.1.3)
21

Accordingly,
G∗2 =
µ2
(1 + µ)2δτB1 (A.1.4)
The reelection probability for the incumbent in 1 and 2 are
P1 =G1
G1 +G2
=1
1 + µ(A.1.5)
P2 =G2
G1 +G2
=µ
1 + µ(A.1.6)
In equilibrium, the total rent
R∗1 = τB1 −
µ
(1 + µ)2δτB1 +
1
1 + µδτB1
R∗1 = τB1 −
µ− (1 + µ)
(1 + µ)2δτB1
R∗1 =
[1 +
δ
(1 + µ)2
]τB1 (A.1.7)
Using the same fashion, the total rent for jurisdiction j is
R∗2 = µ
[1 +
µ2δ
(1 + µ)2
]τB1 (A.1.8)
A.2 Equilibrium with asymmetric costs of rent appropriation
The government’s maximization problem is
maxG1i
Ri = γi(τBi − G1i ) + Pi(G1, G2)δτBi,
22

The maximization yields:
−γi +δτBi(G1 + G2)− δτBiGi
(G1 + G2)2!
= 0
δτBi(G1 + G2)− δτBiGi = −γi(G1 + G2)2
With B2 = µB1 and γ2 = σγ1, the reaction function of incumbent in 1 and 2 are
respectively:
δτB1G2 = γ1(G1 + G2)2 (A.2.1)
δτµB1G1 = σγ1(G1 + G2)2 (A.2.2)
By manipulating equation (A.2.1) and (A.2.2), we get
G2 =µ
σG1
(µG1 + G2)δτB1 = γ1(1 + σ)(G1 + G2)2
Using equation (A.2.1) and (A.2.2), we derive the Nash equilibrium of public
good
(µG1 +µ
σG1)δτB1 = γ1(1 + σ)(G1 +
µ
σG1)
2
µG1
(1 + σ
σ
)δτB1 = γ1(1 + σ)
(σ + µ
σ
)2G21
µδτB1 = γ1(σ + µ)2
σG1
G∗1 =
µσ
γ1(σ + µ)2δτB1 (A.2.3)
Accordingly,
G∗2 =
µ2
γ1(σ + µ)2δτB1 (A.2.4)
23

The reelection probability for the incumbent is
P1 =G1
G1 + G2
=σ
σ + µ(A.2.5)
P2 =G2
G1 + G2
=µ
σ + µ(A.2.6)
In equilibrium, the total rent for the incumbent in jurisdiction 1
R∗1 = γ1τB1 − γ1
µσ
γ1(σ + µ)2δτB1 +
σ
σ + µδτB1
R∗1 = γ1τB1 +
σ(σ + µ)− µσ(σ + µ)2
δτBi
R∗1 =
[γ1 +
σ2δ
(σ + µ)2
]τBi (A.2.7)
Using the same fashion, the total rent the incumbent in j is
R∗2 = γ2τB2 − γ2
µ2
γ1(σ + µ)2δτB1 +
µ
σ + µδτB2
R∗2 = µσγ1τB1 − σγ1
µ2
γ1(σ + µ)2δτB1 +
µ2
σ + µδτB1
R∗2 = µσγ1τB1 +
µ2(σ + µ)− µ2σ
(σ + µ)2δτBi
R∗2 =
[µσγ1 +
µ3δ
(σ + µ)2
]τBi (A.2.8)
A.3 Yardstick bias under σ ≥ µ
We first show that yardstick is still bias, in that G∗1 ≥ G∗
2 , P∗1 ≥ P∗
2 and R∗1 > R∗
2 .
G∗1 ≥ G∗
2
µσ
γ1(σ + µ)2δτB1 ≥
µ2
γ1(σ + µ)2δτB1 (A.3.1)
24

P∗1 ≥ P∗
2
σ
σ + µ≥ µ
σ + µ(A.3.2)
R∗1 > R∗
2[γ1 +
σ2δ
(σ + µ)2
]τBi > µ
[σγ1 +
µ2δ
(σ + µ)2
]τBi[
γ1 +σ2δ
(σ + µ)2
]> µ
[σγ1 +
µ2δ
(σ + µ)2
](A.3.3)
With σ ≥ µ, the left-hand side is larger than the term on the bracket of the
right-hand side. Since µ ∈ (0, 1), the left-hand side is larger than the right-hand
side
The following part shows that when costs of rent appropriation differ, there exists
a Nash equilibrium in which yardstick bias is moderated, that is G∗1 > G∗
1 and
G∗2 > G∗
2, P∗1 < P1 and P∗
2 > P2, R∗1 < R∗
1 and R∗2 < R∗
2, for σ ≥ µ.
For jurisdiction 1:
For some parameter σ ≥ µ, there exists G∗1 in which G∗
1 > G∗1, if 1+µ >
√γ2(1+ µ
σ).
25
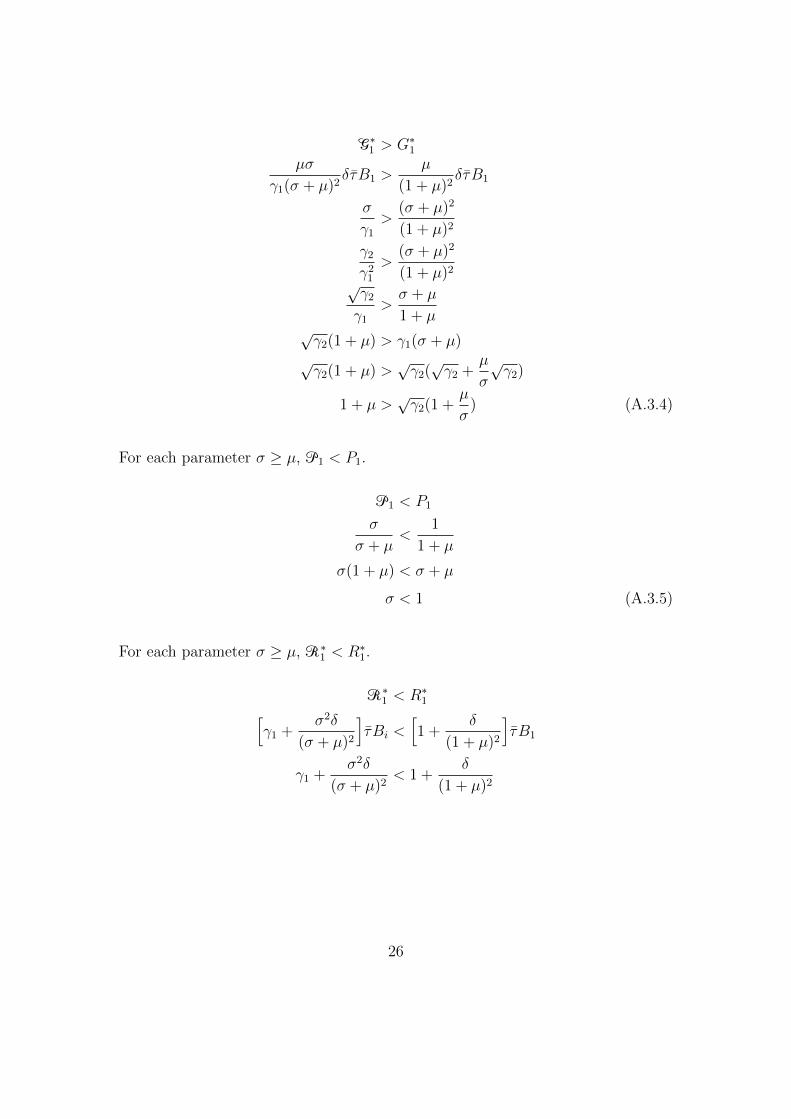
G∗1 > G∗
1
µσ
γ1(σ + µ)2δτB1 >
µ
(1 + µ)2δτB1
σ
γ1>
(σ + µ)2
(1 + µ)2
γ2γ21
>(σ + µ)2
(1 + µ)2√γ2
γ1>σ + µ
1 + µ√γ2(1 + µ) > γ1(σ + µ)√γ2(1 + µ) >
√γ2(√γ2 +
µ
σ
√γ2)
1 + µ >√γ2(1 +
µ
σ) (A.3.4)
For each parameter σ ≥ µ, P1 < P1.
P1 < P1
σ
σ + µ<
1
1 + µ
σ(1 + µ) < σ + µ
σ < 1 (A.3.5)
For each parameter σ ≥ µ, R∗1 < R∗
1.
R∗1 < R∗
1[γ1 +
σ2δ
(σ + µ)2
]τBi <
[1 +
δ
(1 + µ)2
]τB1
γ1 +σ2δ
(σ + µ)2< 1 +
δ
(1 + µ)2
26

Since γ1 < 1, ifσ2δ
(σ + µ)2<
δ
(1 + µ)2, then R∗
1 < R∗1 .
σ2δ
(σ + µ)2<
δ
(1 + µ)2
σ2(1 + µ)2 < (σ + µ)2
σ2 + 2µσ2 + µ2 < σ2 + 2µσ + µ2
σ2 < σ (A.3.6)
For jurisdiction 2:
For each parameter σ ≥ µ, G∗2 > G∗
2.
G∗2 > G∗
2
µ2
γ1(σ + µ)2δτB1 >
µ2
(1 + µ)2δτB1
1
γ1(σ + µ)2>
1
(1 + µ)2
(1 + µ)2 > γ1(σ + µ)2 (A.3.7)
For each parameter σ ≥ µ, P∗2 > P ∗
2 .
P2 > P2
µ
σ + µ>
µ
1 + µ
1 + µ > σ + µ
1 > µ (A.3.8)
For some parameter σ ≥ µ, there exists R∗2 in which R∗
2 < R∗2, if
[ 1
(σ + µ)2−
1
(1 + µ)2
]µ2δ < 1− σγ1.
27
R∗2 < R∗
2
µ[σγ1 +
µ2δ
(σ + µ)2
]τB1 < µ
[1 +
δµ2
(1 + µ)2
]τB1
σγ1 +µ2δ
(σ + µ)2< 1 +
µ2δ
(1 + µ)2[ 1
(σ + µ)2− 1
(1 + µ)2
]µ2δ < 1− σγ1 (A.3.9)
A.4 Yardstick bias under σ < µ
Following equation A.3.1 and A.3.2, it is straightforward to show that G∗1 < G∗
2
and P∗1 < P∗
2 . However, the effect on total expected rent is ambiguous, in which
R1 < R2 only if (1− µσ)γi <(µ3−σ2)δσ+µ
.
R∗1 < R∗
2[γ1 +
σ2δ
(σ + µ)2
]τBi < µ
[σγ1 +
µ2δ
(σ + µ)2
]τBi[
γ1 +σ2δ
(σ + µ)2
]< µ
[σγ1 +
µ2δ
(σ + µ)2
](1− µσ)γi <
(µ3 − σ2)δ
σ + µ(A.4.1)
We now compare the Nash equilibrium under asymmetric fiscal capacity with one
under both asymmetries and show that there exists a Nash equilibrium implying
that G∗1 < G∗
1 and G∗2 > G∗
2, P∗1 < P1 and P∗
2 > P2, R∗1 < R∗
1 and R∗2 < R∗
2, for
σ < µ.
From equation A.3.4, if σ < µ, µσ> 1, and thus the left-hand side is much smaller
than the term in the bracket of the right-hand side. This implies: for some param-
eter σ < µ, there exists G∗1 in which G∗
1 < G∗1 if 1 + µ <
√γ2(1 + µ
σ). This likely
occurs when µ is large enough.
28

We only need to show G∗1 < G∗
1, since the other conditions remains as under
σ ≥ µ.
29
DP-CIW 1/2011: Die Gemeinschaft der Lehrenden und Lernenden: Festvortrag
zur Promotionsfeier der Wirtschaftswissenschaftlichen Fakultät am 24. November 2010 in der Aula des Schlosses Alexander Dilger January 2011 DP-CIW 2/2011: Plädoyer für eine problemorientierte, lerntheoretisch und fachlich fundierte ökonomische Bildung Gerd-Jan Krol, Dirk Loerwald und Christian Müller February 2011 DP-CIW 3/2011: Gefangen im Dilemma? Ein strategischer Ansatz der Wahl und Revolutionsteilnahme Marie Möller April 2011 DP-CIW 4/2011: Overconfidence and Team-Performance: An Analysis of NBA-Players’ Self-Perception Hannah Geyer, Hanke Wickhorst April 2011 DP-CIW 5/2011: Kompetenzziele für das allgemein bildende Fach „Wirtschaft/ Ökonomie“ in der Sekundarstufe I AGOEB – Arbeitsgruppe Ökonomische Bildung May 2011 DP-CIW 6/2011: Coping with Unpleasant Surprises in a Complex World: Is Rational Choice Possible in a World with Positive Information Costs? Roger D. Congleton June 2011 DP-CIW 7/2011: Warum der Baseler Ausschuss für Bankenaufsicht mit seinem antizyklischen Kapitalpuffer falsch liegt Björn Ludwig July 2011 DP-CIW 8/2011: Bestimmungsgründe für die Beschäftigung und Rekrutierung von Älteren sowie für das Angebot an altersspezifischen Personalmaßnahmen Christian Lehmann August 2011 DP-CIW 9/2011: Das „Bruttonationalglück“ als Leitlinie der Politik in Bhutan - eine ordnungspolitische Analyse Tobias Pfaff September 2011 DP-CIW 10/2011: Economic Voting and Economic Revolutionizing? The Economics of Incumbency Changes in European Democracies and Revolutionary Events in the Arab World Marie Möller October 2011
Center for Interdisciplinary Economics Discussion Papers

DP-CIW 11/2011: Geschlechtsspezifische Verdienstunterschiede und Diskriminierung am Arbeitsmarkt Nele Franz November 2011 DP-CIW 1/2012: Toward a More General Approach to Political Stability in Comparative Political Systems Thomas Apolte January 2012 DP-CIW 2/2012: An Empirical Study of the Limits and Perspectives of Institutional Transfers Marie Möller February 2012 DP-CIW 3/2012: Wie (un-) fair sind Ökonomen? Neue empirische Evidenz zur Marktbewertung und Rationalität René Ruske, Johannes Suttner September 2012 DP-CIW 1/2013: Zur Ethik von Rankings im Hochschulwesen Eine Betrachtung aus ökonomischer Perspektive Harry Müller February 2013 DP-CIW 2/2013: Which Qualifications Does a Minister of the German Federal Government Need to Be Reoccupied? Katrin Scharfenkamp March 2013 DP-CIW 3/2013: Unkonventionelle Geldpolitik – Warum die Europäische Zentralbank ihre Unabhängigkeit nicht verloren hat Carsten Schwäbe March 2013 DP-CIW 4/2013: Testing the Easterlin Hypothesis with Panel Data: The Dynamic Relationship Between Life Satisfaction and Economic Growth in Germany and in the UK Tobias Pfaff, Johannes Hirata April 2013 DP-CIW 5/2013: Income Comparisons, Income Adaptation, and Life Satisfaction: How Robust Are Estimates from Survey Data? Tobias Pfaff May 2013 DP-CIW 6/2013: The Supply of Democracy: Explaining Voluntary Democratic Transition Thomas Apolte October 2013 DP-CIW 1/2014: Maternity Leave and its Consequences for Subsequent Careers in Germany Nele Franz January 2014 DP-CIW 2/2014: Youth Bulges, Insurrections, and Politico-Economic Institutions Thomas Apolte
February 2014

DP-CIW 3/2014: Sensitivity of Economists during Market Allocation Johannes R. Suttner March 2014 DP-CIW 1/2015: Abused Rebels and Winning Coalitions: Regime Change under the Pressure
of Rebellions Thomas Apolte February 2015 DP-CIW 2/2015: Gordon Tullock’s Theory of Dictatorship and Revolution Thomas Apolte March 2015
DP-CIW 3/2015: Youth Bulges, Insurrections, and Politico-Economic Institutions: Theory and
Empirical Evidence Thomas Apolte, Lena Gerling March 2015
DP-CIW 4/2015: Überschätzen sich Schüler?
Fabian Schleithoff August 2015 DP-CIW 5/2015: Autocracy and the Public Thomas Apolte September 2015 DP-CIW 6/2015: Social Market Economy: Towards a Comprehensive Composite Index Helena Helfer October 2015
DP-CIW 1/2017: I Hope I Die Before I Get Old: The Supply Side of the Market for Suicide Bombers
Thomas Apolte January 2017
DP-CIW 2/2017: Riots and the Window of Opportunity for Coup Plotters: Evidence on the Link between Urban Protests and Coups d'État
Lena Gerling January 2017 DP-CIW 3/2017: Minimum Wages and Vocational Training Incentives in Germany Kim Leonie Kellermann February 2017
DP-CIW 4/2017: Political Participation and Party Capture in a Dualized Economy: A Game
Theory Approach Kim Leonie Kellermann August 2017
DP-CIW 1/2018: A Theory of Autocratic Transition Thomas Apolte January 2018 DP-CIW 2/2018: Fiscal Disparity, Institutions and Yardstick Competition Alfa Farah April 2018


University of Münster CIW – Center for Interdisciplinary Economics Scharnhorststrasse 100 D-48151 Münster
phone: +49-251/83-25329 fax: +49-251/83-28429
www.wiwi.uni-muenster.de/ciw