center for social services research school of social welfare, uc berkeley california’s child...
Post on 19-Dec-2015
221 views
TRANSCRIPT
CENTER FOR SOCIAL SERVICES RESEARCH School of Social Welfare, UC Berkeley
California’s Child Welfare Outcomes & Accountability System:
Using Performance Measures to Encourage Improvement
Barbara Needell, MSW, PhDCenter for Social Services ResearchUniversity of California at Berkeley
The Performance Indicators Project is a collaboration of the California Department of Social Services and the University of California at Berkeley,
and is supported by the California Department of Social Services and the Stuart Foundation

Child Welfare is a System
CounterbalancedCounterbalancedIndicators ofIndicators of
SystemSystemPerformancePerformance
PermanencyPermanencyThroughThrough
Reunification,Reunification,Adoption, orAdoption, orGuardianshipGuardianship
LengthLengthof Stayof Stay
StabilityStabilityof Careof Care
Rate of Referrals/Rate of Referrals/Substantiated ReferralsSubstantiated Referrals
Home-BasedHome-BasedServices vs.Services vs.Out of HomeOut of Home
CareCare
Positive Positive AttachmentsAttachments
to Family,to Family,Friends, andFriends, andNeighborsNeighbors
Use of LeastUse of LeastRestrictiveRestrictive
Form of CareForm of Care
SOURCE: Usher, C.L., Wildfire, J.B., Gogan, H.C. & Brown, E.L. (2002). Measuring Outcomes in Child Welfare. Chapel Hill: Jordan Institute for Families,
Reentry to CareReentry to Care

CENTER FOR SOCIAL SERVICES RESEARCH School of Social Welfare, UC Berkeley
Background…
California’s Child Welfare System Improvement and Accountability Act– Became law (AB 636) in 2001 – Went into effect in January 2004 with publication of first quarterly
report– Began with county self assessments and System Improvement Plans
(SIPS) that identified key challenges and strengths, based on public data
Currently includes all federal measures (17 in CFSR2), augmented by state measures that capture important aspects of performance– Participation rates (referrals, substantiations, entries, in care)– Sibling placements– Key process measures (e.g., child visits, time to investigation)– Least restrictive placements– Measures added over time
CENTER FOR SOCIAL SERVICES RESEARCH School of Social Welfare, UC Berkeley
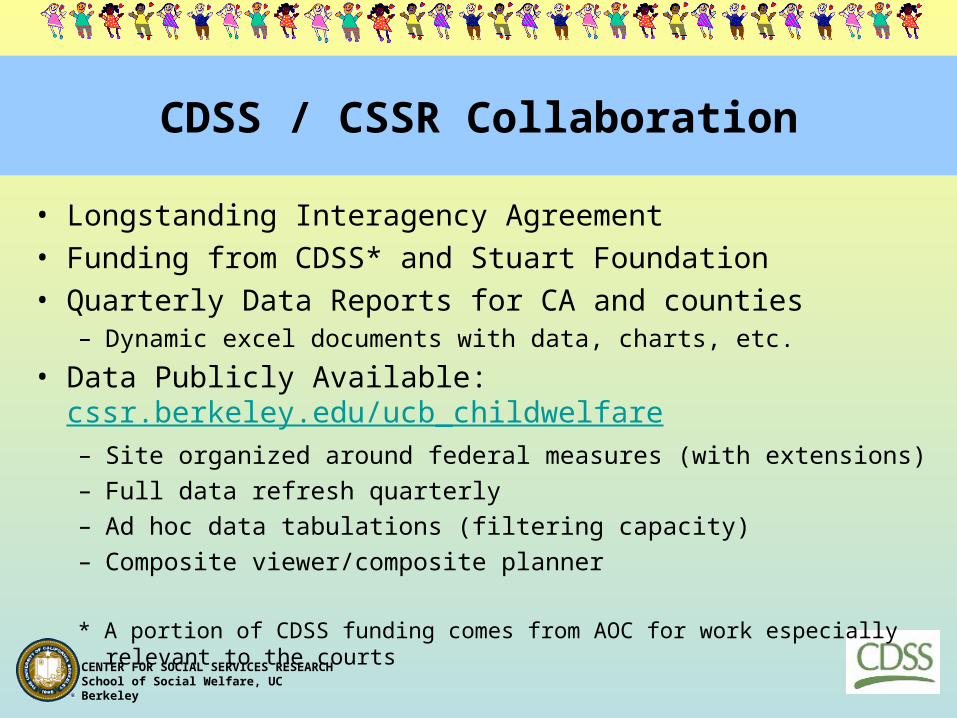
CDSS / CSSR Collaboration
• Longstanding Interagency Agreement • Funding from CDSS* and Stuart Foundation• Quarterly Data Reports for CA and counties
– Dynamic excel documents with data, charts, etc.
• Data Publicly Available: cssr.berkeley.edu/ucb_childwelfare– Site organized around federal measures (with extensions)– Full data refresh quarterly– Ad hoc data tabulations (filtering capacity)– Composite viewer/composite planner
* A portion of CDSS funding comes from AOC for work especially relevant to the courts

CENTER FOR SOCIAL SERVICES RESEARCH School of Social Welfare, UC Berkeley

CENTER FOR SOCIAL SERVICES RESEARCH School of Social Welfare, UC Berkeley
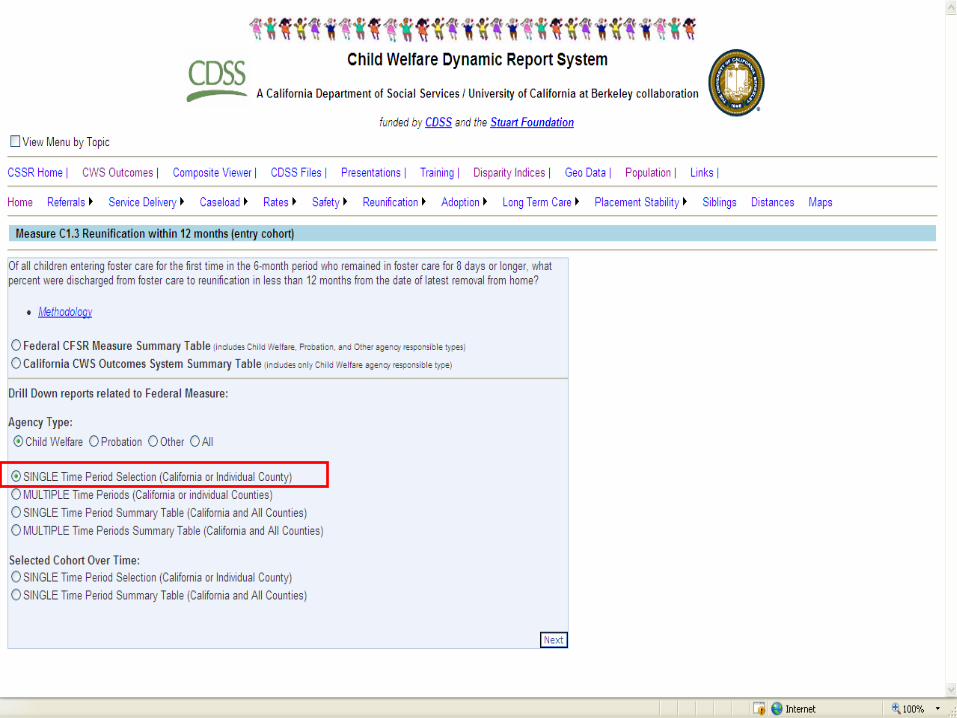
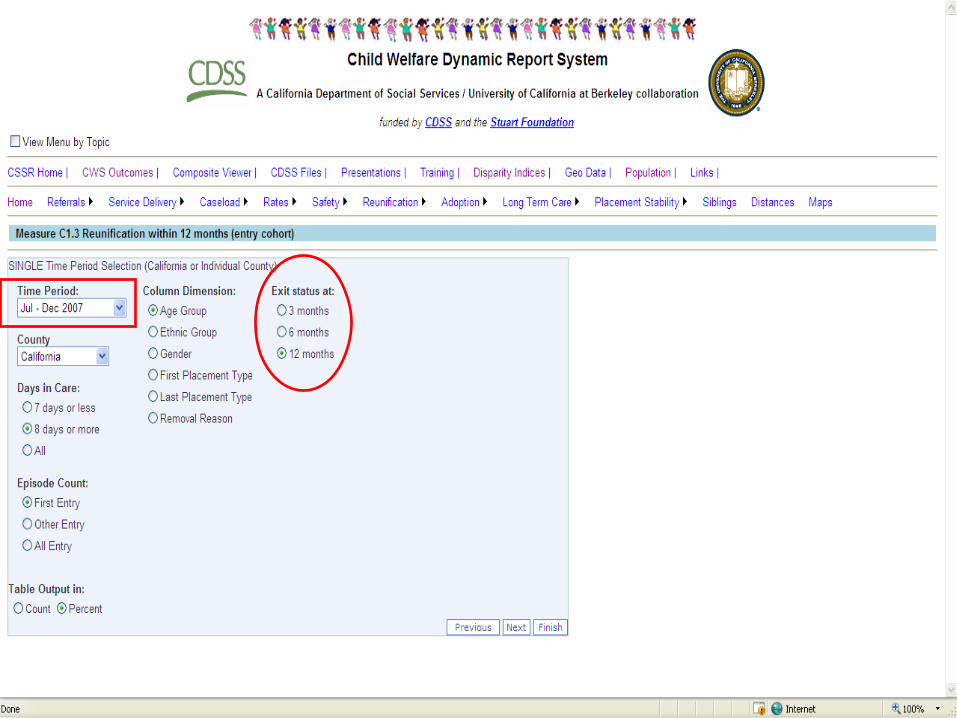
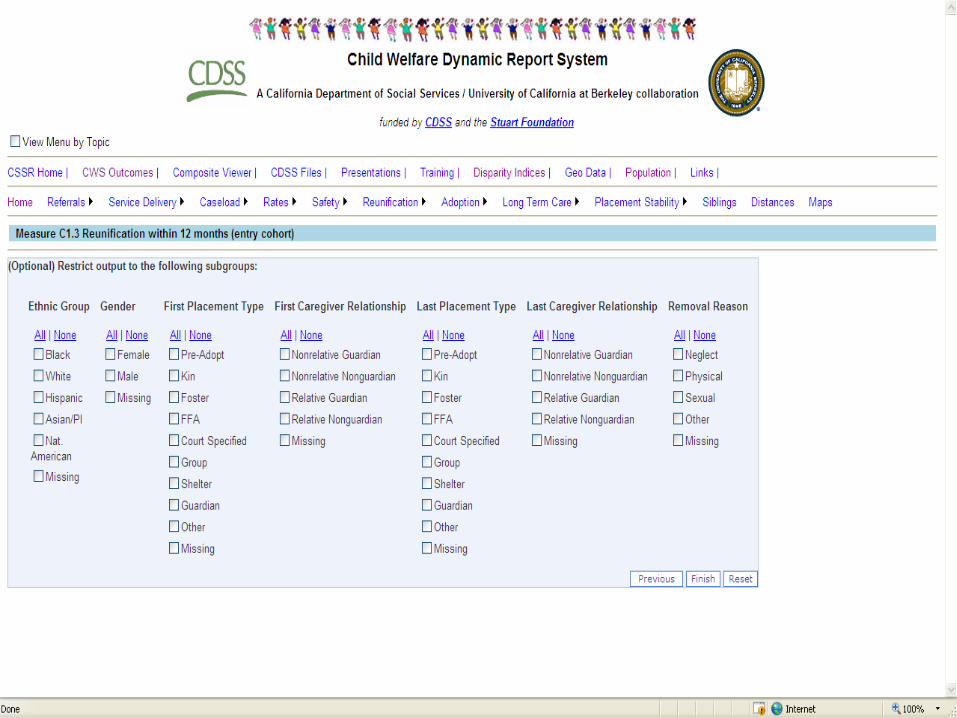
Example…
• Measure – C1.3: Reunification within 12 months (entry cohort)
• Federal Base – Of all children entering foster care for the first time in the 6-
month period who remained in foster care for 8 days or longer, what percent were discharged from foster care to reunification in less than 12 months from the date of latest removal from home?
• Site Extensions– Agency, Days in Care, Time Period Views, Episode Count– Age, Ethnicity, Gender, Placement Type, Removal Reason– Exit Status at 3m, 6m, 12m…120m– Subgroup filtering, Count/Percent, Excel Export


CENTER FOR SOCIAL SERVICES RESEARCH School of Social Welfare, UC Berkeley
14.8%4.7%
28.3%15.1%
8.4%23.3%
23.8%
8.9%3.2%
23.7%12.3%
19.6%3.9%
4B: PIT Placement (Group/ Shelter) (- )
4B: PIT Placement (Relative) (+)
4B: Entries First Placement (Group/ Shelter) (- )
4B: Entries First Placement (Relative) (+)
4A: Siblings (Some or All) (+)
4A: Siblings (All) (+)
2C: Timely Social Worker Visits (+)
2B: Timely Response (10 day) (+)
2B: Timely Response (1 day) (+)
PR: I n Care Rate (- )
PR: Entry Rate (- )
PR: Substantiation Rate (- )
PR: Referral Rate (- )
January 2004-July 2009
California CWS Outcomes System:AB636 Measures, % IMPROVEMENT
(+) or (–) indicates direction of desired change
Decline in Performance Improvement in Performance
CENTER FOR SOCIAL SERVICES RESEARCH School of Social Welfare, UC Berkeley
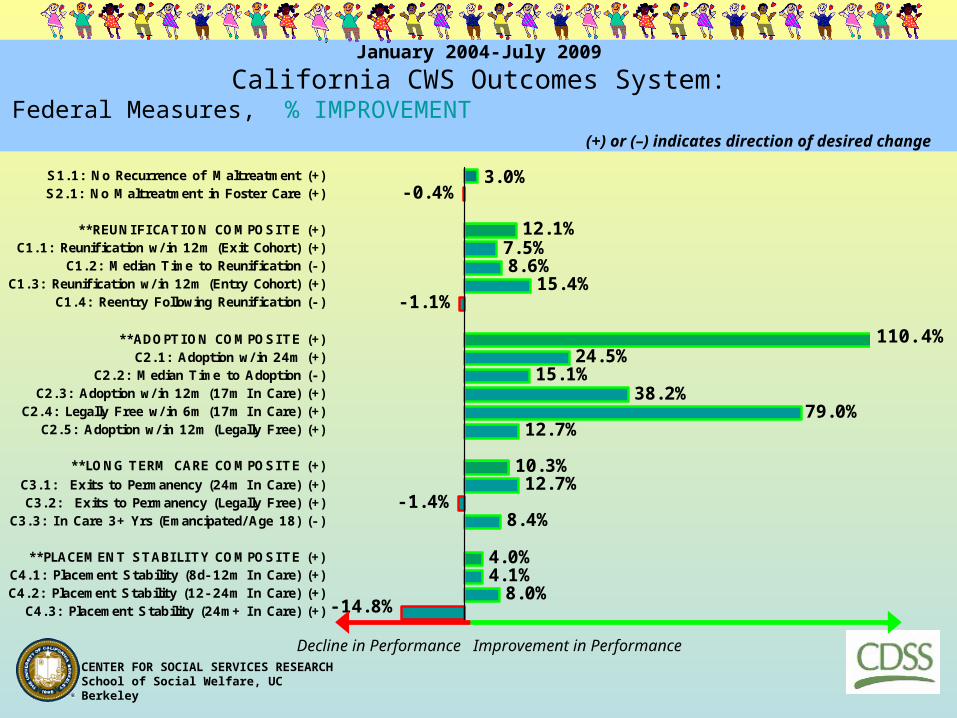
3.0%- 0.4%
12.1%7.5%
15.4%- 1.1%
8.6%
24.5%15.1%
38.2%79.0%
12.7%
10.3%12.7%
- 1.4%8.4%
4.0%4.1%
8.0%- 14.8%C4.3: Placement Stability (24m+ In Care) (+)
C4.2: Placement Stability (12- 24m In Care) (+)C4.1: Placement Stability (8d- 12m In Care) (+)
**PLACEMENT STABILITY COMPOSITE (+)
C3.3: I n Care 3+ Yrs (Emancipated/ Age 18) (- )C3.2: Exits to Permanency (Legally Free) (+)
C3.1: Exits to Permanency (24m In Care) (+)**LONG TERM CARE COMPOSITE (+)
C2.5: Adoption w/ in 12m (Legally Free) (+)C2.4: Legally Free w/ in 6m (17m In Care) (+)
C2.3: Adoption w/ in 12m (17m In Care) (+)C2.2: Median Time to Adoption (- )
C2.1: Adoption w/ in 24m (+)**ADOPTION COMPOSITE (+)
C1.4: Reentry Following Reunification (- )C1.3: Reunification w/ in 12m (Entry Cohort) (+)
C1.2: Median Time to Reunification (- )C1.1: Reunification w/ in 12m (Exit Cohort) (+)
**REUNIFICATION COMPOSITE (+)
S2.1: No Maltreatment in Foster Care (+)S1.1: No Recurrence of Maltreatment (+)
January 2004-July 2009
California CWS Outcomes System:Federal Measures, % IMPROVEMENT
(+) or (–) indicates direction of desired change
Decline in Performance Improvement in Performance
110.4%

CENTER FOR SOCIAL SERVICES RESEARCH School of Social Welfare, UC Berkeley
Public Data:Putting it All Out There
• PROS:– Greater performance accountability– Community awareness and involvement, encourages public-
private partnerships– Ability to track improvement over time, identify areas where
programmatic adjustments are needed- County/County and County/State collaboration
• CONS:– Potential for misuse, misinterpretation, and misrepresentation – Available to those with agendas or looking to create a sensational
headline– Misunderstood data can lead to the wrong policy decisions– “Torture numbers, and they’ll confess to anything”
Gregg Easterbrook

CENTER FOR SOCIAL SERVICES RESEARCH School of Social Welfare, UC Berkeley
Child Welfare County Data Profiles: Court Data Reports
- Customized excel reports for judges designed by AOC and CSSR staff
- Data restricted to court dependent children when possible
- County/State and County side by side table and graph comparisons - % change between timeframes
- Presents data from child welfare and court sources (filings)
- Provides links to source reports on CWS/CMS reports website to allow users to further explore data

CENTER FOR SOCIAL SERVICES RESEARCH School of Social Welfare, UC Berkeley
CSSR.BERKELEY.EDU/UCB_CHILDWELFARENeedell, B., Webster, D., Armijo, M., Lee, S., Dawson, W., Magruder, J., Exel, M., Glasser, T., Williams, D., Zimmerman, K., Simon, V., Putnam-Hornstein, E., Frerer, K., Cuccaro-Alamin, S., Winn, A., Lou, C., & Peng, C. (2009). Child Welfare Services Reports for California. Retrieved April 1, 2009, from University of California at Berkeley Center for Social Services Research website. URL: <http://cssr.berkeley.edu/ucb_childwelfare>
Barbara [email protected]
510-290-6334
Presentation Developed by Emily Putnam-Hornstein and Christine Wei-Mien Lou