central hudson distributed system implementation plan
TRANSCRIPT

Central Hudson Distributed System Implementation PlanRevised July 31, 2018
www.CentralHudson.com


Table of Contents
i
Table of Contents
Table of Contents ............................................................................................ i
Acronyms and Abbreviations .......................................................................... iii
I. Executive Summary ................................................................................... 1
II. Progressing the Distributed System Platform ................................................. 7
A. Introduction ............................................................................................................. 7
B. Long Term Vision ...................................................................................................... 8
C. DSP Progress and Implementation Roadmap ............................................................... 18
D. Innovation .............................................................................................................. 27
E. Grid Modernization and the DSP Technology Platform ................................................. 32
III. DSIP Update Topical Sections .................................................................... 37
A. Integrated Planning ................................................................................................. 37
B. Advanced Forecasting .............................................................................................. 60
C. Grid Operations ...................................................................................................... 88
D. Energy Storage Integration ..................................................................................... 119
E. Electric Vehicle Integration ..................................................................................... 141
F. Energy Efficiency Integration and Innovation ............................................................ 155
G. Distribution System Data ........................................................................................ 167
H. Customer Data ...................................................................................................... 182
I. Cyber Security ...................................................................................................... 193
J. DER Interconnections ............................................................................................ 199
K. Advanced Metering Infrastructure ........................................................................... 211
L. Hosting Capacity ................................................................................................... 218
M. Beneficial Locations for DERs and Non-Wires Alternatives .......................................... 230

Table of Contents
ii
N. Procuring Non-Wires Alternatives............................................................................ 242
IV. Other DSIP-Related Information ............................................................... 251
A. DSIP Governance................................................................................................... 251
B. Marginal Cost Study/Avoided T&D Cost Study ........................................................... 258
C. BCA Manual.......................................................................................................... 261
V. Appendices ........................................................................................... 263
A. Load and DER Forecast........................................................................................... 264
B. Tools and Information Sources ................................................................................ 265
C. Long Range Electric System Plan.............................................................................. 267
D. Electric Distribution System Operations Whitepaper .................................................. 268
E. Location Specific T&D Avoided Cost Study Report ...................................................... 269
F. Central Hudson Storage Pilot Project Final Report ...................................................... 270
G. EV Readiness Framework ....................................................................................... 271
H. Benefit Cost Analysis (BCA) Handbook ...................................................................... 272
I. Sample Distribution Automation Study ..................................................................... 273

iii
Acronyms and Abbreviations
Acronyms and abbreviations are used extensively throughout this report and are presented here for ease
of reference.
ACRONYM DEFINITION
AICPA Certified Public Accountants
ALT Automatic Load Transfer
AMI Advanced Metering Infrastructure
ASCR Aluminum Conductor Steel-Reinforced Cable
BESS Battery Energy Storage System
BCA Benefit Cost Analysis
CCA Community Choice Aggregators
CDD Cooling Degree Days
Central Hudson (Company)
Central Hudson Gas and Electric Corporation
CEII Critical Energy Infrastructure Information
CHP Combined Heat and Power
CIP Critical Infrastructure Protection
CIS customer information system
Commission or PSC Public Service Commission
CVR Conservation Voltage Reduction
DA Distribution Automation
DERs Distributed Energy Resources
DLP Data Loss Prevention
DMS Distribution Management System
DPS Department of Public Service
DR Demand Response
DRV Demand Reduction Value
DSIP Distributed System Implementation Plan
DSP Distributed System Platform
EAM Earnings Adjustment Mechanism
EDI Electronic Data Interchange
EE Energy Efficiency
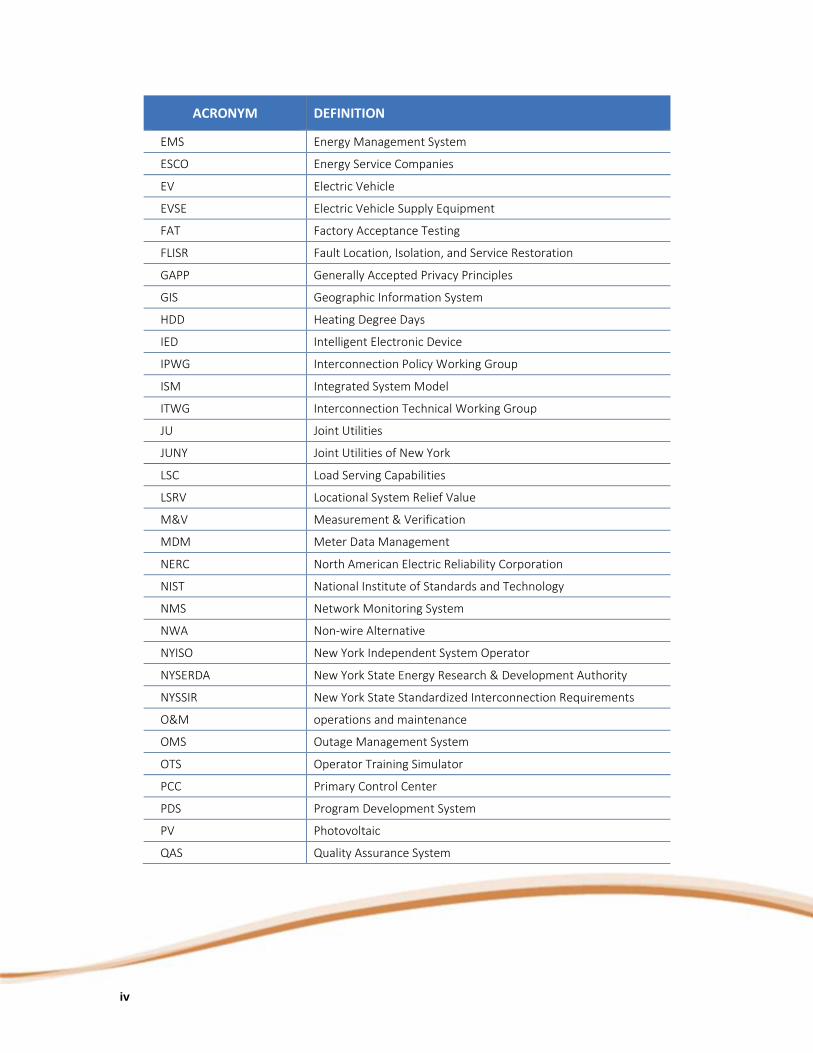
iv
ACRONYM DEFINITION
EMS Energy Management System
ESCO Energy Service Companies
EV Electric Vehicle
EVSE Electric Vehicle Supply Equipment
FAT Factory Acceptance Testing
FLISR Fault Location, Isolation, and Service Restoration
GAPP Generally Accepted Privacy Principles
GIS Geographic Information System
HDD Heating Degree Days
IED Intelligent Electronic Device
IPWG Interconnection Policy Working Group
ISM Integrated System Model
ITWG Interconnection Technical Working Group
JU Joint Utilities
JUNY Joint Utilities of New York
LSC Load Serving Capabilities
LSRV Locational System Relief Value
M&V Measurement & Verification
MDM Meter Data Management
NERC North American Electric Reliability Corporation
NIST National Institute of Standards and Technology
NMS Network Monitoring System
NWA Non-wire Alternative
NYISO New York Independent System Operator
NYSERDA New York State Energy Research & Development Authority
NYSSIR New York State Standardized Interconnection Requirements
O&M operations and maintenance
OMS Outage Management System
OTS Operator Training Simulator
PCC Primary Control Center
PDS Program Development System
PV Photovoltaic
QAS Quality Assurance System

v
ACRONYM DEFINITION
REV Reforming the Energy Vision
SAT System Acceptance Testing
SCADA Supervisory Control and Data Acquisition
SIEM System Information and Event Management
T&D Transmission and Distribution
UBP Uniform Business Practices
VDER Value of Distributed Energy Resources
VVO Volt/VAr Optimization

vi

Executive Summary
1
I. Executive Summary Central Hudson Gas and Electric Corporation (Central Hudson or Company) is a regulated gas and electric
utility serving the Hudson Valley of New York State. The Company provides electric and gas transmission
and distribution (T&D) services to approximately 302,000 electric customers and 80,000 natural gas
customers. Figure I-I illustrates the Central Hudson territory, which extends from the suburbs of
metropolitan New York City north to the Capital District at Albany covering approximately 2,600 square
miles. The electric system is comprised of over 620 miles of transmission, 7,300 miles of overhead
distribution and over 1,400 miles of underground distribution.
Figure I-I: Central Hudson Service Territory
Executive Summary
2
As a result of slowdowns in the regional and state economy, energy efficiency (EE) programs and, to a
much smaller extent, integration of primarily small-scale photovoltaic (PV) systems, the system peak has
shown a steady decline in recent years. The actual system peak in 2017 was 1,034 MW (1,050 MW on a
normalized basis). Due to the continued forecasted economic decline in the Hudson Valley, the
normalized peak forecast for 2023 is even lower, 1,081 MW and when the effects of DER are included the
system peak drops further to 1,011 MW. . This compares to a Central Hudson’s all time electric system
peak demand of 1,295 MW set in 2006.
As a result of the observed and forecasted reduction in system demand growth, the majority of the
Company’s electric capital expenditures are focused on replacing existing infrastructure based on
condition assessment. In addition to the infrastructure programs, the Company has continued its effort
implementing several projects designed to improve the intelligence of its system and provide tangible
benefits to its customers. These efforts include the installation of a Distribution Management System
(DMS), increased levels of Distribution Automation (DA), and an enterprise Network Strategy
communication system that allows field devices to communicate with corporate operational technology
assets, including the DMS and the Energy Management System (EMS). These deployments were approved
in the Company’s prior rate cases, began in 2015, and have the added benefit of being foundational to
meet the future needs envisioned by the Public Service Commission (Commission) in its Reforming the
Energy Vision (REV) efforts.
The Commission’s Order Adopting Distributed System Implementation Plan (DSIP) Guidance issued on
April 20, 2016, describes the need to develop a more transactional, distributed electric grid that meets
the demands of the modern economy and includes improvements in system efficiency, resilience, and
carbon emissions reductions. In response to the transitioning utility model, the Commission defined a set
of functions of the modern utility that are called the Distributed System Platform (DSP). The DSP functions
combine planning and operations with the enabling of the markets. The process by which improved
planning and operations are defined and implemented is the DSIP.
Central Hudson continued to put significant effort into progressing the DSP as outlined in its initial DSIP
filing. In addition to establishing an internal team of subject matter experts to develop the filing, the
Company has worked collaboratively with various stakeholder groups as well as the state’s jurisdictional
electric utilities. As such, this DSIP Update has benefited from a collaborative process with the Joint
Utilities of New York, DPS Staff, and stakeholders. The Joint Utilities are working collaboratively to
progress the DSPs as consistently as possible across the state while recognizing the inherent differences
of each of the utility’s systems. To facilitate the review of each utility’s 2018 DSIP Update, the Joint
Utilities are presenting their plans in alignment with a standard table of contents and leveraging common
language and figures. Where appropriate, the language and figures may be adapted to reflect the
progress and plans of a specific utility.

Executive Summary
3
The filing is segregated into four main sections:
Section I Progressing the Distributed System Platform: This section provides a high level summary of the future vision of the DSP and the progress made in the DSP through the Joint Utility efforts and by Central Hudson in the areas of DER Integration, Market Services, and Information Sharing. The progress Central Hudson has made in its pilot programs is discussed, as are other innovations including the investments in DA, DMS, Network Strategy, and an electric geographic information system (GIS) project.
Section III DSIP Update Topical Sections: This section provides an update on the various topical sections including Integrated Planning, Advanced Forecasting, Grid Operations, Energy Storage Integration, Electric Vehicle Integration, Energy Efficiency Integration and Innovation, Distribution System Data, Customer Data, Cyber Security, DER Interconnections, Advanced Metering Infrastructure, Hosting Capacity, Beneficial Locations for DERs and Non-Wires Alternatives, and Procuring Non-Wires Alternatives.
Section IV Other DSIP Information: Included in this section is an overview of the DSIP Governance which details how the plans and actions from the DSIP are implemented through the company, the summary of the Marginal Cost of Service Study, and the Benefit Cost Analysis Manual.
Section V Appendices: This section will include a number of detailed sections that provide further information and support for our efforts and direction, including Load and DER forecasting, the Avoided T&D Cost Study, the BCA Handbook, various Central Hudson planning and operation documents, and Tools and Other Resources for customers and developers.
Central Hudson, through its implementation of the 2016 DSIP, has made significant improvements in the
areas of Distributed Energy Resource (DER) Integration, Information Sharing, and Market Services.
Additionally, significant improvements have been made in the focus areas of Distribution System
Planning, Grid Operations, and Market Operations.
Foundational Investments to a Smarter Grid
In the 2016 DSIP and in its prior and subsequent rate plans, Central Hudson outlined a number of
Foundational Investments as part of its Smart Grid Strategy designed to improve system reliability,
improve system and customer efficiency, further enable DER integration, defer distribution capital
investment by leveraging redundancy, and position itself for the transition from a static to a dynamic
distribution operating system. Central Hudson’s Smart Grid Strategy can be summarized along three
major functional components:
1. Distribution Automation (DA) – automated devices, distribution infrastructure (poles and wires)
2. Distribution Management System (DMS) – the centralized software “brains”
Executive Summary
4
3. Network Communications Strategy – the two-way communication system between the DA
devices and DMS
Central Hudson continues on this integrated Smart Grid Strategy to develop Network Communications
and a Distribution Management System, install Distribution Automation equipment and monitoring, and
create ESRI based GIS models of the distribution system. Central Hudson has successfully implemented its
Distribution Automation in two of its five operating areas and is on a path to complete this
implementation system wide by 2021. In addition to the hardware and software efforts, Central Hudson
has also developed a plan to address the personal and operations need through the development of a
Transmission and Distribution System Operations control center and training academy. This dual purpose
facility will allow for the full development of the facilities and staff necessary to implement the Grid
Operations aspect of the DSP. This will continue to be the focus of much of our investment in the DSP
over the next five years.
Forecasting and Planning with DER
Also as outlined in the 2016 DSIP, Central Hudson has progressed its Integrated System Planning Process
from the more traditional deterministic peak load forecast and planning process to a more probabilistic
granular hourly load forecasting and planning process. As part of this DSIP update, Central Hudson has
further advanced this effort through the development of a more probabilistic and granular DER forecast
for Energy Efficiency, Electric Vehicles, and Distributed Generation. In addition, the Company has made
significant progress on system modeling, capturing components across all areas of the system not
previously modeled: conductor size and length, protective elements, phasing, and key customer
transformer information. This information was input to the OMS and GIS system, and in turn, the Planning
load flow models. The data is critical in the rollout of devices and needed system reinforcements for the
implementation of distribution automation.
Satisfying the Developers Data Needs
Central Hudson, primarily working in conjunction with the Joint Utilities, continues to make
improvements in the areas of accessible Customer and System Data. Central Hudson has made great
strides in developing and providing public access to Customer and System Data. We have developed
various GIS map-based data portals that provide access to granular 8760 load data (both historic and
forecasted) and Hosting Capacity data. In addition, data maps including beneficial locations and Non Wire
Alternative areas as well as links to other resources such as reliability data, capital plans, DSIP plans, DER
interconnections, and aggregated customer data have all been developed and made publically available
through Central Hudson’s website or through the Joint Utility website. We will continue to work with the
Joint Utilities and the stakeholders to further refine the data provided and how this data is made
accessible.

Executive Summary
5
Improving the Interconnection of DER
Other areas where Central Hudson has progressed, along with the other Joint Utilities, is in the areas of
Hosting Capacity and DER Integration. Central Hudson played a lead role in the development of the
Hosting Capacity Roadmap, leading the Joint Utility group as the information being provided has been
refined, advanced to include additional data elements requested by stakeholders, and presented in a
consistent format across the utilities. In addition, Central Hudson continues to lead the efforts in DER
Integration on both the Integration Policy Working Group and Integration Technical Working Group.
Through these efforts we have been able to develop a way to manage the SIR queue, develop consistent
requirements for interconnection, and progress our PowerClerk portal for interconnection applications.
These efforts resulted in much greater clarity for developers in the state, allowing for much more efficient
DER development.
Addressing Cyber Security
Regarding Cyber Security, Central Hudson recognizes the importance of maintaining system integrity
during this expansion of functionality related to DERs and the DSP. To address these concerns, Central
Hudson has developed a Cyber Security of Operational Technology (CSOT) approach which takes a CIP
Standards approach to non-CIP assets, applying the same principles as CIP, but not within the CIP
program. This ensures that the same Cyber Security standards that we use for other critical utility systems
are consistently applied to the DSP.
Advancing New Forms of DER
In the areas of Energy Storage Integration and Electric Vehicle Integration, consistent with the actions by
the Commission, Central Hudson has begun a new strategic focus to advance the understanding of the
role of the utility in these markets. Central Hudson has been active in the various policy cases and joint
utility activities in these areas and will continue to actively participate in the PSC Cases related to the
Energy Storage Roadmap and Electric Vehicle Supply Equipment. Regarding Energy Storage, we have
actively worked to identify beneficial energy storage applications for implementation; however, we have
yet to identify any cost effective use cases for Battery Energy Storage Systems. As for Electric Vehicle
Integration, Central Hudson externally worked with the Joint Utilities to develop the EV Readiness
Framework and internally initiated a new strategic focus on Electric Vehicles and beneficial electrification,
establishing program leadership and a cross functional team. With what we have learned over the past
few years and this new strategic focus, we are poised to progress both of these aspects of the DER
market at a rapid pace.

Executive Summary
6
Investing in Infrastructure
Central Hudson’s service territory continues to show an overall reduction in system peak with few areas
showing any load growth. Central Hudson’s Capital Expansion Plans remain primarily focused on
addressing infrastructure issues related to needed equipment replacement or upgrades. In doing so,
Central Hudson is able to leverage these investments to also improve system reliability and resiliency,
hosting capacity, and operating flexibility, all of which will improve the functionality of the distribution
system and position us well for the continued growth of DERs in the service territory.
Advancing Non-Wires Alternatives
As for the areas where Central Hudson has seen system growth, these are being addressed by the
implementation of Non Wire Alternatives as appropriate. Since the inception of its Non Wire Alternative
program in 2014, Central Hudson has identified and/or implemented four Non Wire Alternative projects
covering approximately 16% of our load areas. While this has led to the deferral of capital projects related
to growth in those areas and an increase in DERs, it has also resulted in a continued reduction in the
broader system Locational System Relief Value and the Demand Reduction Value.
In summary, Central Hudson continues to progress the DSP through its individual efforts as well as the
efforts of the Joint Utilities. We remain fully supportive of working with the stakeholders, the
Commission, and the other utilities on improving transparency and data sharing. Additionally, we strive to
meet the objectives of the REV in a cost effective manner for all customers and with full transparency of
all costs including both supply and delivery.

Progressing the Distributed System Platform
7
II. Progressing the Distributed System Platform A. Introduction Central Hudson and the Joint Utilities have focused Distributed System Platform (DSP) implementation
efforts on three core aspects of the platform: Distributed Energy Resource (DER) Integration, Information
Sharing, and Market Services. These core aspects include the basic focus areas from the 2016 DSIP:
Distribution System Planning, Grid Operations, and Market Operations. The progress achieved in these
areas and described in this DSIP will benefit customers and market participants by (1) providing more and
better information that helps them to make informed market choices, (2) stimulating DER deployment by
facilitating the realization of DERs value, and (3) implementing planning and operational methodologies
and infrastructure that allows continued safe and reliable system operation at higher DER penetration
levels.
The results of this current “DSP 1.0” version of the DSP will be more DERs on our system and across New
York and the potential for, improved system efficiency, more resource diversity, lower emissions of
greenhouse gases, and the animation of market services. DERs will have better access to market value
through multiple market mechanisms, and in turn, the system will benefit from an enhanced ability of
DERs to provide grid services.
The progress outlined in this DSIP will also advance Central Hudson and the Joint Utilities toward the
longer term vision of the DSP and beyond, discussed below.

Progressing the Distributed System Platform
8
B. Long Term Vision
1. Introduction
Over the next decade, New York’s electricity system will become significantly cleaner, more efficient,
more flexible, more reliable, and more resilient. This transformation of the electricity system will play a
central role in the decarbonization of the state’s economy. Distributed energy resources (DERs) – end-use
energy efficiency, demand response, distributed storage, and distributed generation1 – are expected to
be a key part of this transformation. To facilitate adoption and grid integration of these resources, Central
Hudson and the Joint Utilities are developing distributed system platforms (DSPs) that will offer DER
products and services, creating new sources of value for customers and market participants.
As described in this filing, Central Hudson has made substantial progress in laying a foundation for its DSP.
Building upon this early progress requires a vision of how DSP functions and capabilities will evolve in the
foreseeable future.
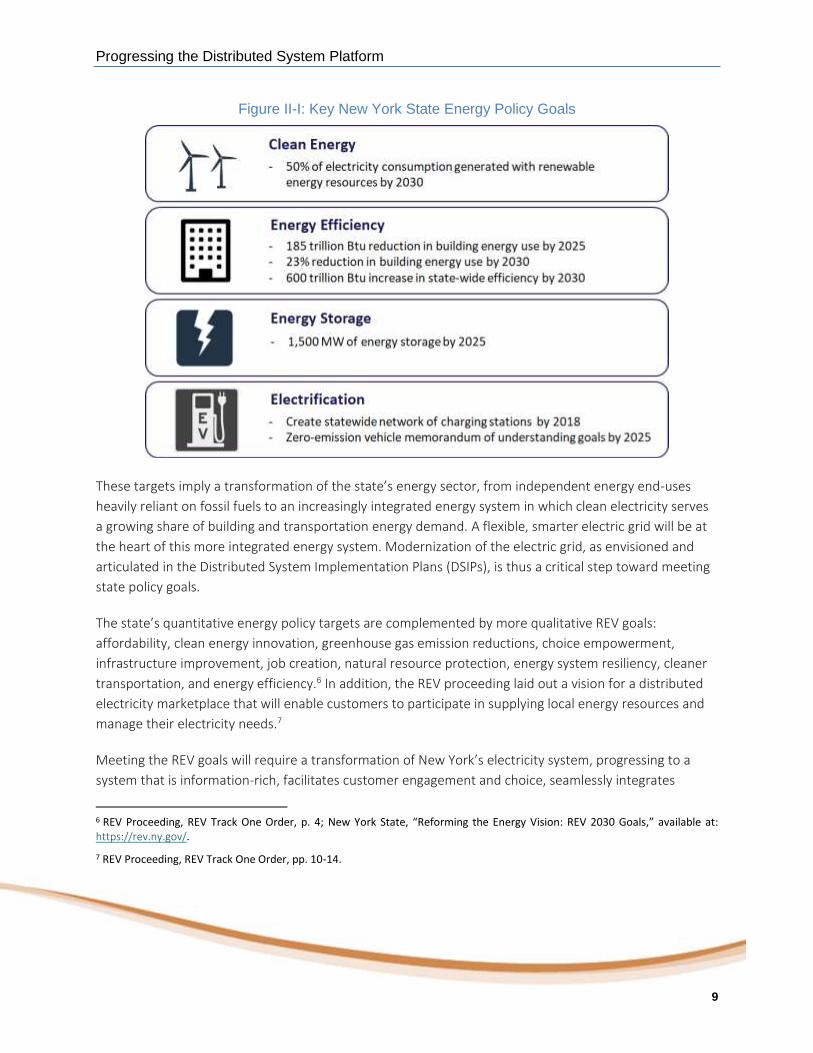
The creation of DSPs is occurring within the broader context of New York’s energy policy goals and its
vision of a sustainable, low-carbon future. Quantitative targets for this vision were established in the
State Energy Plan2 and reinforced and supplemented by the Governor’s 2018 State of the State address.3
These targets include efforts to significantly expand renewable energy, energy storage, and energy
efficiency (Figure II-I). Additionally, the state has established goals for zero emission vehicles (ZEV)4 and is
actively promoting electric vehicle (EV) adoption and a build-out of EV charging infrastructure.5
1 Case 14-M-0101 - Proceeding on Motion of the Commission in Regard to Reforming the Energy Vision (REV Proceeding), Order Adopting regulatory Policy Framework and Implementation Plan (issued February 26, 2016)( (REV Proceeding), , p. 3.
2 New York State Energy Planning Board, 2015 New York State Energy Plan, available at: https://energyplan.ny.gov/Plans/2015.aspx.
3 “Governor Cuomo Unveils 20th Proposal of 2018 State of the State: New York's Clean Energy Jobs and Climate Agenda,” available at: https://www.governor.ny.gov/news/governor-cuomo-unveils-20th-proposal-2018-state-state-new-yorks-clean-energy-jobs-and-climate
4 Multi-State ZEV Task Force, State Zero-Emission Vehicle Programs: Memorandum of Understanding (October 24, 2013), available at: https://www.zevstates.us/.
5 New York State Energy Research and Development Authority (NYSERDA) website, “Electric Vehicle Programs,” available at: https://www.nyserda.ny.gov/Researchers-and-Policymakers/Electric-Vehicles/Electric-Vehicle-Programs.
Progressing the Distributed System Platform
9
Figure II-I: Key New York State Energy Policy Goals
These targets imply a transformation of the state’s energy sector, from independent energy end-uses
heavily reliant on fossil fuels to an increasingly integrated energy system in which clean electricity serves
a growing share of building and transportation energy demand. A flexible, smarter electric grid will be at
the heart of this more integrated energy system. Modernization of the electric grid, as envisioned and
articulated in the Distributed System Implementation Plans (DSIPs), is thus a critical step toward meeting
state policy goals.
The state’s quantitative energy policy targets are complemented by more qualitative REV goals:
affordability, clean energy innovation, greenhouse gas emission reductions, choice empowerment,
infrastructure improvement, job creation, natural resource protection, energy system resiliency, cleaner
transportation, and energy efficiency.6 In addition, the REV proceeding laid out a vision for a distributed
electricity marketplace that will enable customers to participate in supplying local energy resources and
manage their electricity needs.7
Meeting the REV goals will require a transformation of New York’s electricity system, progressing to a
system that is information-rich, facilitates customer engagement and choice, seamlessly integrates
6 REV Proceeding, REV Track One Order, p. 4; New York State, “Reforming the Energy Vision: REV 2030 Goals,” available at: https://rev.ny.gov/.
7 REV Proceeding, REV Track One Order, pp. 10-14.
Progressing the Distributed System Platform
10
distributed resources, and encourages clean energy resources and energy efficiency. The transition to this
future electricity system is being enabled by improvements in energy, information, communications, and
grid control technologies.
2. The Distributed System Platform Vision
Defining DSPs
The REV Track One Order defines DSPs as:
“an intelligent network platform that will provide safe, reliable and efficient electric services by
integrating diverse resources to meet customers’ and society’s evolving needs. The DSP fosters
broad market activity that monetizes system and social values, by enabling active customer and
third party engagement that is aligned with the wholesale market and bulk power system.”8
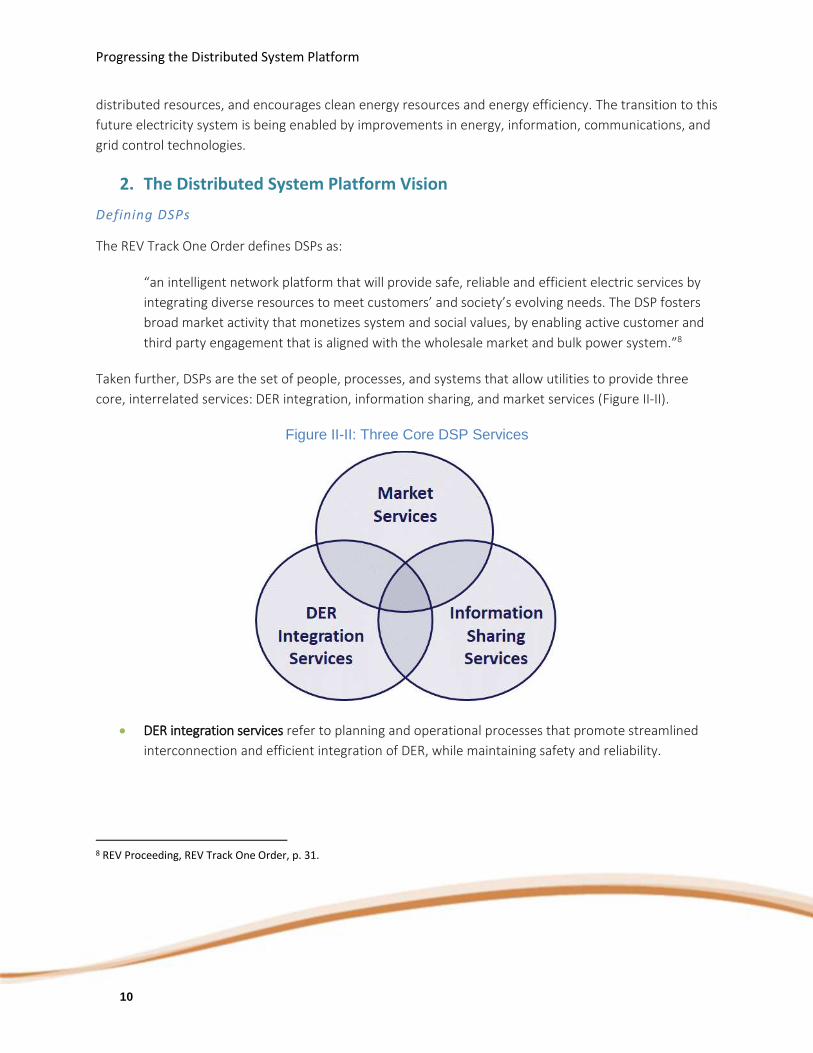
Taken further, DSPs are the set of people, processes, and systems that allow utilities to provide three
core, interrelated services: DER integration, information sharing, and market services (Figure II-II).
Figure II-II: Three Core DSP Services
DER integration services refer to planning and operational processes that promote streamlined
interconnection and efficient integration of DER, while maintaining safety and reliability.
8 REV Proceeding, REV Track One Order, p. 31.

Progressing the Distributed System Platform
11
Information sharing services refer to information and communications systems that collect,
manage, and share granular customer and system data, enabling customer choice and expanding
participation of third-party vendors and aggregators in markets for DER.
Market services refer to utility programs, procurement, wholesale market coordination, and
tariffs that create value for DER customers through market mechanisms.
DSP Function and Value
As DSP providers, Central Hudson is developing the capabilities, processes, and systems that will enable
key DSP functions: integrated planning, DER interconnection, and DER management (DER integration);
information management and customer engagement (information sharing); and procurement, market
coordination, wholesale tariff, and settlement and billing (market services). Figure II-III describes long-
term goals for each DSP function.
Figure II-III. Long-Term Goals for DSP Functions within Each Core DSP Service Area

Progressing the Distributed System Platform
12
As they evolve, DSPs will increasingly bring together suppliers and buyers of electricity services, becoming
more populated with information and transactions over time (Figure II-IV). DSPs will become a natural
marketplace for third-party aggregators and technology vendors to gather data and offer their services.
Figure II-IV. Illustration of the DSP as an Energy Marketplace
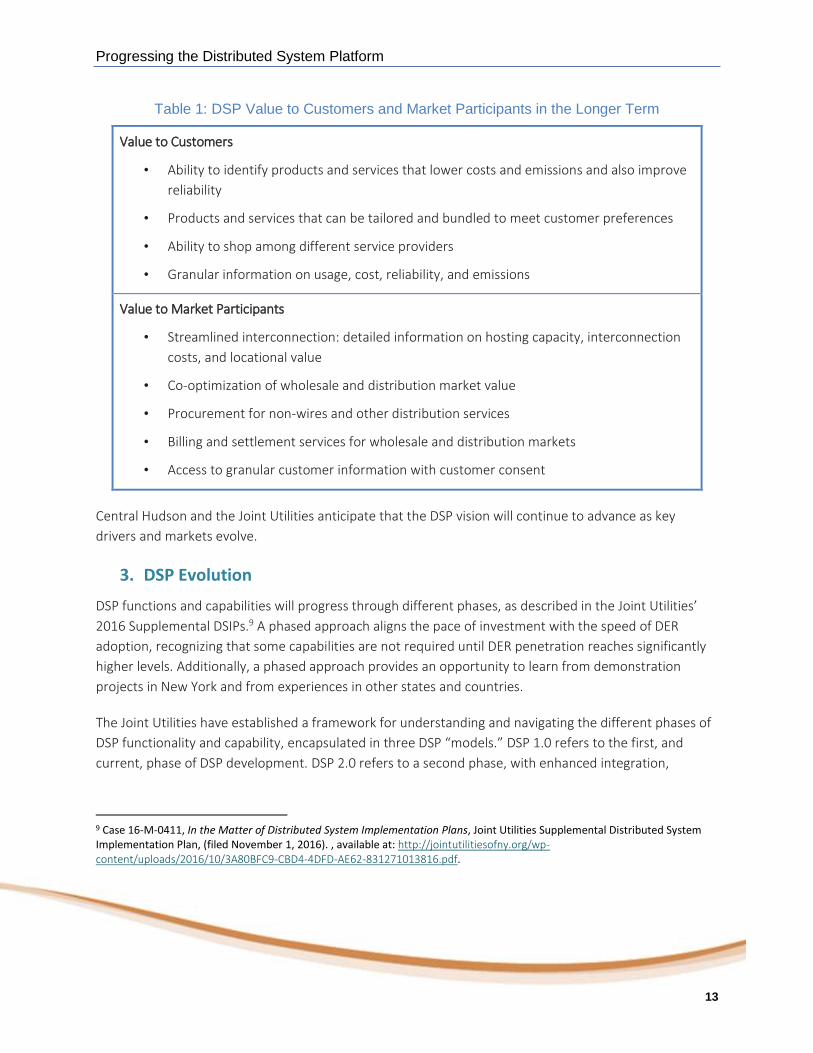
DSPs will open up new sources of value for electricity customers and market participants, by expanding
customer choice, enhancing DER integration, and maximizing the distribution and wholesale value of
DERs (Table 1).
Progressing the Distributed System Platform
13
Table 1: DSP Value to Customers and Market Participants in the Longer Term
Value to Customers
• Ability to identify products and services that lower costs and emissions and also improve
reliability
• Products and services that can be tailored and bundled to meet customer preferences
• Ability to shop among different service providers
• Granular information on usage, cost, reliability, and emissions
Value to Market Participants
• Streamlined interconnection: detailed information on hosting capacity, interconnection
costs, and locational value
• Co-optimization of wholesale and distribution market value
• Procurement for non-wires and other distribution services
• Billing and settlement services for wholesale and distribution markets
• Access to granular customer information with customer consent
Central Hudson and the Joint Utilities anticipate that the DSP vision will continue to advance as key
drivers and markets evolve.
3. DSP Evolution
DSP functions and capabilities will progress through different phases, as described in the Joint Utilities’
2016 Supplemental DSIPs.9 A phased approach aligns the pace of investment with the speed of DER
adoption, recognizing that some capabilities are not required until DER penetration reaches significantly
higher levels. Additionally, a phased approach provides an opportunity to learn from demonstration
projects in New York and from experiences in other states and countries.
The Joint Utilities have established a framework for understanding and navigating the different phases of
DSP functionality and capability, encapsulated in three DSP “models.” DSP 1.0 refers to the first, and
current, phase of DSP development. DSP 2.0 refers to a second phase, with enhanced integration,
9 Case 16-M-0411, In the Matter of Distributed System Implementation Plans, Joint Utilities Supplemental Distributed System Implementation Plan, (filed November 1, 2016). , available at: http://jointutilitiesofny.org/wp-content/uploads/2016/10/3A80BFC9-CBD4-4DFD-AE62-831271013816.pdf.

Progressing the Distributed System Platform
14
information, and market services. DSP 2.x refers to a longer-term phase of DSP development,
characterized by the emergence of transactional distribution markets.
This chapter focuses on DSP 1.0 and 2.0 and the transition between them, describing three key aspects of
DSP evolution: (1) function and capability, (2) customer value, and (3) enabling investments and
conditions.
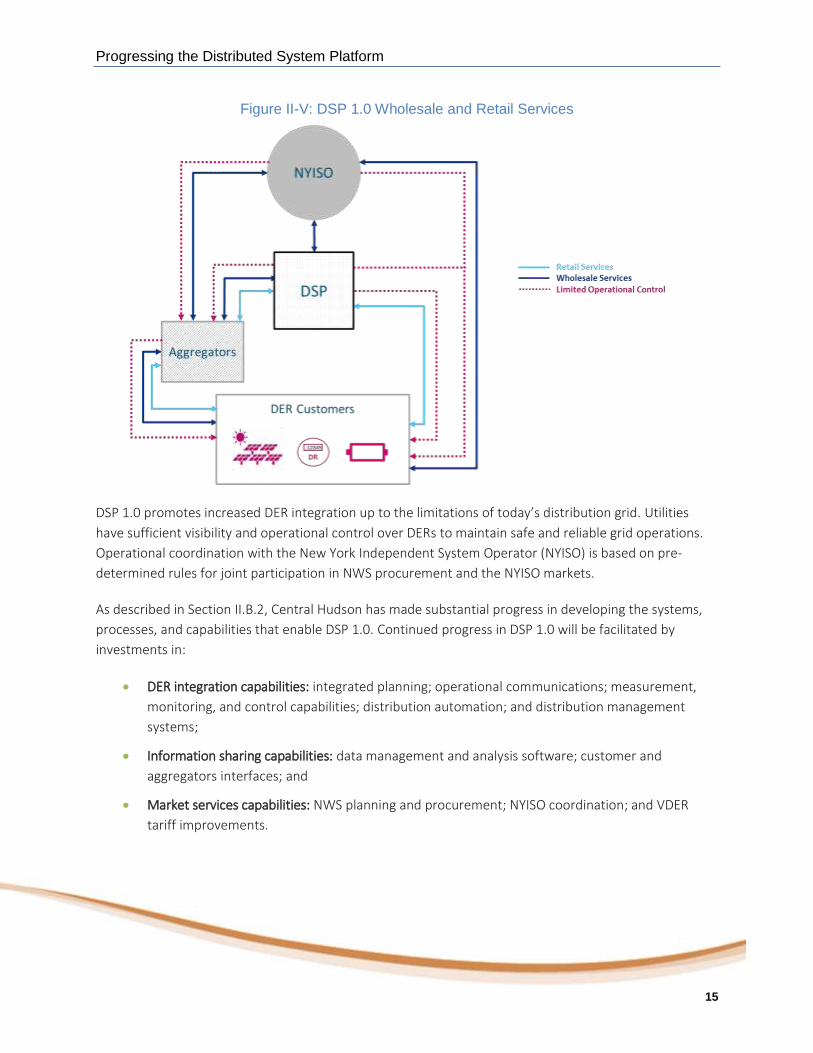
DSP 1.0
In DSP 1.0, utilities create foundations for the platform, which enables:
More streamlined interconnection and enhanced distribution system measurement, monitoring,
and control capabilities;
Safe operation of the grid with increasingly higher levels of DERs;
More accessible, granular information on customer use and closer engagement with customers
and aggregators through information portals; and
Regular non-wires solutions (NWS) procurement and incorporation of wholesale value through
the value of DER (VDER) tariff.
In this phase, DSPs provide retail settlement and billing services to customers based on VDER and
wholesale settlement and billing services to aggregators for NWA procurement (Figure II-V). DER
aggregators and their customers can also access wholesale settlement and billing services through the
New York Independent System Operator (NYISO).
Progressing the Distributed System Platform
15
Figure II-V: DSP 1.0 Wholesale and Retail Services
DSP 1.0 promotes increased DER integration up to the limitations of today’s distribution grid. Utilities
have sufficient visibility and operational control over DERs to maintain safe and reliable grid operations.
Operational coordination with the New York Independent System Operator (NYISO) is based on pre-
determined rules for joint participation in NWS procurement and the NYISO markets.
As described in Section II.B.2, Central Hudson has made substantial progress in developing the systems,
processes, and capabilities that enable DSP 1.0. Continued progress in DSP 1.0 will be facilitated by
investments in:
DER integration capabilities: integrated planning; operational communications; measurement,
monitoring, and control capabilities; distribution automation; and distribution management
systems;
Information sharing capabilities: data management and analysis software; customer and
aggregators interfaces; and
Market services capabilities: NWS planning and procurement; NYISO coordination; and VDER
tariff improvements.

Progressing the Distributed System Platform
16
Section II.E of this filing (Grid Modernization and the DSP Technology Platform) describes these
investments and the respective grid functionality provided in greater detail.
DSP 2.0
DSP 2.0 builds on the functions and capabilities of DSP 1.0, adding significantly greater visibility and
operational control over DERs. Greater visibility and operational control allow for the creation of
integrated markets for wholesale and distribution services.
In DSP 2.0, DSPs offer wholesale scheduling and dispatch services, allowing customers and aggregators to
maximize the value of their resources across NYISO wholesale markets and distribution markets.
Aggregators can still access wholesale markets directly through the NYISO (Figure II-VI). The NYISO also
has enhanced capabilities to monitor and control DERs.
Figure II-VI: DSP 2.0 Wholesale and Retail Services and Operational Control
Via DSP market platforms, DSP 2.0 provides an additional “wholesale services” route for DER customers
to deliver their services to markets – illustrated by the solid blue line connecting DER Customers and the
DSP in Figure II-VI. These market platforms will be described in greater detail in the DSP Market Design
and Integration Report.

Progressing the Distributed System Platform
17
Several functions and capabilities in DSP 2.0 do not yet exist and require innovations in software, systems,
and process. For instance, DSP 2.0 is characterized by much larger volumes of information flow, which
require new approaches and tools for data management and analysis. The protocols, processes, and
software enabling near real-time DER control also require innovation and development.
DSP 1.0 and 2.0 are distinguished by key high-level differences in platform function and capability rather
than checklists of essential features. Thus, the transition from DSP 1.0 to 2.0 could occur over multiple
years, with variation among utilities. Timelines for individual utilities will depend on grid topology,
funding, and need.
With further market and technology development, DSP 2.0 could eventually evolve to DSP 2.x, where DER
penetration is substantially larger than it is today, loads are highly price sensitive, and decentralized
transactions are feasible on a larger scale.
The remaining chapters of this filing focus on building the functions and capabilities necessary to continue
progress in DSP 1.0 and lay the groundwork for DSP 2.0.

Progressing the Distributed System Platform
18
C. DSP Progress and Implementation Roadmap
1. DER Integration
DER Integration encompasses the planning, operational, and infrastructural initiatives associated with
implementing the DSP. This includes, but is not limited to, distribution system infrastructure upgrades,
evolution of planning methodologies, operational changes, and general reduction of barriers to DER
adoption. The goal of this aspect of the platform is to maintain safety and reliability in a higher DER
penetration environment, enabling DERs to come onto the grid faster, cheaper, and with greater levels of
visibility, allowing for greater provision of grid services and more access to value streams.
Prior to the outset of REV, utilities invested in technologies that could be considered foundational to the
functioning of the DSP. Planning methodologies and processes at the time (including DER
interconnection, forecasting, and capital investment planning) were calibrated to accommodate the
prevailing level of DER market penetration and had not yet been aligned with REV goals regarding
enablement and management of a high-DER environment.
Pursuant to the DSIP Order of April 2016, and as outlined in the Supplemental DSIP, the Joint Utilities met
with stakeholders in 2016 to formulate DSP enablement plans addressing the shift towards higher DER
deployment on the system. In the two years since, the plans continue to evolve. Through June 2018, the
Central Hudson and the Joint Utilities have implemented several key DER Integration initiatives, which are
summarized in Figure II-VII.
Figure II-VII: Actions and Results in DER Integration through June 2018
Actions Results
Created online application portal Streamlined DER interconnection process
Provided access to circuit-level hosting
capacity data
Developers able to target less costly locations
for DER interconnection
Incorporated DERs into forecasting in a more
robust and granular fashion
DER forecasting as a standard part of the
planning process; opens up NWA
opportunities, VDER LSRV zones
Established common interim monitoring and
control standards for PV
Maintains system reliability/safety under
current DER penetration and enables advanced
market functions
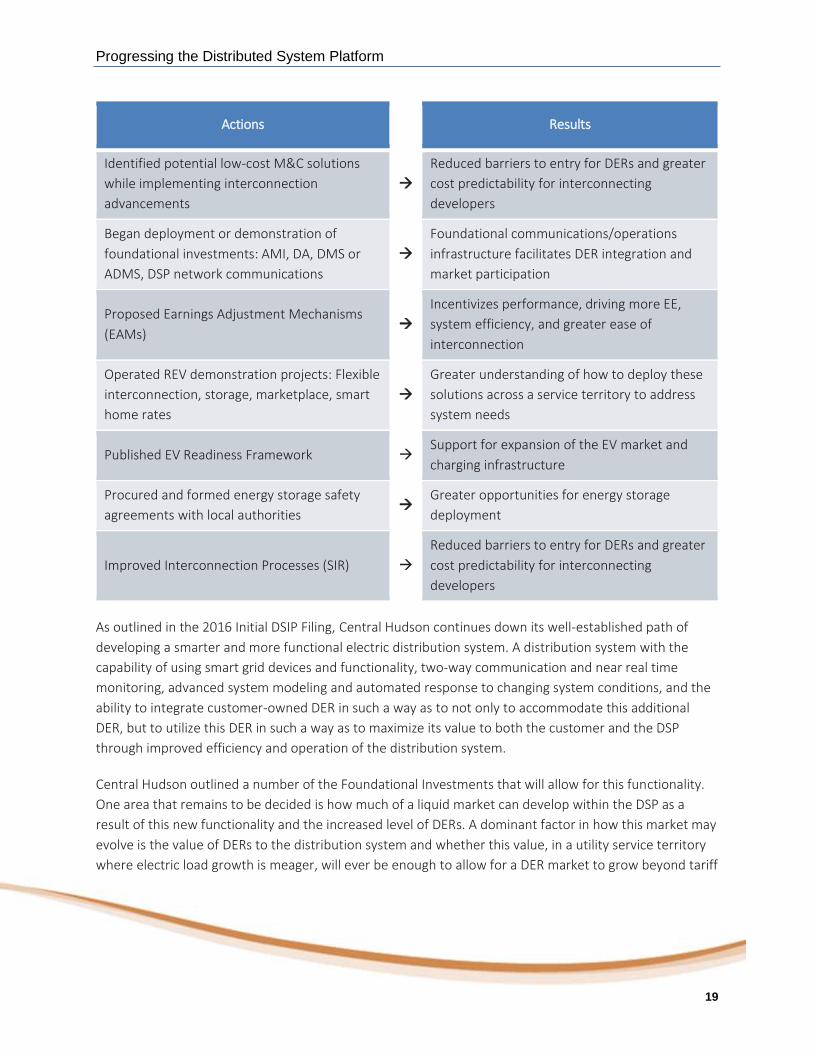
Progressing the Distributed System Platform
19
Actions Results
Identified potential low-cost M&C solutions
while implementing interconnection
advancements
Reduced barriers to entry for DERs and greater
cost predictability for interconnecting
developers
Began deployment or demonstration of
foundational investments: AMI, DA, DMS or
ADMS, DSP network communications
Foundational communications/operations
infrastructure facilitates DER integration and
market participation
Proposed Earnings Adjustment Mechanisms
(EAMs)
Incentivizes performance, driving more EE,
system efficiency, and greater ease of
interconnection
Operated REV demonstration projects: Flexible
interconnection, storage, marketplace, smart
home rates
Greater understanding of how to deploy these
solutions across a service territory to address
system needs
Published EV Readiness Framework Support for expansion of the EV market and
charging infrastructure
Procured and formed energy storage safety
agreements with local authorities
Greater opportunities for energy storage
deployment
Improved Interconnection Processes (SIR)
Reduced barriers to entry for DERs and greater
cost predictability for interconnecting
developers
As outlined in the 2016 Initial DSIP Filing, Central Hudson continues down its well-established path of
developing a smarter and more functional electric distribution system. A distribution system with the
capability of using smart grid devices and functionality, two-way communication and near real time
monitoring, advanced system modeling and automated response to changing system conditions, and the
ability to integrate customer-owned DER in such a way as to not only to accommodate this additional
DER, but to utilize this DER in such a way as to maximize its value to both the customer and the DSP
through improved efficiency and operation of the distribution system.
Central Hudson outlined a number of the Foundational Investments that will allow for this functionality.
One area that remains to be decided is how much of a liquid market can develop within the DSP as a
result of this new functionality and the increased level of DERs. A dominant factor in how this market may
evolve is the value of DERs to the distribution system and whether this value, in a utility service territory
where electric load growth is meager, will ever be enough to allow for a DER market to grow beyond tariff
Progressing the Distributed System Platform
20
based programs or targeted NWA solicitations. Central Hudson will continue to work with the other Joint
Utilities, Stakeholders, and the PSC to develop a common understanding and definition for the Value of D
and how this value can be best offered to the market. Central Hudson will also work with the Joint
Utilities and the NYISO to ensure that any market developed within the DSP is well coordinated and
complementary to the wholesale market administered by the NYISO and regulated by FERC.
In the interim, Central Hudson’s vision for the DSP is one where increased functionality, visibility, and
control of the distribution system will allow for improved operation, efficiency, reliability, and increased
DER interconnection.
While these are outputs described in greater detail in later sections, some highlights are described briefly
below.
The Interconnection Technical Working Group has approved updated monitoring and control
requirements to ensure system reliability as DER penetration increases. The Joint Utilities have also
achieved a partially automated interconnection application process through completion of Phase 1 of the
Interconnection Online Application Portal (IOAP), an online submission portal that streamlines the
process. This is a milestone in a phased roadmap presented in the Supplemental DSIP to achieve various
functionality improvements throughout the interconnection process, with the final “full automation”
phase in the future. The utilities have also proposed interconnection earnings adjustment mechanism
metrics to align incentives with strong performance in timely interconnection and developer satisfaction.
In order to outline and implement standard operating practices across all levels of the transmission and
distribution system, the Joint Utilities have coordinated with the NYISO to propose operational DSP -
NYISO coordination protocols. These protocols propose approaches for DSP dual participation as a
provider of both local distribution services and wholesale energy in NYISO markets, which could allow
DERs to access multiple value streams, without impacting the reliability of the wholesale or distribution
system.
Central Hudson and the Joint Utilities have also collaborated in shared learning on more advanced
forecasting approaches, including incorporation of probabilistic methodologies. Enhanced forecasting is
supporting more granular Marginal Cost of Service studies which underlie more accurate and updated
Locational System Relief Values (LSRV) as part of the Value of DER (VDER) Phase 1 tariff. These improved
forecasting initiatives are helping to more accurately align DER compensation with grid value through
price signals, one of the core goals of the DSP.
Central Hudson both individually and in conjunction with the Joint Utilities will continue to advance and
expand both internal and stakeholder-facing shared learning opportunities in the deployment of
advanced metering and DER management systems, as well as through the operation of REV

Progressing the Distributed System Platform
21
demonstration projects exploring flexible interconnection, storage, online marketplaces, smart home
rates, and transportation electrification. These initiatives are critical foundations for understanding how
to most effectively integrate new technologies, projects, and policies to enable rapidly increasing DER
penetration.
Through 2020 and beyond, further advancements in DER integration will drive continued progress
towards the next phases of the DSP. The implementation of earnings adjustment mechanisms (EAMs) will
align incentives with REV goals by compensating utilities based on key performance metrics. Ongoing
demonstration and deployment of foundational DSP technologies (such as ADMS, smart inverters, Energy
Storage, EV charging infrastructure, and expanded monitoring and control capabilities through direct
utility control, third-party aggregators, and the wholesale market operations) will enable active
management and coordination of DERs on the distribution system. In addition to these technical factors,
IOAP 3.0 and improved coordination with the NYISO and utility interconnection processes will further
streamline the DER interconnection process through increased automation, and DER forecasting will
become a standard part of Central Hudson’s planning process.
2. Market Services
While the distributed system platform must perform multiple functions, a key focus of the Track One and
Track Two Orders was evolving the New York market at the distribution level to allow DERs to bring value
to the system and be compensated on the basis of that value through enhanced market mechanisms. This
has also been a major focus for the Joint Utilities in the past two years. In DSP 1.0, the goal of the market
services aspect of the platform has been to provide DERs greater access to market value through
advances in the “3 P’s” (pricing, programs, and procurement), and the Joint Utilities have implemented a
number of steps in each of these areas to accomplish this goal.
At the outset of REV, none of the New York utilities had yet incorporated NWAs into their distribution
procurement processes.10 DERs were limited in their ability to offer services as an alternative to
traditional utility infrastructure investments and to offer new services to customers. A significant volume
of DERs on the system – mostly distributed photovoltaic systems – were compensated based on net
energy metering, a system which represented a useful provisional assessment of value but one that had
not yet been finely calibrated to the grid services provided by these resources. Through June 2018,
Central Hudson and the other Joint Utilities have implemented several key Market Services initiatives,
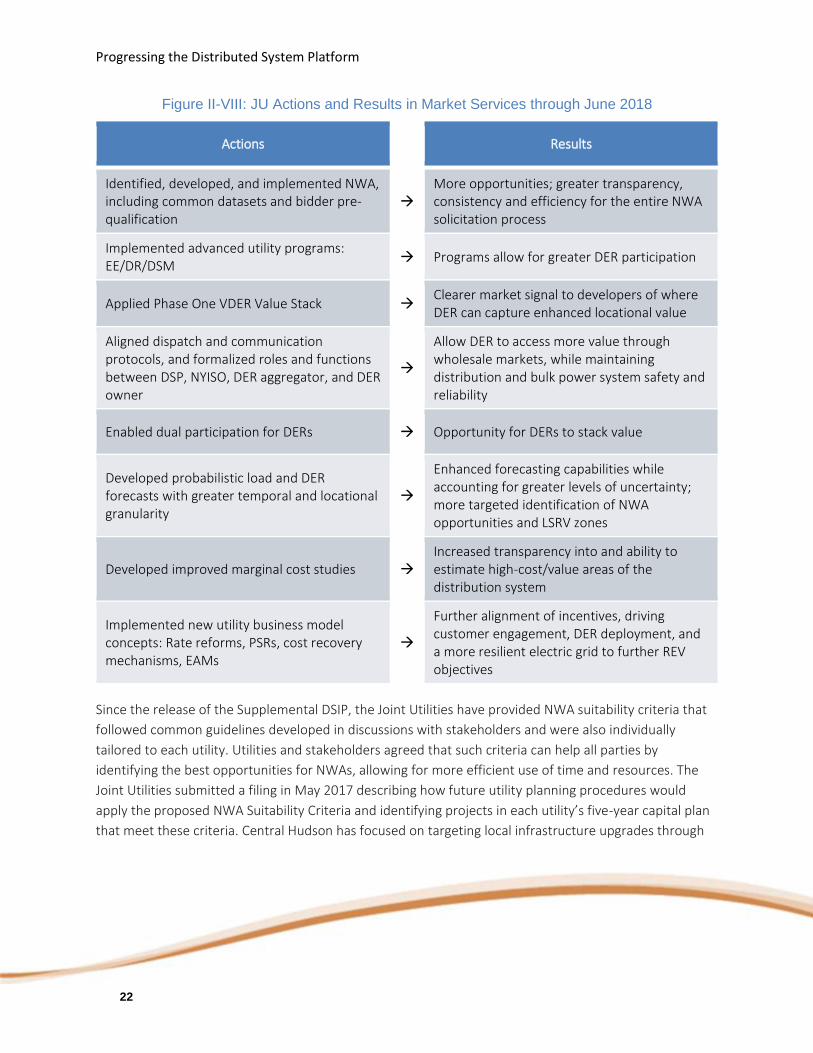
which are summarized in Figure II-VIII.
10 Con Edison’s Brooklyn-Queens Demand Management program was proposed in 2014 and Central Hudson’s initial NWA’s were proposed in its 2014 rate filing.
Progressing the Distributed System Platform
22
Figure II-VIII: JU Actions and Results in Market Services through June 2018
Actions Results
Identified, developed, and implemented NWA, including common datasets and bidder pre-qualification
More opportunities; greater transparency, consistency and efficiency for the entire NWA solicitation process
Implemented advanced utility programs: EE/DR/DSM
Programs allow for greater DER participation
Applied Phase One VDER Value Stack Clearer market signal to developers of where DER can capture enhanced locational value
Aligned dispatch and communication protocols, and formalized roles and functions between DSP, NYISO, DER aggregator, and DER owner
Allow DER to access more value through wholesale markets, while maintaining distribution and bulk power system safety and reliability
Enabled dual participation for DERs Opportunity for DERs to stack value
Developed probabilistic load and DER forecasts with greater temporal and locational granularity
Enhanced forecasting capabilities while accounting for greater levels of uncertainty; more targeted identification of NWA opportunities and LSRV zones
Developed improved marginal cost studies Increased transparency into and ability to estimate high-cost/value areas of the distribution system
Implemented new utility business model concepts: Rate reforms, PSRs, cost recovery mechanisms, EAMs
Further alignment of incentives, driving customer engagement, DER deployment, and a more resilient electric grid to further REV objectives
Since the release of the Supplemental DSIP, the Joint Utilities have provided NWA suitability criteria that
followed common guidelines developed in discussions with stakeholders and were also individually
tailored to each utility. Utilities and stakeholders agreed that such criteria can help all parties by
identifying the best opportunities for NWAs, allowing for more efficient use of time and resources. The
Joint Utilities submitted a filing in May 2017 describing how future utility planning procedures would
apply the proposed NWA Suitability Criteria and identifying projects in each utility’s five-year capital plan
that meet these criteria. Central Hudson has focused on targeting local infrastructure upgrades through
Progressing the Distributed System Platform
23
NWAs. To date, Central Hudson’s active NWA projects account for approximately 16% of its service
territory based on percent of load.
In procurement, the Joint Utilities have made substantial progress, as informed by discussions with
stakeholders. Multiple stakeholder meetings detailing the proposed NWA sourcing process both before
and since the Supplemental DSIP have generated important feedback on stakeholders’ desired
timeframes for notification of NWA opportunities, as well as standardization of required data and
requirements in response to requests-for-proposals (RFPs). Incorporating this feedback, the Joint Utilities
produced a set of NWA Suitability Criteria as a standard framework for evaluating potential utility NWA
investments, as well as a more detailed filing on the DER sourcing process. The Joint Utilities are
continuing to work toward increased standardization and simplification of that process.
As a result, four NWA opportunities have been identified in Central Hudson’s service territory since the
inception of this process improvement, and information about these opportunities has become available
sooner and through central online locations, and developers can expect to see increasing standardization
of the elements of RFPs, making responding easier and faster. These NWA opportunities have been
offered as technology neutral and as energy storage becomes more cost effective or able to access value
from the wholesale markets, we expect to see energy storage added to the more traditional technologies
of Demand Response, Energy Efficiency, and Distributed Generation.
In pricing, as noted above, the Joint Utilities have worked to incorporate multiple work streams including
new forecasting techniques and understanding of NWA suitability to provide inputs to the VDER Value
Stack working group. This is advancing the work within that proceeding to craft a tariff that is more
aligned with DER grid value and provide greater certainty of bankable revenue streams that support
financing of projects. The Joint Utilities have also put forward a longer-term vision for the relationship and
role in the marketplace between NWAs and tariffs like VDER, to help clarify the pathways through which
DERs can be developed and compensated.
The Joint Utilities have also worked on market services regarding specific DER technologies. One area of
focus has been supporting adoption of electric vehicles and deployment of electric vehicle supply
equipment (EVSE). In the Supplemental DSIP, the Joint Utilities committed to developing a consistent EV
Readiness Framework aligned with New York State EV adoption initiatives. This document was developed
in early 2018 and details approaches that support greatly increased adoption of EVs. In addition, Central
Hudson has instituted a new strategic focus on EVs and will be developing internal program leadership
and a cross functional team to advance utility infrastructure and rate design discussions, vehicle charging
equipment needs, and advocacy and education for both company employees and the public. The Joint
Utilities are sharing lessons learned from approaches like these to advance innovation that can enhance
EV grid value and customer adoption. On April 24, 2018, the Commission commenced a proceeding to
consider the role of electric utilities in providing infrastructure and rate design to accommodate the

Progressing the Distributed System Platform
24
needs and electricity demand of EVs and EVSE. In addition, on May 31, 2018, the Governor announced a
new $250 million electric vehicle expansion initiative, EVolve NY, with the New York Power Authority. The
program will involve state funding and also seek to create private sector partnerships through 2025 to
aggressively accelerate the adoption of electric vehicles throughout New York State. Central Hudson will
actively participate in these proceedings and programs to ensure that the benefits of EV integration can
be realized and that the impacts of EV charging and the design of EV rate can remain consistent with the
REV goals of improving system load factors and minimizing peak load growth.
Additional advancements in market services up to and beyond 2020 will continue to progress the DSP’s
role in enabling and appropriately compensating DER participation through various market mechanisms.
One such mechanism is VDER Phase Two, in which compensation for distribution value will be enhanced
beyond the current version of DRV/LSRV components. The market platform will also facilitate more DER
value through more direct or aggregated participation in NYISO wholesale markets, a more standardized
NWA procurement process, more flexible interconnection, and near-real-time distribution-level services.
Further enhancements to probabilistic load and DER forecasting methods, along with greater temporal
and locational granularity of data, will allow market participants to more effectively realize value from
DER investments and transactions through the DSP.
3. Information Sharing
Expanded access to more transparent, granular, and accessible data sources empowers retail consumers,
developers, and other stakeholders to make smarter decisions in planning, development, and operation
of DERs. By providing insights into how to bring the right technologies and services to the right customers
at the right time, DSP providers can advance information sharing as a fundamental DSP to create value for
stakeholders across the DER ecosystem. At the inception of the REV process in 2014, information sharing
was characterized by the provision of more traditional downloadable datasets, as aligned with developer
needs at the time. Because DERs did not yet constitute a significant proportion of system load or capacity,
hosting capacity analysis methodology was still under development. Customer data privacy standards
varied and were not yet calibrated to the needs of a growing market for distributed energy services.
Through June 2018, the Joint Utilities have implemented several key Information Sharing initiatives, which
are summarized in Figure II-IX.

Progressing the Distributed System Platform
25
Figure II-IX: Actions and Results in Information Sharing Through June 2018
Actions Results
Developed individual utility data portals: system data, LSRV
Increased access and usability of stakeholder-requested information
Created central location on Joint Utilities website for utility links to individual NWA, RFP opportunities
More transparency and efficiency for developers in NWA solicitations and other market opportunities
Proposed whole building aggregated data filing
Identify issues with privacy standards and opportunities for potential automation when volume dictates
Began implementation of Green Button Download(or similar)
More granular data available for customer or authorized third party
Produced statewide anonymity standard Consistent approach to protecting customer privacy
Agreed to protocol for value-added data services
Begin market for information services and development of platform service revenues (PSRs)
Supported launch of REV Connect to communicate DER opportunities for all utilities
Greater transparency for the developer community in NWA and other REV-related opportunities
Provided various forecast data, including 8760 forecasts
Greater transparency for developers to inform business development; greater insight into system needs
Completed stakeholder engagement sessions across nine DSP Implementation Teams
Stakeholder opportunities to provide input on the implementation of various DSP-related efforts
In the past two years, the Joint Utilities, guided by stakeholder engagement including focused outreach to
understand developer use cases, have developed and implemented a comprehensive set of information
sharing enhancements. These include the creation of centralized portals both on the Joint Utilities’
website and through REV Connect to provide system data and access to NWA and other RFP
opportunities. These portals enable increased access to and usability of stakeholder-requested
information and enhance efficiency for developers seeking to participate in NWA and other opportunities.
Progressing the Distributed System Platform
26
The Joint Utilities have also made progress in achieving greater uniformity and shared understanding of
privacy standards, including the 4/50 data privacy standard for whole building aggregated data, which the
Commission approved in its April 19th, 2018, UER Order.11 This alignment secures individuals’ utility data,
fulfilling the critical need to protect customer privacy while also simplifying planning for stakeholders,
who can now anticipate and design approaches based on a shared privacy standard.
The Joint Utilities have also collaborated to address other priorities related to information sharing
stemming from the Supplemental DSIP filing and related Orders that contribute as building blocks to
more evolved information sharing services within the DSP.
The Joint Utilities system data working group has advanced through the second step of a three-step
process to review and standardize the formatting of publicly available data. Once completed, this more
uniform approach will greatly assist developers and other stakeholders who have identified shared
formats as a priority. In addition, this group has completed important steps such as proposing an annual
needs assessment, classifying data based on sensitivity of the information, and defining potential fee
structures for data services. Responsive to stakeholder feedback and under a collaborative approach
among the Joint Utilities on standardizing data. Central Hudson along with the rest of the Joint Utilities
has made significant improvements in the data provided, including DSIP filings, Historic and Forecasted
Load and DER on and 8760 hour basis, Capital Investment Plans and projects, reliability statistics,
beneficial locations and NWA opportunities, DER interconnected or in queue, and access to circuit-level
hosting capacity data, as described in further detail in Section III.L (Hosting Capacity).
The customer data working group has also completed several steps, including developing approaches for
aggregated building data collection and dissemination – some of which were addressed in the 4/50
privacy standard proposal – as well as a process to track aggregated data requests and responses,
allowing for more efficient identification and response to non-standard, high-value data requests from
stakeholders.
In addition, the forecasting implementation team has worked to fulfill ongoing tasks related to
information sharing, including coordination with NYISO and soliciting input from stakeholders on potential
use cases for forecast data. This work has included alignment on understanding the use cases for 8760, or
hourly substation-level load and DER forecasts, which are provided concurrent with this filing. Central
Hudson has been providing this level of detail since the 2016 DSIP filing but has made improvements in its
DER forecasting that are reflected in this year’s updates.
11 This standard dictates that a building must have at least 4 residents, with no resident accounting for more than 50% of the building’s annual energy consumption, in order to allow aggregated data to be collected and shared.
Progressing the Distributed System Platform
27
Increased access to data sources and standardized, easily understandable formats will characterize
information sharing through 2020 and beyond. Additional value-added data services will be established,
and Stage 4 hosting capacity visualizations will enable streamlined interconnection of new DER projects.
Central Hudson will also continue to use Green Button Download My Data, or a similar platform, to allow
easy access to data while maintaining appropriate privacy protections.
D. Innovation Central Hudson continues to look for innovative opportunities to engage customers, explore new
business models, partner with third-party service providers, develop and refine market price signals, and
deploy foundational technologies in order to continue the evolution into the DSP and support the State’s
Energy Policy Goals. Efforts in these areas are described below.
Engaging Customers with CenHub
Central Hudson’s first demonstration project, CenHub, was proposed on July 1, 2015, in compliance with
Ordering Clause 4 of the Commission’s Order Adopting Regulatory Policy Framework and Implementation
Plan (issued and effective February 26, 2015). CenHub’s primary purposes were to increase customer
engagement with electricity and natural gas use and to provide an economically efficient energy
efficiency delivery mechanism. CenHub provides customers with extensive functionality including but not
limited to:
A customer portal with personalized electric energy usage dashboard;
Personalized messaging, energy saving tips, and recommended actions;
The ability to purchase products and services through an online marketplace and automatically
apply rebates at checkout;
Cross‐promotion of programs that meet the specific needs of the individual customer; and
A fun and engaging experience where customers are rewarded for interacting with CenHub
through points, badges, leaderboards, discounts, and gift cards.
Central Hudson is also aware of the growing expectations of customers based on their interactions with
other industries and businesses. Looking across industries, there are trends that can be leveraged to
design solutions that align with today’s customer expectations, as illustrated in Figure II-X.

Progressing the Distributed System Platform
28
Figure II-X : Customer Experience Industry Trends
On April 3, 2016, the CenHub Platform was made available to Central Hudson’s customers and has
seamlessly provided information, decision-making support, and access to incentives and rebates for a
host of energy efficient products and services. As of December 31, 2017, 42% of Central Hudson’s
customers have engaged with the CenHub Platform. Per Central Hudson’s current Rate Plan,12 CenHub
graduated from its status as a demonstration project and is now funded through base rates. During the
term of the current rate plan, CenHub is expected to continue evolving and engaging customers through:
improving the mobile platform;
increasing the number of self-service options;
providing a personalized dashboard;
engaging with DER providers to develop third-party partnership portals;
providing personal usage disaggregation;
providing municipalities with additional information regarding the aggregated customer
information; and
providing calculators to support customer decisions regarding energy efficiency, voluntary time-
of-use, and environmentally beneficial electrification.
These changes to the CenHub platform will increase customer convenience and control by improving the
means by which they can manage their energy use and increasing the transparency of the associated
financial and environmental impacts while directly supporting the State’s Energy Policy Goals.
12 Case 17-E-0459, et. al., Proceeding on Motion of the Commission as to the Rates, Charges, Rules and Regulations of Central Hudson Gas and Electric Corporation for Electric Service, Order Adopting Terms of Joint Proposal and Establishing Electric and Gas Rate Plan (“Current Rate Plan”), (issued June 14, 2018), Appendix Y.
Progressing the Distributed System Platform
29
Engaging Customers with Ongoing Demonstr ation Projects
Insights+ is a subscription based offering provided on the CenHub Platform since June 6, 2017.
Specifically, the Insights+ offering is a continuing demonstration project that comes with the installation
of an advanced meter that captures 15-minute interval customer load data and communicate this
information over cellular networks. This subscription is available to residential customers only at a cost of
$4.99 per month. Customers can receive a reduced subscription cost of $1.99 per month if they sign up
for the Voluntary Time of Use rate along with Insights+. At this time, approximately 100 customers have
subscribed to the Insights+ service.
Beyond the Insights+ demonstration project scope, we have expanded the use of the Insights+ meters to
assist in accomplishing other operational objectives:
Measurement and Verification (M&V): Itron utilizes a statistical sample set of Insights+ meters for
M&V as part of the Peak Perks NWA program. Itron pays the monthly meter fee and the
customer receives the Insights+ service as part of their Peak Perks program participation
incentives. Currently, approximately 260 customers are provided with Insights+ data through the
Peak Perks program.
Value Stack: The Insights+ meter data meets the criteria for value stack, and the hosted Itron
Meter Data Management (“MDM”) can accommodate the additional meters at no additional
system cost.
Time of Use: The Insights+ meters capture data for our original Time of Use intervals as well as
our new Voluntary Time of Use intervals. They also provide enhanced visual displays that
differentiate time of use time periods and peak and off-peak usage analytics.
Smart Home Rate (SHR) Demonstration Project: Central Hudson hopes to learn how a time of use
rate paired with smart technology and education elements will impact residential consumption
during peak and off-peak hours. The demonstration will be rolled out to a specific geographical
test area, introduce new enabling technology (smart thermostat that coordinates with the time
varying rate), and leverage existing educational platform tools enhanced with additional
information about the time varying rate. The demonstration results will be used to better
understand customer preferences, actions, and use of technology in conjunction with Voluntary
Time of Use (VTOU) Rates. Results will also inform future VTOU design and customer education as
well as the design of future Non-Wires Alternatives. Smart Home Rate participants will also be
provided with a subscription to the Insights+ service at no additional cost.

Progressing the Distributed System Platform
30
Innovative Market Price Signals and Programs
Central Hudson has refined or developed innovative customer facing programs or price signals in the
interim period since the last DSIP filing. Several examples are discussed below.
Central Hudson has utilized the results of its Avoided T&D Study, which was introduced within the 2016
DSIP, in many innovative ways in order to create consistent price signals across many diverse technologies
and programs. As such, the Avoided T&D Study provides the basis for the following:
Value Stack Pricing: The Demand Reduction Value (DRV) and the Locational System Relief Values
(LSRV) are based on the Avoided T&D Study.
Energy Efficiency: The distribution system value within the Benefit Cost Analysis Handbook
provides the basis for assigning value to Energy Efficiency measures that provide demand
reduction coincident with the system peak demand.
Demand Response Programs: The distribution system value within the Benefit Cost Analysis
Handbook provides the basis for assigning value to Demand Response measures that provide
demand reduction coincident with the system peak demand and is the basis for setting the
incentive level for Central Hudson’s Commercial System Relief Program (CSRP).
Voluntary Time of Use (VTOU) rate: The Avoided T&D Study provides the basis for the differential
between the peak and off-peak prices within the VTOU rate that was approved by the
Commission on November 16, 2017, within Case 17-E-0369.
Additionally, Central Hudson’s current Rate Plan authorized funding for a new Carbon Reduction Program
(CRP) focused on meeting New York State’s Green House Gas (GHG) emissions reduction goal and which
provides an Earnings Adjustment Mechanism (EAM) to incentivize the Company to achieve specific
targets associated with the environmentally beneficial electrification of the transportation and heating
sectors. The CRP aims to efficiently reduce the carbon footprint within Central Hudson’s service territory
through the installation of environmentally beneficial electric technologies such as air-source heat
pumps, electric vehicles, and geothermal heat pumps. Within the Rate Plan Order, the Commission
authorized funding of $1,225,000 for the period beginning July 1, 2018, through December 31, 2021.
Additionally, the Company is permitted to reallocate up to $4,526,879 from the electric Energy Efficiency
Program to the CRP over the same period. Subsequent to an extension request that was granted by the
PSC Secretary, the Company will file a Carbon Reduction Implementation Plan (CRIP) on or before August
30, 2018. Future CRIPs will be filed coincident with the Company’s System Energy Efficiency Plan (SEEP)
filings.

Progressing the Distributed System Platform
31
Finally, Central Hudson’s current Rate Plan established the Geothermal Rate Impact Credit (GRIC). Central
Hudson will provide Geothermal Rate Impact Credit (RIC) program in collaboration with NYSERDA. The RIC
of $264 will be paid to participating residential customers annually, by June 30 of each year. The credit
was premised on the comparison of (1) additional delivery revenue that the Company would receive from
the incremental energy use during the heating season of the geothermal heat pump under the current
rate design and (2) what those revenues would be under a more cost reflective rate design. As such, the
participant rate impact credit will be funded by incremental heating usage that would be monetized and
provided to non-participants through the RDM. In order to qualify for the credit, customers must install
equipment that meets the requirements of NYSERDA’s Geothermal Rebate Program and enroll in Central
Hudson’s Insights+ program.
Progressing the Distributed System Platform
32
E. Grid Modernization and the DSP Technology Platform Central Hudson proposes system investments in alignment with state objectives to provide safe and
reliable service and create net positive customer value. In recent years, many such investments in utility
systems both in New York and elsewhere have been associated with grid modernization efforts and, in
addition, have been described as foundational to the DSP or DSP-enabling.
Grid modernization investments are investments that improve the reliability, resiliency, efficiency, and
automation of the transmission and distribution system. Such investments generally include various
groupings of assets: the sensors, communications networks, and data repositories that enable enhanced
visibility and understanding of the behavior of the network; technologies and equipment that facilitate
greater customer engagement regarding energy usage and alternatives; and the underlying systems, data
management, and analytics that facilitate situational awareness, asset management, contingency and risk
analysis, outage management, and restoration. These necessary core investments underpin the required
focus on grid reliability and resiliency of any grid investment strategy. They provide the basis for increased
operational flexibility, can enable efforts toward achieving state policy goals, such as the integration of
various types of DERs, and are beneficial for any resource mix.
Central Hudson along with the other New York utilities have been proposing and implementing
investments that meet this definition of grid modernization since before the commencement of REV and
continue to do so. Upon the initiation of REV, the utilities have worked to align planned and proposed
investments with identified REV objectives. Because REV goals are subsumed within overall state energy
and environmental policy goals, all grid modernization investments planned and proposed by the
Company are aligned with REV, though not necessarily driven by REV.
Many grid modernization investments have mutually reinforcing benefits, such as those that provide
reliability or operational benefits while also supporting DER integration, and therefore contribute to
meeting multiple objectives. This is why many current Stage 1 investments are described as
“foundational” in the context of the DSP. Foundational investments are a subset of grid modernization
investments that enable grid capabilities to provide and/or support applications that increase reliability,
resiliency, safety, and enhanced situational awareness and operational flexibility. These Foundational
Investments are required to enable more advanced functions related to DSP enablement and/or DER
integration. Foundational investments are therefore “no regrets” actions that can support both current
and future functions, such as integration and utilization of DERs, in a modular fashion.
Future functions, which typically fall into Stage 2, are variously described as DSP enablement, DER
integration, and DER utilization and/or value capture activities. DSP enablement is an overarching term
that, in the grid investment context, refers to ensuring that the DSP can manage the growing penetration
Progressing the Distributed System Platform
33
of DERs for both bulk system and distribution operations while maintaining safety and reliability. This
description has significant overlap with enabling DER integration which refers to ensuring that the grid
can integrate DERs with the necessary communication, cyber security, and physical security protocols, in
order for DERs to be included in system planning grid operation processes. DSP Enablement also allows
the DSP to improve DER utilization and value capture, which means that the DSP can make use of DERs to
meet system resource needs and enhance system efficiency, while providing system and economic
benefits.
DSP capabilities are achieved through a set of investments that advance reliability and operational
efficiency (i.e., foundational investments) and/or that allow for DER integration and DER value capture
(i.e., DSP-enabling investments). This DSIP contains plans for grid modernization investments that
advance New York policy objectives and enable DSP capabilities. The foundational and DSP-enabling
investments that Central Hudson and the other New York Utilities have outlined would enable it to meet
the following New York policy objectives:
Drive Affordability
Increase Reliability and Resiliency
Enable Customer Choice
Improve Asset Condition and Operational Capability
Maximize System Efficiency
Incorporate Evolving Technology
Enhance DER Integration
Adopt Clean Technologies
Reduce Carbon Emissions
Animate Operational Markets
Consistent with the definitions above, in the SDSIP,13 the Joint Utilities characterized the technology
investments that occur in Stage 1 (Grid Modernization) as those that confer benefits in reliability and
operational efficiency. The technology investments that occur in Stage 2 (Operational Markets) are those
that confer the benefits of DER integration or value capture. The investments that enable capabilities that
confer system and customer benefits in Stage 1 and that also enable future DSP functions in Stage 2 and
beyond are considered foundational.
13 Case 16-M-0411 In the Matter of Distributed System Implementation Plans (“DSIP”), Joint Utilities of New York, Supplemental Distribution System Implementation Plan, November 1, 2016.

Progressing the Distributed System Platform
34
Table 2 summarizes several technology investments.
Table 2: Investments Characterization (S-DSIP 2016)
Investments
Stage 1: Grid
Modernization Stage 2: Operational Market
Reliability & Operational
Efficiency Enable DER Integration DER Value Capture
Advanced Metering
Infrastructure
Distribution Automation
Advanced Distribution
Management System
Distributed Energy Resource
Management System
Data Analytics
Geographic Information System
(GIS)
Communications Infrastructure
System Data Platform
Volt/VAR
Optimization/Conservation
Voltage Reduction
Note: Central Hudson agrees that in some cases AMI could be considered a Foundational Investment but has concluded system-wide
implementation of AMI is not cost beneficial. Without a full deployment of AMI Central Hudson already has visibility into more than 30% of
the energy sales through the HPP and Demand Metering. Central Hudson will utilize advanced metering as a customer option or as a
component in other smart grid investments.
Taken together, these investments support the functions and capabilities of the DSP, which Central
Hudson has defined as the set of people, processes, and systems that enable the utility to integrate DERs,
share information, and provide market services while preserving safe and reliable system operation.
The Department of Energy’s Office of Electricity Delivery and Energy Reliability (DOE-OE), in collaboration
with the California Public Utilities Commission and the New York Public Service Commission, has
developed a comprehensive set of functional requirements for a next generation distributed system
platform (DSPx) to enable the full participation of DERs in the provision of electricity services. The Joint
Utilities have aligned their definitions and characterizations of platform investments and functions with
the DSPx initiative. A representation of the functions of the distributed system platform, and how they
map to Stage 1 and 2, or both, under the DSPx framework is shown in Figure II-XI. Additionally, the figure

Progressing the Distributed System Platform
35
demonstrates how the core components and applications of the platform are supported by a mix of
foundational and DSP-enabling investments in Stage 1 and Stage 2.
Figure II-XI : Grid Investments in Relation to Grid Functions
Grid Investments Cost Effectiveness Framework
The DSPx Decision Guide14 identifies a framework for determining the cost effectiveness of grid
investments based on a primary purpose. The Guide acknowledges the complex nature of this exercise
since some investments may have benefits driven by multiple grid functions, as demonstrated above (
Table 2 and Figure II-XI). Furthermore, investments may involve different technologies aimed at achieving
the same set of capabilities required of the DSP. The implementation of different specific technologies
may therefore involve different technical use cases, all of which can support a single business use case.
14 U.S. Department of Energy, Office of Electricity Delivery & Energy Reliability, Modern Distribution Grid, Volume III: Decision Guide (“DSPx”), June 28, 2017.

Progressing the Distributed System Platform
36
Nonetheless, the framework provides a useful approach to describing the types of purposes that drive
investment through four general categories of grid expenditures (see Table 3).
Table 3: DSPx Grid Expenditure Cost-Effectiveness Framework
DSIP Update Topical Sections
37
III. DSIP Update Topical Sections A. Integrated Planning
1. Context and Background
a) Introduction
Central Hudson’s service territory includes a total of 70 distribution load serving substations, 62 of which
are fed from the transmission system, and approximately 270 circuit feeders. For planning purposes,
substations are grouped into ten load areas and most load transfers occur between substations and circuit
feeders in the same area. Central Hudson also operates and plans its interconnected transmission system
within the service territory. In addition, there are a total of ten transmissions areas, or load pockets,
where transmission lines and generators affect power flow. During 2017, Central Hudson served
approximate 258,100 electric residential customers and 46,300 electric non-residential customers.
Combined, they were billed for 4,849 GWh of electricity and produced a peak demand of 1,034 MW.
Central Hudson’s electric transmission system is tied to the bulk electric transmission system at the 345
kV voltage level operated by the New York Independent System Operator (NYISO). These
interconnections are at four major substations that are shown, along with the major 115 kV & 69 kV
interconnections supplying Central Hudson’s electric transmission system, in Figure III-I.

DSIP Update Topical Sections
38
Figure III-I: Major Interconnections
These interconnections also include connection to the transmission systems of National Grid, New York
State Electric & Gas, Consolidated Edison, New York Power Authority, Eversource, and First Energy. The
main criterion describing the capability of the transmission system is System Load Serving Capability (LSC).
The determination of LSC includes consideration of facility outages while maintaining flows and voltages
within appropriate limits. At this time, Central Hudson’s System LSC is 1,460 MW15. This is compared to
Central Hudson’s all-time peak load of 1,295 MW which occurred on August 2, 2006 and our current
forecasted peak in 2023 of 1,081MW (and 1,011 MW with DER).
The distribution system includes all assets outside of the substation fence operating at 34.5 kV and below.
However, load transfers within the distribution system are sometimes utilized to manage substation and
transmission infrastructure, operational, and thermal constraints, and the transmission and substation
systems provide the backbone to the distribution system. Therefore, the integrated planning process
includes both transmission and distribution components, as well as distributed energy resources.
The System Planning function at Central Hudson has served customers well by safely planning for a
reliable electric system while moderating cost pressures. System planning is accomplished by leveraging
15 Based on the 115 kV East Fishkill – Fishkill Plains HF line at Summer Long Term Emergency (LTE) Rating following the loss of the 115 kV East Fishkill – Shenandoah EF Line with no internal generation.
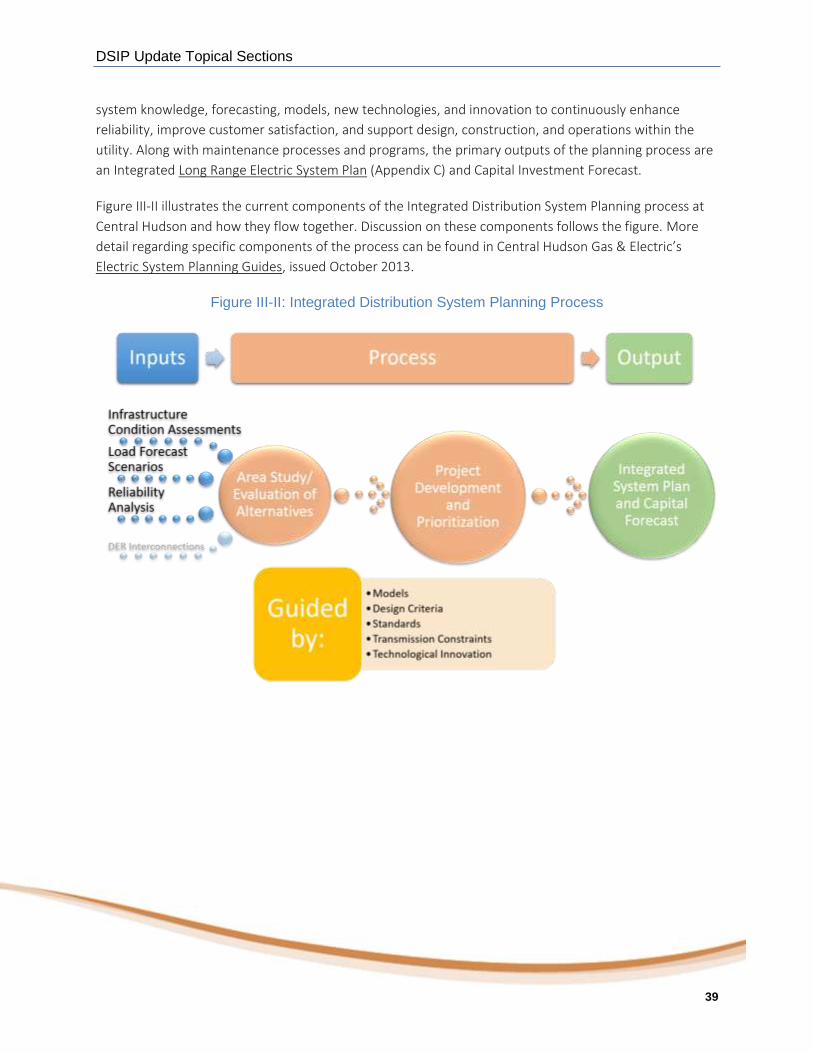
DSIP Update Topical Sections
39
system knowledge, forecasting, models, new technologies, and innovation to continuously enhance
reliability, improve customer satisfaction, and support design, construction, and operations within the
utility. Along with maintenance processes and programs, the primary outputs of the planning process are
an Integrated Long Range Electric System Plan (Appendix C) and Capital Investment Forecast.
Figure III-II illustrates the current components of the Integrated Distribution System Planning process at
Central Hudson and how they flow together. Discussion on these components follows the figure. More
detail regarding specific components of the process can be found in Central Hudson Gas & Electric’s
Electric System Planning Guides, issued October 2013.
Figure III-II: Integrated Distribution System Planning Process
DSIP Update Topical Sections
40
Inputs
Inputs to the planning process are described below:
1. Infrastructure Condition Assessment
Central Hudson complies with the Electric Safety Standards Order16, identifying and addressing
infrastructure concerns that arise through the transmission and distribution system inspection
process. Additional thermographic inspections are also completed on an annual basis for
substations as well as the distribution system. An inspection and testing schedule is also followed
for each substation asset. As a result of these inspections and additional comprehensive condition
assessment of transmission and distribution infrastructure, the Electric Long Range System Plan is
developed (see Appendix C for additional detail) to manage replacement programs associated with
individual asset classes. Trends of failing equipment are considered as well. As any major
components are being scheduled for replacement from a transmission, substation, or distribution
perspective, an integrated plan is developed considering items such as:
Remaining life/condition of other assets in the substation;
Environmental, land use, accessibility, and right-of-way status;
Distribution and substation modernization program needs;
Forecasted load in the area;
Safety, reliability, and power quality considerations;
Anticipated new customers and DERs, including improvement in hosting capacity;
Current standards;
Transmission constraints; and
Other scheduled projects in the same vicinity.
2. Load Forecast Scenarios
The load forecast for the area being studied is a key driver of the process, not only for projects
driven by load growth, but for properly designing infrastructure and reliability based projects for
the long term. Currently, net peak load is the primary consideration, but as discussed throughout
the remainder of this section and in Section III.B, the process is evolving to consider forecasts of
distributed energy resources (DERs) as well as multiple scenarios.
16 Case 04-M-0159, Proceeding on Motion of the Commission to Examine the Safety of Electric Transmission and Distribution Systems, Order Granting in Part Petition to Modify Electric Safety Standards (issued January 13, 2015).
DSIP Update Topical Sections
41
3. Reliability Analysis
Central Hudson maintains reliability criteria for the planning and operation of its electric
transmission and distribution (T&D) systems. For the transmission system (voltages greater than
34.5kV), these criteria are documented in internal Central Hudson guidelines and within
applicable external regulatory body documents/guidelines. These documents include the
following: Central Hudson’s Transmission Planning Guidelines, the Northeast Power Coordination
Council (NPCC) Regional Reliability Reference Directory #1 – Design and Operation of the Bulk
Power System, New York State Reliability Council – Reliability Rules & Compliance Manual For
Planning and Operating the New York State Power System, and North American Electric Reliability
Corporation (NERC) Standard TPL-001-4 – Transmission System Planning Performance
Requirements. Our distribution system reliability planning criteria are outlined within the Central
Hudson Gas & Electric’s Electric System Planning Guides, issued October 2013, as well as Section
VI of the Central Hudson Initial Distributed System Implementation Plan17. Analysis is completed
based upon these criteria and if the criteria are not met, project alternatives are evaluated as
part of the Integrated Planning Process.
4. DER Interconnections
Although proposed DER interconnections are reviewed by the Distribution Planning department,
they are not a direct part of the current Integrated Planning Process (other than to consider on-
going project construction due to DERs). However, infrastructure projects that also provide an
opportunity to increase hosting capacity are considered in the Capital Investment Plan.
Additionally, as a part of this DSIP filing, DER forecasts were developed at the substation and
transmission levels separate from net loads as an additional step towards further integrating
DERs into the planning process.
Process
Depending upon the extent of additional considerations, a final integrated plan may be developed along a
continuum from an informal meeting with appropriate stakeholders to a formal, comprehensive Area
Study. The end result is the development of recommendations to maintain and improve reliability of
service and support the capital budget plan. At any level of formality, the process relies on local system
knowledge and experience, and it includes an evaluation of project alternatives, the age of the
17 Case 14-M-0101, Proceeding on Motion of the Commission in Regard to Reforming the Energy Vision, Central Hudson Gas & Electric Corporation’s Distributed System Implementation Plan (“Initial DSIP”), (filed June 30, 2016).

DSIP Update Topical Sections
42
infrastructure, the condition of the infrastructure, and an assessment of electric service reliability.
Projects are prioritized based upon the Capital Prioritization Guidelines18.
Supporting Tasks
In addition to completing the planning process, the key tasks that are a part of the current Electric
Distribution Planning function include:
Establishing and maintaining design and operating criteria to minimize risk and plan for a safe and reliable system;
Performing analysis of reliability and power quality data and leveraging the use of new technology to continuously improve the T&D systems;
Developing an asset inspection, repair, and replacement program;
Complying with all federal, state, and local codes, standards, and regulations;
Maintaining relationships with local DER developers and municipal officials to stay abreast of and support new residential and commercial economic development;
Preparing, maintaining, and analyzing electric system models to ensure compliance with voltage, thermal, protection, and reliability standards;
Forecasting demand and energy growth at the system level and apportioning demand growth into more granular load growth areas;
Evaluating DER applications and determining what system upgrades will be required to facilitate interconnection; and
Developing a capital forecast and identifying where a non-wires alternative may be considered based upon suitability criteria.
Outputs
After projects are prioritized, they are incorporated into the annual Capital Forecast, and non-wires
alternative(s) are pursued as appropriate. Additionally, system wide asset management and capital plans
are documented in the Long Range Electric System Plan (Appendix C).
Historically, electric grids were engineered to accommodate the flow of electricity from centralized
generation to end users. Generation, transmission, and distribution infrastructure was sized to meet the
aggregate demand of end users when it was forecast to be at its highest (peak demand) while allowing for
forced outages. At the system level, electricity supply is required to meet demand instantaneously with
18 Ibid, Appendix G.
DSIP Update Topical Sections
43
sufficient reserve (spinning, quick-start, etc.) levels to avoid outages due to the loss of generation.
Substation transformer and distribution infrastructure, however, was, and generally still is, sized based on
local peaks, which can be quite diverse and often are not coincident with system peaks that drive
generation infrastructure.
While the core System Planning functions will continue to maintain and improve the safety and reliability
of the electric system, sophisticated technology and changing customer expectations are increasing the
complexity of this role. The Integration of DERs at both the transmission and distribution levels, and
alternatives to traditional utility investments, must be included in the Integrated System Planning Process.
Stakeholders are expecting higher levels of reliability and resiliency, along with information transparency.
Forecasting methodologies must evolve to an integrated approach that is probabilistic in nature,
foundational investments such as distribution automation must continue to progress, asset management
must be improved as infrastructure ages, and system modeling must become more granular and
refreshed at much faster rates.
b) Foundational Technologies
To embark on the efforts described in the previous section, key investments in Foundational Technologies
are required. Enabled by more sophisticated system modeling, investments in these technologies will
allow for integration of DERs and a smarter grid. These investments also require a significant Distribution
Planning effort themselves to determine required upgrades to the distribution grid and software systems.
Distribution Automation (DA) has been the focus of foundational investments from an integrated
planning perspective. Externally, the evolution of decentralized, automated devices, along with the
commercialization and integration of sophisticated modeling, geographic information systems mapping,
and Distribution Management Systems have helped propel DA solutions. Internally, DA has gained
momentum as a solution to address system considerations resulting from the exponential growth of
rooftop solar among the Company’s customer base. Additionally, DA will address infrastructure
replacement due to age and condition, increasing levels of limited redundancy and operational flexibility,
and reliance on communication systems providers whose core business models have shifted away from
hard-wired lines.
A centralized approach with modern modeling techniques will also improve system efficiency and defer
capital investments by leveraging the distribution system for redundancy while upgrading infrastructure
that has reached the end of its useful life. Further benefits include improved reliability and power quality,
integration of DERs, reduced system losses, and enhanced switching safety. To achieve the benefits
described, Central Hudson had identified several gaps in its current approach. Figure III-III shows the gaps
identified, along with a desired future state.

DSIP Update Topical Sections
44
Figure III-III: Identified Gaps and Future State
In order to test a more integrated approach, Central Hudson partnered with a vendor and NYSERDA to
develop an Integrated System Model focused on 8760 analysis, including both the transmission and
distribution system. The Company tested and developed the conservation voltage reduction (CVR), a
prototype for a DMS, and FLISR to avoid an outage to over 8,000 customers fed by a substation served by
a radial transmission line through challenging terrain, avoiding transmission system investments by better
leveraging the distribution system. Central Hudson began a pilot CVR trial on one feeder in 2012 and a
second feeder in 2013, using a “day on, day off” approach with a variety of customer load groups.
Applying the results along with studies completed in several national labs, Central Hudson anticipates a
1.39-1.73% reduction in energy usage, in addition to loss reduction. Tools such as solar impact analysis
and efficiency benefit analysis were developed through the process, and the pilot as a whole helped
inform the process in selecting a vendor for the Distribution Management System (DMS).
With successful pilots in progress, Central Hudson fine-tuned and began implementing its integrated
Smart Grid strategy. This program is developing a DMS to improve reliability, system safety, and system
efficiency. Central Hudson is creating detailed electric models in the ESRI GIS system to be used as the
asset database. In addition, it will have links to the DMS and Engineering Planning tools, which will in turn
link to the Outage Management System (OMS), as well as a designer tool to synchronize proposed
changes and actual as-built maps between Engineering, Design, and Operating groups. Over 900
Intelligent Electronic Devices (IED; e.g. electronic reclosers, switched capacitors, and voltage regulating
devices) and sensors are being installed through Smart Grid and other programs, and this will provide real
time data to the DMS so that it can become a centralized decision maker based on current system
Gaps Identified:
Peak day system model with asset gaps
No remote control of distribution devices
Decentralized communications with many platforms
Asset communications driven by vendor
Future State:
Real time system model with detailed asset information
Two-way communication with control via Operations Center
Centralized communications through single platform
Central Hudson led communications via vendor partnership
Transition began in 2011 via
Pilot Projects
and Cross- Functional
Teams
Does not integrate customer-owned devices
Integrates customer-owned DERs

DSIP Update Topical Sections
45
conditions rather than anticipated peak loads. DERs also must be monitored, and in some cases,
controlled, as a critical input to the DMS per the requirements established by the Interconnection
Technical Working Group19. Concurrently with system-wide implementation, there is a large
infrastructure improvement plan to create robust mainline feeders that can be looped through switching
to restore customers after an outage or optimize and balance feeders during normal operations as well as
improve hosting capacity.
The Smart Grid Strategy is also foundational to REV. VVO and FLISR modules that will be included in the
DMS are consistent with the REV policy goals of improving efficiency, reliability, and resiliency. Upon site
acceptance testing, the system will consider the impact of DERs in switching and voltage optimization
decisions utilizing generation profiles. The DMS is being developed so DERs can be integrated into the
system for monitoring and control through additional modules as needed, as well as weather forecasting,
to improve resource diversity and animating markets in the future. While the monitoring, control, and
market mechanisms surrounding DERs are still being defined through other REV proceedings, the DMS
will be critical to any level of coordination, as well as the safety and reliability of the electric distribution
system as its complexity increases. In addition, the ability to later add AMI, if justified, is being
incorporated into the Network Communications Strategy.
Central Hudson’s Smart Grid Strategy can be summarized along three major functional components:
1. Distribution Automation (DA) – automated devices, distribution infrastructure (poles and wires)
2. Distribution Management System (DMS) – the centralized software “brains”
3. Network Communications Strategy – the two-way communication system between the DA
devices and DMS
Figure III-IV illustrates how these projects interact, along with the underpinning ESRI Geographic
Information System (GIS) Asset Model.
19 Monitoring and Control Requirements for Solar PV Projects in NY, September 1, 2017.

DSIP Update Topical Sections
46
Figure III-IV: Smart Grid Projects
The Planning aspects of DA and the asset model will be discussed in this section. For additional details on
the Smart Grid strategy, please see Section III.C.
a. Describe how the associated policies, processes, resources, standards, and
capabilities have evolved since the initial DSIP filing in 2016;
Since the initial DSIP filing in 2016, the Company has made significant progress regarding the transition to
a more integrated planning process. Traditionally, Central Hudson applied a deterministic approach to the
development of a peak load forecast. More recently, Central Hudson has engaged a vendor to deliver a
robust probabilistic load forecasting tool and conduct a multi-day workshop to review the process in
detail (see Advanced Forecasting, Section III.B). The Company has also added an additional team member
to the Electric Distribution Planning area who will assist with integrating DERs into the process.
The Company has also placed a significant focus on system modeling. During 2016, the Company
contracted with two vendors to perform a field assessment of critical connectivity modeling components
across all areas of the system not previously completed: conductor size and length, protective elements,
phasing, and key customer transformer information. This information was input to the OMS and GIS
system, and in turn, the Planning load flow models. The data was critical in modeling and planning the
rollout of distribution automation device locations and reconductoring requirements. This data will
continue to be maintained into the future. Additionally, the data was critical for the completion of Stage 2
hosting capacity analysis described in further detail in Section III.B.

DSIP Update Topical Sections
47
The first three years of the Distribution Automation plan were approved as detailed in the Order
Approving Rate Plan, issued and effective June 17, 201520, with a contingency of meeting milestones that
were mutually agreed upon between Central Hudson and Department of Public Service Staff. Due to
Central Hudson’s success during the prior rate plan, the newly approved rate plan which commenced on
July 1, 201821, includes full funding to continue with implementation of not only Distribution Automation,
but the DMS and Network Communications Strategy as well. An additional Junior Distribution Planning
Engineer was hired in January 2017 to assist with further planning of DA projects, as well as additional
cleansing of distribution system models.
Central Hudson’s service territory is comprised of five operating districts. All components of DA will be
modeled, analyzed, planned, field designed, and constructed in parallel on a district by district basis, with
the process separated into two phases for some districts. As available, devices will be simultaneously
integrated with the network communication radios and DMS. Vendors have been selected for each
component and construction standards have been developed, although an on-going evaluation of
emerging products and technologies may result in continuous improvement, particularly in the sensor
area. Products such as solid state transformers that allow voltage control on the secondary side of a
distribution transformer (i.e., 120V/240V, 208V, etc.) will also continue to be monitored for economic
applicability on Central Hudson’s system to enable further feeder voltage reduction and/or mitigate
impacts of solar PV installations.
2. Implementation Plan
a) Current Progress
As described above, Central Hudson’s Planning Engineers have been trained on the probabilistic planning
process, and the distribution system models have been updated to complete the necessary hosting
capacity and distribution automation analysis and can incorporate a simulation of any hour in the year.
Details regarding the DA schedule can be found in Section III.C.
The planning process now does not end with the development of a Capital Forecast22. As illustrated in
Figure III-V, the output of the Distribution Planning process has expanded from the Integrated Capital
20 Case 14-E-0318, et. al., Proceeding on Motion of the Commission as to the Rates, Charges, Rules and Regulations of Central Hudson Gas and Electric Corporation for Electric Service (“Prior Rate Case”), Order Approving Rate Plan, (issued June 17, 2015), page 16.
21 Case 17-E-0459, et. al., Proceeding on Motion of the Commission as to the Rates, Charges, Rules and Regulations of Central Hudson Gas and Electric Corporation for Electric Service, Order Adopting Terms of Joint Proposal and Establishing Electric and Gas Rate Plan (“Current Rate Plan”), (issued June 14, 2018), Appendix Y.
22 Case 14-E-0318 et. al,, Prior Rate Case, Central Hudson Gas & Electric Corporation’s Compliance Filing of its 2019-2023 Corporate Capital Forecast, (filed June 29, 2018).
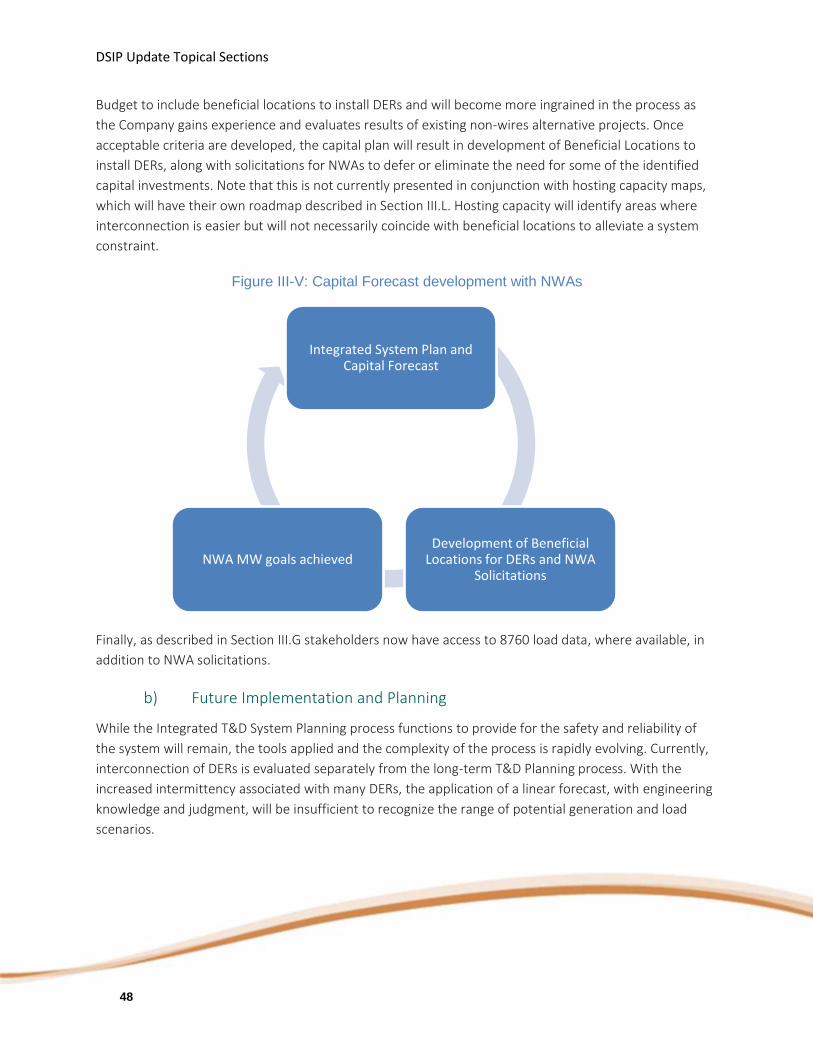
DSIP Update Topical Sections
48
Budget to include beneficial locations to install DERs and will become more ingrained in the process as
the Company gains experience and evaluates results of existing non-wires alternative projects. Once
acceptable criteria are developed, the capital plan will result in development of Beneficial Locations to
install DERs, along with solicitations for NWAs to defer or eliminate the need for some of the identified
capital investments. Note that this is not currently presented in conjunction with hosting capacity maps,
which will have their own roadmap described in Section III.L. Hosting capacity will identify areas where
interconnection is easier but will not necessarily coincide with beneficial locations to alleviate a system
constraint.
Figure III-V: Capital Forecast development with NWAs
Finally, as described in Section III.G stakeholders now have access to 8760 load data, where available, in
addition to NWA solicitations.
b) Future Implementation and Planning
While the Integrated T&D System Planning process functions to provide for the safety and reliability of
the system will remain, the tools applied and the complexity of the process is rapidly evolving. Currently,
interconnection of DERs is evaluated separately from the long-term T&D Planning process. With the
increased intermittency associated with many DERs, the application of a linear forecast, with engineering
knowledge and judgment, will be insufficient to recognize the range of potential generation and load
scenarios.
Integrated System Plan and Capital Forecast
Development of Beneficial Locations for DERs and NWA
SolicitationsNWA MW goals achieved

DSIP Update Topical Sections
49
As discussed previously, Central Hudson is transitioning its T&D System Planning process to incorporate
probabilistic and more granular elements. While in the past, a net load forecast was sufficient for
planning, the forecast going forward is separating the forecast into DERs and base load, as shown in
Figure III-VI.
Figure III-VI: Forecasts Must Separate DERs and Base (Gross) Loads
During this transition to a probabilistic approach, as an area of need is identified through traditional
planning methodology, base load and DER forecasts are being developed with separate scenarios for
each. DER forecasts consider not only technical drivers of load shapes, but current and anticipated policy
decisions and interconnection queues that will impact the penetration of DERs. Although interconnection
studies consider the impact of individual DERs, smaller distributed generation and energy storage systems
are not scrutinized as closely, but their aggregate impact over time will be important to consider and will
also inform the interconnection process of the future.
This information is applied to understand the system needs and scenarios and develop alternatives and a
final solution. To apply the DER forecasts that were developed on a widespread basis, the T&D Design
criteria against which needs are assessed will need to be updated. Figure III-VII provides a roadmap of this
evolution.

DSIP Update Topical Sections
50
Figure III-VII: Evolution of T&D Planning Criteria
At this time we have moved beyond the traditional current planning criteria and are in the process of
implementing probabilistic forecasting, using more granular data, and more sophisticated models.
On a similar note, Operating Criteria will need to evolve to integrate the Foundational Investments (i.e.,
DA and DMS) as well as DERs, and DA rollout will continue. This is discussed further in Section III.C.
Modeling will continue to improve as there is tighter integration between the ESRI platform, DMS, and
system planning tools, and distribution designer software also ties to the platform to speed the closure of
new work orders such that a more “real time” model is available.
Table 4 summarizes the gaps in today’s Integrated Planning Process and the steps and timelines to
address them. While the overall planning process will not change from Figure III-VII, it will become
significantly more complex. Completion of the roadmap will require hiring additional technical resources
Improved models, enhanced 8760 data availability, and increased
penetration of DERs
Current Planning Criteria
•Net load only
Distribution Automation (DA)
•Net load only
DA + Solar PV + Demand Response (DR)
•Risk-based criteria for PV and DR
DA + All DERs
•Risk-based criteria applying all high-penetration DERs
•Increased hosting capacity

DSIP Update Topical Sections
51
each year in 2018 and 2019, to develop complex analytical and software application skills uniquely
blended with power system knowledge. Figure III-VIII illustrates the interdependencies of these items.
While some of these items are being completed as a part of this DSIP update (e.g., substation-level
probabilistic forecasts for load, solar, and energy efficiency), they are not yet integrated into our planning
process and therefore have a future date associated with them.
Table 4: Integrated System Planning Gaps and Roadmap
Action Item 2018 2019 2020 2021 2022 2023 2024+
Improve 8760 Data Availability
Load >95% >95% >95% >98% >98% >98% >98%
Distributed Generation
>500kW >500kW >500kW >500kW >500kW; possible smart
inverter availability Electric Vehicles
Battery Storage >500kW >500kW >500kW >500kW; possible smart
inverter availability
Develop Substation Level Probabilistic Forecasting by Load/Generation Type
Load, Solar, Energy Efficiency, and Electric Vehicles
Vendor
Central Hudson
Other DERs As Needed
NYISO Market Considerations
Integrate into Planning Process
Other DERs As Needed
Improve System Modeling Capabilities
Improve 8760 Modeling Capabilities
Implement Designer Software to improve Work Order Process
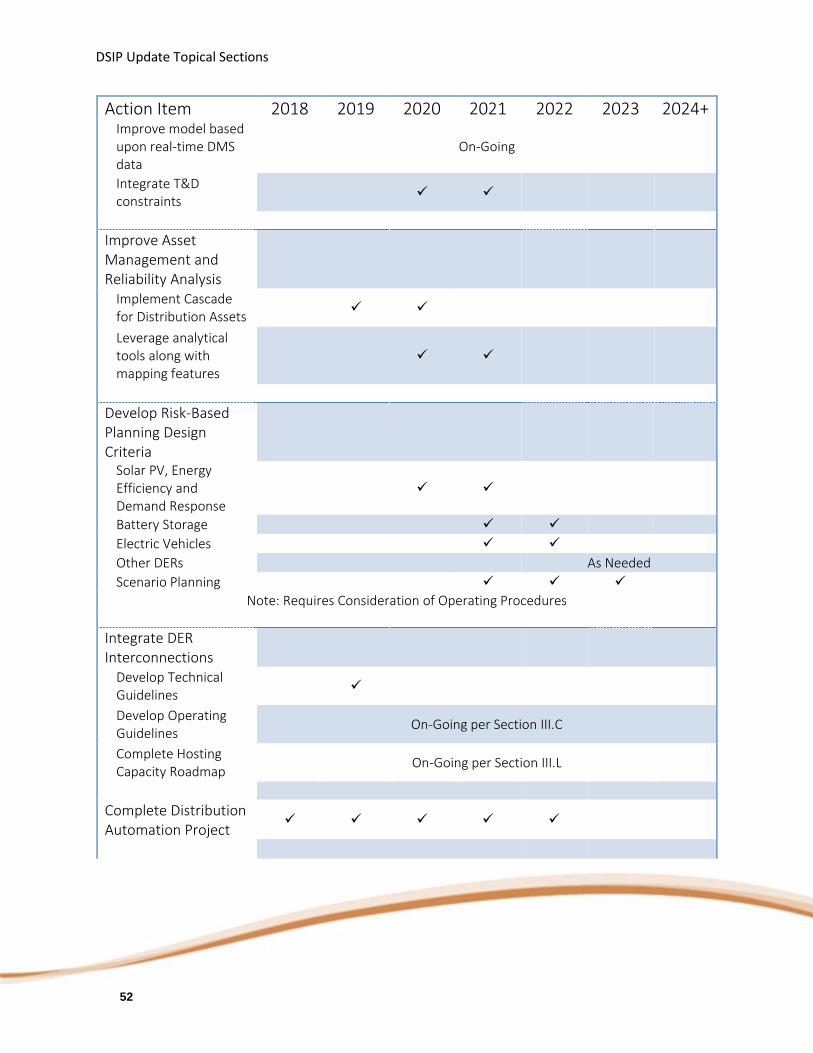
DSIP Update Topical Sections
52
Action Item 2018 2019 2020 2021 2022 2023 2024+ Improve model based upon real-time DMS data
On-Going
Integrate T&D constraints
Improve Asset Management and Reliability Analysis
Implement Cascade for Distribution Assets
Leverage analytical tools along with mapping features
Develop Risk-Based Planning Design Criteria
Solar PV, Energy Efficiency and Demand Response
Battery Storage
Electric Vehicles
Other DERs As Needed
Scenario Planning
Note: Requires Consideration of Operating Procedures
Integrate DER Interconnections
Develop Technical Guidelines
Develop Operating Guidelines
On-Going per Section III.C
Complete Hosting Capacity Roadmap
On-Going per Section III.L
Complete Distribution Automation Project

DSIP Update Topical Sections
53
Action Item 2018 2019 2020 2021 2022 2023 2024+ Update Integrated Planning Process, including Alternative Analysis process and Long Range System Plan
Figure III-VIII: Interdependency of Planning Process Roadmap Items
3. Risks and Mitigation
While the Integrated Planning process allows more stakeholders to actively contribute to Central
Hudson’s system needs, the complexity and inclusion of many additional parties and technologies adds to
the risk of the system. The process of the future is dependent upon the System Forecasting process,
which will be driven not only by uncertainty in base system loads, but also uncertainty regarding the
connection of DERs. The utility has very limited control over most elements that drive when a DER will
interconnect to the grid or whether a project will ultimately be completed. Policy decisions or pricing
changes can impact a forecast overnight. Moreover, many DERs (such as solar photovoltaics) operate
intermittently and have limited restrictions on when they may disconnect and the notifications required,
both temporarily and permanently, further challenging the forecasts. And DERs participating in NYISO

DSIP Update Topical Sections
54
markets may be driven by economic signals that need to be balanced with local distribution system
reliability.
To mitigate the risk, the Company is transitioning to a probabilistic based forecasting methodology, which
separates DERs from base load forecasts. This allows the Company to better assess scenarios of forecast
uncertainty up to ten years in advance and consider a plan that may be required for those cases. Given
that Central Hudson’s system load is declining, the risk of exceeding thermal limitations is also very low,
but if the tide were to turn towards growth of base load in areas where there is significant penetration of
DERs, the forecasting risk would be more concerning. And whereas peak load forecasts were critical in the
past, minimum load forecasts are important to understand when equipment may be back fed or other
system risks may occur. This is particularly true due to the aggregation of several clustered, small DER
projects that may not have been rigorously studied. Therefore, an 8760 forecast has been completed for
all substations, and these forecasts will continue being created in the future. Additionally, operational
processes and procedures will also mitigate the risk as the Distribution Management System (DMS) can
be used to control DERs as needed. As the DMS is further developed, processes and procedures will need
to be developed to incorporate this functionality and integrate planning and operational aspects.
Implementation of probabilistic forecasting and that smart grid strategy involves complex projects that do
carry scheduling risk, but due diligence, progress to date, and continuation of current processes until an
appropriate cutover time has mitigated some of that risk.
4. Stakeholder Interface
At the New York Independent System Operator (NYISO) level, the NYISO, with input from Market
Participants, is responsible for analysis of the New York Control Area’s (NYCAs) Bulk Power Transmission
Facilities and the Transmission Owners are responsible for developing solutions to any identified
Transmission Security issues. As part of the NYISO’s Comprehensive System Planning Process, the NY TOs
provide their Local Transmission Plans (LTP) at least biennially. For Central Hudson, our LTP is based on
the transmission system projects contained in the Electric Capital Forecast.
For facilities that fall outside of the NYISO’s jurisdiction, the stakeholder interface with the Integrated
Planning process primarily includes the inputs and outputs of the process, rather than the process itself.
Stakeholder engagement regarding load forecasting is described further in Section III.B. Regarding DER
Interconnections and Hosting Capacity analysis and their potential ties to the Integrated Planning process,
this is described further in Sections III.J and III.L. Additionally, much of the System Data used to drive the
Integrated System Plan is publically available, as described further in Section III.F.5.a).
The key output of the Integrated Planning Process is the Electric Capital Forecast. The 5 Year Capital
Budget plan is filed annually with the Public Service Commission and is publically available. Projects which

DSIP Update Topical Sections
55
meet the NWA Suitability Criteria are considered through the NWA Procurement Process described in
Section III.N.
5. Additional Detail
a) Means and methods used for integrated system planning
The means and methods used for integrated system planning are described throughout this section and
sections that are additionally referenced, as well as noted in documents such as the Electric System
Planning Guides.
b) How the utility’s means and methods enable probabilistic planning which
effectively anticipates the inter-related effects of distributed generation, energy
storage, electric vehicles, beneficial electrification, and energy efficiency.
Central Hudson has transitioned to probabilistic, granular forecasting. By the design, the approach
includes:
1. Tracking of when, where, and who adopts individual DERs.
2. Using the data on adoption to fit adoption diffusion curves and forecast aggregate adoption with
uncertainty.
3. Estimating the propensity of customers to adopt different types of DERs at granular level,
typically for individual premises.
4. Assessing the impact of adoption of DERs on individual substation and transmission areas. This is
grounded on layering hourly (8760) DER load shapes on substation and transmission area loads.
For most DERs – energy efficiency, solar, and electric vehicles – Central Hudson has already quantified
which customers and locations have a higher propensity to adopt specific DERs based on characteristics
such as energy use patterns, weather sensitivity, customer size, participation in other programs,
ownership of other DERs, and geographic location. The estimates reflect interrelated effects of DERs. For
example, customers with distributed solar are more likely to adopt electric vehicles and vice-versa.
Section III.B provides additional detail regarding Central Hudson’s T&D and DER forecasting methodology.
These probabilistic forecasting methodologies must be integrated into Central Hudson’s planning process
per the roadmap in Table 4.

DSIP Update Topical Sections
56
c) How the utility ensures that the information needed for integrated system
planning is timely acquired and properly evaluated.
The key inputs to integrated system planning are: (1) load forecasts, (2) infrastructure assessments, and
(3) reliability data.
Starting with (1) load forecasts, the forecasts are highly dependent upon availability of substation
metering data as well as DER inventory. The Electric System Planning Guides describe the process for
updating metering data. Where electronic hourly data is available, it is also spot checked on a monthly
basis to keep ahead of any inaccuracies. As described in Section III.J, the inventory of distributed
generation and energy storage systems is maintained through the Company’s Interconnection Online
Application Portal and filed with the Public Service Commission on a monthly basis. Distributed
Generation and Energy Storage Systems are also mapped in our ESRI GIS model. Program-based energy
efficiency information is also tracked and readily available.
Transitioning to (2) infrastructure assessments, the Electric System Planning Guides document the
analysis that is required to be completed. Finally, (3) reliability data is heavily scrutinized to reconcile
outage information and report the information to the Public Service Commission on a monthly basis.
Annually, a detailed System Reliability Report is filed with the Public Service Commission that includes
data by distribution feeder.
The process for developing the Capital Investment Forecast is documented in the Capital Prioritization
Guidelines23. Figure III-IX, which is included in the aforementioned guidelines and reproduced below,
illustrates the development timeline.
23 Initial DSIP, Appendix G.
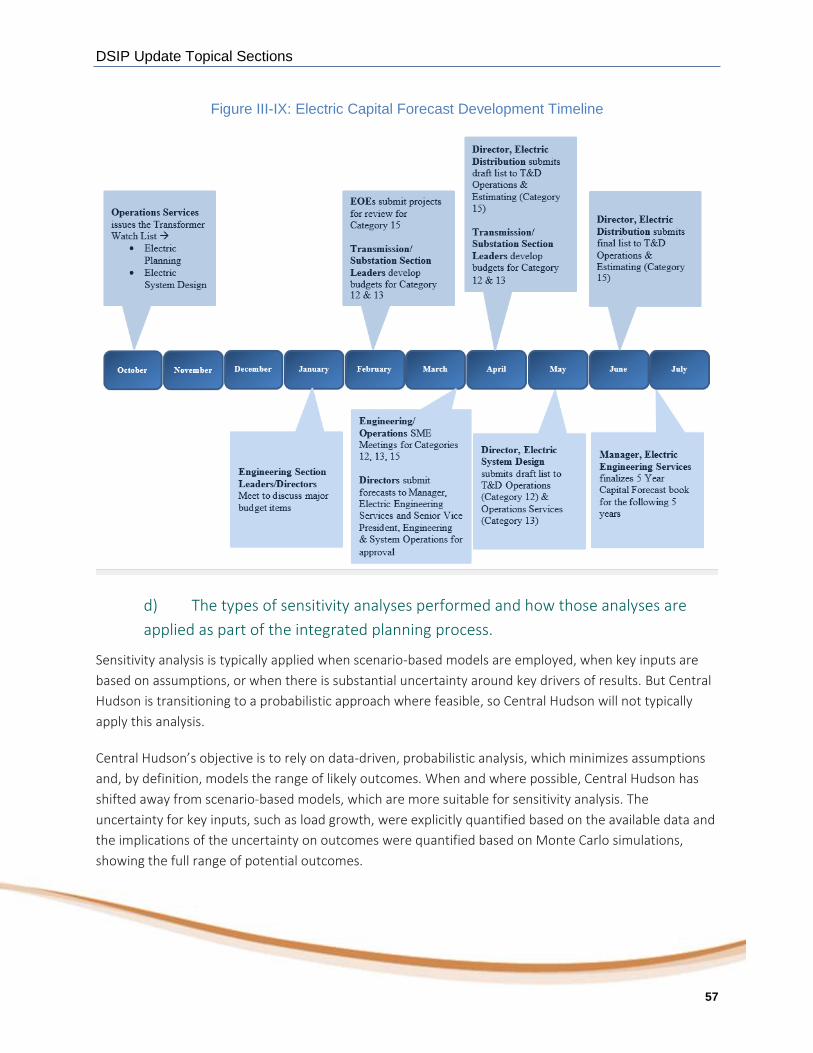
DSIP Update Topical Sections
57
Figure III-IX: Electric Capital Forecast Development Timeline
d) The types of sensitivity analyses performed and how those analyses are
applied as part of the integrated planning process.
Sensitivity analysis is typically applied when scenario-based models are employed, when key inputs are
based on assumptions, or when there is substantial uncertainty around key drivers of results. But Central
Hudson is transitioning to a probabilistic approach where feasible, so Central Hudson will not typically
apply this analysis.
Central Hudson’s objective is to rely on data-driven, probabilistic analysis, which minimizes assumptions
and, by definition, models the range of likely outcomes. When and where possible, Central Hudson has
shifted away from scenario-based models, which are more suitable for sensitivity analysis. The
uncertainty for key inputs, such as load growth, were explicitly quantified based on the available data and
the implications of the uncertainty on outcomes were quantified based on Monte Carlo simulations,
showing the full range of potential outcomes.

DSIP Update Topical Sections
58
Sensitivity analysis still plays an important role for technologies in a nascent stage or experiencing truly
disruptive innovation(s). Because historical data for those technologies is limited, any current projections
rely on assumptions or on data from proxy technologies. For example, for electric vehicles, Central
Hudson employed data on adoption of proxy technology, green vehicles overall, which includes hybrids,
EVs, and plug-in hybrids. To explore the potential of higher penetration rates, the models were pressure
tested by assuming penetration of electric and plug-in electric vehicles would double that of hybrids. A
similar approach will be employed for battery storage once enough data is available.
e) How the utility would timely adjust its integrated system plan if future
trends differ significantly with predictions, both in the short-term and in the long-
term.
The process for Central Hudson to adjust its plans in the short term likely is not anticipated to vary from
the process in place today. Emerging needs will be addressed by reprioritizing projects within the existing
Capital Plan or by releasing contingency funding as necessary. Similarly, if load does not materialize in an
area where a load-based project is required, that project will not move forward unless there are other
drivers (e.g., infrastructure considerations). The Capital Prioritization Guidelines24 were finalized in May
2015 and are also included as Appendix G to the Initial DSIP filing.
In the longer term, the probabilistic-based forecasting methodology will provide insight into some of the
potential variability from the predicted forecast, so the Company can monitor and more proactively plan
for worst case scenarios. The substation loading forecasts provide an annual check on what areas of the
system may require reevaluation. But when an NWA is already contracted for a project, it is more
challenging to undo. Still, a project may have an opportunity for further deferral if load does not
materialize, or a traditional solution may have to be accelerated if load grows more quickly than
anticipated or DERs do not come to fruition as expected.
f) The factors unrelated to DERs - such as aging infrastructure, electric
vehicles, and beneficial electrification - which significantly affect the utility’s
integrated plan and describe how the utility’s planning process addresses each of
those factors.
Integration of aging infrastructure into the Integrated Planning Process is described at the beginning of
this Section, including reference to the Long Range Electric System Plan in Appendix C that is an output of
the process. Although Central Hudson’s long term experience is not specific to electric vehicles (EV) and
beneficial electrification, the Company’s existing processes are well equipped to manage load growth.
24 Ibid.

DSIP Update Topical Sections
59
Multiple EV charging stations have been successfully installed throughout Central Hudson’s service
territory. As EVs are in the early stages of development and the Company has latent capacity available on
its system, it would not be prudent to overinvest in anticipation of EVs and other technologies that are
undergoing electrification. Section III.E describes the initial steps the Company is taking to begin
developing a framework for the future as EV penetration increases. As a part of the Current Rate Plan
Central Hudson continues to advocate for beneficial electrification, especially for programs and rate
design that encourages improved load factor and system efficiency, such as expanding the use of
geothermal technology. The Company continues to monitor other technologies considering electrification
through participation in Electric Power Research Institute programs.
g) How the means and methods for integrated electric system planning
evaluate the effects of potential energy efficiency measures.
Similar to other DERs, the impact of energy efficiency must be considered as a part of the forecasting
process. A system-wide forecast is developed at the corporate level both with and without the impacts of
energy efficiency, which can then be allocated to the substation level. The range of forecasts will allow
System Planners to monitor longer term system needs and develop planning alternatives depending upon
how much of the energy efficiency comes to fruition. Additional detail regarding Energy Efficiency
Integration and Innovation can be found in Section III.F.
h) How the utility will inform the development of its integrated planning
through best practices and lessons learned from other jurisdictions.
Central Hudson actively participates and has a leadership role within the Electric Power Research
Institute’s Distribution Planning and Operations program. Through attendance at semi-annual
conferences, Planning interest group meetings, and webinars, the Company is able to stay abreast of the
latest developments in System Planning and integrate learnings into our processes as appropriate.
Central Hudson also participates in the NYISO’s Interconnection Process. Through this process, Central
Hudson is made aware of projects proposing to connect to our transmission system and neighboring
transmission systems. As part of the NYISO Interconnection Process, Central Hudson reviews and
contributes to the analyses of these proposed projects. Through the NYISO’s Electric System Planning
Working Group, Central Hudson continues to participate and advocate for improvements to the planning
process as well as the interconnection process on the bulk electric system and to ensure alignment with
those processes in the DSP.
The Joint Utilities of New York and the NYISO also hold periodic meetings and conference calls to discuss
inputs and outputs of the various planning processes at both the bulk system and non-bulk level, such as
forecasting, hosting capacity, interconnection, and non-wires alternatives.

DSIP Update Topical Sections
60
B. Advanced Forecasting
1. Context and Background
A vital role of Central Hudson is to ensure that electricity supply remains reliable by projecting future
demand and reinforcing the transmission and distribution network so the capacity is available to meet
local needs as they grow over time. Proper design of the electric grid is critical for ensuring power can be
delivered from where it is produced to where it is used.
The forecast and planning are done on a system wide basis and for individual components of the system,
including distribution circuits, substations, and transmission areas. Historically, electric grids were
engineered to accommodate a unidirectional flow of electricity from centralized generation to end users.
Generation, transmission, and distribution infrastructure components were sized to meet the aggregate
peak demand of the customers connected to specific grid components. In addition, the planning process
ensures power can be re-routed in case of prolonged or temporary outages.
The electricity industry is experiencing rapid technological change, particularly with the introduction of
distributed energy resources. The shift affects both (1) how, when, and where customers use electricity
and (2) how, when, and where electricity is produced. Several factors have the potential to influence
electric grid planning:
Customer growth and migration patterns;
Behavioral changes regarding how and when customers use electricity;
The adoption of distributed solar including community solar;
The adoption of electric vehicles;
The introduction of battery storage;
The natural adoption of energy efficiency;
New appliance and building codes and standards;
Program-based introduction of energy efficiency; and
Increased penetration of connected devices, such as smart thermostats, where the power use
can be remotely controlled and response automated.
If properly harnessed and directed, technological change can improve utilization of existing resources,
either by shifting use of power away from peak periods, or by injecting power into the grid when and
where it is needed most. However, several of these technologies are in their nascent stages, making their
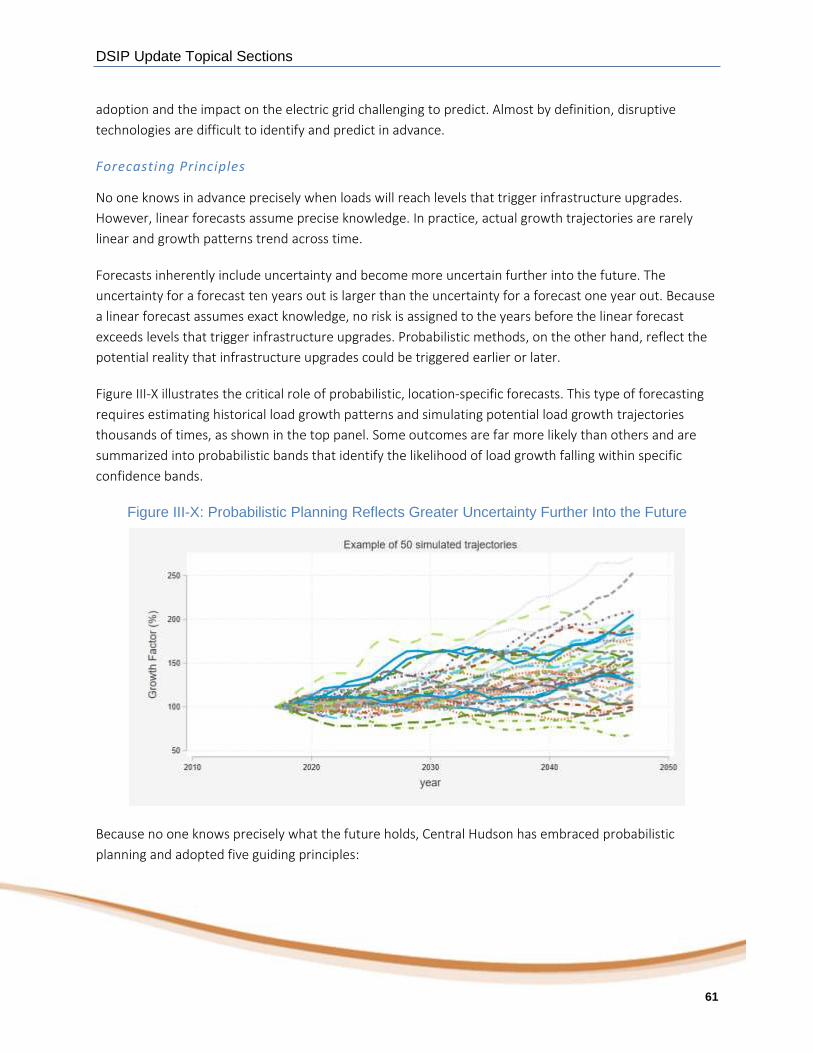
DSIP Update Topical Sections
61
adoption and the impact on the electric grid challenging to predict. Almost by definition, disruptive
technologies are difficult to identify and predict in advance.
Forecasting Principles
No one knows in advance precisely when loads will reach levels that trigger infrastructure upgrades.
However, linear forecasts assume precise knowledge. In practice, actual growth trajectories are rarely
linear and growth patterns trend across time.
Forecasts inherently include uncertainty and become more uncertain further into the future. The
uncertainty for a forecast ten years out is larger than the uncertainty for a forecast one year out. Because
a linear forecast assumes exact knowledge, no risk is assigned to the years before the linear forecast
exceeds levels that trigger infrastructure upgrades. Probabilistic methods, on the other hand, reflect the
potential reality that infrastructure upgrades could be triggered earlier or later.
Figure III-X illustrates the critical role of probabilistic, location‐specific forecasts. This type of forecasting
requires estimating historical load growth patterns and simulating potential load growth trajectories
thousands of times, as shown in the top panel. Some outcomes are far more likely than others and are
summarized into probabilistic bands that identify the likelihood of load growth falling within specific
confidence bands.
Figure III-X: Probabilistic Planning Reflects Greater Uncertainty Further Into the Future
Because no one knows precisely what the future holds, Central Hudson has embraced probabilistic
planning and adopted five guiding principles:

DSIP Update Topical Sections
62
1. Forecast T&D loads and adoption of specific DERs;
2. Produce location-specific forecasts as granular as realistically possible;
3. Track adoption of DERs on a regular basis in as granular a manner as possible;
4. Embrace probabilistic methods and produce forecasts that reflect the uncertainty in the
forecasts, and;
5. Connect the probabilistic forecasts to the assessments of T&D deferral potential and value.
While the approach requires a substantial amount of effort, the results are grounded in empirical data
and better reflect the limitations of what we know about changes in T&D loads and adoption of DERs.
System Level Forecasts
Central Hudson’s Initial DSIP filing provided a comprehensive discussion of the system-wide forecast
prepared by the Company, which begins with the development of energy sales projections along multiple
electric sectors. These projections are aggregated with a projection of system losses to produce a
forecast of net energy which, in turn, is paired with a peak demand forecast to yield an annual system
electric load forecast. Other than continued refinements in the econometric models and data being used
to develop the forecasts, this methodology has not changed since the 2016 DSIP filing.
While forecasts of monthly customers, sales and revenue, and annual peak demand are developed on
request, they are routinely developed on an annual, scheduled basis for integration along financial,
accounting, energy procurement, regulatory and system planning purposes. The majority of the sales
projections and the peak demand projection are developed through econometric analysis. Historically,
both EE and DERs, more specifically PV interconnected to the distribution system, were addressed
external to the sales modeling process. This prevented the sales regression models from assuming that
the historical EE and PV growth patterns would continue in the future, thus allowing the growth patterns
to be altered and applied as a post forecast adjustment.
In addition to the load forecast, the top down System Wide Forecast reflects a level of DER (PV and EE)
that was derived from various sources that differs from the sources and assumptions that were used in
the development of the granular level forecast. The incremental total impact of DER in the System Wide
forecast is a reduction of 70 MW in 2023. One significant difference in the PV forecast is that the top
down System Wide PV forecast does not include the impact of community solar PV in the forecast, as
they are treated as a resource and not as a customer load. The top down System Wide EE forecast was
based on the amount of EE reflected in the NYISO Gold Book and does not reflect the current uptick in
the Company’s EE program approved in our recent rate plan.
The Company continues to see significant solar penetration resulting from regulatory action such as: the
extension of Phase One net energy metering, establishment of the Community Distributed Generation

DSIP Update Topical Sections
63
(CDG) program, and the implementation of a value stack approach to monetary compensation.
Moreover, demand response, through both system-wide and location-targeted initiatives, and
electrification, mainly in the heating and transportation sectors, are increasingly affecting system
throughput. As a result, the Company is currently assessing the frequency, method, and content of its
system sales and demand forecasts to provide more accurate and timely information to address
estimation of sales impacts resulting from these various initiatives. Figure III-XIError! Reference source not
found. provides the current 5 Year System Wide Forecast.
Figure III-XI: Peak Demand (MW)
While the aforementioned system-wide forecasts and the location-specific forecasts discussed below
continue to be developed independently of each other, they are both utilized within the integrated
planning process. The bottom-up, location-specific forecasts are cross-checked against the system-wide
forecasts to ensure that any differences are reconciled or explained due to either line losses or to
substations that are not included in the forecast due to inferior or unavailable hourly data. Optimally, the
most accurate system-wide forecast would be produced from synchronizing the location-specific
forecasts for all substations. However, meter installation requirements and subsequent collection of
sufficient historic data to estimate local load growth shifts this potential outcome to the future.
DSIP Update Topical Sections
64
Location-Specific Forecasts
Integration of DERs requires significant changes to how distribution planning takes place and how it is
coordinated with system forecasts. In the recent past, the approach was to develop load growth forecasts
for each broader area within Central Hudson’s territory and apply them to the specific peak loads for
substations and transmission areas. Central Hudson has evolved its planning process to produce granular,
location-specific, probabilistic forecasts.
A potential key barrier, however, is that not all feeders and substations have meters collecting hourly or
sub‐hourly data. Once meters are installed, several years of data need to be collected to estimate local
annual growth trends. For Central Hudson, this barrier has been eliminated through our ongoing
infrastructure replacement programs. Currently, we have hourly metering data available for
approximately 95% of our cumulative system load with plans to reach close to 99% within four years.
Location-Specific Forecast Methodology
The forecasting process can be summarized in four main steps. These steps are:
1. Clean the data. Historically, data quality for substations and circuit locations has been a barrier to
their use for more granular load forecasting due to lack of metering, meter data gaps, and
abnormal system operations or configurations. This step required extensive use of data analytics
to identify and remove load transfers, outages, data gaps, and data recording errors. Load
transfers were of particular importance since they can be confused with load decreases or
growth.
2. Estimate historical load growth trends and noise. The objective was to estimate historical load
growth for each year in 2010–2017 in percentage terms. The year‐to‐year growth patterns were
then used to assess the growth trend and the variability of load growth patterns; the degree of
growth in a given year was related to growth during the prior year – technically known as
autocorrelation. The econometric models were purposefully designed to both estimate historical
load growth and allow for the weather normalization of loads for 1‐in‐2 weather peaking
conditions. The key to this process was to model the natural log of the daily peak loads as the
dependent variable and include time‐specific coefficients to estimate the percent change in
loads, after controlling for other factors. By using the natural log as the dependent variable, the
time-specific coefficients estimate the annual percent change in loads after controlling for
differences in weather conditions, day of week effects, and seasonality.
3. Weather adjust loads for 1‐in‐2 conditions. Based on historical patterns, years 2013 and 2010,
respectively, reflect the 1‐in‐2 and 1‐in‐10 weather conditions. Econometric models were used to
weather normalize the loads and remove the inherent variation of weather across years.

DSIP Update Topical Sections
65
4. Simulate potential load growth trajectories. The load growth forecasts were developed using
probabilistic methods – Monte Carlo simulations – that produced the range of possible load
growth outcomes by year. This simulates the reality that the near term forecast has less
uncertainty than forecasts ten years in the future. A total of 5,000 simulations were performed
for each transmission area and substation. Each simulation produced a distinct growth trajectory
that took into account the historical trend, variability in growth patterns, and the fact that growth
patterns are auto-correlated.
Transmission Historical Loads and Forecasts
The historical peak demands, room for growth, and growth trajectories vary widely across transmission
areas. Most areas are experiencing declining loads, but a few areas are growing. Actual historical peak
demand levels are first summarized, followed by the presentation of weather normalized historical peaks
and forecasts for each location.
Table 5Error! Reference source not found. compares the historical loading factor (peak / long term
emergency rating) and annual peak demand for each of Central Hudson’s ten transmission areas. Table 6
shows weather normalized historical and forecasted peaks. Locations with a loading factor25 closer to
100% have less room for growth. Most transmission areas are experiencing declining loads or limited
growth. The transmission area that exhibits growth in loads – WM line– has ample existing capacity to
accommodate additional growth over the foreseeable future. The three transmission areas with the
highest loading factors – Westerlo Loop and the Northwest 115k-69k and 69k systems – have not been
growing but are instead experiencing small decrease in peak demand. These three areas are part of the
load to be addressed by the NWA identified for that area. For Table 5 and Table 6, above, note that the
Westerlo Loop area is nested within the NW 69 Area and the NW 69 Area is nested within the NW 115-69
Area. Not all substations are located within a transmission area. For these two reasons, the sum of the
transmission areas will not equal the total system load.
25 Calculated using the average of the peaks in the three most recent, sufficiently complete years

DSIP Update Topical Sections
66
Table 5: Transmission Area Historical Load Growth Estimates (2010‐2017)
Transmission area Rating
(MW)
Historical Peak (MVA) 2017
Loading
Factor (%)
Annual Growth
Forecast
Std. Error 2013 2014 2015 2016 2017
Ellenville 251.0 61.9 58.0 61.1 64.1 60.7 24.2% -0.5% 2.2%
Hurley-Milan 193.0 89.3 82.4 80.3 81.7 76.0 39.4% -1.1% 1.0%
Mid-Dutchess 230.0 128.9 118.8 120.3 119.6 118.1 51.4% -1.1% 2.2%
NW 115-69 Area 150.826 123.5 126.7 119.4 125.7 127.4 84.5% -0.6% 2.6%
NW 69 Area 119.027 100.2 102.3 99.5 97.1 104.2 87.6% -0.8% 3.1%
Pleasant Valley 69 107.0 76.7 63.9 64.0 77.7 62.8 58.7% -0.7% 3.0%
RD-RJ Lines 144.0 96.1 87.2 88.8 92.2 89.6 62.2% 0.0% 0.6%
Southern Dutchess 211.0 157.0 146.3 145.3 151.1 139.7 66.2% -1.7% 1.6%
WM Line 68.0 44.1 39.2 43.5 45.2 43.2 63.6% 1.4% 4.4%
Westerlo Loop 83.6 67.4 71.1 66.6 66.2 72.9 87.2% -0.5% 1.4%
Table 6: Transmission Area Normalized Peak Load Estimates, Historical (2010‐2017) and Forecast
(2018-2023)
Transmission
area Historical 1 in 2 Annual Peak (MVA) Forecasted 1 in 2 Annual Peak (MVA) Rating
(MW) 2013 2014 2015 2016 2017 2018 2019 2020 2021 2022 2023
Ellenville 66.2 66.0 67.7 67.4 67.9 67.7 67.4 67.0 66.7 66.4 66.1 251
Hurley-Milan 90.5 90.1 88.5 86.1 87.1 87.0 86.0 85.1 84.1 83.2 82.2 193
Mid-Dutchess 134.5 128.7 129.8 128.0 126.1 125.7 124.3 122.9 121.6 120.3 119.0 230
NW 115-69 Area 135.9 136.1 133.8 135.6 132.5 131.6 130.8 129.8 129.1 128.3 127.3 150.8
NW 69 Area 97.8 99.4 97.7 97.8 94.1 93.4 92.6 91.8 91.2 90.4 89.5 119
Pleasant Valley
69 77.5 72.8 71.5 75.4 71.3 70.7 70.1 69.5 69.0 68.4 67.8 107
RD-RJ Lines 96.7 96.1 95.7 95.9 96.8 96.8 96.9 96.9 96.9 97.0 97.1 144
Southern
Dutchess 164.2 160.4 159.0 154.3 149.0 148.8 146.3 143.8 141.3 139.0 136.6 211
WM Line 44.4 46.8 49.8 50.5 50.9 51.3 52.0 52.7 53.5 54.2 55.0 68
Westerlo Loop 65.9 65.3 64.3 65.1 63.1 62.8 62.5 62.2 61.9 61.7 61.3 83.6
Figure III-XIIError! Reference source not found. shows forecasted transmission area loads as a percentage
of the LTE. Both are based on probabilistic simulation. The panel to the left shows load under the median
26 Summer rating plus 10 MW of NWAs. Winter rating is 179.2 MVA
27 Summer rating plus 10 MW of NWAs. Winter rating is 147.5 MVA

DSIP Update Topical Sections
67
scenario. The panel to the right shows more extreme growth and reflects load levels that were only
exceeded 10% of the time during the probabilistic growth simulations (i.e., the 90th percentile). Because
most transmission areas are experiencing declining loads or limited growth, the risk of repeatedly
exceeding LTE ratings and triggering an infrastructure upgrade is minimal.
Figure III-XII: Transmission Area Forecast – Expected and Extreme Growth
Appendix E further discusses the transmission area forecasts and how they were used to identify
locations with T&D deferral potential.
Substation Historical Loads and Forecasts
Central Hudson developed hourly (8760) forecasts for its ten distinct transmission areas and 57 of its 62
distribution load serving substations. Some substations either lacked data or had lower quality data and,
as a result, we were unable to estimate location-specific forecasts for all substations. Table 7Error!
Reference source not found. through

DSIP Update Topical Sections
68
Table 14 compare the historical loading factor (peak / long term emergency rating) and growth rate for
each of Central Hudson’s substations with at least three years of hourly historical data. Locations with a
loading factor closer to 100% have less room for growth. Note that eight substations, indicated with an
asterisk (*), are either not metered or don’t have sufficient historical meter data for modeling purposes.
Another three substations, indicated with a double asterisk (**), had incomplete 2017 data so growth
patterns were analyzed but growth factors relative to 2017 could not be calculated.
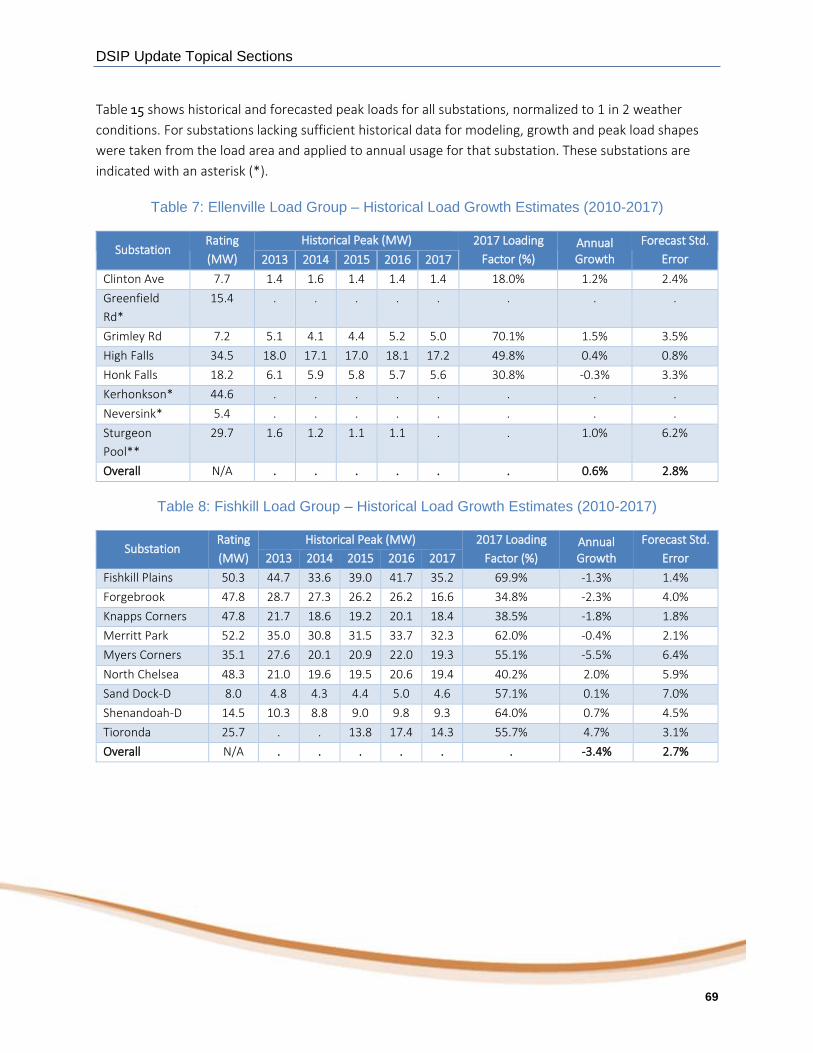
DSIP Update Topical Sections
69
Table 15 shows historical and forecasted peak loads for all substations, normalized to 1 in 2 weather
conditions. For substations lacking sufficient historical data for modeling, growth and peak load shapes
were taken from the load area and applied to annual usage for that substation. These substations are
indicated with an asterisk (*).
Table 7: Ellenville Load Group – Historical Load Growth Estimates (2010-2017)
Substation Rating
(MW)
Historical Peak (MW) 2017 Loading
Factor (%) Annual Growth
Forecast Std.
Error 2013 2014 2015 2016 2017
Clinton Ave 7.7 1.4 1.6 1.4 1.4 1.4 18.0% 1.2% 2.4%
Greenfield
Rd*
15.4 . . . . . . . .
Grimley Rd 7.2 5.1 4.1 4.4 5.2 5.0 70.1% 1.5% 3.5%
High Falls 34.5 18.0 17.1 17.0 18.1 17.2 49.8% 0.4% 0.8%
Honk Falls 18.2 6.1 5.9 5.8 5.7 5.6 30.8% -0.3% 3.3%
Kerhonkson* 44.6 . . . . . . . .
Neversink* 5.4 . . . . . . . .
Sturgeon
Pool**
29.7 1.6 1.2 1.1 1.1 . . 1.0% 6.2%
Overall N/A . . . . . . 0.6% 2.8%
Table 8: Fishkill Load Group – Historical Load Growth Estimates (2010-2017)
Substation Rating
(MW)
Historical Peak (MW) 2017 Loading
Factor (%) Annual Growth
Forecast Std.
Error 2013 2014 2015 2016 2017
Fishkill Plains 50.3 44.7 33.6 39.0 41.7 35.2 69.9% -1.3% 1.4%
Forgebrook 47.8 28.7 27.3 26.2 26.2 16.6 34.8% -2.3% 4.0%
Knapps Corners 47.8 21.7 18.6 19.2 20.1 18.4 38.5% -1.8% 1.8%
Merritt Park 52.2 35.0 30.8 31.5 33.7 32.3 62.0% -0.4% 2.1%
Myers Corners 35.1 27.6 20.1 20.9 22.0 19.3 55.1% -5.5% 6.4%
North Chelsea 48.3 21.0 19.6 19.5 20.6 19.4 40.2% 2.0% 5.9%
Sand Dock-D 8.0 4.8 4.3 4.4 5.0 4.6 57.1% 0.1% 7.0%
Shenandoah-D 14.5 10.3 8.8 9.0 9.8 9.3 64.0% 0.7% 4.5%
Tioronda 25.7 . . 13.8 17.4 14.3 55.7% 4.7% 3.1%
Overall N/A . . . . . . -3.4% 2.7%

DSIP Update Topical Sections
70
Table 9: Kingston-Saugerties Load Group Area – Historical Load Growth Estimates (2010-2017)
Substation Rating
(MW)
Historical Peak (MW) 2017 Loading
Factor (%) Annual Growth
Forecast Std.
Error 2013 2014 2015 2016 2017
Boulevard 35.0 22.3 20.5 20.4 21.5 18.4 52.5% -1.5% 2.7%
East Kingston 48.0 13.1 12.0 11.7 12.2 12.0 25.1% -0.1% 4.3%
Hurley Ave 23.1 18.4 17.2 17.0 18.3 16.8 72.7% -0.8% 2.1%
Lincoln Park 84.0 40.3 42.2 41.1 41.5 38.3 45.6% -1.6% 0.8%
Saugerties 54.1 23.4 19.4 20.5 22.2 20.8 38.5% -0.4% 0.7%
Woodstock 20.9 19.0 21.0 20.2 20.1 21.1 100.7% 0.7% 6.0%
Overall N/A . . . . . . -1.0% 0.6%
Table 10: Modena Load Group – Historical Load Growth Estimates (2010-2017)
Substation Rating
(MW)
Historical Peak (MW) 2017 Loading
Factor (%) Annual Growth
Forecast Std.
Error 2013 2014 2015 2016 2017
Galeville** 28.7 9.4 9.1 11.0 . . . 7.0% 2.4%
Highland 32.9 18.6 17.1 17.0 18.1 17.2 52.2% 0.8% 1.3%
Modena 25.9 13.7 12.1 12.5 13.4 12.7 49.1% 1.1% 4.1%
Ohioville** 29.7 25.6 23.5 22.0 . . . -3.0% 4.0%
Overall N/A . . . . . . -2.7% 9.4%
Table 11: Newburgh Load Group Area – Historical Load Growth Estimates (2010-2017)
Substation Rating
(MW)
Historical Peak (MW) 2017 Loading
Factor (%) Annual Growth
Forecast Std.
Error 2013 2014 2015 2016 2017
Bethlehem Rd 47.8 34.8 34.5 35.6 36.9 37.4 78.3% -0.1% 3.4%
Coldenham 48.8 36.8 33.6 30.8 30.6 31.7 65.0% -0.2% 7.3%
East Walden 26.2 15.3 14.1 14.7 14.8 13.0 49.5% -0.1% 3.7%
Marlboro 30.9 . . 18.8 20.1 19.4 62.8% 0.6% 2.2%
Maybrook 24.0 15.2 14.6 17.8 18.9 18.6 77.6% 4.1% 11.9%
Montgomery* 2.8 . . . . . . . .
Union Ave 94.5 55.5 53.1 55.6 56.0 50.2 53.1% -0.5% 1.2%
West Balmville 47.8 39.3 33.1 35.2 35.6 35.3 73.8% -2.0% 3.6%
Overall N/A . . . . . . 1.4% 0.2%

DSIP Update Topical Sections
71
Table 12: Northeastern Dutchess Load Group – Historical Load Growth Estimates (2010-2017)
Substation Rating
(MW)
Historical Peak (MW) 2017 Loading
Factor (%) Annual Growth
Forecast Std.
Error 2013 2014 2015 2016 2017
East Park 24.2 14.1 11.7 12.0 9.5 12.3 50.8% -2.5% 4.1%
Hibernia 17.8 12.2 10.5 10.6 10.0 10.8 60.4% -0.6% 4.8%
Milan 25.9 4.9 5.4 5.2 6.6 6.6 25.5% 6.1% 6.8%
Millerton 8.3 4.9 5.3 5.0 4.7 5.2 62.2% -1.2% 2.4%
Pulvers 13 5.8 . . 4.4 4.7 4.9 83.7% -0.6% 5.0%
Pulvers 34 17.2 . 2.8 2.8 3.1 2.8 16.1% -0.9% 2.1%
Rhinebeck 47.8 30.8 28.4 27.6 28.9 26.5 55.5% -1.2% 1.6%
Smithfield 5.8 1.4 1.5 1.5 1.4 1.4 23.8% -0.3% 4.6%
Staatsburg 26.5 9.3 8.6 8.0 8.7 8.2 30.8% -1.1% 2.6%
Stanfordville 6.3 . 5.5 5.2 5.8 3.9 62.3% -5.5% 10.0%
Tinkertown 19.1 14.5 12.9 13.1 15.9 13.2 69.2% 0.3% 2.9%
Overall N/A . . . . . . -0.9% 2.1%
Table 13: Northwest Load Group – Historical Load Growth Estimates (2010-2017)
Substation Rating
(MW)
Historical Peak (MW) 2017 Loading
Factor (%) Annual Growth
Forecast Std.
Error 2013 2014 2015 2016 2017
Coxsackie* 16.4 . . . . . . . .
Freehold* 15.8 . . . . . . . .
Hunter 19.5 13.5 12.4 10.9 12.4 11.1 56.9% 0.7% 17.7%
Lawrenceville 22.1 16.1 16.2 12.4 16.0 13.2 59.6% -0.7% 23.2%
New Baltimore 25.8 9.0 9.4 8.8 9.1 9.2 35.6% -0.2% 1.5%
North Catskill 35.1 25.2 21.9 23.1 24.8 22.7 64.6% -0.8% 0.9%
South Cairo* 19.9 . . . . . . . .
Vinegar Hill 20.7 9.1 9.1 9.9 8.5 10.3 49.9% -0.3% 2.2%
Westerlo 27.0 8.2 8.6 8.2 9.7 8.2 30.2% 0.6% 4.5%
Overall N/A . . . . . . -0.3% 2.1%

DSIP Update Topical Sections
72
Table 14: Poughkeepsie Load Area – Historical Load Growth Estimates (2010-2017)
Substation Rating
(MW)
Historical Peak (MW) 2017 Loading
Factor (%) Annual Growth
Forecast Std.
Error 2013 2014 2015 2016 2017
Inwood Ave 47.8 25.8 22.0 24.6 26.5 21.5 45.0% 0.3% 7.4%
Manchester* 47.8 . . . . . . . .
Reynolds Hill 47.8 34.9 34.6 32.7 36.9 34.1 71.3% 0.0% 3.9%
Spackenkill 47.8 35.4 31.0 31.9 33.9 30.5 63.7% -1.3% 0.2%
Todd Hill 47.8 22.8 20.4 21.3 22.7 19.6 41.0% -3.0% 3.3%
Overall N/A . . . . . . 2.0% 3.5%
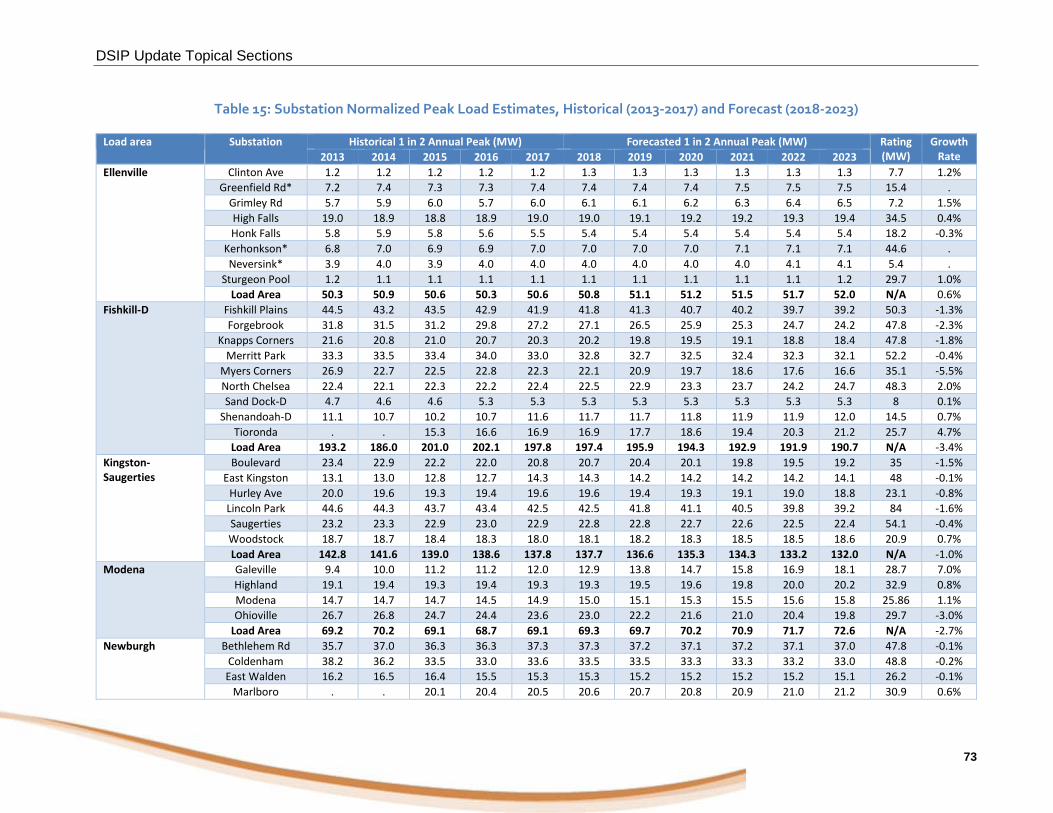
DSIP Update Topical Sections
73
Table 15: Substation Normalized Peak Load Estimates, Historical (2013‐2017) and Forecast (2018-2023)
Load area Substation Historical 1 in 2 Annual Peak (MW) Forecasted 1 in 2 Annual Peak (MW) Rating (MW)
Growth Rate 2013 2014 2015 2016 2017 2018 2019 2020 2021 2022 2023
Ellenville Clinton Ave 1.2 1.2 1.2 1.2 1.2 1.3 1.3 1.3 1.3 1.3 1.3 7.7 1.2%
Greenfield Rd* 7.2 7.4 7.3 7.3 7.4 7.4 7.4 7.4 7.5 7.5 7.5 15.4 .
Grimley Rd 5.7 5.9 6.0 5.7 6.0 6.1 6.1 6.2 6.3 6.4 6.5 7.2 1.5%
High Falls 19.0 18.9 18.8 18.9 19.0 19.0 19.1 19.2 19.2 19.3 19.4 34.5 0.4%
Honk Falls 5.8 5.9 5.8 5.6 5.5 5.4 5.4 5.4 5.4 5.4 5.4 18.2 -0.3%
Kerhonkson* 6.8 7.0 6.9 6.9 7.0 7.0 7.0 7.0 7.1 7.1 7.1 44.6 .
Neversink* 3.9 4.0 3.9 4.0 4.0 4.0 4.0 4.0 4.0 4.1 4.1 5.4 .
Sturgeon Pool 1.2 1.1 1.1 1.1 1.1 1.1 1.1 1.1 1.1 1.1 1.2 29.7 1.0%
Load Area 50.3 50.9 50.6 50.3 50.6 50.8 51.1 51.2 51.5 51.7 52.0 N/A 0.6%
Fishkill-D Fishkill Plains 44.5 43.2 43.5 42.9 41.9 41.8 41.3 40.7 40.2 39.7 39.2 50.3 -1.3%
Forgebrook 31.8 31.5 31.2 29.8 27.2 27.1 26.5 25.9 25.3 24.7 24.2 47.8 -2.3%
Knapps Corners 21.6 20.8 21.0 20.7 20.3 20.2 19.8 19.5 19.1 18.8 18.4 47.8 -1.8%
Merritt Park 33.3 33.5 33.4 34.0 33.0 32.8 32.7 32.5 32.4 32.3 32.1 52.2 -0.4%
Myers Corners 26.9 22.7 22.5 22.8 22.3 22.1 20.9 19.7 18.6 17.6 16.6 35.1 -5.5%
North Chelsea 22.4 22.1 22.3 22.2 22.4 22.5 22.9 23.3 23.7 24.2 24.7 48.3 2.0%
Sand Dock-D 4.7 4.6 4.6 5.3 5.3 5.3 5.3 5.3 5.3 5.3 5.3 8 0.1%
Shenandoah-D 11.1 10.7 10.2 10.7 11.6 11.7 11.7 11.8 11.9 11.9 12.0 14.5 0.7%
Tioronda . . 15.3 16.6 16.9 16.9 17.7 18.6 19.4 20.3 21.2 25.7 4.7%
Load Area 193.2 186.0 201.0 202.1 197.8 197.4 195.9 194.3 192.9 191.9 190.7 N/A -3.4%
Kingston-Saugerties
Boulevard 23.4 22.9 22.2 22.0 20.8 20.7 20.4 20.1 19.8 19.5 19.2 35 -1.5%
East Kingston 13.1 13.0 12.8 12.7 14.3 14.3 14.2 14.2 14.2 14.2 14.1 48 -0.1%
Hurley Ave 20.0 19.6 19.3 19.4 19.6 19.6 19.4 19.3 19.1 19.0 18.8 23.1 -0.8%
Lincoln Park 44.6 44.3 43.7 43.4 42.5 42.5 41.8 41.1 40.5 39.8 39.2 84 -1.6%
Saugerties 23.2 23.3 22.9 23.0 22.9 22.8 22.8 22.7 22.6 22.5 22.4 54.1 -0.4%
Woodstock 18.7 18.7 18.4 18.3 18.0 18.1 18.2 18.3 18.5 18.5 18.6 20.9 0.7%
Load Area 142.8 141.6 139.0 138.6 137.8 137.7 136.6 135.3 134.3 133.2 132.0 N/A -1.0%
Modena Galeville 9.4 10.0 11.2 11.2 12.0 12.9 13.8 14.7 15.8 16.9 18.1 28.7 7.0%
Highland 19.1 19.4 19.3 19.4 19.3 19.3 19.5 19.6 19.8 20.0 20.2 32.9 0.8%
Modena 14.7 14.7 14.7 14.5 14.9 15.0 15.1 15.3 15.5 15.6 15.8 25.86 1.1%
Ohioville 26.7 26.8 24.7 24.4 23.6 23.0 22.2 21.6 21.0 20.4 19.8 29.7 -3.0%
Load Area 69.2 70.2 69.1 68.7 69.1 69.3 69.7 70.2 70.9 71.7 72.6 N/A -2.7%
Newburgh Bethlehem Rd 35.7 37.0 36.3 36.3 37.3 37.3 37.2 37.1 37.2 37.1 37.0 47.8 -0.1%
Coldenham 38.2 36.2 33.5 33.0 33.6 33.5 33.5 33.3 33.3 33.2 33.0 48.8 -0.2%
East Walden 16.2 16.5 16.4 15.5 15.3 15.3 15.2 15.2 15.2 15.2 15.1 26.2 -0.1%
Marlboro . . 20.1 20.4 20.5 20.6 20.7 20.8 20.9 21.0 21.2 30.9 0.6%

DSIP Update Topical Sections
74
Load area Substation Historical 1 in 2 Annual Peak (MW) Forecasted 1 in 2 Annual Peak (MW) Rating (MW)
Growth Rate 2013 2014 2015 2016 2017 2018 2019 2020 2021 2022 2023
Maybrook 13.8 14.7 19.1 21.2 21.9 22.1 23.0 23.9 24.7 25.7 26.6 24 4.1%
Montgomery* . . 1.4 1.4 1.4 1.4 1.4 1.5 1.5 1.5 1.5 2.8 .
Union Ave 59.3 58.0 58.4 57.7 57.6 57.5 57.2 56.9 56.6 56.4 56.1 94.5 -0.5%
West Balmville 40.1 40.1 37.8 38.0 37.6 37.2 36.5 35.7 35.0 34.3 33.6 47.8 -2.0%
Load Area 203.0 202.1 222.4 222.9 224.7 224.3 224.2 223.8 223.7 223.8 223.5 N/A 1.4%
Northeastern Dutchess
East Park 13.5 13.0 13.1 12.2 13.0 12.9 12.6 12.3 11.9 11.6 11.3 24.2 -2.5%
Hibernia 11.5 11.4 10.9 10.2 10.6 10.6 10.5 10.4 10.4 10.3 10.2 17.8 -0.6%
Milan 4.8 5.2 6.1 7.1 7.1 7.2 7.6 8.0 8.5 9.0 9.5 25.9 6.1%
Millerton 4.9 4.9 4.9 4.7 4.7 4.6 4.6 4.5 4.5 4.4 4.3 8.3 -1.2%
Pulvers 13 . . 4.7 4.7 4.9 4.8 4.8 4.7 4.7 4.6 4.6 5.8 -0.6%
Pulvers 34 . 3.1 3.0 3.0 3.0 3.0 3.0 2.9 2.9 2.9 2.8 17.2 -0.9%
Rhinebeck 32.0 31.8 31.2 30.1 29.8 29.8 29.4 29.1 28.7 28.4 28.0 47.8 -1.2%
Smithfield 1.3 1.5 1.4 1.4 1.3 1.3 1.3 1.3 1.3 1.3 1.3 5.8 -0.3%
Staatsburg 9.5 8.9 8.9 8.9 8.7 8.6 8.5 8.4 8.3 8.2 8.2 26.5 -1.1%
Stanfordville . 6.0 5.8 5.5 4.4 4.4 4.2 3.9 3.7 3.5 3.3 6.3 -5.5%
Tinkertown 15.7 15.6 15.2 16.3 15.8 15.9 15.9 15.9 16.0 16.0 16.0 19.1 0.3%
Load Area 92.3 100.1 103.7 102.8 102.1 101.8 101.0 100.3 99.6 99.0 98.4 N/A -0.9%
Northwest Coxsackie* . 12.2 12.1 12.4 12.0 11.9 11.9 11.8 11.8 11.7 11.7 16.4 .
Freehold* . 5.8 5.8 5.9 5.7 5.7 5.7 5.6 5.6 5.6 5.6 15.8 .
Hunter 11.8 11.2 9.8 11.9 9.0 9.1 8.9 8.7 8.6 8.5 8.3 19.5 0.7%
Lawrenceville 17.7 13.7 12.5 14.4 12.7 12.4 11.0 9.7 8.6 7.6 6.6 22.1 -0.7%
New Baltimore 8.6 8.6 8.7 8.6 8.4 8.4 8.3 8.3 8.3 8.3 8.3 25.8 -0.2%
North Catskill 26.8 26.3 26.3 25.6 25.7 25.6 25.4 25.2 25.0 24.8 24.6 35.1 -0.8%
South Cairo* . 11.4 11.3 11.6 11.2 11.1 11.1 11.0 11.0 10.9 10.9 19.9 .
Vinegar Hill 10.0 10.1 9.8 9.9 9.7 9.7 9.6 9.6 9.6 9.5 9.5 20.7 -0.3%
Westerlo 8.0 7.8 8.1 8.5 7.6 7.6 7.7 7.7 7.8 7.8 7.8 27 0.6%
Load Area 68.5 93.2 91.3 95.1 89.1 88.7 87.1 85.5 84.2 83.0 81.7 N/A -0.3%
Poughkeepsie-Distribution
Inwood Ave 24.1 24.2 23.8 26.4 23.4 23.5 23.3 23.1 23.1 22.8 22.6 47.8 0.3%
Manchester* 27.6 27.2 27.9 30.5 29.6 29.9 30.5 31.1 31.7 32.4 33.1 47.8 .
Reynolds Hill 35.8 36.3 36.6 38.7 37.4 37.4 37.4 37.4 37.4 37.4 37.3 47.8 0.0%
Spackenkill 37.4 36.9 36.4 35.9 35.6 35.6 35.1 34.7 34.2 33.8 33.3 47.8 -1.3%
Todd Hill 25.2 24.8 24.3 23.7 23.5 23.4 22.7 22.0 21.4 20.8 20.1 47.8 -3.0%
Load Area 148.1 147.4 147.1 153.2 147.7 147.9 147.2 146.4 145.9 145.3 144.7 N/A 2.0%

DSIP Update Topical Sections
75
Figure III-XIIIError! Reference source not found. summarizes the likelihood that loads will exceed long term
emergency ratings by year for five substations – Hunter, Lawrenceville, Maybrook, Tioronda, and
Woodstock. All other substations either have ample room for growth or are experiencing declining loads.
Loads can exceed design rating without automatically triggering an infrastructure upgrade. Sustained load
above the LTE ratings need to be observed before substations are upgraded. In some cases, upgrades can
be deferred for longer periods through relatively low costs distribution upgrades or load transfers.
Figure III-XIII: Probability of Loads Exceeding Design Ratings
Appendix E further discusses the transmission area forecasts and how they were used to identify
locations with T&D deferral potential.
Forecasting Distributed Energy Resources
The adoption of distributed energy resources by customers, outside the planning process, introduces
significant uncertainty and creates a challenge for long-term planning. As a result, load forecasts must
now incorporate predictions of DER growth, which require careful tracking and frequent model refining
and forecast updating. Further, the adoption of different DERs varies by location, necessitating granular
estimates to anticipate system impacts.
Figure III-XIV provides a high level overview of the forecasting process for DERs. Central Hudson has
applied this process for distributed solar, electric vehicle adoption, and energy efficiency, producing
forecasts and 8760 load impacts for each load serving substation in its territory.

DSIP Update Topical Sections
76
Figure III-XIV: Distributed Forecast Process
The nuances of the forecasts vary slightly for different DERs but the process is similar. The steps are
discussed in more detail below.
1. Identify data sources and key drivers. In some instances, Central Hudson has comprehensive data
regarding where DERs are located, the magnitude of the resources, and when those resources
were deployed – energy efficiency and solar are instances where Central Hudson has full data. In
other instances, such as EVs, Central Hudson only has partial visibility into information about
when, where, and how many electric vehicles and plug-in hybrids were adopted and must rely on
external data sources such as New York vehicle registration data, which includes details regarding
all registered vehicles in New York and the zip code, but not the specific address, where the
vehicle is registered. The drivers of adoptions also vary by the type of DER in question. For solar,
the main driver is customer preferences followed by the introduction of the solar leasing and
power purchase agreement models. For energy efficiency, the focus was on program based
energy efficiency – where Central Hudson offers incentives, discounts and/or rebates – which is
driven by policy objectives and regulated budgets. The naturally occurring (non-program based)
energy efficiency is absorbed in the load growth forecasts.
2. Analyze historical data. For each DER, Central Hudson analyzed how penetration grew over time,
the dispersion of the resources and, where appropriate, the historical performance of Central
Hudson at meeting policy goals. In some instances, such as electric vehicles, the distribution of
vehicles across years and the replacement rates were key inputs and were also analyzed.
3. Forecast system adoption. Where and when possible, Central Hudson relied on fitting innovation
diffusion curves to historical data – a non-linear regression often referred to as S-curves. When
implemented properly, innovation diffusion curves use historical data to estimate, with
uncertainty, the future trajectory of cumulative adoptions and estimate the overall market
adoption rate. Fitting innovation diffusion curves requires a sufficient history of adoption.

DSIP Update Topical Sections
77
Innovation diffusion curves explained the historical adoption of solar extremely well and were
used to develop the forecasts. For DERs in their nascent stages or experiencing truly disruptive
innovation, fitting innovation diffusion curves is not always feasible. In the case of electric
vehicles, Central Hudson employed data on adoption of proxy technology – green vehicles
overall, which includes hybrids, EVs, and plug-in hybrids – and data on vehicle replacement rates
and the distribution across model years to estimate overall adoption over time. Because electric
vehicles have the potential to achieve deeper penetration than hybrids, scenarios were modeled
assuming similar penetration as hybrid and twice the penetration of hybrids. For energy
efficiency, where explicit quantity goals are in place, the historical track record in achieving those
goals and the volatility observed were employed to produce forecasts with uncertainty.
4. Model adoption propensity at a granular level (dispersion modeling). Estimating where and how
much of specific DERs are likely to be adopted is critical for assessing how they will influence
distribution and transmission loads and infrastructure upgrades. This requires modeling customer
adoption at granular level, ideally for individual premises. For most DERs – energy efficiency,
solar, and electric vehicles – data was available that enabled Central Hudson to predict which
customers had a higher propensity for adoption based on characteristics such as energy use
patterns, weather sensitivity, customer size, participation in other programs, and geographic
location. Not all variables were predictive so different models were employed for different DERs.
The process enabled scoring of customers into groups with higher or lower likelihood of
adoption, which in turn allowed for the estimation of whether expected adoption rates are higher
or lower for specific substation and/or transmission areas.
5. Calibrate the granular adoption rates to the aggregate forecast. For each forecast year, the
adoption of DERs was calibrated to add up to the aggregate forecast with uncertainty. The goal
was to accurately reflect the current penetration of DERs and expect growth on a year by year
basis.
6. Produce 8760 hourly load shapes for different DERs. The main objective of the study was to
understand how DERs and electric vehicle adoption is expected to influence distribution and
transmission loads. A key step, therefore, was to model hourly load shapes of DERs under T&D
planning conditions, which are defined by a normal or 1-in-2 weather year. The 8760 hourly load
shapes were produced for solar, electric vehicles, and various types of energy efficiency, by
building type and end use. The data sources and methodology for producing those load shapes
are detailed in the appendices to Central Hudson’s prior 2016 DSIP filing.
7. Combine 8760 load shapes with granular DER adoption forecasts. To understand the expected
impact on transmission and distribution loads, the expected DER adoption for each year at each
substation was multiplied by the 8760 load shapes, producing an estimate of the hourly impacts

DSIP Update Topical Sections
78
on distribution loads. The substation DER forecasts were then aggregated to understand the
impact on specific transmission areas.
Appendix A provides additional detail regarding the development of granular spatial and temporal
forecasts by DER. The tables below show the 5 year DER forecasts for EE, PV, and EV granular by load
area. Load areas are groups of adjacent substations with loads that can be transferred between the
substations.
Table 16 shows the peak savings coincident with the local peak of each load area. For comparison, the
weather normalized energy efficiency demand savings are shown. The estimates show cumulative energy
efficiency savings since 2009. Energy efficiency programs to date have delivered approximately 70 MW of
peak savings. By 2023, peak savings from energy efficiency are projected to total slightly less the 150
MW, or an incremental 80 MW of peak savings. Because of differences on when local peaks occur, the
sum of individual loads areas does not equal the system coincident peak savings.
Table 16: Peak Coincident Demand Savings Forecasts by Load Area and Year
Load area Peak Month
Peak Hour
Historical 1 in 2 Annual Peak (MW) Forecasted 1 in 2 Annual Peak (MW) 2013 2014 2015 2016 2017 2018 2019 2020 2021 2022 2023
Ellenville 7 18 2.1 1.9 2.0 2.2 2.5 2.6 2.8 3.0 3.8 4.6 5.4 Fishkill-D 7 16 2.7 3.7 7.1 9.7 11.2 12.0 12.9 13.8 16.6 19.4 22.2 Kingston-Saugerties
7 16 3.1 3.5 4.2 6.0 7.4 8.6 9.9 11.3 14.0 16.7 19.4
Modena 7 17 1.5 1.6 1.9 3.2 4.4 5.5 6.6 7.7 9.5 11.3 13.1 Newburgh 7 16 4.3 5.3 7.1 10.1 10.6 11.4 12.1 12.9 15.3 17.7 20.2 Northeastern Dutchess
7 17 2.8 2.6 2.8 4.1 5.3 6.2 7.1 8.0 10.2 12.3 14.4
Northwest 1 19 0.9 0.9 1.1 1.4 1.8 2.1 2.5 2.9 3.1 3.4 3.7 Poughkeepsie-D 7 16 3.9 4.2 4.8 6.5 7.2 7.9 8.6 9.4 11.4 13.3 15.3 System 7 17 36.4 39.1 47.1 60.0 69.1 77.0 85.2 93.5 112.1 130.7 149.3
Table 17 shows the solar output coincident with the local peak of each load area. Load areas are groups
of adjacent substations with loads that can be transferred between the substations. Several of the load
areas peak later in the day than the Central Hudson system and one area peaks in the winter. The solar
production does not necessarily coincide with the local peaks, which are more diverse. Because solar
production is substantially higher in the early afternoon a difference of a couple hours can yield
significant differences in production.

DSIP Update Topical Sections
79
Table 17: Peak Solar Production Forecasts by Load Area and Year
Load area Peak Month
Peak Hour
Historical 1 in 2 Annual Peak (MW) Forecasted 1 in 2 Annual Peak (MW) 2013 2014 2015 2016 2017 2018 2019 2020 2021 2022 2023
Ellenville 7 18 0.2 0.3 0.4 0.8 0.9 1.3 2.4 4.3 5.0 5.3 5.5 Fishkill-D 7 16 0.5 1.2 2.1 2.8 3.5 4.6 5.5 6.4 6.4 6.5 6.5 Kingston-Saugerties
7 16 0.9 1.3 2.0 2.7 3.0 4.1 5.6 6.4 8.8 9.4 9.5
Modena 7 17 0.6 0.9 1.3 1.7 2.1 2.3 2.9 3.6 4.8 5.4 5.4 Newburgh 7 16 1.4 2.4 3.8 5.1 5.7 6.3 8.7 11.0 12.5 13.3 13.4 Northeastern Dutchess
7 17 1.2 1.2 1.9 2.4 2.6 2.9 4.2 5.5 6.0 6.1 6.1
Northwest 1 19 0.0 0.0 0.0 0.0 0.0 0.0 0.0 0.0 0.0 0.0 0.0 Poughkeepsie-D 7 16 0.4 0.6 1.2 1.8 2.1 2.6 3.5 4.4 5.3 5.5 5.6 System 7 17 4.3 7.0 11.0 15.2 17.7 22.1 31.7 45.2 54.7 58.6 59.0
Figure III-XV shows the cumulative forecast of electric vehicle loads on the Central Hudson peak day. The
graph shows the year-by-year change in electric vehicle home charging loads. Data regarding electric
vehicle charging outside of homes was not available. It is anticipated that rate designs will incentivize off
peak charging and as a result the vast majority electric vehicle load will occur late at night or in early
morning hours (due to automated timers), and because of this they improve utilization of existing T&D
resources and rarely lead to substation or transmission reinforcements. Their contribution to peak is
therefore expected to be minimal or near zero.
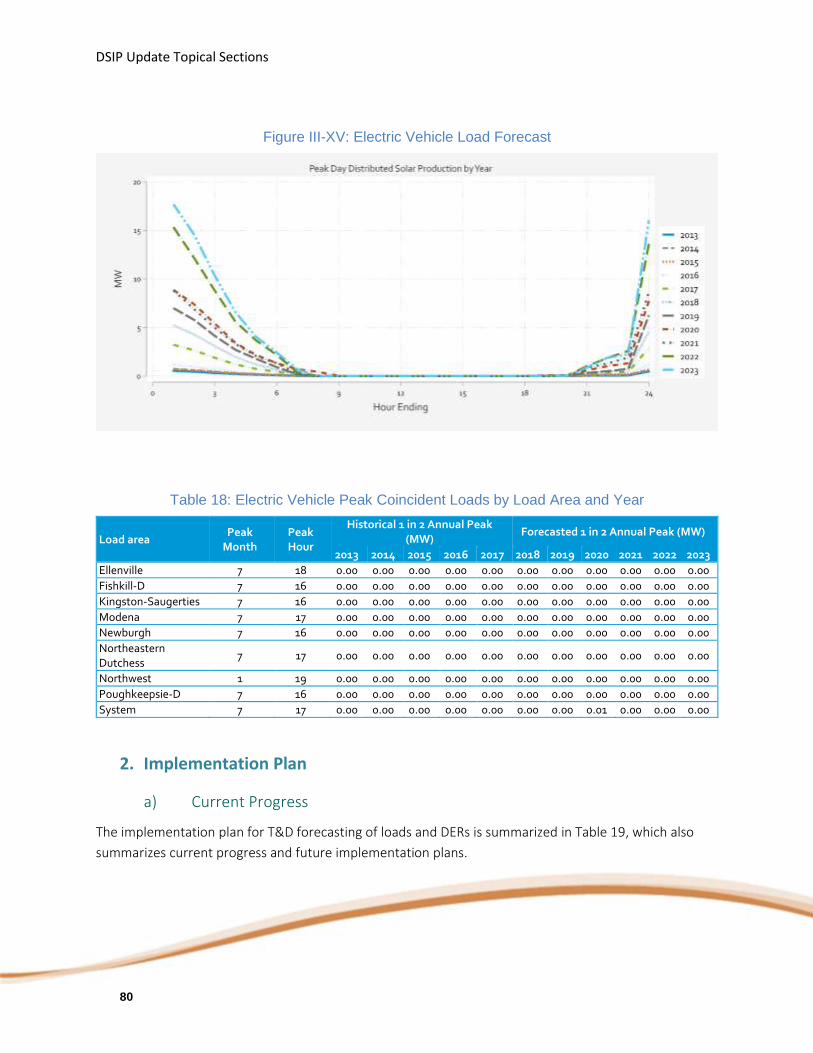
DSIP Update Topical Sections
80
Figure III-XV: Electric Vehicle Load Forecast
Table 18: Electric Vehicle Peak Coincident Loads by Load Area and Year
Load area Peak Month
Peak Hour
Historical 1 in 2 Annual Peak (MW) Forecasted 1 in 2 Annual Peak (MW)
2013 2014 2015 2016 2017 2018 2019 2020 2021 2022 2023 Ellenville 7 18 0.00 0.00 0.00 0.00 0.00 0.00 0.00 0.00 0.00 0.00 0.00 Fishkill-D 7 16 0.00 0.00 0.00 0.00 0.00 0.00 0.00 0.00 0.00 0.00 0.00 Kingston-Saugerties 7 16 0.00 0.00 0.00 0.00 0.00 0.00 0.00 0.00 0.00 0.00 0.00 Modena 7 17 0.00 0.00 0.00 0.00 0.00 0.00 0.00 0.00 0.00 0.00 0.00 Newburgh 7 16 0.00 0.00 0.00 0.00 0.00 0.00 0.00 0.00 0.00 0.00 0.00 Northeastern Dutchess 7 17 0.00 0.00 0.00 0.00 0.00 0.00 0.00 0.00 0.00 0.00 0.00
Northwest 1 19 0.00 0.00 0.00 0.00 0.00 0.00 0.00 0.00 0.00 0.00 0.00 Poughkeepsie-D 7 16 0.00 0.00 0.00 0.00 0.00 0.00 0.00 0.00 0.00 0.00 0.00 System 7 17 0.00 0.00 0.00 0.00 0.00 0.00 0.00 0.01 0.00 0.00 0.00
2. Implementation Plan
a) Current Progress
The implementation plan for T&D forecasting of loads and DERs is summarized in Table 19, which also
summarizes current progress and future implementation plans.

DSIP Update Topical Sections
81
Table 19: Implementation Plan
Implementation Step T&D Loads Distributed
Solar
Energy
Efficiency
Electric
Vehicles
Battery
Storage
1. Identify data sources
2019
2. Develop granular
forecasting methodology 2020
3. Test methodology
2020
4.
Scale methodology for all
substations and
transmission areas
2020
5. Produce forecasts
2020
6. Make forecasts publicly
available
August
2018
August
2018
August
2018
August
2018 2020
With the exception of battery storage, Central Hudson has completed all steps in the implementation
plan. Distributed battery storage is in too nascent a stage to produce reliable estimates of customer
adoption. To date, Central Hudson has received 67 applications for customer sited battery storage of
which 47 have been completed and are interconnected to our system. For battery storage, the plan is to
carefully track adoption and start producing forecasts when sufficient data is available to understand
what adoption trends are and which customers are most likely to adopt battery storage. In addition, to
inform future forecasts, Central Hudson will actively participate in PSC Proceedings regarding the
implementation of the Energy Storage Roadmap.
b) Future Implementation and Planning
The granular data on existing resources and forecasted loads will be publicly posted by October 2018.
Central Hudson’s plan is to further refine the process for producing forecasts and to automate it, to the
extent possible, starting in 2019. There are two areas where additional refinements are needed:

DSIP Update Topical Sections
82
1. Improvements in data cleaning and tracking of load transfers. While the current approach
automates several aspects of data cleaning, it relies on visual inspections of patterns to ensure
the load transfers and metering issues are not classified as legitimate changes in loads (and vice-
versa). The forecasting process cannot be fully automated without refining the data cleaning
algorithms and making better use of load transfer records.
2. Estimating historical gross loads. As part of the DSIP, Central Hudson attempted to explicitly
model the effects of solar adoption and energy efficiency on T&D loads using time series data.
This proved to be challenging due to the high correlation between New York economic growth
and energy efficiency (correlation of 0.95) and solar adoption (correlation of 0.84). Economic
conditions have exhibited continuous improvement since the start of the analysis in 2010, which
happens to coincide with growth in energy efficiency implementation and solar adoption. The
factors are so tightly woven that it is difficult to disentangle them with confidence. Thus, the
approach for estimating growth in gross loads needs to be refined.
3. Risks and Mitigation
There are a few steps that can be undertaken to ensure load forecasts are accurate:
Beyond what is currently available for PV and Company administered EE and DR programs, set up
processes to track installation and adoption of other types of DERs and their specific locations;
Set up processes to track when and where DERs were dispatched (e.g., battery storage or DR) and
the magnitude of the resources dispatched;
Track if actual adoption of DERs differed from the historical forecasts;
Update locational forecasts and location-specific avoided T&D costs on a bi‐annual basis; and
Explicitly model uncertainty of forecast loads and incremental DERs. While tracking can help
improve accuracy, it is just as important to be explicit about uncertainty so locational forecasts
reflect the full range of potential growth patterns.
4. Stakeholder Interface
The stakeholder interface will be hosted on Central Hudson’s website and it will be map based. The maps,
as illustrated in Figure III-XXIII, will be interactive. The main display will be a choropleth map, often
referred to as a heat map, which shows which locations have higher or lower T&D deferral value
potential. The map will include popup information boxes that, when clicked, provide users details
regarding the name of the substation, expected T&D deferral value, growth rate, loading factor, and Long
Term Emergency ratings. The popup boxes will include links that allow users to download historical and
forecast 8760 data as a CSV file.

DSIP Update Topical Sections
83
5. Additional Detail
a) Identify where and how DER developers and other stakeholders can readily
access, navigate, view, sort, filter, and download up-to-date load and supply
forecasts.
Central Hudson has developed a System Data Portal on its public website at www.cenhud.com, under My
Energy and Solar Energy and Distributed Generation. The System Data Portal provides substation and
transmission area load and supply forecast for 5 years on an hourly basis.
b) Identify and characterize each load and supply forecasting requirement
identified from stakeholder inputs.
In Stakeholder discussions held by the Joint Utilities in the Load Forecasting Working Group and the
System Data Working Group, the stakeholders identified that historical hourly load data to the circuit
level and forecasted hourly load data at the substation level would be sufficient for their purposes. Also in
these discussions, the stakeholders expressed a desire to have the DER forecasts at the same level of
granularity.
c) Describe in detail the existing and/or planned forecasts produced for third
party use and explain how those forecasts fulfill each identified stakeholder
requirement identified for load and supply forecasts.
Central Hudson currently provides load and DER forecasts for 5 years down to the Substation Level and
makes these forecasts available for third-party use through its system data portal.
d) Describe the spatial and temporal granularity of the system-level and local-
level load and supply forecasts produced.
Central Hudson’s forecasts for both load and DER are provided for 5 years at the Substation and
Transmission Area level and for 8760 hours.
e) Describe the forecasts provided separately for key areas including but not
limited to photovoltaics, energy storage, electric vehicles, and energy efficiency.
Central Hudson develops separate forecasts for load and DERs, including Energy Efficiency, Electric
Vehicles, and the various solar markets. Due to the nascent nature of energy storage technologies and
current low penetration levels, Central Hudson does not have a need to develop a separate forecast for
Energy Storage at this time.
DSIP Update Topical Sections
84
f) Describe the advanced forecasting capabilities which are/will be
implemented to enable effective probabilistic planning methods.
Central Hudson now produces probabilistic load forecasts and probabilistic DER forecasts for EE, EV, and
Solar, but has not yet developed a forecast for Energy Storage. Central Hudson made significant progress
in the development and implementation of probabilistic forecasting capabilities as part of the 2016 DSIP
filing. Central Hudson has continued to advance these methodologies since this time as outlined in this
section and within Appendices A (Load and DER Forecasts) and E (Location Specific T & D Cost Report).
The use of probabilistic methods has been integrated into our normal forecasting and planning process.
As the Energy Storage Roadmap progresses and use cases are developed that provide for both the
expected market and the expected load shape impacts based on charging and discharging, Central
Hudson will develop a probabilistic forecasting methodology to account for Energy Storage.
g) Describe how the utility’s existing/planned advanced forecasting
capabilities anticipate the inter-related effects of distributed generation, energy
storage, electric vehicles, beneficial electrification, and energy efficiency.
Central Hudson’s existing probabilistic forecasting methods incorporate existing DERs, predominantly
solar PV and EE at this time, into the forecasts capturing the inter-related effects. In addition, the use of
this probabilistic forecasting approach on load and DER forecasting produces a wide range of forecast
possibilities that incorporate the impacts of variability, codependence, and accuracy.
h) Describe in detail the forecasts produced for utility use and explain how
those forecasts fulfill the evolving utility requirements for load and supply
forecasts.
The current forecasts for utility use are still primarily granular transmission area, substation, and circuit
level peak load forecasts. The transition to probabilistic hourly load forecasts for load and DER will also
allow Central Hudson’s planning process to transition to utilize this information for more granular
planning of the distribution system, the impacts of DER, and the identification of system issues beyond
peal load serving capability.
i) Describe the utility’s specific objectives, means, and methods for acquiring
and managing the data needed for its advanced forecasting methodologies.
Central Hudson utilizes self-generated datasets or publically available datasets to the extent they are
available and provide the information necessary to produce granular hourly load and DER forecasts.
Central Hudson has at least three years of valid hourly load data from 57 of our 62 distribution load
serving substations encompassing approximately 95% of our cumulative system load. Through the latest

DSIP Update Topical Sections
85
Load and DER forecasting process, there were a number of enabling assumptions made regarding the
ability of DER in the queue to complete development, the location of future DER development, and the
synthesizing of missing data. These assumptions, while enabling the development of the current forecast,
will be the focus of future efforts to refine data through experience or expanded data sets.
j) Describe the means and methods used to produce substation-level load
and supply forecasts.
See this Section above and Appendices A and E for the details on the methods used to produce substation
level load and DER forecasts.
k) Describe the levels of accuracy achieved in the substation-level forecasts
produced to date for load and supply.
See this Section above and Appendices A and E for details on the levels of accuracy of the various
components of the load and DER forecasts.
l) Describe the substation-level load forecasts provided to support analyses
by DER developers and operators and explain why the forecasts are sufficient for
supporting those analyses.
Central Hudson provides load and DER forecasts at the substation level for 5 years on an 8760 hourly load
basis. This will provide DER developers with the locational granularity needed as well as the load shapes
needed to understand the area’s loads, expected DER development, potential for future DER
development, and, when coupled with other available data elements such as hosting capacity or circuit
capacity, an estimate of the available headroom for DER development (both maximum and minimum).
m) Provide sensitivity analyses which explain how the accuracy of substation-
level forecasts is affected by distributed generation, energy storage, electric
vehicles, beneficial electrification, and energy efficiency measures.
Central Hudson utilizes a probabilistic forecasting methodology which relies on a wide range of forecasts
and probabilities to reflect the impact of variability and does not use sensitivity analyses in this method.
Sensitivity analysis is typically applied when scenario-based models are employed, when key inputs are
based on assumptions, or when there is substantial uncertainty around key drivers of results. But Central
Hudson is transitioning to a probabilistic approach where feasible, so Central Hudson will not typically
apply this analysis.

DSIP Update Topical Sections
86
Central Hudson’s objective is to rely on data-driven, probabilistic analysis, which minimizes assumptions
and, by definition, models the range of likely outcomes. When and where possible, Central Hudson has
shifted away from scenario-based models, which are more suitable for sensitivity analysis. The
uncertainty for key inputs, such as load growth, were explicitly quantified based on the available data and
the implications of the uncertainty on outcomes were quantified based on Monte Carlo simulations,
showing the full range of potential outcomes.
Sensitivity analysis still plays an important role for technologies in a nascent stage or experiencing truly
disruptive innovation(s). Because historical data for those technologies is limited, any current projections
rely on assumptions or on data from proxy technologies. For example, for electric vehicles, Central
Hudson employed data on adoption of proxy technology, green vehicles overall, which includes hybrids,
EVs, and plug-in hybrids. To explore the potential of higher penetration rates, the models were pressure
tested by assuming penetration of electric and plug-in electric vehicles would double that of hybrids. A
similar approach will be employed for battery storage once enough data is available.
n) Identify and characterize the tools and methods the utility is using/will use
to acquire and apply useful forecast input data from DER developers and other
third parties.
As previously mentioned, Central Hudson utilizes self-generated datasets or publically available datasets
to the extent they are available and provide the information necessary to produce granular hourly load
and DER forecasts. Central Hudson does use information from DER development activities in the service
territory (such as projects in the queue and project payments) but has not solicited direct input from DER
developers to further inform its forecasting efforts.
o) Describe how the utility will inform its forecasting processes through best
practices and lessons learned from other jurisdictions.
As part of the Rev process, Central Hudson has actively worked with the other JUs in a number of areas to
share lessons learned and identify best practices both in New York and in other jurisdictions. One of the
JU groups focused on forecasting processes both in New York and other jurisdictions. Central Hudson will
continue to be actively engaged in these type initiatives on an ongoing basis. In addition, Central Hudson
remains very actively involved in the NYISO working groups and committee structures. As the NYISO
makes advances in the area of load and DER forecasting, Central Hudson will remain active ensuring we
learn from this work and that it is consistent with the more granular Central Hudson processes.
There are two DER elements that are the most difficult to forecast at this time, and they are Electric
Vehicles and Energy Storage. Central Hudson will continue to look to other utilities and jurisdictions, and

DSIP Update Topical Sections
87
to additional market experience, to refine these forecasts and bolster our datasets, projections, and load
shape information as we refine these forecasts on a going forward basis.
p) Describe new methodologies to improve overall accuracy of forecasts for
demand and energy reductions that derive from EE programs and increased
penetration of DER. In particular, discuss how the increased potential for
inaccurate load and energy forecasts associated with out-of-model EE and DER
adjustments will be minimized of eliminated.
Central Hudson already separately forecasts DER, including EE, EV, and PV, outside of the load model, but
will continue to refine its forecasting methodologies and the accuracy of these forecasts, first through
continued market experience using traditional methods to predict market adoption and saturation, and
second to develop more granular forecasts by technology and market to further define the expected DER
impacts.

DSIP Update Topical Sections
88
C. Grid Operations
1. Context and Background
The growing penetration of DERs has impacted and will continue to impact the Company’s grid
operations. As DER penetration causes multi-directional power flows across the grid, it will become
increasingly important to execute more complex grid functions. To enable these functions, the Company
will require enhanced levels of DER monitoring, control, and measurement – all of which will support
DERs’ ability to provide value to customers and the system.
Central Hudson, through its Smart Grid Strategy, is taking significant steps to accommodate DERs and
model system impacts of DERs in order to preserve distribution system safety and reliability. Critical to
these efforts are a set of foundational investments that will support DSP capabilities Central Hudson’s
Smart Grid Strategy can be summarized along three major functional components:
1. Distribution Automation (DA) – automated devices, distribution infrastructure (poles and wires)
2. Distribution Management System (DMS) – the centralized software “brains”
3. Network Communications Strategy – the two-way communication system between the DA
devices and DMS
Over 900 Intelligent Electronic Devices (IED; e.g. electronic reclosers, switched capacitors, and voltage
regulating devices) and sensors are being installed through Smart Grid and other programs, and this will
provide real time data to the DMS so that it can become a centralized decision maker based on current
system conditions rather than anticipated peak loads. DERs also must be monitored, and in some cases,
controlled, as a critical input to the DMS. Enabling the communication between the DA equipment and
the DMS is the Network Communications Strategy equipment. These three systems, DA, DMS and
Network Communication Strategy are described in detail below.
A key component of Central Hudson’s Smart Grid Strategy is the role of Distribution System Operations,
the organization responsible for the use of the Distribution Management System (DMS). ArcGIS, the
Company’s enterprise-wide Geographic Information System (GIS), provides a single consolidated mapping
and visualization system capable of storing important information on facilities and assets, including DERs,
such as physical location and other operating characteristics. GIS enables new capabilities for Central
Hudson, including developing accurate distribution grid models (potentially down to the customer meter)
and enabling calculation and visualization of DER installations and hosting capacity.
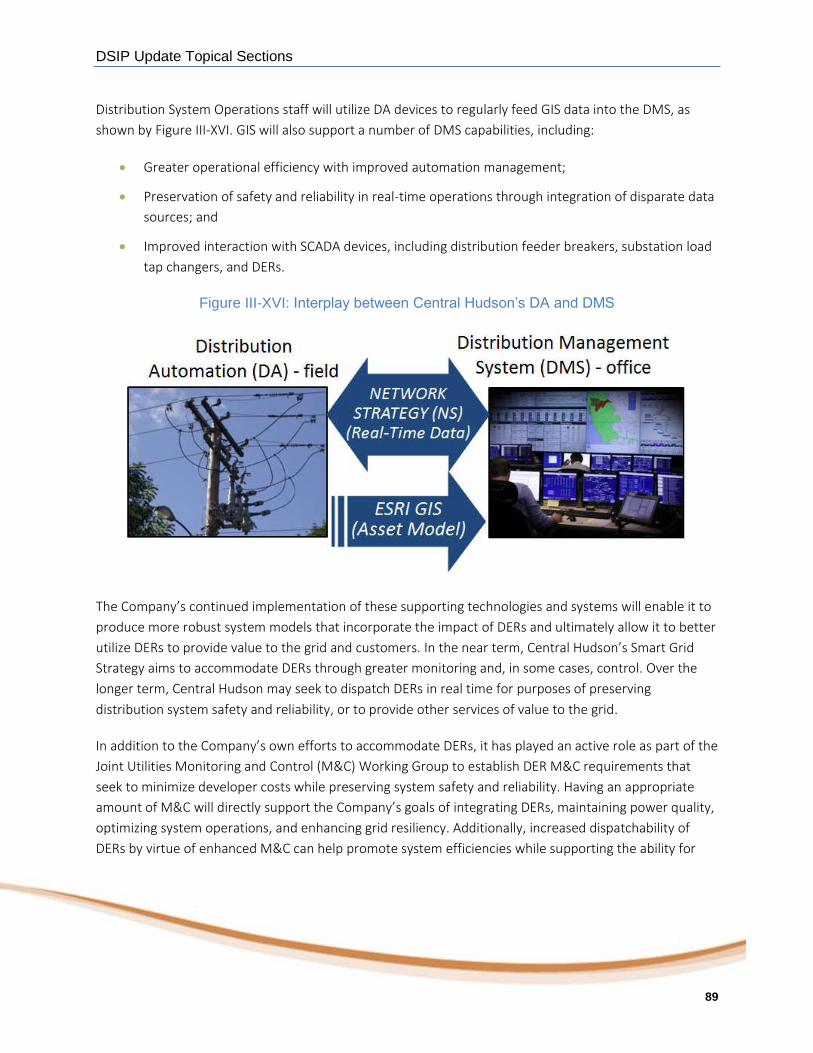
DSIP Update Topical Sections
89
Distribution System Operations staff will utilize DA devices to regularly feed GIS data into the DMS, as
shown by Figure III-XVI. GIS will also support a number of DMS capabilities, including:
Greater operational efficiency with improved automation management;
Preservation of safety and reliability in real-time operations through integration of disparate data
sources; and
Improved interaction with SCADA devices, including distribution feeder breakers, substation load
tap changers, and DERs.
Figure III-XVI: Interplay between Central Hudson’s DA and DMS
The Company’s continued implementation of these supporting technologies and systems will enable it to
produce more robust system models that incorporate the impact of DERs and ultimately allow it to better
utilize DERs to provide value to the grid and customers. In the near term, Central Hudson’s Smart Grid
Strategy aims to accommodate DERs through greater monitoring and, in some cases, control. Over the
longer term, Central Hudson may seek to dispatch DERs in real time for purposes of preserving
distribution system safety and reliability, or to provide other services of value to the grid.
In addition to the Company’s own efforts to accommodate DERs, it has played an active role as part of the
Joint Utilities Monitoring and Control (M&C) Working Group to establish DER M&C requirements that
seek to minimize developer costs while preserving system safety and reliability. Having an appropriate
amount of M&C will directly support the Company’s goals of integrating DERs, maintaining power quality,
optimizing system operations, and enhancing grid resiliency. Additionally, increased dispatchability of
DERs by virtue of enhanced M&C can help promote system efficiencies while supporting the ability for

DSIP Update Topical Sections
90
DERs to provide their full value to the system. Overall, Central Hudson’s ability to have an appropriate
level of M&C will help it determine that a DER interconnection will not jeopardize system safety or
reliability.
The focus on M&C also has touchpoints with other groups Central Hudson participates in: (1) the Joint
Utilities ISO-DSP Coordination Working Group, (2) the DPS- and NYSERDA-led Interconnection Technical
Working Group (ITWG), and (3) the NYISO Market Issues Working Group (MIWG). Central Hudson
continues to engage in these groups to harmonize M&C requirements, to the extent possible, for varying
DER market and operational use cases to promote a consistent approach throughout the State.
Finally, Central Hudson and the Joint Utilities continue to engage with NYISO, both through direct
interaction as well as through the NYISO stakeholder process, on defining operational coordination
requirements for wholesale-participatory DERs, including roles, responsibilities, and procedures.
2. Implementation Plan
a) Current Progress
Today the distribution system is operated in a decentralized basis. Each of the Company’s five operating
districts has operational responsibilities for each of their respective geographic-based operating regions.
The system, which includes some level of intelligent devices including Automatic Load Transfer (ALT)
Switches, switched capacitors, voltage regulators, electronic reclosers, fault indicators, and voltage
sensors, operates predominantly in an autonomous mode where the devices make decisions on their own
or only communicate information in one direction.
As additional DERs have been integrated into the system, there is limited visibility regarding the status of
these resources. With an increasing level of DERs on the system, the continued operation of the
distribution system in this decentralized approach will result in operating issues such as limiting the ability
to integrate increasing levels of DER without significant system upgrades. While this mode of operation
has allowed the system to operate safely and reliably for many years, the requirements being placed on
the system with bi-directional power flows and a desire to better utilize existing infrastructure requires
changes to grid operations.
In order to safely, reliably, and efficiently operate the distribution system in the future with increasing
levels of DERs, the system will no longer be able to operate on a decentralized and autonomous basis and
will need to have the ability to react to and manage the changing conditions that will result from these
DERs. Recognizing this, the Company embarked on the development of a Smart Grid Strategy which
includes investments in three Foundational Technologies: DA, DMS, and Network Communications

DSIP Update Topical Sections
91
Strategy. The deployment of these systems is currently underway and the details of these deployments
are described in detail below.
The DA components of the Smart Grid Strategy include distribution system infrastructure upgrades and
the installation of IEDs and sensors. The distribution system infrastructure upgrades will be completed to
develop ties between adjacent feeders or upgrade existing ties with larger wires. Coupled with IEDs,
additional sensors, and the intelligence of the DMS, this will increase switching capabilities between load
pockets, improving feeder management by flattening voltage profiles for further voltage reduction and
reducing losses. This will also reduce the frequency and duration of interruptions and increase the ability
to defer significant transmission system investments. Central Hudson also will be addressing two radial
transmission feeders that will not meet our design criteria of 7 MVA of unreserved load. Rather than
provide a redundant transmission feed, a DA solution is being completed. While the IEDs provide voltage
and current data, additional sensors with even greater accuracy may be required to verify models at
fringe points, as well as provide metering information at feeder heads and key locations where substation
automation is not yet available.
To achieve the benefits of DA, two key applications will be implemented along with the infrastructure
upgrades and installation of IED: VVO and FLISR. Additional functionality may be enhanced with the
deployment of this technology as well. While the project is focused on DA, substation components also
will be upgraded where necessary to implement this functionality.
(1) Voltage/VAr Optimization
The concept of VVO revolves around the implementation of voltage reduction and optimization of
reactive power flow to improve power quality and efficiency. Applying sophisticated, detailed,
distribution system models, switched and fixed capacitor locations are selected to flatten the voltage
profile across a feeder while ensuring that power factor is maintained in an optimal range and losses are
reduced. Then, voltage regulating devices (load tap changers or voltage regulators) are sited to lower
overall voltage. As the voltage is reduced, the associated energy and carbon emission reductions occur in
a manner that is transparent to the customer.
Locations for installation are selected to leverage existing device locations whenever feasible, but new
installations are frequently required. Once installed, the devices must be programmed with initial
settings, which are coordinated and controlled centrally through a DMS to ensure the settings are
accounting for current system conditions. Voltage regulators, switched capacitors, and substation load
tap changers will need to be retrofitted with two-way communications and control. End of line voltage
sensors must be connected, and communications must be added to verify the DMS model and ensure
voltages are maintained within the ANSI 84.1 acceptable ranges. Operating the distribution system more

DSIP Update Topical Sections
92
efficiently will result in decreased line losses, reduced greenhouse gases, and decreased customer
demand.
While Central Hudson complies with all existing CVR orders, sophisticated modeling with a DMS and two-
way communications and control will enable us to achieve the incremental benefits described in the
business case provided to DPS Staff as a part of the Case 14-E-0318 Rate Case discovery process. This
centralized approach will also provide a platform to integrate DERs. Initially, the impact will be considered
from a technical perspective in terms of impacts on switching and voltage implementation. In the longer
term, should monitoring, control, and markets evolve in that direction, control of third-party devices
could be included with enhancements to the DMS.
(2) Fault Location, Isolation, and Service Restoration
Central Hudson has been utilizing ALT switches for approximately fourteen years. Autonomous teams are
currently limited by the need for the devices to be in close proximity and the complexity of the design due
to the current decentralized approach. With the installation of the DMS, the decisions can centrally
consider a much wider geographic area. When a fault occurs, the IEDs will transmit information to the
DMS to locate the section in which the fault occurred, isolate it by opening adjacent IEDs, and then
closing IEDs to restore service to as many customers as possible. With sufficient distribution feeder ties
and automated switches, an entire substation can even be restored in the event of a fault on a radial
transmission line, avoiding significant transmission system investment to provide a backup feed to these
stations. The DMS will also recommend additional manual restoration that can be performed where
appropriate and provide potential fault locations to reduce patrol time.
Additional electronic reclosers will need to be installed along feeders and at mid-point ties, and
supervisory control of feeder head breakers must be added where not currently available.
(3) Other Functionality
The addition of stronger tie points will enable Distribution System Engineers to employ the same devices
being applied to FLISR during other periods of system stress, such as low voltage conditions or the
exceeding of thermal limitations. Alarm points will be triggered on the DMS and the Distribution System
Engineer will remotely initiate switching to manage these situations.
Regarding DA, following three years of pilot projects, Central Hudson commenced full scale DA roll-out in
July 2015. Table 20 illustrates the accomplishments through June 2018.
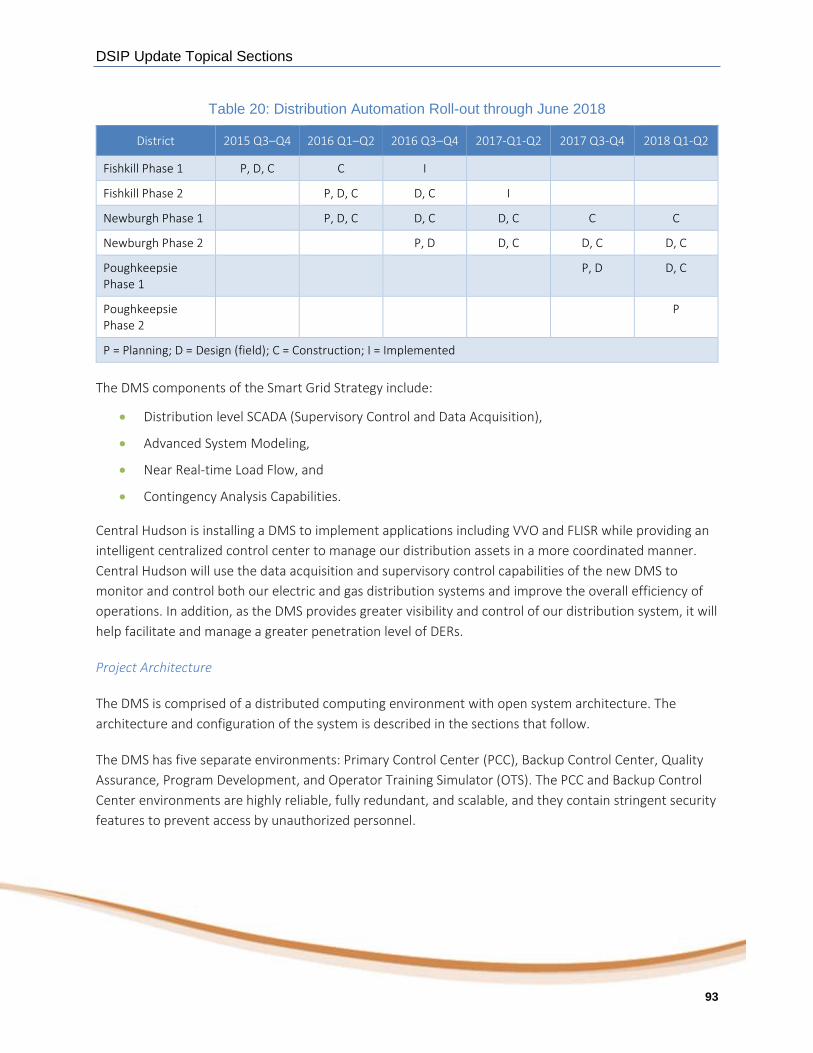
DSIP Update Topical Sections
93
Table 20: Distribution Automation Roll-out through June 2018
District 2015 Q3–Q4 2016 Q1–Q2 2016 Q3–Q4 2017-Q1-Q2 2017 Q3-Q4 2018 Q1-Q2
Fishkill Phase 1 P, D, C C I
Fishkill Phase 2 P, D, C D, C I
Newburgh Phase 1 P, D, C D, C D, C C C
Newburgh Phase 2 P, D D, C D, C D, C
Poughkeepsie Phase 1
P, D D, C
Poughkeepsie Phase 2
P
P = Planning; D = Design (field); C = Construction; I = Implemented
The DMS components of the Smart Grid Strategy include:
Distribution level SCADA (Supervisory Control and Data Acquisition),
Advanced System Modeling,
Near Real-time Load Flow, and
Contingency Analysis Capabilities.
Central Hudson is installing a DMS to implement applications including VVO and FLISR while providing an
intelligent centralized control center to manage our distribution assets in a more coordinated manner.
Central Hudson will use the data acquisition and supervisory control capabilities of the new DMS to
monitor and control both our electric and gas distribution systems and improve the overall efficiency of
operations. In addition, as the DMS provides greater visibility and control of our distribution system, it will
help facilitate and manage a greater penetration level of DERs.
Project Architecture
The DMS is comprised of a distributed computing environment with open system architecture. The
architecture and configuration of the system is described in the sections that follow.
The DMS has five separate environments: Primary Control Center (PCC), Backup Control Center, Quality
Assurance, Program Development, and Operator Training Simulator (OTS). The PCC and Backup Control
Center environments are highly reliable, fully redundant, and scalable, and they contain stringent security
features to prevent access by unauthorized personnel.
DSIP Update Topical Sections
94
The Quality Assurance and Program Development environments are used to perform database and
display maintenance activities and to test new patches/releases received from the Vendor.
Primary Control Center System
The PCC system is the primary real-time environment of the DMS. The platform provides the SCADA
capability, which provides the interfaces and functionality required to monitor and control the
distribution system. This system also hosts the advanced applications that provide the functionality
required to ensure the efficient and reliable operation of the distribution system.
The PCC is a high availability system characterized by high speed data collection and presentation
functions. The PCC is a fault-tolerant system with redundant server architecture. All storage devices are
redundant and hot swappable so that no downtime is incurred for replacing a failed disk.
Backup Control Center System
The Backup Control Center system includes all of the functions and features provided with the PCC
system and are a replica of the PCC system hardware.
Quality Assurance System
The Quality Assurance System (QAS) supports development and testing of all components of the DMS.
This system provides a platform for testing of system upgrades, system patches, network model updates,
etc. The hardware and software in this system are closely modelled to the PCC system.
The QAS is used to test all new components and modifications of existing DMS applications. The QAS has
the capability to receive real-time data (i.e., from the EMS and DA devices) concurrently with the PCC
system. This process does not interfere with or degrade the performance of the DMS. Control commands
issued from the QAS are communicated to field devices only if those devices are directly and solely
attached to the QAS.
Program Development System
The Program Development System (PDS) supports display creation, tune up, and configuration of the
DMS. The PDS has substation one-line diagram generation capabilities and it also includes all of the
administration tools. The PDS is used to help in the validation of the SCADA and DMS databases, system
upgrades, system patches, network model updates, network connectivity, land-based completeness,
substation one-line diagram accuracy, and applications accuracy.
DSIP Update Topical Sections
95
The PDS supports:
Database and display development tools,
Substation one-lines development tools,
Data acquisition to perform testing with field devices using Sensus or DNP3/IP, and
Distribution Network Applications.
The PDS is configured as a non-redundant, stand-alone system. The PDS is of the same server and console
hardware as in the Production environment. The PDS retains its individual identity, although it is
networked with the other components of the DMS.
Operator Training Simulator
An OTS allows for training personnel for operation of the DMS. The OTS provides introductory-level
training as well as advanced instruction. The OTS provides all of the necessary user interfaces and
computing capability to train individual operators and/or an entire control room crew.
The DMS will interface with numerous external systems that have been implemented by Central Hudson.
Geographic Information System
The DMS will interface with Central Hudson’s enterprise GIS to import the as-built geographically
connected representation of the electric distribution network and land-base map data.
The enterprise GIS consists of two Oracle database servers with GIS data logically split up amongst various
schemas. Gas transmission, gas distribution, electric transmission, electric distribution, and land-base
map data all are stored in the two databases in various schemas.
The Electric Distribution GIS contains a connected geometric model of all facilities from the substation
breakers down to the customer transformers and service point. The data is stored in the standard
Telvent/Schneider Electric ArcFM Distribution Data model. The geometry is stored in as geographically
accurate a representation as possible with allowances made for separation between devices so that
independent connectivity can be maintained.
In addition to electric data, the GIS also contains a large amount of base mapping data and
gas transmission/distribution data. It contains a comprehensive land–base map data set with streets,
railroads, hydro features, political districts, operating districts, circuit map grid, etc. Central Hudson
maintains and updates the street data as well to incorporate new developments and road rebuilds. Tax
DSIP Update Topical Sections
96
parcel and building footprint data from the counties are also contained in the GIS land data. Elevation
rasters, aerial orthoimagery, and many more reference data layers are available.
Outage Management System
The DMS will interface with Central Hudson’s existing OMS. The DMS will receive outage information
from the OMS and send device status to the OMS. The existing OMS is based on GE’s PowerOn Version
4.2.3 and resides on the corporate network.
Energy Management System
The DMS will interface with the existing EMS to exchange real-time operational data for substations.
Remote Terminal Units acquire data from substations and provide controls to substation devices. The
majority of Remote Terminal Units are connected to the EMS such that all data and controls for
substations are available via the EMS.
The operational data and available controls include data and controls for equipment that will be under
the jurisdiction of the Transmission System Operators. Therefore, the DMS will not have direct access to
the substations.
In addition to measurements, statuses, and controls, the DMS and the EMS are being developed to
exchange operational information such as quality codes and tags.
The DMS also contains an Infrastructure Environment. The Infrastructure Environment supports Cyber
Security applications including antivirus protections, security event logging, and Disaster Recovery
applications including backup and restore.
Central Hudson has developed internal cyber security policies modeled after North American Electric
Reliability Corporation’s (NERC) Critical Infrastructure Protection (CIP) Version 5 Standards and
Requirements for the DMS and Network Strategy projects. Applicable standards were modified, as
necessary, to more closely align with the Company’s performance and business objectives. The DMS will
be compliant with all relevant cyber security standards and requirements.
Project Schedule
The new DMS is being implemented in a phased approached, following the DA and Network Strategy
projects, as these three projects are tightly intertwined. Table 21 illustrates the accomplishments through
June 2018.
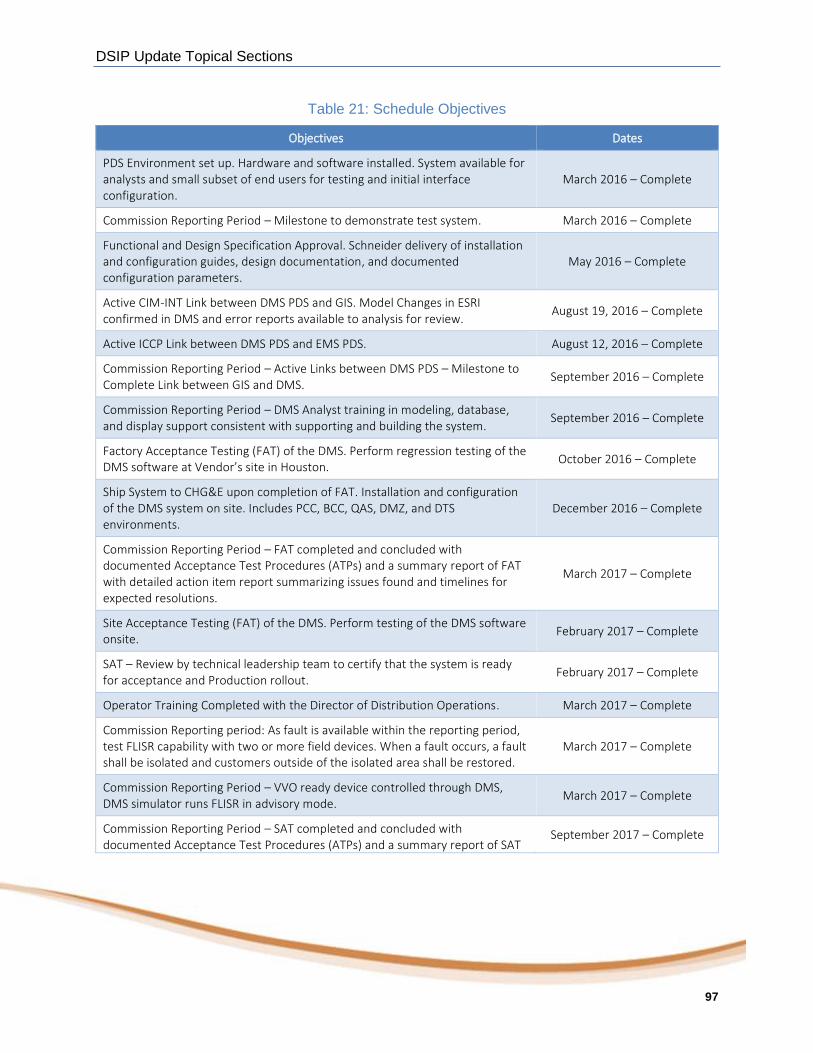
DSIP Update Topical Sections
97
Table 21: Schedule Objectives
Objectives Dates
PDS Environment set up. Hardware and software installed. System available for analysts and small subset of end users for testing and initial interface configuration.
March 2016 – Complete
Commission Reporting Period – Milestone to demonstrate test system. March 2016 – Complete
Functional and Design Specification Approval. Schneider delivery of installation and configuration guides, design documentation, and documented configuration parameters.
May 2016 – Complete
Active CIM-INT Link between DMS PDS and GIS. Model Changes in ESRI confirmed in DMS and error reports available to analysis for review.
August 19, 2016 – Complete
Active ICCP Link between DMS PDS and EMS PDS. August 12, 2016 – Complete
Commission Reporting Period – Active Links between DMS PDS – Milestone to Complete Link between GIS and DMS.
September 2016 – Complete
Commission Reporting Period – DMS Analyst training in modeling, database, and display support consistent with supporting and building the system.
September 2016 – Complete
Factory Acceptance Testing (FAT) of the DMS. Perform regression testing of the DMS software at Vendor’s site in Houston.
October 2016 – Complete
Ship System to CHG&E upon completion of FAT. Installation and configuration of the DMS system on site. Includes PCC, BCC, QAS, DMZ, and DTS environments.
December 2016 – Complete
Commission Reporting Period – FAT completed and concluded with documented Acceptance Test Procedures (ATPs) and a summary report of FAT with detailed action item report summarizing issues found and timelines for expected resolutions.
March 2017 – Complete
Site Acceptance Testing (FAT) of the DMS. Perform testing of the DMS software onsite.
February 2017 – Complete
SAT – Review by technical leadership team to certify that the system is ready for acceptance and Production rollout.
February 2017 – Complete
Operator Training Completed with the Director of Distribution Operations. March 2017 – Complete
Commission Reporting period: As fault is available within the reporting period, test FLISR capability with two or more field devices. When a fault occurs, a fault shall be isolated and customers outside of the isolated area shall be restored.
March 2017 – Complete
Commission Reporting Period – VVO ready device controlled through DMS, DMS simulator runs FLISR in advisory mode.
March 2017 – Complete
Commission Reporting Period – SAT completed and concluded with documented Acceptance Test Procedures (ATPs) and a summary report of SAT
September 2017 – Complete
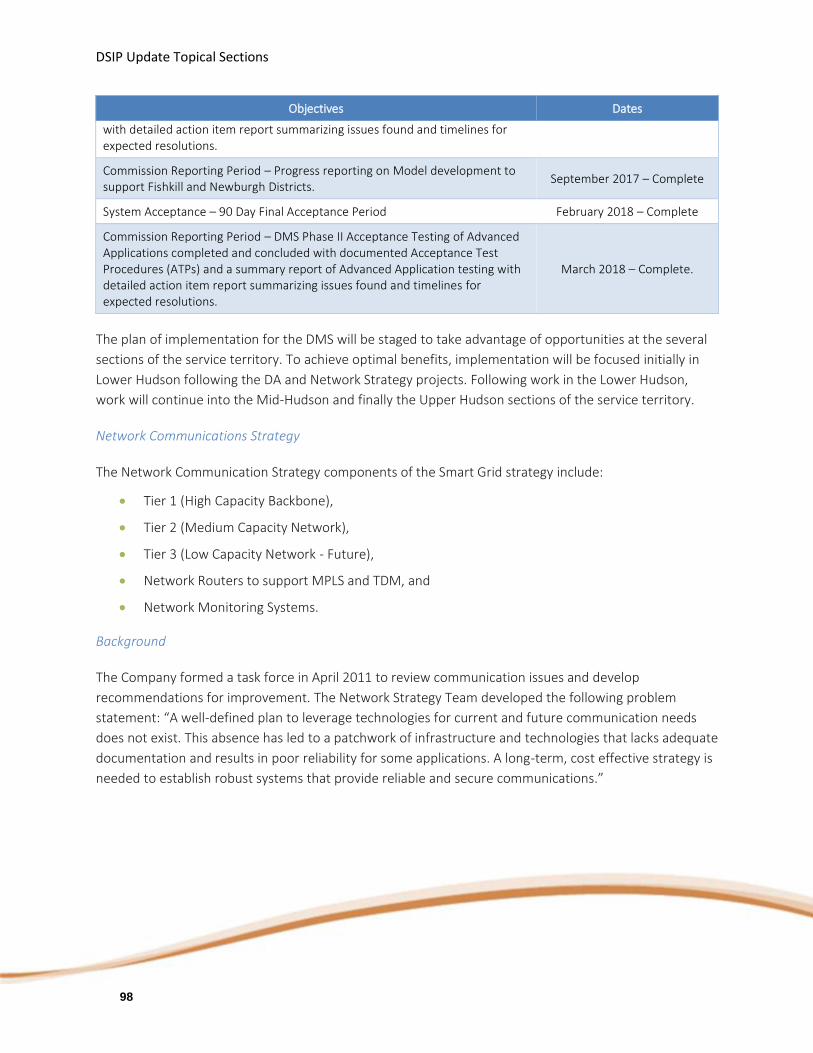
DSIP Update Topical Sections
98
Objectives Dates
with detailed action item report summarizing issues found and timelines for expected resolutions.
Commission Reporting Period – Progress reporting on Model development to support Fishkill and Newburgh Districts.
September 2017 – Complete
System Acceptance – 90 Day Final Acceptance Period February 2018 – Complete
Commission Reporting Period – DMS Phase II Acceptance Testing of Advanced Applications completed and concluded with documented Acceptance Test Procedures (ATPs) and a summary report of Advanced Application testing with detailed action item report summarizing issues found and timelines for expected resolutions.
March 2018 – Complete.
The plan of implementation for the DMS will be staged to take advantage of opportunities at the several
sections of the service territory. To achieve optimal benefits, implementation will be focused initially in
Lower Hudson following the DA and Network Strategy projects. Following work in the Lower Hudson,
work will continue into the Mid-Hudson and finally the Upper Hudson sections of the service territory.
Network Communications Strategy
The Network Communication Strategy components of the Smart Grid strategy include:
Tier 1 (High Capacity Backbone),
Tier 2 (Medium Capacity Network),
Tier 3 (Low Capacity Network - Future),
Network Routers to support MPLS and TDM, and
Network Monitoring Systems.
Background
The Company formed a task force in April 2011 to review communication issues and develop
recommendations for improvement. The Network Strategy Team developed the following problem
statement: “A well-defined plan to leverage technologies for current and future communication needs
does not exist. This absence has led to a patchwork of infrastructure and technologies that lacks adequate
documentation and results in poor reliability for some applications. A long-term, cost effective strategy is
needed to establish robust systems that provide reliable and secure communications.”

DSIP Update Topical Sections
99
Scope
The scope of Network Strategy is communication among Central Hudson’s fixed assets. These fixed assets
include the Company’s corporate offices, gas gate and regulator stations, electric substations, electric
system DA equipment, mobile radio towers, and large customer meter installations. Applications such as
SCADA, transmission line protection, security (video and card access), as well as general network traffic
supporting internet traffic and Voice over Internet Protocol will use the network. Network Strategy will
also enable Central Hudson to broadly implement DA. Additionally, the network acts as the underlying
two-way communications system between the DMS and IEDs in the field. Although the system is designed
with expansion capability to allow for communication with smart meters, Central Hudson has no current
plans to build out that capability.
Topology Overview
Central Hudson’s planned topology is a tiered network. Tier 1 is the high bandwidth backbone connecting
our most critical sites, including our most critical substations. Tier 1 will be a combination of existing and
new fiber optic cables and microwave connections. Most of the sites on the Tier 1 network will also serve
as gateways for connection to the Tier 2 network. Tier 2 is the medium bandwidth network. Tier 2 will be
a mesh radio network for communication with DA equipment, electric substations, gas regulator stations,
and large customer meter installations. The system is designed with the provision for a future Tier 3 low
bandwidth network that could reach to additional end points on the network.
Tier 1
As noted, Tier 1 is the high bandwidth backbone connecting our most critical sites, including our most
critical substations. Tier 1 will be a combination of existing and new fiber optic cables and microwave
connections.
The Physical Layer (Layer 1) for the Tier 1 network is a fiber optic cable and licensed wireless point to
point microwave operating at either 6 GHz or 11 GHz. The current plan for the Tier 1 Network includes
approximately 70 nodes. The nominal capacity of the microwave is 350 MB/s. Several specific paths of
microwave associated with the connection between the PCC and the Alternate Control Center have
nominal capacities of 700 MB/s. The nominal capacity for the fiber optic cable links will be 1,000 MB/s.
The Data Link Layer (Layer 2) for the Tier 1 network is Ethernet. The Network Layer (Layer 3) for the Tier 1
network is Multiprotocol Label Switching (MPLS). Together, these operate at Layer 2.5. Physically, the
Company has chosen to use the Aviat CTR 8611 microwave router to implement Multiprotocol Label
Switching for the fiber optic and microwave Tier 1 Network. With this, we are able to deploy Layer 2

DSIP Update Topical Sections
100
Virtual Private LAN Service for certain critical applications such as SCADA and Layer 3 IP for certain less
critical applications such as Voice over Internet Protocol.
Tier 2
Tier 2 is the medium bandwidth network. Tier 2 will be a mesh radio network for communication with DA
equipment, electric substations, gas regulator stations, and large customer meter installations. Gateways
for connection to the Tier 2 network would be located at the endpoints or nodes of the Tier 1 Network.
The Physical Layer (Layer 1) for the Tier 2 network is an unlicensed wireless point to multi point mesh
radio operating at both 2.4 GHz and 5.8 GHz. The range for the 2.4 GHz radio is 2,400 – 2,473 kHz and the
range for the 5.8 GHz radio is 5,150 – 5,850 kHz. The current plan for the Tier 2 Network includes
approximately 3,000 nodes. The nominal capacity of the Tier 2 radios is 50 MB/s at the gateways,
dropping down to 2 MB/s at the endpoints of the mesh.
Tier 3
As mentioned above, Tier 3 is envisioned to be a low bandwidth network. The Company does not have
any current plans to construct a Tier 3 network. One possible design for the Tier 3 network would be a
mesh radio network similar to the Tier 2 network. Most likely, this network would be operated at either
900 MHz or 2.4 GHz. The Tier 2 locations would be used as gateways for the Tier 3 network. The
remainder of the Tier 3 network mesh radios could be located within electric meters to support an AMI
system.
Network Monitoring System
As part of the Pilot Project, a Network Monitoring System (NMS) was established at the South Road
Headquarters in Poughkeepsie, NY. The hardware for the NMS consists of a high availability server
separated from the corporate network by a firewall. The NMS includes software for the Tier 1 microwave
equipment, the Tier 1 Multiprotocol Label Switching system, and the Tier 2 radio mesh system. The NMS
provides for remote configuration of the Network Strategy Tier 1 and Tier 2 systems. The NMS also
provides for monitoring of the system. Alarms generated remotely by the network equipment are
accumulated at the NMS. The NMS has the capability to generate email notifications of alarms. Central
Hudson’s plan is to establish an alternate NMS at the Alternate Control Center in Newburgh, NY, by the
end of 2019.
Cyber Security
Central Hudson developed internal cyber security policies modeled after NERC CIP Version 5 Standards
and Requirements for the DMS and Network Strategy projects. Applicable standards were modified, as
DSIP Update Topical Sections
101
necessary, to more closely align with the Company’s performance and business objectives. The Network
Strategy Project will be compliant with all relevant cyber security standards and requirements.
Project Schedule
In 2014, Central Hudson initiated a pilot project for Network Strategy. The Tier 1 component of the pilot
project included the construction of microwave links between the South Road Headquarters in
Poughkeepsie, NY, and the Hurley Avenue Substation in Kingston, NY. This connection included three
separate microwave links and two intermediate locations. The microwave connection was placed in
service in January 2015. The Tier 2 component of the pilot project included the installation of 18 mesh
radios in the Town of Ulster, NY. Two different manufacturers were tested, as well as three different radio
frequencies including both licensed and unlicensed frequencies. This work was completed during 2015.
In 2015, Central Hudson began construction of the Tier 1 Network. Six microwave links were installed to
expand the existing microwave portion of the network and connect to several existing fiber optic cable
portions of the network in the Fishkill District. In 2016, Central Hudson added distribution ADSS fiber in
the Newburgh and Poughkeepsie Districts and in 2017 added transmission OPGW fiber in the Newburgh
District.
In 2016, Central Hudson began construction of the Tier 2 Network in the Fishkill District. Construction of
the Tier 2 Network is closely linked with construction of the DA program.

DSIP Update Topical Sections
102
Table 22 illustrates the accomplishments through June 2018. In this table, Phase 1 is defined as the
planning, design, and construction of the DA endpoints. The location of these nodes is defined by the DA
endpoints plus or minus one or two distribution circuit spans (i.e., one pole over if necessary for signal
strength). Phase 2 is defined as the planning, design, and construction of the nodes needed to help the
mesh network form. These nodes are referred to as Helper Nodes. The location of these nodes is much
more involved and includes path studies and field signal strength measurements. Time of year for this
design work is critical as well. A location for a Helper Node may look good in the winter and then not
perform well in the summer when there are leaves on the trees.

DSIP Update Topical Sections
103
Table 22: Tier 2 Network Roll-out through June 2018
District 2015 Q3–Q4 2016 Q1–Q2 2016 Q3–Q4 2017-Q1-Q2 2017 Q3-Q4 2018 Q1-Q2
Kingston Pilot Area P, D P, D C
Fishkill Phase 1 P, D P, D C C
Fishkill Phase 2 P, D P, D, C
Newburgh Phase 1 P, D C
Newburgh Phase 2 P, D
Poughkeepsie Phase 1
P, D
Poughkeepsie Phase 2
P = Planning; D = Design (field); C = Construction Complete
Central Hudson is in the process of developing Distribution System Operations as detailed in the attached
Distribution System Operations Whitepaper (originally developed prior to the 2016 DSIP and updated for
the 2018 DSIP). Above all, the mission of Distribution System Operations is to provide for the safe and
reliable operation of the distribution system. This includes minimizing the impacts of DERs on the safe
and reliable operation of the distribution system. Distribution System Operations is the organization
responsible for the use of the Distribution Management System. The Distribution System Operations
Whitepaper addresses issues including staffing and position descriptions for the operators. Operational
Authority of the distribution system is defined as well as how operations will be conducted in normal and
emergency operating modes.
Central Hudson has made significant progress on (1) enhancing M&C capabilities and promoting DER
accommodation through implementation of its Smart Grid Strategy and (2) identifying lower-cost M&C
solutions through its involvement with the Joint Utilities M&C Working Group and ITWG.
Central Hudson’s Smart Grid Strategy
The Company’s Smart Grid Strategy will enable it to enhance M&C capabilities and accommodate
increasing levels of DERs. While the development of advanced M&C capabilities is in its nascent stages, it
will allow the Company to more effectively utilize DERs based on existing or forecasted system conditions.
In the Initial DSIP, and further outlined above, Central Hudson detailed its plans for various enabling
technologies to support DSP capabilities, including monitoring systems, control systems, and distribution
infrastructure upgrades. As mentioned above, the Company’s planned investments in various DA

DSIP Update Topical Sections
104
technologies, including devices (i.e., reclosers, regulators, and capacitors), circuit mainline
reinforcements, circuit monitoring, and distributed telemetry, will enable the DMS to receive real-time
data. As a result, the DMS will be able to use applications like Volt/VAR control and fault location,
isolation, and service restoration (FLISR) to further accommodate, and eventually actively utilize, DERs.
Central Hudson anticipates eventually automating execution of distribution switching orders for
unplanned work (i.e., fault restoration) with the DMS using the FLISR application. Additionally, it plans on
adding a work request / switching model to the DMS by 2020.
To promote the integrity and safe operation of the DMS, the Company will afford it the same cyber
security protection as it does for the Energy Management System (EMS). Central Hudson will provide
protection for Operational Technology Assets with its Cyber Security for Operational Technology, which is
closely modeled after the North American Electric Reliability Corporation (NERC) Critical Infrastructure
Protection (CIP) standards.
Central Hudson is also investing more broadly in its Distribution System Operations to enhance its ability
to fully leverage these supporting technologies and systems.
Lower-Cost M&C Efforts
Central Hudson has been meeting with the Joint Utilities M&C Working Group since 2017 to understand
and define M&C requirements that support safe and reliable operation of the distribution system.
Through this working group, the Joint Utilities have discussed implementation issues, lower-cost M&C
solutions, and the possibility of integrating new M&C technologies. The M&C Working Group produced
several technical documents for ITWG consideration, including proposed interim requirements for anti-
islanding and M&C informed by benchmarking against other utilities and direct operational experience.
Through discussions with stakeholders, the M&C Working Group recognizes that M&C requirements have
the potential to strain project economics, particularly for smaller projects. In follow-up Working Group
discussions, the Joint Utilities have identified three primary drivers of M&C cost:
Available communication methodologies in a geographic area;
Engineering, design, and drafting; and
Site installation, back office integration, testing, and commissioning.
The Joint Utilities believe the greatest opportunity for reducing M&C cost will come through the
standardization of design and/or functionality for equivalent business and technical use cases. Achieving
this level of standardization will result in fewer engineering, design, drafting, installing, testing, and
commissioning hours while also allowing for economies of scale.
DSIP Update Topical Sections
105
To facilitate M&C cost reductions, the Working Group recently benchmarked potential low-cost M&C
solutions and convened focused, internal discussions with subject matter experts in metering, telemetry,
security requirements, and engineering, installation, and commissioning (EIC). These efforts produced
four main takeaways:
1. M&C may refer to real-time use cases, such as for traditional utility operations and SCADA
devices, and non-real-time use cases, such as for planning purposes. Distinguishing between
these two time dimensions will drive communications backhaul discussions (e.g., periodicity and
data payload size).
2. Each utility has typically relied on utility-owned assets for M&C for SCADA operations (i.e., real
time). However, less critical operations have been able to use third-party systems for M&C as
long as they have appropriate interfaces within the utility back office. While the increased
penetration of these third-party systems will provide enhanced visibility, Central Hudson also
acknowledges there will be complexities for integrating these systems from both a technological
and process perspective.
3. There is still a significant level of uncertainty around lower-cost M&C solutions as to their
security and ability to integrate into real-time operations and planning processes. To maintain
the cyber security of the entire Central Hudson system, it must ensure that all digital systems
have the same security provisions throughout the service territory. Although this is an important
consideration for utilities when adopting new technologies and processes, they often overlook it
when solely focusing on a “low-cost M&C hardware” approach.
4. The utilities have an opportunity to standardize low-cost M&C solutions during future pilots and
R&D energy storage projects. This will allow the utilities to test these solutions in a controlled
environment prior to authorizing them for commercial interconnection applications.
The Joint Utilities have discussed smart inverter capabilities for possible integration into M&C pilots for
low-cost solutions. However, these functions have not been widely implemented or standardized. Prior to
utilizing these devices for the purpose of monitoring and control, we will need to make further progress
on issues around cybersecurity, functionality, and standardization. Upon ratification of the IEEE 1547-1
testing standard, the Joint Utilities will require newly-installed smart inverters to be over-the-air firmware
upgradeable.
At Central Hudson, we believe that lower cost M&C can be achieved through effective leveraging our
foundation technology investments of Distribution Automation, Distribution Management System, and
Network Communications Systems.
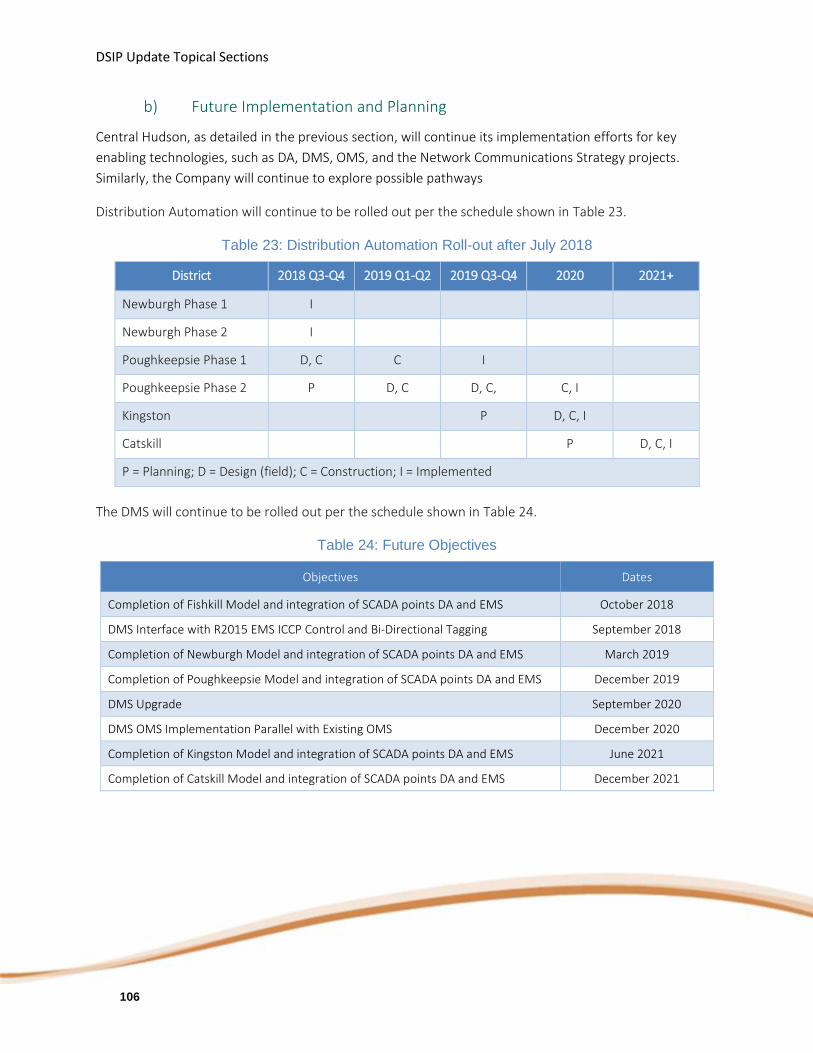
DSIP Update Topical Sections
106
b) Future Implementation and Planning
Central Hudson, as detailed in the previous section, will continue its implementation efforts for key
enabling technologies, such as DA, DMS, OMS, and the Network Communications Strategy projects.
Similarly, the Company will continue to explore possible pathways
Distribution Automation will continue to be rolled out per the schedule shown in Table 23.
Table 23: Distribution Automation Roll-out after July 2018
District 2018 Q3-Q4 2019 Q1-Q2 2019 Q3-Q4 2020 2021+
Newburgh Phase 1 I
Newburgh Phase 2 I
Poughkeepsie Phase 1 D, C C I
Poughkeepsie Phase 2 P D, C D, C, C, I
Kingston P D, C, I
Catskill P D, C, I
P = Planning; D = Design (field); C = Construction; I = Implemented
The DMS will continue to be rolled out per the schedule shown in Table 24.
Table 24: Future Objectives
Objectives Dates
Completion of Fishkill Model and integration of SCADA points DA and EMS October 2018
DMS Interface with R2015 EMS ICCP Control and Bi-Directional Tagging September 2018
Completion of Newburgh Model and integration of SCADA points DA and EMS March 2019
Completion of Poughkeepsie Model and integration of SCADA points DA and EMS December 2019
DMS Upgrade September 2020
DMS OMS Implementation Parallel with Existing OMS December 2020
Completion of Kingston Model and integration of SCADA points DA and EMS June 2021
Completion of Catskill Model and integration of SCADA points DA and EMS December 2021

DSIP Update Topical Sections
107
Network Communication Strategy will continue to be rolled out per the schedule shown in Table 25.
Table 25: Tier 2 Network Roll-out after July 2018
District 2018 Q3–Q4 2019 Q1–Q2 2019 Q3–Q4 2020 2021+
Newburgh Phase 1 C
Newburgh Phase 2 P, D, C C
Poughkeepsie Phase 1 P, D, C C
Poughkeepsie Phase 2 P, D C
Kingston P P, D, C
Catskill P P, D, C
P = Planning; D = Design (field); C = Construction Complete
The transition to Distribution System Operations will include the addition of one Distribution System
Engineer and twelve Distribution System Operators. This will create the need for both additional office
space for the Distribution Control Center and additional workstation space to hold the necessary
computer monitors. This additional space must be included as part of the overall considerations for this
project.
In 2018, Central Hudson is renovating Building 810, Floor S1 at its Poughkeepsie Headquarters, to serve
as its Initial Distribution System Operations Primary Control Center (PCC). The Transmission System
Operations Primary Control Center is currently located in Building 810 on Floor S2. The current available
space in Building 810 on the S1 floor is 2,350 square feet. A study performed in 2017 estimated that
7,245 square feet were needed for Distribution System Operations (not including space for support staff,
data center space, or mechanical space). In addition, the low ceiling height in this room does not allow for
a map board that would be used to improve situational awareness. The Initial Distribution System
Operations PCC, although lacking in space for the long term, will serve to help with developing an
understanding of what works and what doesn’t work. Lessons learned from this Initial PCC will help shape
the design of subsequent facilities that will host Distribution System Operations.
In 2019, Central Hudson will begin construction of a new Training Academy / Primary Control Center
facility (location to be determined). The site will initially be developed as a Training Academy. It is
anticipated that construction of the Training Academy will be completed in 2020. In 2022, Distribution
System Operations would move to the Training Academy and occupy approximately 4,000 square feet of
temporary space. Construction of a permanent Primary Control Center for Transmission and Distribution
System Operations would start in 2020. It is expected that construction will take twelve months followed
by 24 months of commissioning. The PCC will be operational for Transmission System Operations starting

DSIP Update Topical Sections
108
in January 2024 and for Distribution System Operations in July 2024. At that time, the facilities in
Poughkeepsie will become the Transmission and Distribution Alternate Control Centers and the current
Alternate Control Center in Newburgh will be retired. Figure III-XVII summarizes the progression of
investments Central Hudson plans on making to construct a permanent Primary Control Center (PCC) for
Distribution and Transmission System Operations.
Figure III-XVII: Timeline for PCC Construction for T&D System Operations
In addition to its company-specific efforts, Central Hudson will continue to participate in the M&C
Working Group to provide support and input into relevant forums (e.g., ITWG, ISO-DSP Coordination
Working Group, and NYISO’s MIWG). Additionally, the Working Group will continue focusing on
opportunities to implement low-cost M&C solutions for DERs within utility pilots, including harmonizing
requirements across different market and operations use cases. Through the continued efforts of this
Working Group, Central Hudson remains committed to identifying M&C requirements that balance cost
savings for DER developers with allowing Central Hudson to better utilize DERs while preserving system
safety and reliability.
Central Hudson and the Joint Utilities will further address grid operations topics through the development
of a separate Market Design and Integration Report, which “identifies, describes, and explains their jointly
planned market organization and functions along with the policies, processes, and resources needed to
2018• Renovations at Poughkeepsie headquarters to serve as an Initial Distribution System Operations
Primary Control Center
2019• Begin construction of a new Training Academy, which will later serve as a new, but temporary,
Distribution System Operations PCC
2020
• Complete construction of the Training Academy
• Begin construction of a permanent PCC for Transmission and Distribution System Operations
2022• Distribution System Operations moves to the Training Academy
2024
• PCC operational for Transmission System Operations starting in January
• PCC operational for Distribution System Operations starting in July

DSIP Update Topical Sections
109
support them.”28 Further, and in line with the June 2018 DPS and NYSERDA energy storage roadmap,29
the Joint Utilities have been instructed to form a working group with NYISO, DPS, and NYSERDA to
complete a set of tasks on various topics, including grid operations. Central Hudson, as part of the Joint
Utilities, will remain actively engaged to inform the development of the Market Design and Integration
report.
3. Risks and Mitigation
In order to continue building the suite of capabilities needed to support advanced grid operations,
including advanced monitoring and control, Central Hudson will have to continue to make sustained
investments in enabling grid modernization technologies including Distribution Automation, the
Distribution Management System, and the Network Communications Strategy projects. Consequently, the
amount of available funding for these efforts will impact the timing and extent of implementation.
Implementation of these assets is a core competency from an Engineering and Construction perspective
which will greatly minimize this risk.
Staffing is going to be challenging. The Distribution System Operator positions are anticipated to be very
technical and may require a four-year engineering degree. The Distribution System Operators will be
required to work on a rotating shift schedule. Experience with other rotating shift schedule positions has
shown that not all candidates find this desirable which limits the applicant pool. If necessary, Central
Hudson will expand recruitment efforts to increase the candidate pool and consider additional benefits to
make the positions more desirable.
Space limitations will be an issue for the short term. Although we have long term plans to construct a
Distribution System Operations Primary Control Center (PCC), this will not be available until July 2024. In
the short term, we will be using space at our South Road headquarters and then at our Training Academy.
An additional risk, as mentioned above, is the continued cyber security of the entire distribution system.
As the Company continues to integrate both utility-owned and third-party technologies, it will be critical
to adequately address any cyber security concerns to minimize risk. Central Hudson continues to monitor
cyber security developments as provided in the Joint Utilities Cyber and Privacy Framework filed in the
Supplemental DSIP30 and is actively engaged in industry discussions. Central Hudson has also developed a
set of internal standards for the Cyber Security of Operational Technology (CSOT) and are in the process
28 DSIP Proceeding, 2018 DSIP Guidance, p.4.
29 Case 18-E-0130, Proceeding in the Matter of Energy Storage Deployment Program (“Energy Storage Proceeding”), New York State Energy Storage Roadmap and Department of Public Service / New York State Energy Research and Development Authority Staff Recommendations (issued June 21, 2018)(“Energy Storage Roadmap”), p. 72.
30 DSIP Proceeding, Supplemental DSIP, pp. 148-160.

DSIP Update Topical Sections
110
of being implemented enterprise wide. More detail on the CSOT initiative is discussed in Section III.I on
Cyber Security.
4. Stakeholder Interface
The Joint Utilities engaged with stakeholders to define M&C requirements and identify barriers to and
opportunities for lower-cost M&C solutions. The Joint Utilities will continue coordinating with the DER
community to identify mutually-beneficial solutions and maintain transparency into utility M&C
requirements.
The Joint Utilities also hosted a stakeholder engagement session in October 2017 to communicate the
progress made working with NYISO on coordination issues and to gather additional input. Defining new
operational coordination requirements between the DSP, NYISO, DER aggregators, and individual DERs
makes greater DER integration and market participation possible, including expanding the ability of DERs
to access and be compensated for multiple value streams. Each utility will not only need to expand its
historical level of coordination with NYISO, but also build upon, and in some cases establish, new forms of
coordination with DER aggregators and individual DERs. In the Order on Distributed System
Implementation Plan Filings (“DSIP Order”), the Commission highlights that “many complex and nearly
continuous interactions will need to occur among NYISO, the DSPs, and DER operators.”31 The Joint
Utilities agree and have worked with NYISO, DPS Staff, and stakeholders to define required information
exchanges and operational coordination among the various entities.
Central Hudson has been promoting its foundational technology investments including Distribution
Automation, the Distribution Management System, and its Network Communication Strategy programs at
various forums including the 2017 Renewable Energy Conference, the Company’s DSIP stakeholder
conferences, and the Joint Utility Stakeholder Conferences.
Central Hudson also reviewed its foundational technology investments with the PSC and other
stakeholders during its last rate filing in Case 17-E-0459. During this, stakeholders had opportunities to
review, question, and comment on the Company’s plans. Included in those plans are the capital
investments in foundational technologies as well as the planned Training Academy / Primary Control
Center.
31 DSIP Proceeding, Order on Distributed System Implementation Plan Filings (issued March 9, 2017)(“DSIP Order”), p. 7.

DSIP Update Topical Sections
111
5. Additional Detail
a) Describe in detail the roles and responsibilities of the utility and other
parties involved in planning and executing grid operations which accommodate
and productively employ DERs.
The utility’s primary responsibility is to preserve distribution system safety and reliability. The utility has
coordinated with DER aggregators and the NYISO to define operational coordination requirements,
including specific roles and responsibilities for each party, to ensure the utility can continue to preserve
safety and reliability for a system characterized by increasing amounts of DERs. As part of distribution
system programs (e.g., demand response) and procurements (i.e., NWA), the utility requires participants
(i.e., DER aggregators) to sign a contractual agreement that defines the roles and responsibilities for both
the utility and DER aggregator. For example, contracts typically specify the amount of advanced
notification the utility will provide the DER aggregator prior to an event, and separately they define all
reporting and settlement requirements for the DER aggregator.
In the event that a DER begins to participate in a NYISO wholesale market, the Joint Utilities have
developed a Draft DSP Communications and Coordination Manual to define the roles and responsibilities
between the utility, NYISO, DER aggregators, and individual DERs to enable DER wholesale market
participation while preserving system safety and reliability. For example, as part of NYISO’s bidding and
scheduling process, the DSP will analyze the dispatch feasibility of individual DERs and DER aggregations
(as provided by the DER aggregator) to ensure wholesale market participation does not jeopardize system
safety or reliability. The Joint Utilities have also developed a Draft DSP-Aggregator Agreement for NYISO
Pilot Program to further define the roles and responsibilities between the DSP and DER aggregators.
Deployment of technology platforms like Distribution Management System (DMS) and Distributed Energy
Resources Management System (DERMS) will give the DSOs added monitoring and controlling capability
of the local DER assets. Continued roll out of Central Hudson’s foundational technology investments
including Distribution Automation, the Distribution Management System, and its Network
Communication Strategy programs will also create better visibility of local DER assets. The deployment of
these technologies will follow a phased approach. The company understands that it will be a challenge to
obtain monitoring and controlling capability for all DERs in the distribution system, especially the DERs
that are already in service.
The distribution system operators (DSO) can use these technology platforms to coordinate with NYISO
and third-party stakeholders to provide guidance on how to leverage local DERs to benefit the local
distribution system and also provide a pathway for these local assets to participate in the NYISO
wholesale markets.
DSIP Update Topical Sections
112
b) Describe other role and responsibility models considered and explain the
reasons for choosing the planned model.
The types of roles and responsibilities defined within the utility’s programs and procurements are the
requirements the utility, in coordination with third parties, have defined as being necessary for effectively
addressing utility needs while providing DER aggregators and individual DERs actionable information to
help maintain and operate a safe and reliable distribution system. As more DERs are integrated into the
distribution system, the utility will look to refine and update their processes to provide additional
guidance that is clear and adaptable.
With respect to DER wholesale market participation, the Joint Utilities have coordinated with the NYISO
on an ongoing basis to define the roles and responsibilities for relevant parties to facilitate DER wholesale
market participation in a safe and reliable manner. The Joint Utilities held a stakeholder engagement
session in October 2017 to update stakeholders on progress they have made in their coordination with
NYISO and will continue to update stakeholders on future progress. Similarly, input received through the
NYISO stakeholder process has informed the development of these currently defined roles and
responsibilities.
c) Describe how roles and responsibilities have been/will be developed,
documented, and managed for each party involved in the planning and execution
of grid operations.
For distribution-related programs and procurements, the utilities will continue to capture all roles and
responsibilities within contractual agreements with relevant parties. Central Hudson and the Joint Utilities
will continue to coordinate on opportunities to align the procurement process, which may help inform a
more standardized set of roles and responsibilities across the utilities. While the high-level roles and
responsibilities will generally be consistent across the different utilities’ programs and procurements, the
unique nature of each system need may result in differences (e.g., pre-defined time periods in which the
DER portfolio is required to be available for performance).
With respect to operational coordination for DER wholesale market participation, the Joint Utilities have
developed a Draft DSP Communications and Coordination Manual to define the coordination
requirements between the DSP, NYISO, DER aggregator, and the individual DER. As DERs more actively
participate in the wholesale market, there may need to be enhanced coordination across four major
functions: (1) registration, (2) planning, (3) operations, and (4) settlement. The Joint Utilities have also
developed a Draft DSP-Aggregator Agreement for NYISO Pilot Program to (1) close the operating and
communication gap between the utility interconnection agreements or tariffs and NYISO tariffs and (2)
provide DER aggregators with transparency into how they need to coordinate with the DSP to maximize
the ability of DER aggregations to deliver value across different services. While this may be used initially
DSIP Update Topical Sections
113
as part of the NYISO pilot program, the agreement is meant to inform the development of needed DSP-
DER aggregator operational coordination once the NYISO fully implements its DER participation model.
With the deployment of DMS and DERMS platforms, DSOs will have a clear line of sight to local DERs, due
to added monitoring and controlling capabilities. As information is continuously getting transferred
between the DSO, NYISO, and DER aggregators, the utility DSOs will be able to make more informed
decisions. This will lead to more DERs being leveraged for distributed system needs and also will make it
easier for DERs to participate in the NYISO marketplaces, as the DSOs will be able to identify any
constraints in advance, allowing DERs adequate time to adjust their offering in the NYISO marketplace as
needed.
As mentioned earlier, the deployment of these technologies will follow a phased approach. The company
understands that it will be a challenge to obtain monitoring and controlling capability for all DERs in the
distribution system, especially the DERs that are already in service.
d) Describe in detail how the utilities and other parties will provide processes,
resources, and standards to support planning and execution of advanced grid
operations which accommodate and extensively employ DER services. The
information provided should address:
(1) organizations;
(2) operating policies and processes;
(3) information systems for system modeling, data acquisition and management, situational
awareness, resource optimization, dispatch and control, etc.;
(4) data communications infrastructure;
(5) grid sensors and control devices;
(6) grid infrastructure components such as switches, power flow controllers, and solid-state
transformers;
(7) cyber security measures for protecting grid operations from cybersecurity threats; and,
(8) cyber recovery measures for restoring grid cyber operations following cyber disruptions.
Linked to Central Hudson’s foundational technology investments (including Distribution Automation, the
Distribution Management System, and its Network Communication Strategy programs) are the changes
that will be necessary to operate this system on a real time 24/7 basis as well as have greater visibility
DSIP Update Topical Sections
114
into the operation of the DERs. With regard to the changes that will be made to operate the system,
Central Hudson’s plan is to centralize the operation of the distribution system with system engineers
similar to how the transmission system is operated today. These engineers will monitor the operation of
the distribution system and the decisions being made by the DMS and intervene as needed. This
significant change in how the system will be operated will require substantial organizational changes
regarding policies and procedures as well as how the system will be operated during major weather
events. The Electric Distribution System Operations Whitepaper (see as Appendix D) provides the
Company’s current vision of the major policy changes and resource changes that will be needed to
transition to this structure. In addition to safely and reliably operating the system with the increased level
of DERs, the ability to have greater visibility and control the output or voltage of especially the larger
system will be critical.
Cyber security measures for protecting grid operations are addressed in Section III.I.
e) Describe the utility resources and capabilities which enable automated
Volt-VAR Optimization (VVO). The information provided should:
(1) identify where automated VVO is currently deployed in the utility’s system;
(2) in both technical and economic terms, provide the energy loss and demand reductions
achieved with the utility’s existing automated VVO capabilities;
(3) describe in detail the utility’s approach to evaluating the business case for implementing
automated VVO on a distribution circuit;
(4) provide a preliminary benefit/cost analysis (using preliminary cost and benefit estimates)
for adding/enhancing automated VVO capabilities throughout the utility’s distribution system;
(5) provide the utility’s plan and schedule for expanding its automated VVO capabilities;
(6) describe the utility’s planned approach for securely utilizing DERs for VVO functions; and,
(7) in both technical and economic terms, provide the predicted energy loss and demand
reductions resulting from the expanded automated VVO capabilities.
Central Hudson presented a business case for Distribution Automation, inclusive of Volt-VAR
optimization, as a part of its 2014 Electric Rate Case. The business case was made from a customer
perspective, using a weighted average cost of capital, discount rate, O&M, property taxes, depreciation
schedule, inflation rate, and capacity pricing forecasts and procurement requirements available at the
time of study. A 20-year net present value of costs and benefits was calculated and ranged from $7.2
DSIP Update Topical Sections
115
million to $16.7 million, with sensitivity analysis completed on the energy reduction component. These
costs and benefits are described below:
The investment (cost) portion of the business case included: distribution automation hardware,
distribution line reconductoring, substation metering and controller upgrades, a Distribution
Management System, and Network Communication system inclusive of Tier 1 fiber/microwave
and Tier 2 2.4/5.8 GHz radios. These investments were to be made over a 5-year time period at a
20-year net present value cost of $82.9 million.
The benefits portion of the business case includes: energy reduction, loss reduction, capacity
reduction, and avoided transmission system investments. Carbon reduction value was also
considered but not required for a net positive investment for customers. These benefits ramped
up over a 7-year time period to approximately 80% of our customers. Total 20-year net present
value of benefits ranged from $90.1 million to $99.6 million, with the major components being:
o Capital avoidance of building two transmission lines ($42.9 million): The avoided
transmission system investments include leveraging distribution automation to address
two radial transmission feeders that will not meet our design criteria of 7 MVA of
unreserved load, in the event of loss of those transmission lines. By adding distribution
automation hardware and reconductoring lines where needed, a distribution system
solution can be achieved at a fraction of the cost of building a second transmission line in
each case. Although some of these benefits extend beyond VVO, they were important
components of the overall business case to make the necessary investments to
implement VVO.
o Energy, capacity and loss reduction savings ($47.3 million - $56.8 million): This included a
20-year net present value of energy savings of $34.2 million to $41.1 million and 20-year
net present value of capacity savings of $13.1 million to $15.7 million for Central
Hudson’s customers. This economic analysis was based upon an energy savings of 1.39%
to 1.73% gradually deployed over approximately 80% of our customer base. The
percentage savings was based upon analysis of day-on, day-off pilot testing conducted by
the Company for residential and commercial customers over more than one year. An
additional 0.3% reduction in energy is anticipated based on loss reduction. Central
Hudson is a summer peaking utility and anticipates nearly the same reduction in summer
peak demand (98% of energy reduction) as overall energy savings. The Company
maintains compliance with all existing CVR Orders but has not quantified the benefits of
doing so since they are a base component of operating our business.

DSIP Update Topical Sections
116
As shown earlier in this section, the Distribution Automation devices (regulators and switched capacitors)
required for VVO are currently deployed in the Fishkill District and nearly deployed in the Newburgh
District. The schedule for installation of devices throughout the remainder of the service territory is listed
earlier in this section, with an anticipated completion date of 2022. As a part of site acceptance testing of
Central Hudson’s DMS, VVO was tested at our Fishkill Plains Substation. Testing continues to run as
frequently as possible to gather additional data on the benefits of VVO over varying load and field
conditions. Each test runs for a minimum of 2 hours with varying optimization goals, such as power
reduction or power factor improvement. A customized VVO report is run following each test to calculate
the energy reduction and loss reduction benefits.
Full implementation of VVO will follow our DMS rollout schedule and the schedule for the addition of the
Distribution System Operators. Addition of substations to the current testing will also require completion
of the ESRI model as described earlier in this section.
The interactions of VVO with DERs is also considered in the deployment. Particularly when generating
electricity, DERs cause voltage to rise on Central Hudson’s system, offsetting some of the benefits of CVR.
Therefore, the initial activities of using DERs to control voltage will be focused on reducing the cost to
developers to mitigate high voltage, which traditionally requires reconductoring or a dedicated feeder.
The Company will frequently allow a static change in power factor settings of inverters today to maintain
lower voltages, although the addition of a switched capacitor to offset the negative power factor impacts
is sometimes required, offsetting some of the benefits. And although used for other operational purposes
today, the Company has the ability to Monitor and Control DERs per the requirements developed by the
Interconnection Technical Working Group (ITWG).32
To begin testing direct control of third party owned devices such as DER inverters, Central Hudson is
piloting smart inverter control through a solar plus battery storage project that is detailed in Section III.D.
As described earlier in this section, as well as in Section III.I (Cybersecurity), the Company will continue to
monitor and participate in smart inverter advancement activities and evaluate how they can be securely
integrated into the DMS over the longer term as needed.
f) Describe the utility’s approach and ability to implement advanced
capabilities:
(1) Identify the existing level of system monitoring and distribution automation.
The Energy Management System (EMS) provides for monitoring of the transmission system and
monitoring of most of the distribution feeder breakers. The distribution feeder breaker monitoring within
32 Monitoring and Control Requirements for Solar PV Projects in NY, September 1, 2017.

DSIP Update Topical Sections
117
the EMS typically includes breaker position (Open or Closed) and feeder analog values including MW,
MVar, and distribution bus voltage. Throughout the service territory, approximately 573 distribution
automation devices including reclosers, capacitor banks, and voltage regulators are currently deployed
and being monitored by Sensus. The Distribution Management System (DMS) currently monitors five
distribution feeders in the Company’s Fishkill District.
(2) Identify areas to be enhanced through additional monitoring and/or distribution
automation.
The planning of Distribution Automation device locations is completed through a detailed modeling and
analytical process. A sample plan for the Poughkeepsie Operating District is attached as Appendix I. The
Company plans to monitor additional distribution circuits in the DMS. Additional Fishkill District circuits
will be added coincident with the development of the GIS model that supports the GIS. This will be
continued in the remaining four districts as the distribution automation devices and network
communication are installed and the GIS models are developed. The Company’s plan is to eventually
implement monitoring of the entire distribution system in the DMS.
(3) Describe the means and methods used for deploying additional monitoring and/or
distribution automation in the utility’s system.
Additional monitoring of the distribution system within the DMS is dependent on the installation of
distribution automation devices and network communication equipment and the development of the
DMS GIS models. This is currently underway. Costs associated with this deployment can be found in
Central Hudson’s 2019-2023 Capital Forecast.33
(4) Identify the benefits to be obtained from deploying additional monitoring and/or
distribution automation in the utility’s system.
Additional monitoring of the distribution system will allow for expanded use of FLISR and Volt/VAR
control as well as accommodate additional DERs.
(5) Identify the capabilities currently provided by Advanced Distribution Management Systems
(ADMS).
Significant progress has been made in the commissioning of the DMS. Central Hudson has completed the
90 Day Final Acceptance period in February 2018 and completed the DMS Phase II Acceptance Testing of
Advanced Applications in March 2018. This testing concluded with documented Acceptance Test
Procedures (ATPs) and a summary report of Advanced Application testing with detailed action item report
33 Case 14-E-0318 et. al,, Prior Rate Case, Central Hudson Gas & Electric Corporation’s Compliance Filing of its 2019-2023 Corporate Capital Forecast, (filed June 29, 2018).

DSIP Update Topical Sections
118
summarizing issues found and timelines for expected resolutions. These were filed with the Commission
in March 2018.
The DMS currently is being used in a test mode for Volt/VAR control of the five distribution circuits in the
Fishkill District that are currently modeled and monitored. The Company is in the process of completing
the GIS model for the Fishkill, and integrating the SCADA points for the DA equipment installed in Fishkill.
These efforts will continue over the next several years as the remaining operating districts are added to
the DMS.
The current use of the DMS is helping to shape grid operations policies and procedures. This starts with
the 2018 update to the Distribution System Operations Whitepaper which accounted for an improved
understanding of the capabilities of the DMS. The addition of the Director – Distribution System
Operations and the hiring of the Distribution System Engineer will also help to advance the development
of these policies and procedures.
The DMS is currently being used to advance the development of the GIS model. The ADMS is used to
verify GIS model accuracy and connectivity. The ability for power flow calculation to converge in the DMS
is used to verify the GIS model. The addition of the DMS Model Manager position in 2018 will also help to
advance this development.
The DMS is currently also being used as a training tool. With the addition of the Distribution System
Engineer and the DMS Model Manager, the DMS is a critical component of their development plan. The
Distribution System Engineer will be responsible for the training of the Distribution System Operators
starting in 2019, and will have primary responsibility for the use of the DTS in the DMS.
(6) Describe how ADMS capabilities will increase and improve over time;
Over time, additional circuits will be modeled and monitored which will allow for the eventual use of
FLISR, closed loop VVO, and monitoring and control of DERs. The timing of this will be tied to the addition
of Distribution System Operators and the installation of DA equipment and associated network
communication equipment. All of these capabilities will be phased in over the next four years as
described above.
(7) Identify other approaches or functionalities used to better manage grid performance and
describe how they are/will be integrated into daily operations.
Based on future DER technologies that allow for greater functionality, the business cases to install these
DERs may lead to Central Hudson’s desire to operate them in a more refined manner through the DMS or
a future DERMS or as part of our energy resource procurement. As these functionalities are developed,
we can test the capabilities through pilot projects.

DSIP Update Topical Sections
119
D. Energy Storage Integration
1. Context and Background
Energy Storage Systems, especially Battery Energy Storage Systems (BESS), are recognized as an
important element of the grid of the future. BESSs represent flexible energy resources that have the
ability to operate as both a source of energy and capacity and a load (a sink for energy and capacity). This
operating flexibility has the potential to create a number of value streams for the BESS as both a
standalone system and when paired with other energy resources (i.e., battery + PV applications).
Central Hudson has been evaluating energy storage deployment and use cases over the last several years.
As with all of our investments, a key driving element is the overall cost effectiveness of any solution. Our
evaluations have explored the costs and benefits of energy storage systems as compared to traditional
T&D solutions. These analyses have included the potential additional wholesale market revenues storage
systems can generate. Based on current cost and market data, our analysis has indicated that to date,
energy storage systems have not represented lower cost solutions to meet operational or capacity needs
on our system. BESSs are projected to continue to drop in cost based on advances in battery
manufacturing, technological advances, lessons learned, and overall industry experience. Central Hudson
will continue to track the system costs and overall cost effectiveness of these solutions. As costs come
down, it is envisioned that BESSs will have a growing role as a flexible resource on both transmission and
distribution systems in the future. In addition, Central Hudson is reviewing the New York Energy Storage
Roadmap and Department of Public Service / New York State Energy Research and Development
Authority Staff Recommendations issued June 21, 2018. Central Hudson will be actively engaged in
participating in the future development and implementation of the outcomes of this document and
utilize the recommendations and findings as guidance for the development of our energy storage
integration plans.
2. Implementation Plan
a) Current Progress
Central Hudson has several ongoing initiatives geared towards understanding the costs, the economic
valuation, and the technical applications of BESSs. Each of these initiatives is briefly described below.
SUNY New Paltz PV + Battery Storage Research Project – This project represents a research
initiative jointly executed among several industry partners: Central Hudson Gas & Electric, New
York Power Authority, New York State Energy Research and Development Authority, Electric
Power Research Institute, and SolarLiberty. The project incorporates 100kW of Photovoltaics and
100kW/200kWh of lithium-ion batteries at the SUNY New Paltz campus. The installation is

DSIP Update Topical Sections
120
designed for technical learnings including smart inverter grid support functions (power factor,
volt-var, PV smoothing), peak demand reduction capabilities, and operation in microgrid mode.
The installation is located on a Central Hudson 13.2kV distribution circuit supplied by our
Ohioville Substation. The project is in service, interconnecting to the Central Hudson system in
April 2018. Testing of the system is planned for approximately one year (July 2018 – June 2019),
with a fourth quarter 2019 completion date.
Quanta BESS Study – PV Integration and Reliability Uses Cases – Central Hudson contracted with
Quanta Technology LLC to perform a study to determine both the technical feasibility and overall
cost effectiveness of utilizing BESSs versus traditional T&D solutions for two specific use cases: (1)
BESS-assisted PV interconnection and (2) BESS support for distribution reliability. Reference
Appendix F for a copy of the final report. Central Hudson identified potential opportunities in
several locations on our system for analysis with the overall goal of identifying a cost beneficial
application for the implementation of an energy storage project.
The first phase of the project was to complete a technical analysis to determine the technical
feasibility, sizing, and optimal locations for the BESS to adequately address the project needs. The
second phase entailed detailing the costs and benefits, including evaluating and incorporating
wholesale market benefits where applicable. The final phase included performing a comparison
of the BESS solution versus more traditional solutions and evaluating the storage options for
overall cost benefit.
For the BESS-assisted PV interconnection use case, both a transmission location with significant
proposed transmission and distribution sited PV and two distribution locations with significant
distribution sited PV were analyzed. In each case, the optimal size and location of the energy
storage was determined to facilitate the PV integration and then optimized and evaluated for
wholesale market revenues.
For the transmission area use case, a 69kV loop with approximately 120MW of proposed PV was
analyzed. Power flow models were developed for the BESS simulations based on our transmission
model and Quanta algorithms were used to simulate BESS operation and determine BESS sizing.
The battery was sized for N-0 and N-1 overload relief and curtailment avoidance. Both
distribution sited and transmission sited storage were analyzed. A transmission sited storage
solution was determined to be optimal for this area. The BESS was treated as an Energy Limited
Resource participating in NYISO Day-Ahead Energy, Real-Time Energy, and Regulation markets. In
general, charging was performed against Day-Ahead market prices and discharging was
performed against Real-Time prices. Regulation is against day-ahead prices. The BESS simulation
co-optimizes BESS market participation in these products on an hourly basis, optimized across
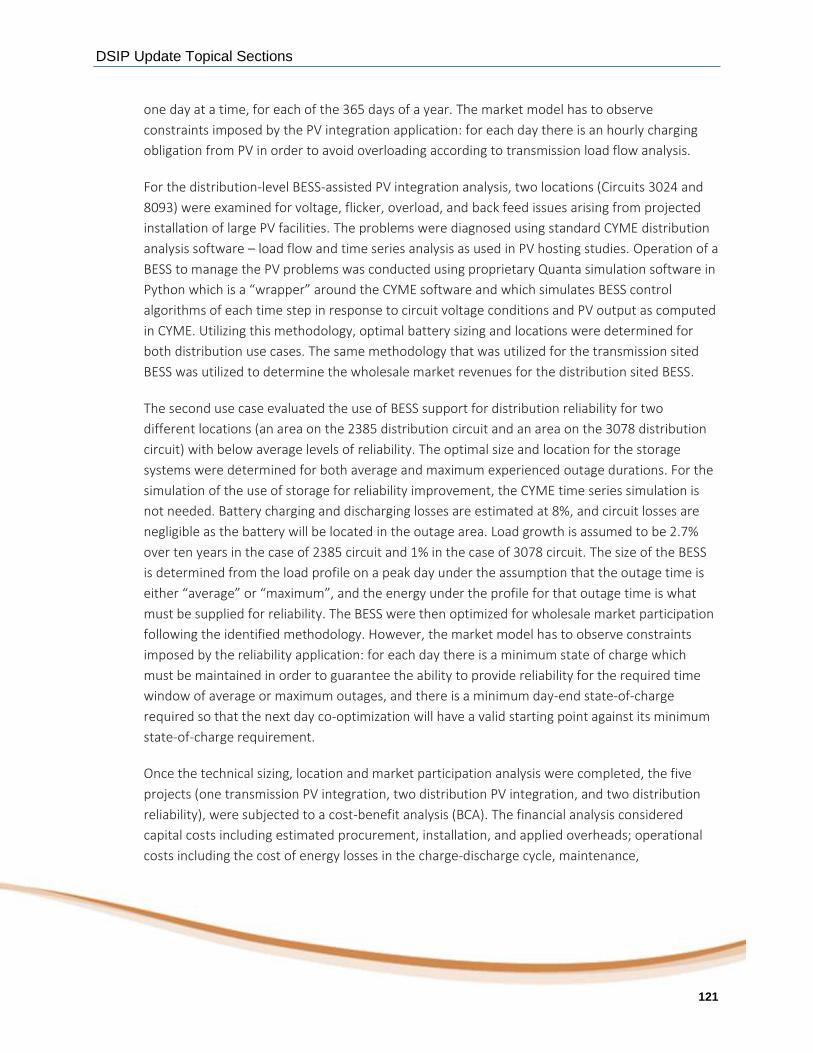
DSIP Update Topical Sections
121
one day at a time, for each of the 365 days of a year. The market model has to observe
constraints imposed by the PV integration application: for each day there is an hourly charging
obligation from PV in order to avoid overloading according to transmission load flow analysis.
For the distribution-level BESS-assisted PV integration analysis, two locations (Circuits 3024 and
8093) were examined for voltage, flicker, overload, and back feed issues arising from projected
installation of large PV facilities. The problems were diagnosed using standard CYME distribution
analysis software – load flow and time series analysis as used in PV hosting studies. Operation of a
BESS to manage the PV problems was conducted using proprietary Quanta simulation software in
Python which is a “wrapper” around the CYME software and which simulates BESS control
algorithms of each time step in response to circuit voltage conditions and PV output as computed
in CYME. Utilizing this methodology, optimal battery sizing and locations were determined for
both distribution use cases. The same methodology that was utilized for the transmission sited
BESS was utilized to determine the wholesale market revenues for the distribution sited BESS.
The second use case evaluated the use of BESS support for distribution reliability for two
different locations (an area on the 2385 distribution circuit and an area on the 3078 distribution
circuit) with below average levels of reliability. The optimal size and location for the storage
systems were determined for both average and maximum experienced outage durations. For the
simulation of the use of storage for reliability improvement, the CYME time series simulation is
not needed. Battery charging and discharging losses are estimated at 8%, and circuit losses are
negligible as the battery will be located in the outage area. Load growth is assumed to be 2.7%
over ten years in the case of 2385 circuit and 1% in the case of 3078 circuit. The size of the BESS
is determined from the load profile on a peak day under the assumption that the outage time is
either “average” or “maximum”, and the energy under the profile for that outage time is what
must be supplied for reliability. The BESS were then optimized for wholesale market participation
following the identified methodology. However, the market model has to observe constraints
imposed by the reliability application: for each day there is a minimum state of charge which
must be maintained in order to guarantee the ability to provide reliability for the required time
window of average or maximum outages, and there is a minimum day-end state-of-charge
required so that the next day co-optimization will have a valid starting point against its minimum
state-of-charge requirement.
Once the technical sizing, location and market participation analysis were completed, the five
projects (one transmission PV integration, two distribution PV integration, and two distribution
reliability), were subjected to a cost-benefit analysis (BCA). The financial analysis considered
capital costs including estimated procurement, installation, and applied overheads; operational
costs including the cost of energy losses in the charge-discharge cycle, maintenance,

DSIP Update Topical Sections
122
depreciation, and property taxes; the estimated market benefits; and return on capital. Central
Hudson provided the costs of conventional solutions and Quanta provided estimates of battery
costs. The results of the Net Present Value (NPV) calculation of the differences between the BESS
and the conventional solutions over a 20 year Horizon were compared.
For the BESS-assisted PV integration in transmission location, the BESS was more economical
than the traditional T&D solution; however, the ability to curtail the PV output over select time
periods represented a significantly more economical option and was the recommended solution.
The cost of the traditional solution was approximately $45M, the BESS cost was approximately
$30M and would potentially generate $727k in annual market revenues. The BESS-assisted PV
integration was favorable compared to the cost of the traditional T&D upgrade on both an
aggregate cash flow and Net Present Value basis for both primary applications alone and with
market benefits included. However, the PV curtailment option of approximately 150MWh
curtailment on an annual basis (less than 1% annual loss of energy output) represented
approximately $8,700 annual lost revenue. The curtailment is the less cost option overall by a
significant margin.
For the BESS-assisted PV integration in distribution locations, the traditional T&D solutions were
determined to be more economical than the BESS option. The traditional T&D solutions ranged
from $3.9M to $4.7M while the BESS costs ranged from $16M to $20M. The BESSs would
potentially generate $47k (circuit 8093 use case) to $240K (circuit 3024 use case) in annual
market revenues. Based on these costs/revenues, the distribution system BESS-assisted PV
integration cases were not favorable for either location under any scenarios (primary applications
alone and with market benefits included).
For the BESS support for reliability use cases, depending on the specific application analyzed (i.e.,
location, average/maximum outage durations), the BESS solution potentially represented a more
cost effective solution than the traditional T&D solution. The traditional T&D solutions ranged
from $1.5M to $2.3M. The BESSs ranged from $1.4M to $2.4M system costs with $40k in annual
market revenues (Cragsmoor area) to $4.1M to $5.4M system costs with $118k in annual market
revenues (Tannersville area). However, when compared utilizing Central Hudson’s current
approach to evaluate and rank reliability based projects, neither the traditional T&D solutions nor
the BESS solutions meet the criteria for implementation.
As shown in the results of this pilot project, it is currently challenging to identify a use case that
passes a benefit-cost analysis on Central Hudson’s system. Neither of the two use cases and none
of the five projects evaluated in the study pass a BCA and meet an acceptable threshold for
inclusion in Central Hudson’s capital program.

DSIP Update Topical Sections
123
Four Corners Microgrid Project – The Four Corners Microgrid project is part of a FEMA Grant
program following Superstorm Sandy. This project was submitted to the Department of
Homeland Security (DHS) by the New York State Department of Public Service on behalf of
Central Hudson. The project includes the installation of a microgrid to enhance reliability in the
Four Corners Area of the Central Hudson service territory. The project is currently in the design
phase (Phase 1) with deliverables due to the DHS by August 14, 2018. The current design includes
a 2MW lean burn natural gas turbine and a 2MW/1MWh BESS to facilitate block loading. The
battery is sized to pick up the area load during the initial loss of utility service while the lean burn
gas generator ramps up to speed and assumes the load. The project will include optionality to use
the BESS for other services (i.e., demand reduction, frequency regulation) during parallel
operation. Figure III-XVIII shows a one-line diagram of the effected system; Figure III-XIX shows a
simplified diagram of the microgrid layout.
Figure III-XVIII: One-Line Diagram
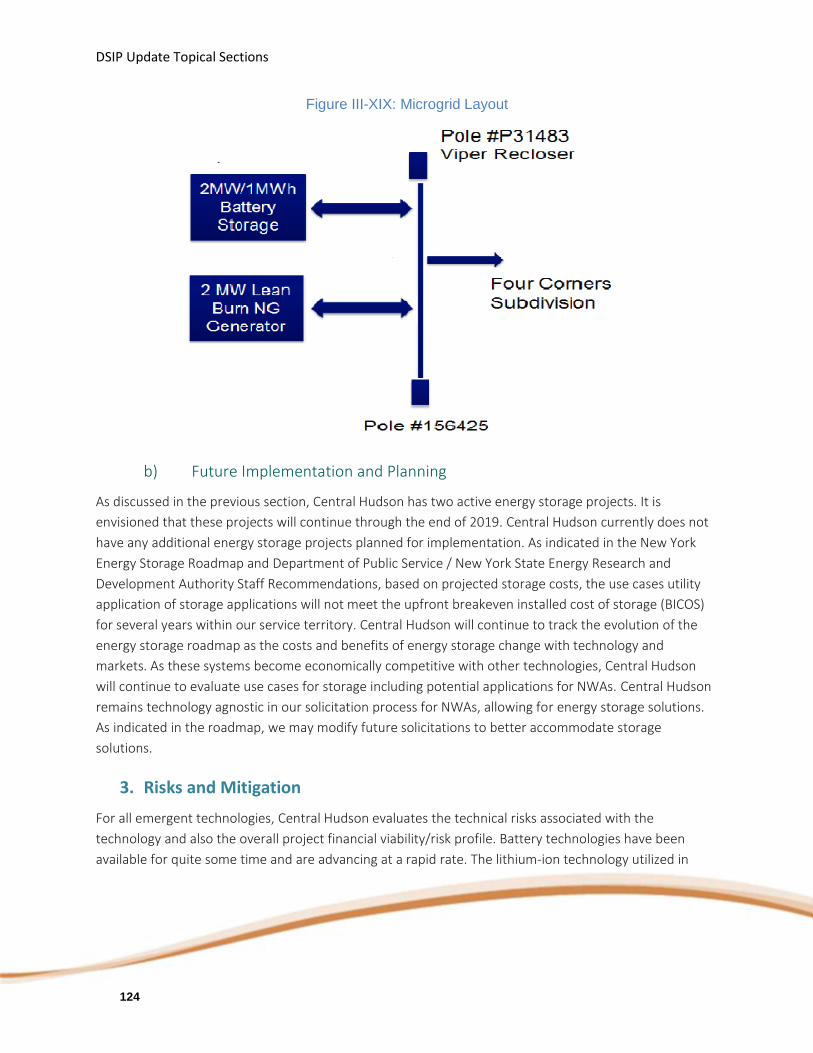
DSIP Update Topical Sections
124
Figure III-XIX: Microgrid Layout
b) Future Implementation and Planning
As discussed in the previous section, Central Hudson has two active energy storage projects. It is
envisioned that these projects will continue through the end of 2019. Central Hudson currently does not
have any additional energy storage projects planned for implementation. As indicated in the New York
Energy Storage Roadmap and Department of Public Service / New York State Energy Research and
Development Authority Staff Recommendations, based on projected storage costs, the use cases utility
application of storage applications will not meet the upfront breakeven installed cost of storage (BICOS)
for several years within our service territory. Central Hudson will continue to track the evolution of the
energy storage roadmap as the costs and benefits of energy storage change with technology and
markets. As these systems become economically competitive with other technologies, Central Hudson
will continue to evaluate use cases for storage including potential applications for NWAs. Central Hudson
remains technology agnostic in our solicitation process for NWAs, allowing for energy storage solutions.
As indicated in the roadmap, we may modify future solicitations to better accommodate storage
solutions.
3. Risks and Mitigation
For all emergent technologies, Central Hudson evaluates the technical risks associated with the
technology and also the overall project financial viability/risk profile. Battery technologies have been
available for quite some time and are advancing at a rapid rate. The lithium-ion technology utilized in

DSIP Update Topical Sections
125
battery energy storage systems is well developed. Central Hudson feels that the risk profile for the
technologies is relatively limited and therefore manageable. These technical risks can be managed as part
of the deployment of the systems (redundancy, fail safe designs, etc.) and with the warranty conditions
specified. The applications of BESS to both the transmission and distribution systems represent a greater
risk profile as utilities and the industry continue to gain technical learnings on the system interactions and
use cases available to BESSs and their ability to meet the identified needs. The different use case
assumptions, including the risk that the forecasted continued steep and step cost reductions in both
battery and balance of systems do not occur or occur at a much slower than anticipated rate, represent
higher levels of risk. In addition, there are risks associated with the market revenue forecasts for these
installations. The shared learnings among the Joint Utilities as storage demonstration projects are
implemented should provide data and operational experience to help understand and quantify the risks
associated with storage projects. As experienced is gained and the applications/markets mature, these
risks will be better understood and appropriate mitigation strategies can be developed.
4. Stakeholder Interface
Central Hudson has actively engaged with stakeholders in several different forums in relation to energy
storage applications. These areas include:
Central Hudson is a current member of the New York Battery and Energy Storage Technical
Consortium (NY-BEST), monitoring and participating in activities. During 2018, Central Hudson
hosted a meeting with NY-BEST to explore energy storage opportunities. This meeting included
use case presentations and interactions with a number of storage developers including Enel X,
Stem, Tesla, and SunRun. Central Hudson shared the Quanta BESS Study – PV Integration and
Reliability Uses Cases report with NY-BEST.
Central Hudson has been very active in both the Interconnection Technical Working Group
(ITWG) and the Interconnection Policy Working Group (IPWG). These New York State working
groups include Joint Utilities, developers, and policy makers. These groups continue to engage on
a regular basis to jointly advance both technical (ITWG) and policy (IPWG) issues related to
interconnections. During 2017 and the first half of 2018, representatives from Central Hudson
chaired both of these committees further establishing our relationships with DER developers.
Central Hudson was instrumental in making changes to the SIR to accommodate storage systems
including both standalone and hybrid systems.
Central Hudson remains very active in NYISO committee workings and has played a significant
role in Joint Utility – NYISO work to facilitate dual participation in wholesale and retail markets by
DER providers which, as identified in the Storage Roadmap, will be critical to making the use
cases for storage economical.

DSIP Update Topical Sections
126
Central Hudson has worked collaboratively with the New York State Joint Utilities on a number of
stakeholder engagement initiatives associated with REV. Section IV (Other DSIP-Related
Information) outlines the Joint Utilities collaborative efforts on stakeholder engagement in both
2017 and 2018.
5. Additional Detail
a) Provide the locations, types, capacities (power and energy), configurations
(i.e., standalone or co-located with load and/or generation), and functions of
existing energy storage resources in the distribution system.
As mentioned previously, working with industry partners, Central Hudson is part of an ongoing energy
storage installation project located on the SUNY New Paltz main campus. The campus is located in New
Paltz, New York within Ulster County. The storage system is interconnected to the Central Hudson 5025
distribution circuit emanating from our Ohioville Substation. This is a PV + Battery storage project which
includes the following components:
Solar PV
o 100kW Princeton Power Smart Inverter
o 100.65kW CSUN Solar Modules
Battery Storage
o 100kW Princeton Power Smart Inverter
o 200kWh Samsung SDI Li-Ion Battery Bank
As indicated, the storage is co-located with a PV system and the project is designed to test the following
functionality:
Smart inverter grid support functions (power factor, volt-var, PV smoothing)
Reduction of electric demand
Micro-grid mode (Elting Gym is a Red Cross Shelter)
In addition to partnering for this installation, Central Hudson has a number of customer-sited battery
storage systems interconnected to our distribution system. These are smaller, behind the meter
installations co-located with residential PV systems and customer load. Central Hudson currently has 47
of these installations spread throughout our service territory. In addition, there are another 20 of these
systems in the queue. While customer-sited, it is believed these units are installed to provide customer
resiliency and potentially demand reduction.

DSIP Update Topical Sections
127
b) Describe the utility’s current efforts to plan, implement, and operate
beneficial energy storage applications. Information provided should include:
(1) a detailed description of each project, existing and planned, with an explanation of how
the project fits into the utility’s long range energy storage plans;
(2) the original project schedule;
(3) the current project status;
(4) lessons learned to-date;
(5) project adjustments and improvement opportunities identified to-date; and,
(6) next steps with clear timelines and deliverables.
Over the past year, Central Hudson has actively worked to identify cost beneficial utility energy storage
applications for implementation. These systems would help further develop our working knowledge of
the potential benefits both in terms of value added services and technical advances. Central Hudson has
completed a BESS use case study and currently has two projects identified which will incorporate energy
storage applications. One of these projects is currently in service (SUNY New Paltz PV + Battery Storage
Research Project) and the other is in the design phase (Four Corners Microgrid Project).
SUNY New Paltz PV + Battery Storage Research Project
(1) A detailed description of this project is included in Section III.D.2.a). This project fits into Central
Hudson’s long range energy storage plans by providing technical learnings in the following areas:
smart inverter grid support functions (power factor, volt-var, PV smoothing), peak demand
reduction capabilities, and operation in microgrid mode. Central Hudson believes that the
inverter grid support functions will play an important role in integrating PV systems on our
system and as potential cost effective methodologies to increase hosting capacity. The project
will also focus on the utilization of energy storage for peak demand reduction and microgrid
operations. We feel that energy storage can potentially play a role in peak demand reduction
portfolios and may be able to operate either independently or paired with our resources to help
address localized reliability needs.
(2) The project was originally planned to be in service in August of 2017. The project schedule is
outlined below:
5/18/2015: EPRI awarded NYSERDA PON

DSIP Update Topical Sections
128
8/11/2016: Central Hudson received interconnection application
11/23/2016: Central Hudson approved the project for construction
6/2017: Factory testing of the battery identified issues resulting in redesign
2/2018: Battery and inverter delivered to the site and installed
4/5/2018: Central Hudson witnessed acceptance test and provided approval
(3) The project is interconnected and in-service and is entering the testing phase.
(4) The project is in the early stages in terms of operations and does not have documented lessons
learned to date.
(5) The project is in the early stages in terms of operations and does not have project adjustments or
improvement opportunities identified to date.
(6) As indicated, this project is entering the testing and data collection phase. It is planned to test
functionality, applications, and use cases over the next twelve months. The project outcomes and
learnings will be documented with a final report expected by year end 2019.
Quanta BESS Study – PV Integration and Reliability Uses Cases
(1) A detailed description of this project is included in Section III.D.2.a). This project fits into Central
Hudson’s long range energy storage plans by providing technical learnings in the application of
storage systems for both PV integration and distribution reliability uses cases. More importantly,
the project developed methodologies to be used in determining the economic viability of storage
projects in comparison to alternative T&D solutions. The project demonstrated the use of these
methodologies in a number of applications on both our transmission and distribution system to
help determine the costs, benefits, and overall economic viability of storage projects.
(2) The original project schedule was to complete the analysis by year end 2017.
(3) The project/analysis is complete. The final report was issued on 4/20/2018.
(4) The final report is included in Appendix F and outlines conclusions and lessons learned.
(5) The project is complete. There were minor adjustments to the schedule based on market
learnings and re-work as part of the analysis.
(6) The project is closed (final report dated 4/20/2018). The project outcomes identified that while
BESS may have niche applications and will have a role on utility systems in the future, it is

DSIP Update Topical Sections
129
currently challenging to identify a use case that passes a benefit-cost analysis on Central
Hudson’s system. Neither of the two use cases and none of the five projects evaluated in the
study pass a BCA and meet an acceptable threshold for inclusion in Central Hudson’s capital
program. As battery system costs continue to decline in the future and other project benefits are
identified (such as demonstration value), the analysis should be reconsidered. As part of this
project, we were able to develop tools and methodologies to compare storage solutions versus
traditional T&D solutions and evaluate as compared to curtailment options. The methodologies
and learnings from the project will be applied to future use cases with adjustments for costs and
market revenues applied as applicable.
Four Corners Microgrid
(1) A detailed description of this project is included in Section III.D.2.a). This project fits into Central
Hudson’s long range energy storage plans by evaluating investment opportunities including
reliability-based projects on an overall cost benefit basis. The project incorporates a BESS as part
of the overall solution.
(2) The original project schedule was to have Phase 1 design complete by August 14, 2018. Phase 2
(construction) will follow if the project is approved.
(3) The project is currently on schedule to meet the August 14 Phase 1 Design deliverable date.
(4) The project is in the design stage and does not have documented lessons learned to date.
(5) The project is in the design stage and does not have project adjustments or improvement
opportunities identified to date.
(6) The project is currently in the final stages of design review, and cost estimates and schedules are
being developed for Phase 2 (construction). The final designs are scheduled to be submitted to
the Department of Homeland Security by August 14, 2018, for review. The review and
determination of the project’s viability to proceed to Phase 2 is expected to take from three to six
months. If the project is approved for Phase 2, the permitting and pre-construction work will start
immediately upon approval notification.
c) Provide a five-year forecast of energy storage locations, types, capacities,
configurations, and functions.
Due to the nascent nature of energy storage and the current cost structure, Central Hudson does not
have detailed forecasts of energy storage locations, capacities, configurations, or functions. Central

DSIP Update Topical Sections
130
Hudson’s review of the cost valuations of these systems is consistent with the New York Energy Storage
Roadmap and Department of Public Service / New York State Energy Research and Development
Authority Staff Recommendations. Based on this report and the Central Hudson use case analysis, the
wide scale deployment of storage systems within our service territory (NYISO Zone G) currently does not
meet the breakeven installed cost of storage (BICOS) for most applications. Every individual use case has
unique parameters that need to be evaluated, but generally these systems are currently not cost
beneficial within Central Hudson’s service territory. Central Hudson is currently experiencing flat to no
load growth in most of our service territory. With available load serving capability to meet peak demands
in most of our system, Central Hudson’s most current Avoided T&D Avoided Costs Study (Appendix E)
identified very limited Locational System Relief Value (LSRV) areas. Due to the deferral time period and
nature of the potentially avoided T&D upgrades, the locational values within these areas are also limited.
Based on this data, it is not expected to see significant levels of storage deployment within our service
territory in the near future. As per the Energy Storage Roadmap, Central Hudson will look to see if future
solicitations for NWAs can better take into consideration the benefits of energy storage systems.
As part of our normal course of business, Central Hudson continuously processes interconnection
requests on both the distribution level (typically through the New York State SIR process) and the
transmission level (typically through the NYISO interconnection process). Central Hudson utilizes this data
to monitor the activity level for potential third-party energy storage systems on our system. To date,
there are a number of smaller residential type systems paired with PV and a limited number of
commercial systems proposed. There is currently a significant bulk level battery storage system (200MW
proposed) application ongoing through the NYISO process for interconnection to our 115kV transmission
system.
Central Hudson will continue to monitor both cost components and use case applications of these
systems and actively participate in the continued development and implementation of the New York
Energy Storage Roadmap by the Department of Public Service and New York State Energy Research and
Development Authority Staff. Utilizing this information with the storage system queue data from our
interconnection processes, and by refining the evaluation processes developed in our studies to date,
Central Hudson will continue to evaluate energy storage applications as system needs develop. When the
overall installed costs of these systems become comparable to alternative technologies or when
additional revenue streams materialize to adequately offset system costs, Central Hudson will develop
appropriate implementation plans. The evaluation of these installations will include both transmission
and distribution sited BESSs in varying capacities and configurations based on the system needs,
applications, and revenue streams.

DSIP Update Topical Sections
131
d) Identify, describe, and prioritize the current and future opportunities for
beneficial use of energy storage located in the distribution system. Uses
considered should encompass functions which benefit utility customers, the
distribution system, and/or the bulk power system. Each opportunity identified
should be characterized by:
(1) its location;
(2) the energy storage capacity (power and energy) provided;
(3) the function(s) performed4;
(4) the period(s) of time when the function(s) would be performed; and,
(5) the nature and economic value of each benefit derived from the energy storage resource.
In alignment with the New York Energy Storage Roadmap and Department of Public Service / New York
State Energy Research and Development Authority Staff Recommendations issued June 21, 2018, Central
Hudson recognizes the three market segment groupings (customer-sited, distribution system, and bulk
system) for storage deployment applications.
Consistent with the roadmap, Central Hudson recognizes retail bill management, demand response, and
storage paired with PV as three potential customer-sited use cases. Section III.H (Customer Data) of this
filing identifies customer-level data available and the privacy and security issues related to providing this
data. The available data can be utilized to help identify potential opportunities for the cost effective
application of customer-sited storage. In addition, Central Hudson’s System Data Portal provides 8760
historic circuit load data, where available, (for over 275 distribution circuits) and 8760 historic and
forecast load data for 54 of the 62 load serving substations where available on our system (see Section
III.F.5.a) for additional information).
(1) The location of the energy storage for these uses cases would vary and would be on customer-
sited locations.
(2) The energy storage capacity provided would vary by need and application.
(3) The function would be retail demand management, demand response and storage paired with
PV.
(4) The period of time when the function would be performed would vary by each particular
application/use case.
DSIP Update Topical Sections
132
(5) The nature and economic value of each benefit derived from the energy storage resource would
be customer-specific but would predominantly be customer bill reduction.
For the distribution system use cases, Central Hudson identifies both NWA areas and LSRV areas and
determines a system-wide demand reduction value (DRV). There are currently three existing Non Wires
Alternative areas and one ongoing solicitation for a Non Wires Alternative. These areas provide the
opportunity for the beneficial use of energy storage to eliminate or defer the need to complete growth
related T&D capital projects (i.e., capital deferral). To date, storage solutions have not been cost
competitive with either demand response or energy efficiency solutions in these areas. The storage
applications that have been assessed to date would require a long operational life to approach the point
of being economical. Such long term certainty is not feasible within our current NWA solicitations that are
designed for shorter term deferral of assets. Additionally, the currently available revenue streams are
generally not significant enough to justify the appropriate interconnection requirements and costs for
larger scale applications when compared to distributed, behind the meter DERs. Furthermore, the current
NYISO interpretation of FERC Order 841 (dual participation) creates a barrier for storage developers to
achieve additional revenue streams through storage assets that are deployed to meet utility needs. These
additional revenue streams could potentially have a positive influence on project economics.
As part of this filing (Appendix E), Central Hudson completed a new Avoided T&D Cost Study. This analysis
provided our system-wide DRV and identified two additional LSRV areas where the application of energy
storage systems may be beneficial.
(1) The location of the energy storage for these uses cases would be within one of our existing NWA
areas (Northwest Area, Shenandoah/Fishkill Plains and Merritt Park), at our current NWA area
(Coldenham 4027 circuit), or within one of the current LSRV (Hunter and Lawrenceville
Substation) load serving areas.
(2) The energy storage capacity provided would vary by need, location, and application. 10MW was
solicited for the Northwest Area NWA, 5MW for the Shenandoah/Fishkill Plains Area NWA, and 1
MW for the Merritt Park Area NWA. The current identified need for the Coldenham 4027 circuit
area is 0.5MW.
(3) The function for these applications would be demand reduction for system capital deferral.
(4) The period of time when the function would be performed would vary by each particular
application/use case. For the NWA areas, the time period is defined within the solicitation. For
the LSRV areas, compensation is based on the resources’ prior year performance during the top
ten highest usage areas within each particular location.

DSIP Update Topical Sections
133
(5) The nature and economic value of each benefit derived from the energy storage resource would
be a contract payment based on terms negotiated for the NWA areas. For the LSRV areas, the
economic value would be the LSRV values as determined by the 2018 avoided T&D cost study
(see Appendix E).
e) Identify and describe all significant resources and functions that the utility
and stakeholders use for planning, implementing, monitoring, and managing
energy storage at multiple levels in the distribution system.
Central Hudson is utilizing the New York Energy Storage Roadmap and Department of Public Service /
New York State Energy Research and Development Authority Staff Recommendations as a guideline for
the planning of energy storage systems. Based on this report, the wide scale deployment of storage
systems within our service territory (NYISO Zone G) currently does not meet the breakeven installed cost
of storage (BICOS) for most applications. As indicated within the document, every individual use case has
unique parameters that need to be evaluated, but generally these systems are currently not cost
beneficial within Central Hudson’s service territory. Central Hudson also utilizes the output of our
Avoided T&D Cost Study to determine the system-wide DRV and to identify the LSRV areas on our system.
This data helps inform the projected number of potential storage systems in response to these values.
Based on the results of our current study, an increase of storage systems is not anticipated at this time.
As storage systems with net positive value for our customers are identified, Central Hudson would utilize
our current processes in place for system implementation.
In conjunction with the DRV and LSRV areas, as noted previously, Central Hudson maintains a System
Data Portal that provides 8760 historic circuit load data, where available, (for over 275 distribution
circuits) and 8760 historic and forecast load data for 54 of the 62 load serving substations where available
on our system (see Section III.F.5.a) for additional information). This publically accessible data can be
utilized by stakeholders for planning and implementing energy storage at multiple levels in the
distribution system.
For system interconnection review, energy storage is considered a type of DER. Central Hudson’s current
planning processes incorporate the effects of different types of DERs – predominately PV, EE, and
demand response at this time. See Section III.A of this DSIP filing for additional information on current
status of Central Hudson’s integrated planning efforts. Due to the minimal level of storage currently
installed on our system, standalone/dedicated systems for the monitoring and management of energy
storage assets are not required at this time. Through the New York State SIR and the NYISO
Interconnection process, new storage systems will be studied as they go through the interconnection
process. New storage installations will be evaluated to determine the required monitoring and
management systems. Central Hudson will have monitoring and control as part of our DMS. As the energy

DSIP Update Topical Sections
134
storage systems become more prevalent, to the extent we are looking to dispatch these assets, it may
become cost effective to invest in systems designed specifically for DER and energy storage management.
It is expected that this type of system will either be an extension/enhancement of our current DMS or a
standalone system that interacts with our DMS. The implementation of such a system is not defined in
Central Hudson’s current investment plans.
(1) Explain how each of those resources and functions supports the utility’s needs.
The resources and functions outlined above support Central Hudson’s needs by providing a statewide
roadmap for energy storage and distribution system locational values for DERs. Our current plan to
implement a DMS with the ability to increase functionality as needs arise supports our needs at the
current levels of penetration and permits us to add functionality as energy storage levels increase.
(2) Explain how each of those resources and functions supports the stakeholders’ needs.
The resources and functions outlined above support stakeholders’ needs by providing a statewide
roadmap for energy storage and distribution system locational values for DERs. These resources provide
data to help determine the potential value streams for calculating project economics for energy storage
assets. Our system data portal provides both historic and forecast 8760 load data at a sufficiently granular
level to enable stakeholders to identify potential areas on our system where their specific use case may
be cost beneficial. In addition, the interconnection process provides a standard process for determining
the interconnection requirements and the timeline to interconnect to our distribution system. Our DMS
and network strategies initiatives will provide a cost effective and readily available means to provide the
required monitoring and control functionality for these systems to interconnect to our system.

DSIP Update Topical Sections
135
f) Describe the means and methods for determining the real-time status,
behavior, and effect of energy storage resources in the distribution system.
Information produced by those means and methods should include:
(1) the amount of energy currently stored (state of charge);
(2) the time, size, duration, energy source (grid and/or local generation), and purpose for each
charging event;
(3) the time, size, duration, consumer (grid and/or local load), and purpose of each energy
storage discharge;
(4) the net effect (amount and duration of supply or demand) on the distribution system of
each charge/discharge event (considering any co-located load and/or generation); and,
(5) the capacity of the distribution system to deliver or receive power at a given location and
time.
(1) through (4) Central Hudson currently has no energy storage assets interconnected to our system
that require means and methods for determining the real-time status, behavior, and effect of
energy storage resources in the distribution system. Central Hudson is unwilling to invest in
infrastructure and systems for this until this type of information is necessary based on
penetration levels. Central Hudson therefore does not currently have systems (i.e., the means
and methods) to determine the following: the amount of energy currently stored (state of
charge); the time, size, duration, energy source (grid and/or local generation), and purpose for
each charging event; the time, size, duration, consumer (grid and/or local load), and purpose of
each energy storage discharge; the net effect (amount and duration of supply or demand) on the
distribution system of each charge/discharge event (considering any co-located load and/or
generation) for energy storage resources.
(5) Central Hudson utilizes its existing planning and operational practices to determine the capacity
of the distribution system to deliver or receive power at a given location and time.
Energy storage resources interconnected to our distribution system are considered a type of DER. As
such, Central Hudson follows the current standards and practices for monitoring the interconnected DERs
on our distribution system. These practices have been developed to ensure Central Hudson maintains the
visibility and control necessary to safely and reliably operate our distribution system.
As energy storage systems are interconnected to our system, they will typically fall within three areas or
applications which, along with their size and location, will dictate their operation. These applications are

DSIP Update Topical Sections
136
bulk/transmission systems that follow the NYISO interconnection process, distribution-level systems that
Central Hudson controls or has the ability to dispatch, and storage coupled with other DERs which is
under the control of the interconnecting customer. Bulk/transmission systems will be dispatched by the
NYISO. Central Hudson will require sufficient visibility and monitoring of these facilities to operate our
system in a safe and reliable manner.
Distribution systems that we control or have the ability to dispatch will be managed through our
distribution operations area. It is envisioned that for a number of years, these systems will be managed by
simple on/off instructions or curtailment based on system constraints.
The overwhelming majority of the systems controlled by the interconnected customer will have the
ability to operate at full output only limited by customer requirements or distribution system abnormal
conditions. Abnormal distribution systems may dictate that the system remain offline until the
distribution system returns to normal.
In addition, Central Hudson has a number of ongoing initiatives that will allow us to increase our
functionality in response to higher penetration levels of DERs including energy storage. As indicated in
prior sections, Central Hudson is in the process of implementing a Distribution Management System in
conjunction with rolling out a Distribution Automation program and a Network Strategy communications
platform. These systems will provide us with significantly increased visibility into our distribution system
and, ultimately, the ability to operate our distribution system in real time. As the number of smart
distribution devices with monitoring capability installed on our system grows, our overall system visibility
and awareness will continue to increase. As indicated previously in this document, the distribution
operational data from our smart devices will be transmitted to our DMS via our communications network.
In addition to data provided by distribution smart devices, data from DERs as determined by the
operational requirements to reliably and safely operate our distribution system will also be integrated
into our DMS. This will include the necessary data and analytics to determine the information outlined
above (amount of energy currently stored (state of charge); the time, size, duration, energy source (grid
and/or local generation), and purpose for each charging event; the time, size, duration, consumer (grid
and/or local load), and purpose of each energy storage discharge; the net effect (amount and duration of
supply or demand) on the distribution system of each charge/discharge event (considering any co-located
load and/or generation); and the capacity of the distribution system to deliver or receive power at a given
location and time) as required by the specific application.
Overall, consistent with current practices, the level and complexity of the any monitoring required will
vary with the size, location, and application of the DERs on the Central Hudson system. Energy storage
systems represent additional complexity because of their ability to both supply and consume energy. As

DSIP Update Topical Sections
137
use cases for storage are expanded, the level of monitoring may need to change to meet specific
applications.
g) Describe the means and methods for forecasting the status, behavior, and
effect of energy storage resources in the distribution system at future times.
Forecasts produced by the utility should include:
(1) the amount of energy stored (state of charge);
(2) the time, size, duration, energy source (grid and/or local generation), and purpose of
charging events;
(3) the time, size, duration, consumer (grid and/or local load), and purpose of energy storage
discharges; and,
(4) the net effect on the distribution system of each charge/discharge event (considering any
co-located load and/or generation); and,
(5) the capacity of the distribution system to deliver or receive power at a given location and
time.
Due to the very limited amount of energy storage resources currently installed within our service
territory, Central Hudson does not currently require or have the means and methods for specifically
forecasting the status, behavior, and effect of storage resources at future times. Central Hudson is in the
process of implementing a DMS and has plans for a real time distribution operations center. Advanced
capabilities of the DMS will be evaluated, tested, and implemented as required. As the number and size
of DERs and storage resources interconnected to our system grow, both the status and control of these
resources will be incorporated into our DMS as necessary. Based on the current interconnection process
under the NYS SIR, the distribution system would be able to accommodate energy storage charging and
discharging as defined in the Interconnection Agreement at all times. The ability to forecast items such as
the state of charge, the net effect of charge and discharge operations on the distribution system, and the
capacity of the distribution system to deliver or receive power at a given location and time will be
incorporated into the DMS when the penetration levels necessitate this functionality. This centralized
system will permit us to forecast the items identified above as this capability is needed.

DSIP Update Topical Sections
138
h) Identify the types of customer and system data that are necessary for
planning, implementing, and managing energy storage and describe how the
utility provides those data to developers and other stakeholders.
Depending on the use case, there are differing types of customer and system data that may be necessary
for planning, implementing, and managing energy storage. This data includes:
Customer count by rate class;
Historical Load by customer type;
Load shape by customer type;
Capital investment plans;
Planned resiliency and reliability projects;
Reliability statistics;
Hosting capacity;
Beneficial locations;
Load forecasts;
Historical load data;
NWA opportunities;
Locational System Relief Value (LSRV) locations; and
Queued and installed DG.
Much of this data is readily available to developers and other stakeholders and is typically publically
available. In response to stakeholder feedback, the Joint Utilities developed a central data portal on the
Joint Utilities’ website in June 2017 with links to utility-specific web portals with available system data and
customer data is also being made available through UER. The Joint Utilities’ website
(https://jointutilitiesofny.org/system-data/) includes utility-specific links to the system data listed above.

DSIP Update Topical Sections
139
i) By citing specific objectives, means, and methods, describe in detail how
the utility’s accomplishments and plans are aligned with the objectives established
in New York State’s recently signed Energy Storage Deployment legislation and
Governor Cuomo’s new initiative to deploy 1,500 megawatts of energy storage in
New York State by 2025.
Central Hudson’s plans are aligned with the objectives established in New York State’s recently signed
Energy Storage Deployment legislation and Governor Cuomo’s new initiative to deploy 1,500 megawatts
of energy storage in New York State by 2025 as demonstrated by the following:
Central Hudson was an active participant in the use case development in the New York Energy
Storage Roadmap and Department of Public Service / New York State Energy Research and
Development Authority Staff Recommendations, providing input and feedback during the
process.
Central Hudson has been a leader within the state in collaboratively working with the Joint
Utilities, developers, and policy makers to advance interconnection process improvements.
Central Hudson has been very actively engaged in both the Interconnection Technical Working
Group (ITWG) and the Interconnection Policy Working Group (IPWG), with representatives from
Central Hudson chairing both of these committees. Improvements in the timeline and efficiency
of the interconnection process facilitate the integration of DERs onto our distribution system and
help improve their business cases. Central Hudson was instrumental in making changes to the SIR
to accommodate storage systems including both standalone and hybrid systems. These efforts
should help increase the deployment of energy storage within the state.
Central Hudson has been very actively involved in working with the other Joint Utilities and the
NYISO to facilitate dual participation of DERs including energy storage assets. This work will help
energy storage assets gain access to additional/multiple value streams including wholesale
markets. As the type and number of benefits the energy storage systems are eligible for increase,
the greater the likelihood that these assets will pass the cost benefit test thereby increasing their
financial viability and spurring additional deployments helping achieve the State goals.
Central Hudson has reviewed and processed interconnection applications in an efficient and cost
effective manner. Central Hudson is committed to facilitating the interconnection of all types of
DERs onto our distribution system. This includes the installation of customer owned/sited storage
systems, either as standalone systems or paired with renewable resources and larger scale
storage projects proposing to interconnect to our transmission system.
In our NWA areas, Central Hudson continues to actively engage with energy storage providers to
identify potential cost effective solutions that may meet the program needs and, as part of the

DSIP Update Topical Sections
140
Storage Roadmap, will evaluate what additional value streams can be realized by energy storage
solutions.
Central Hudson is in the process of implementing a DMS in coordination with DA and Network
Strategy programs. This system will significantly expand the visibility and control of our
distribution system. Greater real time awareness and control will ultimately enable our system to
better plan for, accommodate, and control (where required) all types of DER assets including
energy storage interconnected to our system.
Central Hudson will continue to track the cost effectiveness of storage use cases (capital deferral,
PV integration, reliability improvements) as detailed within our Quanta BESS Study – PV
Integration and Reliability Uses Cases analysis. As the storage assets become cost effective,
Central Hudson will incorporate these assets into our investment plans.
j) Explain how the Joint Utilities are coordinating the individual utility energy
storage projects to ensure diversity of both the energy storage applications
implemented and the technologies/methods employed in those applications.
The Joint Utilities formed an internal working group to coordinate on energy storage implementation
efforts. As part of this working group, the Joint Utilities have shared information regarding efforts to
deploy storage assets across their footprints. These coordination efforts have focused on aspects such as
permitting considerations, the technologies being deployed, and the applications that energy storage will
serve in each case. This coordination will inform current and future energy storage efforts and help the
utilities design a diverse portfolio of projects targeting a diversity of applications. The Joint Utilities
remain committed to continuing this coordination to further support the diversity of energy storage
applications and technologies across the state.
DSIP Update Topical Sections
141
E. Electric Vehicle Integration
1. Context and Background
Electric vehicles (EVs) are one of many tools for achieving the state’s clean energy objectives. The state’s
EV policies are generally derived from the 2015 New York State Energy Plan, which committed the state
to reduce greenhouse gas (GHG) emissions by 40% by 2030 and by 80% by 2050. Transportation accounts
for nearly 35% of New York’s GHG emissions, and the State Energy Plan specifically calls out EVs as a key
element of the overarching strategy to reduce GHG emissions.
A key component of the State Energy Plan is the Charge NY initiative, which was launched by the
governor in 2013 to create a statewide network of up to 3,000 public and workplace charging stations
and put up to 40,000 plug-in vehicles on the road over five years. The initiative also developed best
practices for municipal Electric Vehicle Supply Equipment (EVSE) regulations, created vehicle incentives
such as reduced bridge tolls, and removed regulatory obstacles for installing EVSE at public parking lots.
This initiative is led by a collaboration of NYSERDA, the New York Power Authority (NYPA), and the
Department of Environmental Conservation. These agencies are also tasked with implementing the Multi-
State Zero Emission Vehicle (ZEV) Action Plan, of which New York is one of eight signatories. The Multi-
State ZEV Action Plan established a collective goal of 3.3 million ZEVs by 2025; for New York, this is
equivalent to about 800,000 to 900,000 ZEVs on the road by 2025.
On April 24, 2018, the Commission commenced a proceeding to consider the role of electric utilities in
providing infrastructure and rate design to accommodate the needs and electricity demand of EVs and
EVSE. The proceeding is intended to explore cost-effective ways to build such infrastructure and
equipment and also determine whether utility tariff changes will be needed in addition to those already
being considered for residential customers to accommodate and promote the deployment of EVs.
Additionally, the proceeding will investigate the characteristics of EV charging systems and how those
systems may facilitate EV participation as a distributed energy resource (DER) in a manner not yet
captured by the Reforming the Energy Vision (REV) Initiative.
On May 31, 2018, the Governor announced a new $250 million electric vehicle expansion initiative,
EVolve NY, with the New York Power Authority. The program will involve state funding and also seek to
create private sector partnerships through 2025 to aggressively accelerate the adoption of electric
vehicles throughout New York State. NYPA will be launching several new innovative initiatives to co-invest
with private sector partners, collaborate with partners on identifying new business and ownership
models, and increase customer awareness about electric vehicles and charging. This major investment
plan aims to expand fast charging infrastructure and make EVs more user-friendly for all New Yorkers.

DSIP Update Topical Sections
142
In the Supplemental DSIP, the Joint Utilities described the current state of the EV market and committed
to form a utility working group to develop a joint EV Readiness Framework (“Framework”) within twelve
months of completion of the comment process for the Supplemental DSIP filing (or January 2018). The
Supplemental DSIP also included a set of guiding principles co-developed with stakeholders for utility
involvement in supporting the increased adoption of EVs and charging infrastructure; these helped
inform the development of the joint Framework. As discussed in greater detail below, the Joint Utilities
completed a draft of the Framework in January 2018 and circulated it with interested stakeholders for
feedback. In early February 2018, the Joint Utilities held a stakeholder meeting focused on aspects of the
Framework and provided an opportunity for stakeholders to ask questions and offer additional input on
the document. The final draft of the document was posted on the Joint Utilities website in March and is
included as Appendix G.
In support of the initiatives noted above, the Commission directed the utilities to continue preparing for
higher penetrations of EVs. As noted in the March 9, 2017, DSIP Order, “the Commission expects the
Utilities to continue investigating EV-related infrastructure effects and modifications in anticipation of a
potential future when the range of needs and demands for EVs is substantial.”
2. Implementation Plan
a) Current Progress
The Joint Utilities, with input from stakeholders, have agreed upon a clear path toward EV readiness that
reflects a more proactive stance by utilities in the EV market. Utilities are advancing EV demonstrations,
pilot projects, and programs and are continuing to work with regional groups, associations, and
governments to advance EV initiatives and infrastructure awareness. In January 2018, the Joint Utilities
released a draft of the joint Framework for stakeholder review.
In addition to the Joint Utility efforts, over the past year Central Hudson has developed a new strategic
focus on EV Initiatives with the purpose of increasing EV adoption through stakeholder participation and
advocacy, increasing the employee EV experience, and demonstrating leadership in EV policy. The
strategic approach will focus on Utility Infrastructure, Vehicle Charging, and Advocacy and Education. The
initial priority actions include:
Establishing program leadership and a cross-functional team;
Developing and implementing an employee program focused on education and adoption;
Expanding existing advocacy efforts with an “EV Summit” or similar annual events;
Establishing outreach to local counties and municipalities.

DSIP Update Topical Sections
143
Addressing rate design issues and proposing solutions that advance the program; and
Proposing a transportation electrification program in accordance with our rate order.
Joint Utilities EV Readiness Framework
The objectives of EV readiness planning are to identify, prioritize, and execute actions in the near- to mid-
term in order to unlock the potential of transportation electrification. The Framework also describes the
hurdles to widespread deployment of EV infrastructure (and vehicles, where appropriate). Hurdles
referenced in the Framework include, but are not limited to, the higher price of EVs compared to
conventional vehicles, lack of public EV charging infrastructure, lack of consumer awareness of EV
benefits, and lack of coordination among stakeholders.
Given the limited size of the current EV market, the Joint Utilities believe that the Framework,
complemented by demonstration projects and active education and outreach efforts, is the most
effective way for utilities to facilitate increased EVSE deployment and EV adoption. The Framework
reflects significant stakeholder input and Central Hudson has adopted it as part of our own EV promotion
efforts.
The Framework addresses near-term priorities resulting from the stakeholder engagement sessions, with
a focus on:
EV charging infrastructure planning and forecasting EV growth to assess and mitigate potential
system impacts;
Streamlining charging infrastructure deployment in New York, which is characterized by reviewing
service connection requirements; outlining local ordinances, building codes and design guidelines
that can help reduce barriers to infrastructure installation; and highlighting the value of
interoperability and standardization of charging equipment;
Advancing rate design considerations that will improve the customer experience while minimizing
impacts to utility system operation; and
Conducting education and outreach efforts that improve customer awareness about the benefits
of EVs.
The role of the utility varies considerably across the core elements of the Framework. In some cases,
readiness will be achieved through proactive measures, while in others, utilities remain in a position of
information gathering. The utilities will continue to use the Framework to identify useful indicators for
assessing market performance and continue to update internal assessments related to determining the
thresholds at which distribution system impacts or benefits of EVs may become more significant. While
DSIP Update Topical Sections
144
the Joint Utilities have developed a common framework, the market indicators, EV programs and their
implementation plans, and timelines taken by individual utilities will vary due to utility-specific factors.
Infrastructure Planning
The Joint Utilities have worked to communicate internally and externally with stakeholders regarding
their respective approaches to charging infrastructure planning. Central Hudson is projecting the impact
of EVs into our forecasts and will be projecting the impact of EV charging on the distribution system.
While we do not see general system issues with the deployment of EVs and EVSE, we have in place a
process to evaluate and address issues as they arise. With regard to infrastructure deployment, such as
make ready or interconnection infrastructure for EVSE, we have not included any specific investment in
our business plans but as utilities are uniquely positioned to make these investments in a cost effective
manner, we remain open to the possible utility involvement in EVSE investment.
EV Penetration Forecasting Approach and Me thodology
The EV market is poised for significant growth over the next several years due to increased consumer
offerings, more competitive vehicle pricing, and favorable policies. However, the expected near-term
levels of EV adoption do not significantly impact utility system planning scenarios and related distribution
system investment plans. The incorporation of forecasted EV penetration and adoption rates into the
system planning process varies by utility. Central Hudson’s EV forecasting assumptions, methodology, and
results are listed in the appendices (Appendix A).
Projected Utility System Impacts and Investment
Distribution-level impacts are possible as a result of EV clustering and charging at discrete locations (e.g.,
with significant fast charging demands). However, considering the anticipated power and energy
demands of EVs in the near- to mid-term future, the impacts can be addressed through normal
infrastructure without an extension of investments.
Streamlining Charging Infrastructure Deployment
The Joint Utilities are engaged in a variety of projects deploying charging infrastructure and continue to
seek ways to reduce the barriers to deploying charging infrastructure. The Joint Utilities will continue to
engage in projects that include deploying Level 2 and DC fast charging infrastructure, smart charging
pilots, workplace charging deployments, and system reinforcement projects whereby the utility makes
the necessary upgrades to accommodate future installations of EVSE.
DSIP Update Topical Sections
145
Service Connection Requirements and Processes
The Joint Utilities EVSE Working Group is collaborating to reduce the barriers to deploying charging
infrastructure and improve their existing individual service connection processes to provide a more
positive user experience.
Local Ordinances, Building Codes , and Design Guidelines
Local zoning and parking ordinances, building codes, and design guidelines for EVSE may enable easier
and less costly installation. Central Hudson will be working both individually and with the Joint Utilities to
engage local and regional government stakeholders seeking to adopt “EV ready” policies and plans, and
provide support where possible.
Interoperability and Standardization
EVs are an emerging market area with many different, non-standardized EVSE protocols and technology
configurations; the Joint Utilities are keenly aware that interoperability and standardization are keys to
minimizing constrained or stranded assets. Central Hudson will seek to ensure that any investments are
maximized and not beholden to the success (or failure) of a single network provider. A positive customer
experience is paramount, regardless of the technology, and Central Hudson is supportive of industry
engagement and ongoing progress towards common standards.
Rate Design Considerations
With EV deployment in its early stages, utilities can begin to explore effective rate design considerations.
Central Hudson does not believe that the elimination of demand charges for low load factor loads is
sustainable in the long term, and they are committed to finding solutions that address short-term
economic challenges that enable the growth of the market.
Central Hudson will seek to align rate design with the following key considerations in mind:
Comply with the requirements of Assembly Bill 288;34
Minimize the costs of EV charging, interconnection costs, and potential distribution system
impacts;
Encourage EV drivers to charge at preferred times using price signals;
34 New York State legislature passed Assembly Bill A288 in 2017, requiring utilities to file a residential EV charging tariff by April 1, 2018. The regulation also requires utilities to report periodically to the Commission the number of customers who have signed up for the tariff, the total amount of electricity delivered to those using the tariff, and other data requested from the Commission. Full text of the legislation is available online: http://legislation.nysenate.gov/pdf/bills/2017/A288

DSIP Update Topical Sections
146
Provide EV charging rates that drivers can easily understand; and
Provide EV drivers with a cost-competitive rate when compared to the standard/flat rate and the
potential to realize cost savings relative to gasoline.
EV service providers and other stakeholders have expressed explicit concern about the potential negative
impacts of demand charges on DC fast charging. Central Hudson recognizes that DC fast charging can help
achieve higher rates of EV adoption through the reduction of range anxiety and we are actively seeking
solutions to improve the business case. However; Central Hudson does not support the waiving of
Demand Charges for EV charging stations or the shifting of EV chargers from demand to non-demand
rates, especially for equipment that will likely have a negative impact on the circuit and system load
factor. However, Central Hudson remains open to discussing this as part of the PSC proceeding and is
willing to discuss other rate design considerations or equipment supply options, such as EVSE coupled
with Battery Storage, as a way to address both the system impact and economics of EVSE.
Education and Outreach
In order to create a positive customer experience, the Joint Utilities have identified effective
communication channels through multiple avenues based on the interests of the targeted audience. For
the purposes of the joint EV Readiness Framework, education and outreach efforts are distinguished by
those focused on EVs or EV charging.
Central Hudson leverages a range of channels to communicate with customers about electric vehicle
topics, including e-newsletters, social media, events, press releases, websites, direct mail, vehicle wraps
and advertisements. The Company actively collaborates with manufacturers, local advocacy groups and
other parties to expand awareness of electric vehicle information and develop new opportunities.
Employees are provided hands-on opportunities to increase their knowledge of electric vehicles and help
to encourage electric vehicle adoption within the communities served by Central Hudson.
b) Future Implementation and Planning
Central Hudson agree with the other Joint Utilities on the importance of working together on developing
communication channels to help customers understand the numerous benefits of EV adoption. The Joint
Utilities EVSE Working Group will continue advancing efforts outlined in the Supplemental DSIP
commitments, including:
Designing and conducting individual utility engagement activities with local governments and municipalities;
Continuing to work with regional groups, associations, and governments to advance EV initiatives and infrastructure awareness; and

DSIP Update Topical Sections
147
Continuing to support the identification and implementation of EV demonstration and pilot projects.
3. Risks and Mitigation
Central Hudson recognizes a number of risks with its plans for Electric Vehicle Integration. While the EV
market is poised for significant growth, there are many factors beyond the control of Central Hudson that
will ultimately dictate the level of EV penetration and the associate impacts to the electric distribution
system. Central Hudson will continue to update its forecast of EV adoption so that as changes occur,
either due to market changes or technology improvements, we will be able to use our normal planning
processes to identify system impacts, needs, and potential solutions.
Central Hudson’s approach will be to avoid overbuilding for EVSE and match the supply equipment need
with the EV adoption and consumer needs. This will avoid building unnecessary equipment or equipment
in the wrong location, ensuring that the correct charging equipment is installed as technologies advance
and minimizing the chance the equipment deployed will become obsolete.
Another risk is that EV adoption, especially in the medium and heavy duty market, will develop quickly
and that the impact on Central Hudson infrastructure would be significant. To avoid this, Central Hudson
will remain apprised of EV technology and research to ensure that as this market develops, the system
impacts and potential mitigation measures are understood well in advance of the need.
4. Stakeholder Interface
In June 2016, the JU had a rough sketch of EV readiness in place that reflected reactions to stakeholder
comments. Some key takeaways from 2016 Stakeholder Engagement Sessions are:
Stakeholders encouraged the JU to collaborate both among the JU and with a broad base of
stakeholders since many aspects of the EV industry are outside the realm of traditional utility
business and operations;
Stakeholders supported JU outreach and education opportunities to utility customers for EV-
related topics and to use demonstration projects to inform JU planning and promote EV adoption
in high density urban areas as well as suburban environments; and
JU and Stakeholders agreed that an EV Readiness Framework would advance how the utilities
currently incorporate EVs into their planning activities and help accelerate demonstration
projects.
On February 1, 2018, a stakeholder session was held by the Joint Utilities to review the JU EV Readiness
framework and there were a number of takeaways from the sessions that will be discussed further in the
PSC proceeding as well as future stakeholder sessions.

DSIP Update Topical Sections
148
5. Additional Detail
a) Using a common framework (organization, format, semantics, definitions,
etc.) developed jointly with the other utilities, identify and characterize the
existing and anticipated EV charging scenarios in the utility’s service territory. Each
scenario identified should be characterized by:
(1) the type of location (home, apartment complex, store, workplace, public parking site, rest
stop, etc.);
(2) the number and spatial distribution of existing instances of the scenario;
(3) the forecast number and spatial distribution of anticipated instances of the scenario over
the next five years;
(4) the type(s) of vehicles charged at a typical location (commuter car, bus, delivery truck, taxi,
ride-share, etc.);
(5) the number of vehicles charged at a typical location, by vehicle type;
(6) the charging pattern by vehicle type (frequency, times of day, days of week, energy per
charge, duration per charge, demand per charge);
(7) the number(s) of charging ports at a typical location, by type;
(8) the energy storage capacity (if any) supporting EV charging at a typical location;
(9) an hourly profile of a typical location’s aggregated charging load over a one-year period;
(10) the type and size of the existing utility service at a typical location;
(11) the type and size of utility service needed to support the EV charging use case;
The common framework envisioned in this directive is a detailed electric vehicle charging infrastructure
siting analysis. To date, the Joint Utilities have developed the EV Readiness Framework, which identifies
key strategies to support EV adoption through utility action, engagement, and collaboration. The
framework envisioned in this directive is an analytical precursor to investment or engagement at a scale
larger than what has currently been contemplated publicly by any single utility in New York. Furthermore,
based on the Joint Utilities’ review of transportation electrification filings in other states, this type of
jointly conceived framework regarding existing and anticipated EV charging scenarios would be atypical.
As investor owned utilities have made substantial investments in other states, they have targeted various

DSIP Update Topical Sections
149
aspects of the EV market – with a focus on workplace and public charging stations and some on
residential charging. These efforts, however, have been aligned with some internally defined business and
investments decisions, rather than the subject of a jointly conceived siting framework.
The most detailed analysis of which the Joint Utilities are aware comes from the National Renewable
Energy Laboratory’s National Plug-in Electric Vehicle Infrastructure Analysis, which includes an estimated
number of public Level 2 and DC fast charging or quick charging ports in several geographies. However,
even that detailed analysis does not address the majority of the characteristics requested (and outlined in
the text below). Some of the characteristics of each scenario requested can be populated by information
and lessons learned from completed, ongoing, or planned pilot projects. However, many of these
characteristics require a myriad of assumptions regarding aspects of the vehicle market that are not well
understood – including travel patterns, the anticipated vehicle architecture of the market moving forward
(e.g., plug-in hybrid vs battery electric), and the expected or preferred technology for charging vehicles in
different locations.
b) Describe and explain the utility’s priorities for supporting implementation
of the EV charging use cases anticipated in its service territory.
Per the EV Readiness Framework, Central Hudson and the Joint Utilities will undertake measures that will
support EV adoption in a nascent market, helping to achieve and, where possible, accelerate the long-
term potential of transportation electrification. The Joint Utilities of New York have prioritized charging
infrastructure planning, streamlining charging infrastructure deployment in New York, advancing rate
design considerations that will improve the customer experience while minimizing impacts to utility
system operation, and conducting education and outreach efforts that raise awareness about EVs.
The role of the utility varies considerably across the core elements of the EV market and the EV Readiness
Framework – in some cases, readiness will be achieved through proactive measures, while in others the
utilities remain in a position of information gathering. Consider, for instance, rate design – utilities are
proactively seeking to encourage behavior that supports and improves prospects for increased EV
adoption and addresses the goals of REV by improving system load factor and minimizing peak demand
growth. On the other hand, utilities are tracking initiatives that promote interoperability and
standardization, rather than spearheading them.
DSIP Update Topical Sections
150
c) Identify and describe all significant resources and functions that the utility
and stakeholders use for planning, implementing, monitoring, and managing EV
charging at multiple levels in the distribution system.
(1) Explain how each of those resources and functions supports the utility’s needs.
(2) Explain how each of those resources and functions supports the stakeholders’ needs.
As the Joint Utilities advanced the EV Readiness Framework, it became clear that utilities are in the early
stages of planning, implementing, monitoring, and managing EV charging as it relates to the distribution
system. The modest adoption of EVs to date has not warranted dedicated resources and functions;
rather, utilities have generally been able to managing EV charging via existing processes. The Joint Utilities
anticipate providing more detail on the resources and functions required for planning, implementing,
monitoring, and managing EV charging in the next DSIP filing. This will evolve in the short term as the PSC
and the NYPA petition are addressed.
d) Identify the types of customer and system data that are necessary for
planning, implementing, and managing EV charging infrastructure and services
and describe how the utility provides those data to interested third-parties.
As noted previously, the Joint Utilities are in the early stages of planning, implementing, and managing EV
charging infrastructure and services. Through use case discussions held with Stakeholders, it was
determined that there are a variety of customer and system data sources necessary for planning,
implementing, and managing EV charging infrastructure and services. The Joint Utilities have identified a
subset of the higher priority data that will be required, as noted below.
Customer load profile. The utility will need to know the customer load profile, including charging
capacity prior to the installation of EV charging infrastructure to help understand the impact on
the customer as well as system-level impacts.
Likely EV charging demand. In workplace or other non-residential types of EV charging, the utility
would need to know the anticipated charging demand (e.g., how many EVs are likely to be
charging) and at what level (e.g., Level 2 charging vs DC fast charging; more likely the former).
This will help characterize the charging capacity required at the facility. For a residential
installation, the utility would need to know the level of charging that the customer is seeking,
namely Level 1 or Level 2. Note that it is unlikely that the utility plays a substantive role in
deploying Level 1 charging infrastructure.
Distribution asset load profile. The utility will need to know the load profile on the nearest
substation or similar distribution asset to understand the likely impact that may arise from

DSIP Update Topical Sections
151
increased load attributable to EV charging. This will enable the utility to update its asset
management strategy for that substation, feeder, etc.
Potential location of EV charging infrastructure. To the extent that “implementation” of EV
charging infrastructure is inclusive of installation, the layout of the proposed installation, namely
the location of the physical hardware referred to as Electric Vehicle Supply Equipment (EVSE), will
help determine the associated costs. More specifically, the trenching and cutting costs associated
with the installation of EVSE at existing facilities can vary significantly depending on the location
of the planned installation relative to the point of connection with utility service.
At this time, there are no formal mechanisms for utilities to share customer data with third parties. In
some cases, customer load data may be shared with the consent of the site host.
e) By citing specific objectives, means, and methods, describe in detail how
the utility’s accomplishments and plans are aligned with New York State policy,
including its established goals for EV adoption.
Central Hudson’s plans are aligned with the policy objectives set forth in the “Multi State ZEV Task Force”
which established an organization-wide goal of 3.3 million ZEVs by 2025 and an estimated 850,000 for
New York State by 2025 as demonstrated by the following:
Our current EV forecasts have scenarios based on the current market growth projections as well
as a high market growth scenario;
Our current and high market forecasts are currently between 9,000 and 16,500 BEVs in the
service territory by 2025 (see Figure III-XX), which are in the same magnitude as other projections
that will meet the ZEV goals.

DSIP Update Topical Sections
152
Figure III-XX: Electric Vehicle Forecasts
Using these forecast scenarios, and other information regarding the granularity of the existing EV
ownership, we are assessing the impacts on system demand and energy growth down to the
substation level.
Central Hudson will be using this information in its planning process to assess the impact of EVSE
on the broader distribution system.
In addition, Central Hudson will continue to assess its role in the interconnection of EVSE and, if found to
be a cost effective and beneficial investment, Central Hudson will incorporate these assets into our
investment plans.
f) Describe the utility’s current efforts to plan, implement, and manage EV-
related projects. Information provided should include:
(1) a detailed description of each project, existing and planned, with an explanation of how the
project fits into the utility’s long range EV integration plans;
Central Hudson has developed a new strategic focus on Electric Vehicle Integration as a way to improve
system efficiency, greenhouse gas reduction, and improved revenues. While still being formulated, the
program’s priority initiatives are as follows:
Establishing program leadership and a cross-functional team;
Developing and implementing an employee PEV program focused on education and adoption;

DSIP Update Topical Sections
153
Expanding existing advocacy efforts with a “EV Summit” or similar annual event;
Establishing outreach to local counties and municipalities;
Addressing rate design issues and propose solutions that advance the program; and
Proposing a transportation electrification program (external) in accordance with our anticipated
rate order.
(2) the original project schedule;
There has been no project schedule established at this time.
(3) the current project status;
Of the priority items, the program leadership and cross functional team has been established and efforts
on increasing and improving consumer outreach are underway.
(4) lessons learned to-date;
There have been no lessons learned to date.
(5) project adjustments and improvement opportunities identified to-date;
There have been no proposed project adjustments or improvement opportunities identified to date.
(6) next steps with clear timelines and deliverables;
The next steps are listed above in the priority actions; however, no clear timelines or deliverables have
yet been established.
g) Explain how the Joint Utilities are coordinating the individual utility EV-
related projects to ensure diversity of both the EV integration use cases
implemented and the technologies/methods employed in those use cases.
The Joint Utilities recognize that practical demonstration projects will likely form the basis of planning
related to transportation electrification moving forward. Further, the Joint Utilities have noted that rapid
technological advances and the diversity of EVs in the market today requires utilities to begin planning for
charging infrastructure today for the EV deployment of tomorrow. In order to develop a better
understanding of the most effective way to engage in transportation electrification, the Joint Utilities
continue to be involved in a wide array of demonstration and pilot projects – and most of these projects
are highlighted in the EV Readiness Framework. The diversity of those EV-related projects reflects the
diversity of approaches that utilities have developed with respect to transportation electrification.
DSIP Update Topical Sections
154
The Electric Vehicle Working Group provides a platform for collaboration and coordination on EV-related
issues for the Joint Utilities of New York. Most recently, the working group developed the EV Readiness
Framework, which documented a consistent approach to EV integration agreed to by the individual
utilities, considering input from other key stakeholders. The document also highlights a summary of utility
EV demonstration and pilot projects. While each individual utility advances EV-related projects in their
own service territory, subject to internal business decisions and resource prioritization, the Joint Utilities
will continue to use the EV Working Group as a platform for collaboration and sharing lessons learned,
thereby helping to ensure the sustained diversity of EV integration use cases and the technologies and
methods employed in the use cases.
h) Describe how the utility is coordinating with the efforts of the New York
State Energy Research and Development Authority (NYSERDA), the New York
Power Authority (NYPA), New York Department of Environmental Conservation
(DEC), and DPS Staff to facilitate statewide EV market development and growth.
The Joint Utilities were proactively engaged with NYSERDA, NYPA, DEC, and DPS staff through the
development of the EV Readiness Framework published in March 2018. Multiple staff members from
these organizations were active participants in the two stakeholder meetings, held in September 2017
and February 2018. Further, the Joint Utilities have invited staff from these organizations to present to
the EV Working Group several times over the past twelve months. The presentations covered a range of
issues, including the costs and benefits of EV deployment in New York State and the role of demand
charges in DC fast charging use cases. In addition, Central Hudson and the Joint Utilities are actively
participating in the PSC case on EV and in the Tech Conferences being held to advance the Commission’s
understanding of the nuances of rate design, infrastructure needs and ownership models, and system
impacts.

DSIP Update Topical Sections
155
F. Energy Efficiency Integration and Innovation
1. Context and Background
Central Hudson is proud to implement programs which provide customers with opportunities to reduce
their energy use, manage their energy bill, and contribute to the achievement of the State’s ambitious
energy goals. Central Hudson has designed its programs with a focus on maximizing value by seeking out
innovative ways to reduce the cost of the Energy Efficiency portfolio while increasing the quantity of
MWh savings attained.
In 2016, Central Hudson integrated new residential lighting opportunities into the portfolio. These
programs led to increased energy savings in 2017 and will continue in the near term. The expansion of
lower cost lighting initiatives continues to drive down the average cost of the electric portfolio and
maximize the MWh savings. Lighting initiatives such as the Residential Retail Point-of-Sale initiative, the
CenHub Store, and the Community Lighting initiative have provided residential customers with more
opportunities and choices to participate. Residential customers now have the option to shop online
through the CenHub Store or visit local brick and mortar retail stores to purchase LED lights at a reduced
cost. Additionally, the Community Lighting initiative is the first Central Hudson initiative targeted toward
low-income customers. To implement the Community Lighting initiative, Central Hudson partnered with
community organizations such as United Way to distribute over 20,000 LED bulbs through the local
agencies they support and fund. The Company was able to achieve cost effective savings by partnering
with the manufacturer to procure lighting measures at wholesale prices. For more details on all of the
programs within Central Hudson’s Energy Efficiency portfolio, see Central Hudson’s 2017-2020 Energy
Efficiency Transition Implementation Plan (ETIP)35. Per the Order Authorizing Utility-Administered Energy
Efficiency Budgets and Targets for 2019-2020, issued and effective March 15, 2018, the ETIP will soon be
replaced by the System Energy Efficiency Plan (SEEP) which better describes “the entirety of the utility’s
expanded reliance on and use of cost effective energy efficiency to support their distribution system and
customer needs.”
On June 14, 2018, the Commission issued an “Order Adopting Terms of Joint Proposal and Establishing
Electric and Gas Rate Plan,” under Cases 17-E-0459 and 17-G-0460 which establishes new Earnings
Adjustment Mechanisms (EAMs), a new Carbon Reduction Program (CRP), and a new Geothermal Rate
Impact Credit, increased Energy Efficiency MWh targets and funding levels. The order also transitions
35 http://documents.dps.ny.gov/public/Common/ViewDoc.aspx?DocRefId={60E805D0-7B4F-4987-A8F9-
360FD6C895BF}

DSIP Update Topical Sections
156
recovery of Energy Efficiency expenses to base rates instead of the Energy Efficiency tracker surcharge
portion of the System Benefit Charge.
Central Hudson’s EAMs
Central Hudson has the opportunity to earn incentives associated with the achievement of Earnings
Adjustment Mechanisms (EAMs). Including Energy Efficiency, there are five EAMs for electric, comprised
of seven different metrics. Central Hudson has the opportunity to earn average annual pre-tax earnings
on a prorated basis between $1.3M and $4.9M from 2018 through 2021. The EAMs are intended to
provide the Company with incentives to:
increase electric system efficiency through peak reduction and distributed energy
resource utilization;
increase achieved electric and gas energy efficiency;
reduce residential and commercial customers’ electric energy intensity (total usage on a
per customer basis);
increase residential customer participation in voluntary Time of Use rates; and
reduce carbon emissions through increased penetration of environmentally beneficial
electrification technologies.
Central Hudson believes these EAMs place significant emphasis on the value of producing results through
new and innovative approaches to achieving the State’s objectives. Specifically, the EAMs associated with
Energy Efficiency, Energy Intensity, and Environmental Beneficial Electrification are directly linked to the
State goal of reducing Carbon Emissions by 40%.
New Energy Efficiency Targets and Funding Levels
Central Hudson will be striving to achieve MWh savings at levels 100% higher than its historical EEPs
target. The Rate Plan Order increased annual energy efficiency targets by 40% with a maximum EAM for
performance up to a 100% increase. These target increases were paired with smaller increases in funding
of 15% and 40% for electric and gas programs respectively. The proportionately lower funding increase
will force innovative approaches to optimizing the cost of achieving each MWh savings. The funding
increase equates to approximately $1.3M on an annual basis. This $1.3M can be utilized flexibly for
Energy Efficiency expenditures or to increase the funding of the Carbon Reduction Program.

DSIP Update Topical Sections
157
Carbon Reduction Program Targets and Funding Levels
Additionally, Central Hudson’s current Rate Plan authorized funding for a new Carbon Reduction Program
focused on meeting New York State’s Green House Gas (GHG) emissions reduction goal and provides an
Earnings Adjustment Mechanism (EAM) to incentivize the Company to achieve specific targets associated
with the environmentally beneficial electrification of the transportation and heating sectors. The CRP
aims to efficiently reduce the carbon footprint within Central Hudson’s service territory through the
installation of environmentally beneficial electric technologies such as air-source heat pumps, electric
vehicles, and geothermal heat pumps. Within the Rate Plan Order, the Commission authorized funding of
$1.2M for the period beginning July 1, 2018, through December 31, 2021. Following the PSC Secretary’s
granting of an extension request, the Company will file a Carbon Reduction Implementation Plan on or
before August 30, 2018.
2. Implementation Plan
a) Current Progress
As previously discussed, the ETIP will soon be replaced by the SEEP. Central Hudson expects to file its first
SEEP in the 4th quarter of 2018, following receipt and comment on DPS Staff guidance. During the interim
period Central Hudson will focus on achieving the targets within its Rate Plan Order.
Central Hudson has implemented a portfolio of Energy Efficiency programs since 2009, with specific
initiatives targeted at various end uses and customer segments. Over this period, Central Hudson has
integrated many innovative approaches and practices in order to optimize the cost and increase the
quantity of MWhs achieved. Central Hudson’s progress in these efforts is illustrated in Table 26. As
Central Hudson Energy Efficiency programs have evolved, the average annual MWh savings have
increased by 110% and the cost per MWh has decreased by 59%.
Table 26: Central Hudson Historical MWh Savings and Costs
Framework Years MWh Savings Expenses Avg. Annual
MWh Savings $/MWh
EEPS36-1 2009-2011 75,133 $21,459,934 25,000 $286
EEPS-2 2012-2015 152,804 $32,393,211 38,200 $212
EET37 2016-2017 105,004 $12,290,032 52,500 $117
Total 332,941 $66,143,177
36 Energy Efficiency Portfolio Standard
37 Energy Efficiency Transition

DSIP Update Topical Sections
158
b) Future Implementation and Planning
As discussed previously, within Central Hudson’s Rate Plan Order, EAMs were established including an
Energy Efficiency EAM. The Electric Energy Efficiency EAM is composed of three metrics of which one is
programmatic and two are outcome based. The metrics consist of: Electric Energy Efficiency
(programmatic), Residential Electric Energy Intensity (outcome based), and Commercial Electric Energy
Intensity (outcome based). Additionally, the Rate Plan Order established targets for the Environmentally
Beneficial Electrification EAM, which is also discussed below.
The Electric Energy Efficiency EAM metric incentivizes the Company to achieve energy efficiency savings
in calendar years 2018 through 2021 that are significantly above its historical first-year annual savings
target of 34,240 MWh. This metric will be measured as the sum of MWh savings from all of Central
Hudson’s administered electric energy efficiency programs, including behavioral programs, which may be
utilized to achieve MWh targets. As a precondition to earning the incentive associated with this metric,
the EUL of the Energy Efficiency portfolio must be at least 7.9 years. The Energy Efficiency EAM targets
for electric were also converted to gross MWh targets in order to be consistent with the Order issued on
March 15, 2018 in Case 15-M-0252.38
The Residential Electric Energy Intensity EAM and the Commercial Electric Energy Intensity EAM will
incentivize Central Hudson to reduce residential (SCs 1 and 6) and commercial (SC 2 non-demand)
customers’ total usage on a per customer basis. This metric will be measured as the sum of weather-
normalized annual residential MWh sales adjusted for Community Distributed Generation allocations and
increased sales due to beneficial electrification technologies, such as heat pumps and electric vehicles,
divided by the 12-month average number of residential customers.
The Commercial Electric Energy Intensity EAM metric incentivizes Central Hudson to reduce commercial
(SC 2 non-demand) customers’ total usage on a per customer basis. This metric will be measured as the
sum of the weather-normalized annual commercial MWh sales adjusted for Community Distributed
Generation allocations and increased sales due to beneficial electrification technologies such as heat
pumps and electric vehicles, divided by the 12-month average number of commercial customers.
The Environmentally Beneficial Electrification EAM metric incentivizes the Company to reduce carbon
emissions by facilitating greater penetration of technologies that utilize electricity and reduce carbon
emissions relative to traditional technologies that rely on more carbon intensive fuel sources. Examples of
these technologies include geothermal heating and cooling, air source heat pumps for heating and
38 Case 15-M-0252, In the Matter of Utility Energy Efficiency Programs, Order Authorizing Utility-Administered Energy Efficiency Portfolio Budgets and Targets for 2019-2020 (issued March 15, 2018).

DSIP Update Topical Sections
159
cooling, and electric vehicles. The metric will be measured as the lifetime short tons of avoided carbon
dioxide from environmentally beneficial electrification technologies as identified in the Company’s
Carbon Reduction Implementation Plan. The Environmentally Beneficial Electrification EAM will be
measured as the incremental lifetime short tons of avoided carbon dioxide (CO2) from incremental
electric vehicles and heat pumps. Incremental lifetime tons of CO2 will be calculated as the number of
incremental units multiplied by the assumed avoided tons of CO2 multiplied by the average technology
life as agreed to below:
Electric vehicles (EVs): EV registrations * 3.8 tons CO2 * 10 years
Air-source heat pumps (ASHPs): ASHP installations * 6.7 tons CO2 * 15 years
Ground-source heat pumps (GSHPs): GSHP installations * 6.7 tons CO2 * 25 years
The EV component of the Environmentally Beneficial Electrification metric is an outcome based metric
and will be measured as the incremental number of electric vehicles registered in Central Hudson’s
service territory. Electric vehicles are defined as battery electric vehicles (BEVs) and Plug-in hybrid
vehicles (PHEVs). Data will be obtained from the HIS Markit Vehicle Market Analysis: Registrations and
Vehicles-in-Operation. Quantification of the ASHP component of the Environmentally Beneficial
Electrification metric will be determined through participation in Central Hudson’s Carbon Reduction
Program. Quantification of the GSHP component of the Environmentally Beneficial Electrification metric
will be determined by the number of Central Hudson customers participating in NYSERDA geothermal
rebate program, receiving the Central Hudson Rate Impact Credit, or participation in Central Hudson’s
Carbon Reduction Program.
The annual electric EAM minimum, midpoint, and maximum targets associated with Energy Efficiency and
Environmentally Beneficial Electrification are shown in Table 27.
Table 27: Central Hudson EE and Environmentally Beneficial Electrification EAM Targets
EAM 2018 2019 2020 2021
Energy Efficiency (Gross MWh)
Min 53,262 53,262 53,262 53,262
Mid 63,658 63,658 63,658 63,658
Max 79,102 79,102 79,102 79,102
Residential Energy Intensity (MWh/Customer)
Min 7.68 7.60 7.52 7.44
Mid 7.59 7.51 7.44 7.36
Max 7.51 7.43 7.35 7.27
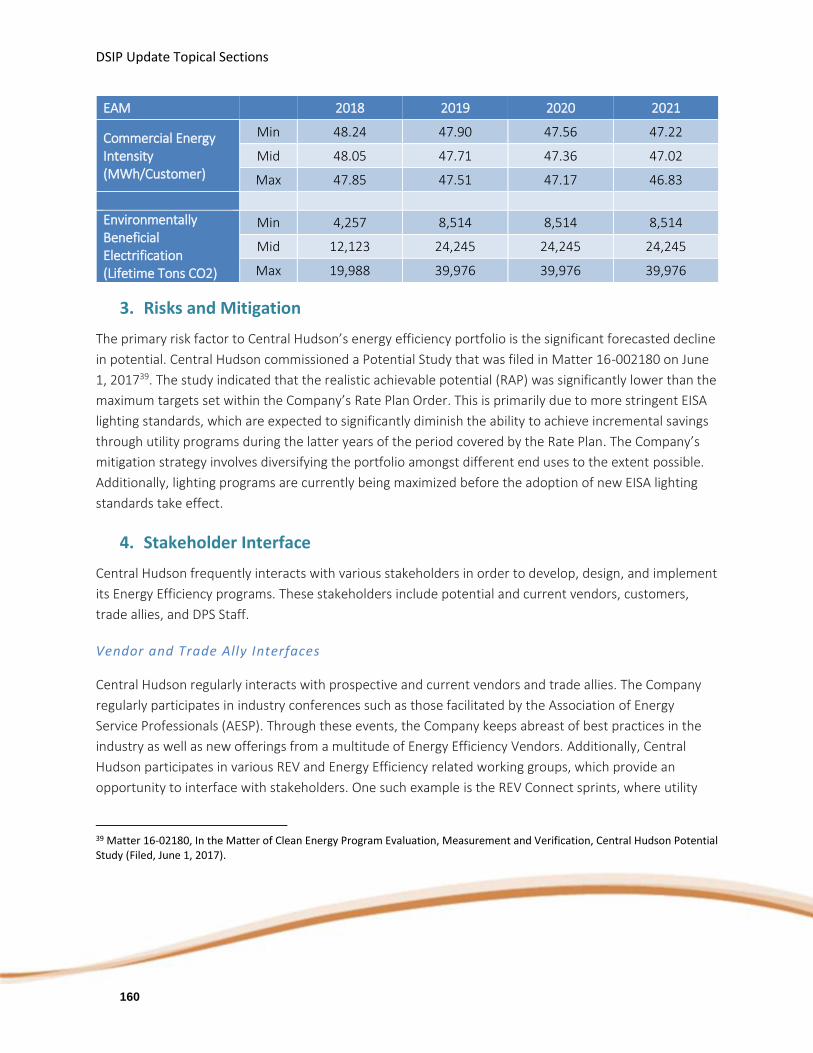
DSIP Update Topical Sections
160
EAM 2018 2019 2020 2021
Commercial Energy Intensity (MWh/Customer)
Min 48.24 47.90 47.56 47.22
Mid 48.05 47.71 47.36 47.02
Max 47.85 47.51 47.17 46.83
Environmentally Beneficial Electrification (Lifetime Tons CO2)
Min 4,257 8,514 8,514 8,514
Mid 12,123 24,245 24,245 24,245
Max 19,988 39,976 39,976 39,976
3. Risks and Mitigation
The primary risk factor to Central Hudson’s energy efficiency portfolio is the significant forecasted decline
in potential. Central Hudson commissioned a Potential Study that was filed in Matter 16-002180 on June
1, 201739. The study indicated that the realistic achievable potential (RAP) was significantly lower than the
maximum targets set within the Company’s Rate Plan Order. This is primarily due to more stringent EISA
lighting standards, which are expected to significantly diminish the ability to achieve incremental savings
through utility programs during the latter years of the period covered by the Rate Plan. The Company’s
mitigation strategy involves diversifying the portfolio amongst different end uses to the extent possible.
Additionally, lighting programs are currently being maximized before the adoption of new EISA lighting
standards take effect.
4. Stakeholder Interface
Central Hudson frequently interacts with various stakeholders in order to develop, design, and implement
its Energy Efficiency programs. These stakeholders include potential and current vendors, customers,
trade allies, and DPS Staff.
Vendor and Trade Ally Interfaces
Central Hudson regularly interacts with prospective and current vendors and trade allies. The Company
regularly participates in industry conferences such as those facilitated by the Association of Energy
Service Professionals (AESP). Through these events, the Company keeps abreast of best practices in the
industry as well as new offerings from a multitude of Energy Efficiency Vendors. Additionally, Central
Hudson participates in various REV and Energy Efficiency related working groups, which provide an
opportunity to interface with stakeholders. One such example is the REV Connect sprints, where utility
39 Matter 16-02180, In the Matter of Clean Energy Program Evaluation, Measurement and Verification, Central Hudson Potential Study (Filed, June 1, 2017).

DSIP Update Topical Sections
161
representatives are able to have in person meetings with various vendors and solution providers
throughout a one-day event.
Furthermore, when Central Hudson determines a service provider is needed, a request for proposal will
be sent out. The RFP contains detailed information about the Company and the services required. As part
of the RFP process, the Central Hudson allows responders to submit questions and discusses relevant
topics during at least one pre-bid meeting. Central Hudson’s EE staff are regularly solicited directly on a
“one-off” basis. In cases where the Company finds certain offers to be compelling, a product or service
demonstration will be held in order to better understand the vendor’s capabilities. Finally, Central
Hudson works with trade allies to implement various Energy Efficiency programs and has sponsored
various training events and feedback sessions.
Customer Interfaces
Central Hudson is continuously looking for ways to make the customer experience as easy and fluid as
possible. From the introduction of the CenHub customer engagement platform to the implementation of
each Energy Efficiency initiative, engagement, quality assurance, and cost to participate are the focus of
the customer experience design. As part of Central Hudson’s energy efficiency portfolio, studies and
focus groups have been conducted in order to gauge how customers feel about energy efficiency and
what is their motivation and willingness to participate in current programs.
Process evaluations ensure that a program or individual program offerings are operating as intended and
provide information that can enable improvements in both the program design and implementation.
Process evaluations assess customer understanding, attitudes about the program, satisfaction with the
program, individual offerings, and other educational activities.
5. Additional Detail
a) The resources and capabilities used for integrating energy efficiency within
system and utility business planning, including among other things, infrastructure
deferral opportunities as part of NWAs, peak and load reduction and/or load or
energy shaping with an explanation of how integration is supported by each of
those resources and capabilities, or other shared savings / benefits opportunities.
Central Hudson’s NWA solicitations are technology agnostic, and so energy efficiency may be utilized as
part of a solution if it’s determined to be a good fit for a particular project. Central Hudson is currently
considering EE in a variety of scenarios, however, EE is not currently deployed as a resource within a NWA
or other load shaping initiatives due to costs.

DSIP Update Topical Sections
162
System-wide load constraints are minimal for Central Hudson. The marginal avoided costs associated with
peak load reductions, as determined through a recent comprehensive study, are considered as a benefit
within EE initiatives, but they are not a significant driver of initiating projects.
b) The locations and amounts of current energy and peak load reductions
attributable to energy efficiency and how the utility determines these.
Central Hudson’s energy efficiency portfolio is designed to meet the targets set forth within the EET / ETIP
proceedings. The Commission has set new targets within the Joint Proposal.
For the majority of energy efficiency projects, the Company tracks the location of each participant and
can readily identify the overall impacts to the local system at circuit or substation level. Load reductions
are assessed using the applicable Technical Manual approaches.
Within the Company’s upstream and midstream delivery programs, aggregate participation data is
obtained, such as by vendor or local store, as opposed to individual end-user. Geographic distribution
estimates may be developed based on the available data.
c) How the utility develops and provides its short and long-term forecasts of
the locations, times, and amounts of future energy and peak load reductions
achievable through energy efficiency.
The impacts of energy efficiency are embedded in the historic demand data utilized to construct the peak
demand model. As a result, incremental impacts of future energy efficiency are developed and applied to
the base peak forecast. The reductions attributable to EE are developed by utilizing data available from
the NYISO’s Gold Book, specifically applying the historic trend of the ratio of Central Hudson’s peak to the
total of peaks for Zones E and G to the NYISO’s incremental EE reductions anticipated for Zones E and G.
d) How the utility assesses energy efficiency as a potential solution for
addressing needs in the electric system and reducing costs.
Central Hudson’s NWA solicitations are technology agnostic, and so energy efficiency may be utilized as
part of a solution if it’s determined to be a good fit for a particular project. Central Hudson is currently
considering EE in a variety of scenarios, however, EE is not currently deployed as a resource within a NWA
or other load shaping initiatives due to cost.
DSIP Update Topical Sections
163
e) How the utility collects, manages, and disseminates customer and system
data (including energy efficiency project and load profile data) that is useful for
planning, implementing, and managing energy efficiency solutions and achieving
energy efficiency potential.
Central Hudson collects its system load data and customer load data through its circuit metering or
customer revenue metering. The system load data is sanitized and provided through our System Data
Portal as historic hourly load data at the circuit level, aggregated to the substation level and to the
transmission area level. In addition, Central Hudson provides hourly system load forecasts for a five year
period.
Central Hudson uses the System Peak Load Data for distribution planning and capital forecasting. This
data can also be used to refine solutions for NWAs by providing load shapes and load duration curves.
Customer load data is used for sales and revenues forecasting, and it can be used to manage some of the
energy efficiency solutions but additional metering data and estimating methodologies are needed
beyond this data to manage our energy efficiency programs.
As for disseminating customer data, we have Green Button Download for customers and approved agents
for customers. Additional methods for dissemination of customer for public use are now being
developed.
f) How the utility’s accomplishments and plans are aligned with New York
State climate and energy policies and incorporate innovative approaches for
accelerating progress to ultimately align with a new 2025 energy efficiency target
called for in Governor Cuomo’s 2018 State of the State Address.
As discussed previously, within Central Hudson’s Rate Plan Order, EAMs were established including an
Energy Efficiency EAM. The Electric Energy Efficiency EAM is composed of three metrics of which one is
programmatic and two are outcome based. The metrics consist of: Electric Energy Efficiency
(programmatic), Residential Electric Energy Intensity (outcome based), and Commercial Electric Energy
Intensity (outcome based). Additionally, the Rate Plan Order established targets for the Environmentally
Beneficial Electrification EAM.

DSIP Update Topical Sections
164
g) A description of lessons learned to date from energy efficiency components
of REV Demonstration Projects with specific plans for scaled expansion of
successful business model demonstrations. In addition, provide a description of
each hypothesis being tested as part of energy efficiency components of ongoing
Demonstration Projects and the anticipated schedule for assessment.
Central Hudson’s CenHub demonstration project had a specific component that directly tested an energy
efficiency delivery mechanism: the CenHub Store. Applied Energy Group, Inc. (AEG) was retained by
Central Hudson to conduct a process evaluation of its CenHub Store. The CenHub Store Program provides
discounted energy efficient products to residential customers through an online platform. The CenHub
platform attempts to both educate customers about energy efficiency and to deliver energy saving
measures at attractive prices. Through the CenHub store, residential customers can receive discounts on
LED light bulbs, smart thermostats, advanced power strips, efficient showerheads, and efficient faucet
aerators. AEG designed the 2016-2017 process evaluation for this program to examine both internal
program processes and customer response to the program. The evaluation identifies the methods used
to gather data and to measure program results, and it also makes recommendations for program
improvements. The full Process Evaluation was filed on September 15, 2017, in Matter 16-02180.
Within the process evaluation, AEG found that the CenHub Store Program was performing well, surpassing
its participant and savings goals, while spending 71% of the budget. In 2016, 3,867 unique customer
accounts made purchases through the online store, yielding a total of 2,911 MWh of net electricity savings
attributed to the items sold. The process evaluation also detailed the following observations:
Email campaigns appear to be an effective marketing strategy for the store.
Discounted prices appear to be the biggest driver leading customers to the CenHub Store to
purchase LEDs.
Participants say they are very satisfied with the ease of purchase, the products, and the discounts.
The CenHub brand has a positive image and is trusted by participants.
Almost all participants say they are at least somewhat likely to make another purchase at the
CenHub Store.
Only 5% of participants say they would have bought the same products in the same quantity if the
store and the discounts had not been available.
Measures other than LEDs are not selling very well through the online store. Fewer than 20% of
purchasers include any measure other than an LED in their purchase.

DSIP Update Topical Sections
165
The CenHub Store platform has performed as a low cost delivery mechanism for energy efficiency rebates
on lighting, advanced power strips, thermostats, and water saving products. The Store has run at
approximately 10.5 to 11 cents per kilowatt hour each year and from 2016 to 2018. The CenHub
demonstration project timeline ran from April 1, 2016, to June 30, 2018. Per Central Hudson’s most
recent rate order, the CenHub platform will continue to exist and has transitioned to base rates.
h) Explain how the utilities are coordinating on energy efficiency to ensure
diversity of both the models demonstrated and the technologies/methods
employed in those applications
The Joint Utilities have actively coordinated their energy efficiency program design and implementation
since the May 2007 order instituting an Energy Efficiency Portfolio Standard (EEPS), and this coordination
continues today with formal and informal teams addressing all aspects of the Reforming the Energy Vision
and Clean Energy Fund Proceedings. As described in the New York Program Administrator Coordination
Report filed by the Joint Utilities and others in January 2017 as part of the Clean Energy Advisory Council
(CEAC) process, this coordination has occurred through many different processes and groups and has had
a wide range of foci and goals.40 This coordination continues today including in the evolution of the utility
energy efficiency programs from the Energy Efficiency Transition Implementation Plan (ETIP) framework
to the recently instituted System Energy Efficiency Plan (SEEP) framework. According to these framework
documents, over the next five-year DSIP planning period, each utility will integrate energy efficiency
planning into their forecasted system plans and evolve their ETIP into a SEEP that describes the entirety
of the utility’s expanded reliance on and use of cost effective energy efficiency to support their
distribution system and customer needs.41 As part of their continuing coordination efforts, the Joint
Utilities participate in a working group in which they share information regarding development and
testing of new energy efficiency programs and strategies. These coordination efforts address topics such
as distribution channel marketing, home energy reporting, online energy marketplaces, and smart home
rates. This coordination will inform current and future energy efficiency efforts as well as help the utilities
design a diverse portfolio of projects targeting a broad range of customers. These efforts include focus on
the development of and the outcomes from demonstration projects, to avoid duplicative efforts and
ensure the sharing of lessons learned from each utility demonstration project with all the Joint Utilities.
The Joint Utilities remain committed to continuing this coordination to further support the diversity of
40 16-01005, In the Matter of the CEAC’s Clean Energy Implementation & Coordination Working Group January 31, 2017), pp. 2-6.
41 CASE 15-M-0252 - In the Matter of Utility Energy Efficiency Programs, Order Authorizing Utility-Administered Energy Efficiency Portfolio Budgets And Targets For 2019 – 2020, (March 18, 2018), p. 29.

DSIP Update Topical Sections
166
energy efficiency programs across the state and to achieve the energy efficiency targets prescribed by the
State Energy Plan.
i) Describe how the utility is coordinating and partnering with NYSERDA’s
related ongoing statewide efforts to facilitate energy efficiency market
development and growth.
The Company maintains consistent coordination with NYSERDA to ensure complementary and non-
duplicative efforts and programs. This coordination is achieved through regular communication and
meetings between specific energy efficiency and demand management program managers and other
subject matter experts.
DSIP Update Topical Sections
167
G. Distribution System Data
1. Context and Background
Significant emphasis has been placed on the role of system data42 in facilitating market development and
greater DER adoption. The Initial DSIPs were largely intended to serve as a vehicle for collecting and
sharing information that facilitates retail market development, including data related to distribution
system planning and distribution grid operations. The Company’s Initial DSIP included extensive
discussion on current practices and presented several datasets identified by the Commission as essential
for improving the transparency of utility planning and operations and aiding market growth.
Since the filing of the Initial DSIP Central Hudson and the Joint Utilities, in conjunction with the feedback
received from various stakeholder sessions have made significant progress in the development of System
Data Portals for DER developers to gather valuable system data. In addition, the Joint Utilities have been
working together to develop a greater understanding of the system data needs and have been making
continuous improvements in the way this data is accessed.
2. Implementation Plan
a) Current Progress
Prior to the 2016 DSIP, there was only traditional availability and accessibility of system data to third-
party developers, there were no online portals dedicated to system data, the data available was often not
available in machine-readable formats, there was no generalized hosting capacity information, and there
was limited developer insight into areas with greater locational value.
Since the 2016 DSIP, Central Hudson and the Joint Utilities have made extensive progress in the
development of online machine-readable data and data portals with map visualizations. The data
available through Central Hudson’s website or through links on the Joint Utilities website include:
The 2016 DSIP and SDSIP Filing Documents;
Annually updated 5 year Capital Investment Plans as filed with the PSC;
Planned Resiliency / Reliability Projects as filed with the PSC;
Reliability Statistics at the circuit level as filed with the PSC;
42 System data is an expansive term that includes grid information such as load data, real and reactive power consumption, power quality, and reliability, as well as information on planned capital projects, beneficial locations, and hosting capacity, and other system characteristics.
DSIP Update Topical Sections
168
Hosting Capacity Maps for all circuits above 12 kV;
Beneficial Locations Maps;
Load Forecasts- 8760 hourly by substation and transmission area for 5 years;
Historical Load Data- 8760 hourly by circuit, substation, and transmission area;
NWA Opportunities (directs to separate JU-specific webpage) and Maps;
Queued and installed DG; and
SIR Pre Application Information.
The historic and forecasted load and DER data contained in this DSIP is an enhancement of the extensive
system data available through the Central Hudson’s online data portals, which are linked to the Joint
Utilities central data portal. This data provides greater transparency into locations on the distribution
system where DER integration may have higher value relative to other locations, greater insight into areas
with potentially lower interconnection costs, and greater visibility into system characteristics and needs.
Combined, these factors foster market development.
The Joint Utilities’ stakeholder engagement sessions in 2016 identified (1) the desire for and the broad
value of information and (2) how the utilities could work to enhance what information is provided. In
2017, the Joint Utilities enhanced their individual data portals and the Joint Utilities’ central data portal to
improve the accessibility and usefulness of this high-value information. Links to the utility-specific
websites with available system data can be found on the Joint Utilities of New York website shown in
Figure III-XXI (http://jointutilitiesofny.org/system-data/).
DSIP Update Topical Sections
169
Figure III-XXI: Overview of Currently Accessible System Data
To better understand how data is being used and what data is necessary to meet their needs, the Joint
Utilities and stakeholders co-developed multiple business use cases and identified the “need to have” and
“nice to have” data that enables each use case. In addition to increasing the amount of data that is
available, the Joint Utilities also worked with stakeholders to make it easier to access system data both
across the utilities and within individual utility data portals. The Joint Utilities System Data Working Group
continues to engage stakeholders on the business use cases for system data, identify additional datasets
to share, and respond to stakeholder requests to improve ease of access to system data.
b) Future Implementation and Planning
Central Hudson will continue to work with the Joint Utilities System Data Working Group on updates to
and the consistency of individual utility data portals, as well as refining and/or expanding system data use
cases to better meet stakeholder needs. Central Hudson and the JU will also continue engaging
stakeholders on business use case discussions, which will also continue to provide a forum for further
dialogue around improving access to more refined “information sets” developed through analysis/analytic
applications. This may offer more value to stakeholders when compared to directing business developers
to the basic data resources they need to derive the needed information on their own. As identified in
some use case discussions, some of this information may already exist or could be easily created without

DSIP Update Topical Sections
170
requiring additional effort and cost to the utilities and their customers. The Joint Utilities System Data
Working Group will continue to coordinate with stakeholders and the Joint Utilities Customer Data
Working Group to advance the definitions and implications of basic and value-added system data and
customer data.
3. Risks and Mitigation
Central Hudson continues to be responsive to developers through the stakeholder process in developing
an understanding of the System Data elements needed to enhance stakeholder ability to access and
utilize available system data. There are a number of risks related to the System Data function of the DSP
that must be recognized, including Critical Energy Infrastructure Information (CEII) data, customer
privacy, data refresh frequency, data accuracy, and the benefits and costs of providing data elements.
Central Hudson will continue to address the risks associated with CEII and customer privacy by applying
its policies and procedures to protect sensitive data.
Regarding the data refresh and accuracy, Central Hudson will continue to improve the processes used to
create the System Data. This will be accomplished through the continued investment in station and
distributed metering, internalizing the process of historical data cleansing and forecasting, and
refinements to Central Hudson’s planning processes to ensure accuracy.
Lastly, Central Hudson will continue to work with DER developers and stakeholders to ensure that the
effort made to develop this information and make it publically available is justified. Additionally, future
data elements will be fully vetted to ensure that they are needed, used, and are worth the effort to
develop and share.
4. Stakeholder Interface
Through the Joint Utility System Data Working Group, extensive stakeholder engagement has been used
to progress the understanding of and access to DSP System Data. Beginning in May 2017, the JU reached
out to selected stakeholders to invite participation in focused one-on-one discussions to better
understand stakeholders’ business use for utility system data. There were 15 targeted stakeholders calls
and 9 business uses cases developed.
In general, most stakeholders were not fully aware of available system data, nor had they used the utility
data portals to explore available system data. In many cases, the data that stakeholders said they
needed/wanted was already available. Across the use cases discussed, there were five data types
consistently mentioned:
1. Historical load data (feeder/circuit)
2. Forecasted load data (feeder/circuit)

DSIP Update Topical Sections
171
3. Customer demographics (type, load data, tariff)
4. Interconnection costs estimates
5. Reliability Statistics: SAIDI, SAIFI, CAIDI, Outage Cause (feeder/circuit)
Through the JU Stakeholder Interface process, we have developed a better understanding of the data
elements essential for the development of DERs and a better understanding of the potential additional
elements that developers might find useful if made available.
5. Additional Detail
a) Identify and characterize each system data requirement derived from
stakeholder input.
Table 28 identifies the data requirements derived from stakeholder input during the Joint Utility Use Case
discussions. Many of these data elements were already being provided by Central Hudson, but others are
not being provided or will not be made publically available. Other elements described in Table 28 are
considered Customer Data, but they came out during the stakeholder discussions as needed for various
forms of DER or market development or evaluation.
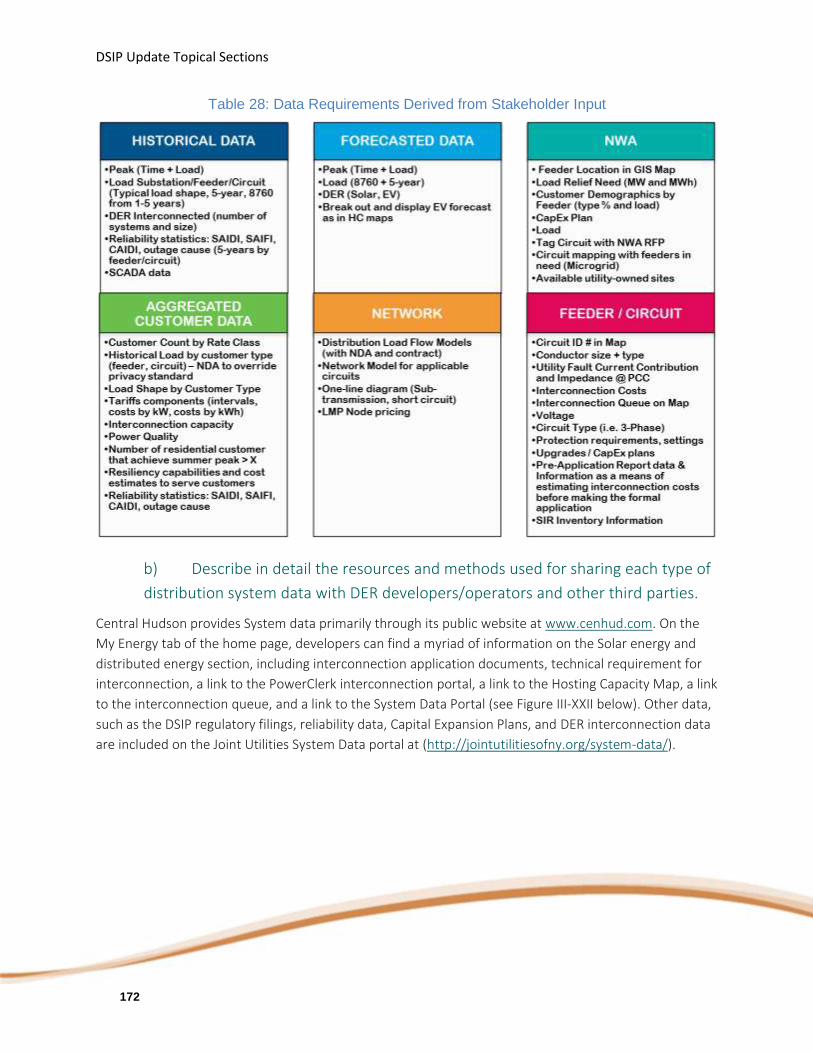
DSIP Update Topical Sections
172
Table 28: Data Requirements Derived from Stakeholder Input
b) Describe in detail the resources and methods used for sharing each type of
distribution system data with DER developers/operators and other third parties.
Central Hudson provides System data primarily through its public website at www.cenhud.com. On the
My Energy tab of the home page, developers can find a myriad of information on the Solar energy and
distributed energy section, including interconnection application documents, technical requirement for
interconnection, a link to the PowerClerk interconnection portal, a link to the Hosting Capacity Map, a link
to the interconnection queue, and a link to the System Data Portal (see Figure III-XXII below). Other data,
such as the DSIP regulatory filings, reliability data, Capital Expansion Plans, and DER interconnection data
are included on the Joint Utilities System Data portal at (http://jointutilitiesofny.org/system-data/).
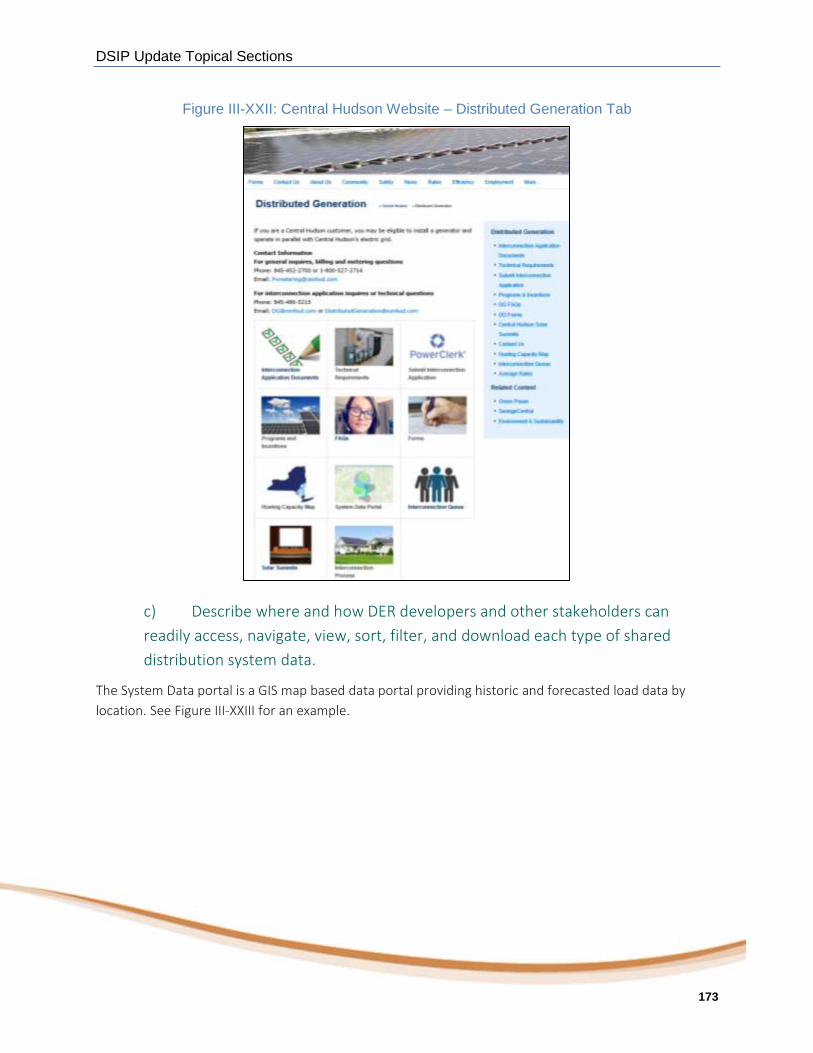
DSIP Update Topical Sections
173
Figure III-XXII: Central Hudson Website – Distributed Generation Tab
c) Describe where and how DER developers and other stakeholders can
readily access, navigate, view, sort, filter, and download each type of shared
distribution system data.
The System Data portal is a GIS map based data portal providing historic and forecasted load data by
location. See Figure III-XXIII for an example.
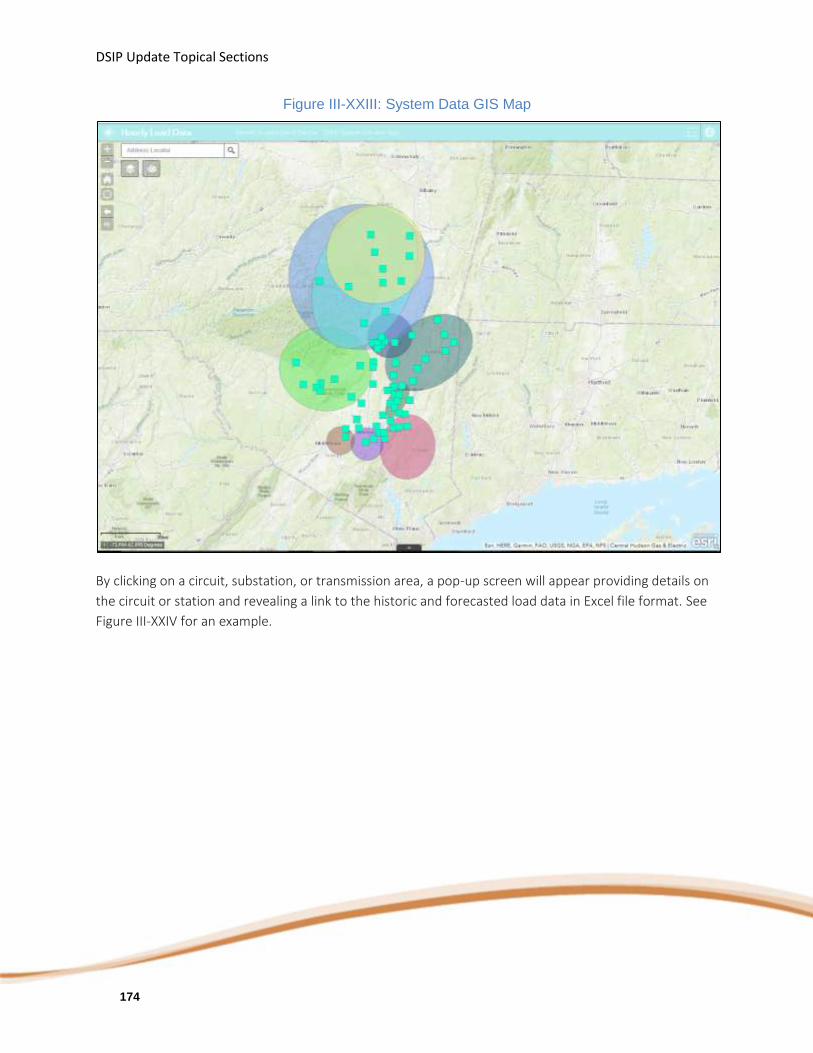
DSIP Update Topical Sections
174
Figure III-XXIII: System Data GIS Map
By clicking on a circuit, substation, or transmission area, a pop-up screen will appear providing details on
the circuit or station and revealing a link to the historic and forecasted load data in Excel file format. See
Figure III-XXIV for an example.

DSIP Update Topical Sections
175
Figure III-XXIV: Historic and Forecasted Load Example
d) Describe how and when each type of data provided to DER
developers/operators and other third parties will begin, increase, and improve as
work progresses.
The majority of the system data elements have been in place since the 2016 DSIP filings and the 2017
establishment of the Joint Utilities System Data portal. These data elements have been refreshed through
this DSIP Update, and Central Hudson will continue to work with the Joint Utilities to research new
potential data elements as well as best practices in how this data is shared, either through our own
System Data portals or through the Joint Utility portal.
e) Identify and characterize the use cases which involve third party access to
sensitive distribution system data and describe how the third party’s needs are
addressed in each case.
As previously mentioned, to better understand how data is being used and what data is necessary to
meet their needs, the Joint Utilities and stakeholders co-developed multiple business use cases and
identified the “need to have” and “nice to have” data that enables each use case. Table 29 identifies
several use cases identified through this process.

DSIP Update Topical Sections
176
Table 29: Use Case Data
Within these use cases, there were a few data elements described that were considered sensitive
distribution system data: distribution load flow models (including conductor size and type, utility fault
current contribution and impedance, and protection requirements and settings), network models for
applicable circuits, one-line diagrams (sub-transmission, short circuit), LMP node pricing, SCADA data, and
various elements of customer-specific data. Most of these data elements were considered “Nice to Have”
data elements. In these cases, the System Data elements would not be made publically available but
could be made available to developers through executed CEII-NDAs.
f) Identify each type of distribution system data which is/will be provided to
third parties and whether the utility plans to propose a fee.

DSIP Update Topical Sections
177
Table 30 provides a listing of the data currently provided by Central Hudson through its data portals or
through links.

DSIP Update Topical Sections
178
Table 30: System Data Currently Provided Without a Fee or Restriction
Data Type Data Available
Historic Data
Hourly Circuit Load – 7 Years
Hourly Substation Load – 7 Years
Hourly Transmission Area Load – 7 Years
Circuit Reliability – 5 years
Forecasted Data
Hourly Substation Load and DER – 5 Years
Hourly Transmission Area Load and DER – 5 Years
Peak System Load and DER – 10 Years
Annual System Energy – 10 Years
Circuit Data
Circuit ID and GIS location
Associated Substation
Voltage
Number of phases
Type (Overhead or Underground)
Hosting Capacity (Max and Min)
Substation Data
Substation Name/ID and GIS location
Associated Transmission Area
Hosting Capacity
DER Data Interconnected DER – size, type, location
DER in Queue – size, type, location
Capacity Data
Circuit Peak Capacity/Design Rating
Substation Peak Capacity/Design Rating
Transmission Area Peak Capacity/Design Rating
Circuit Hosting Capacity
Substation Hosting Capacity
Market Data Beneficial Locations
Non-Wire Alternative Areas
NWA Data
Feeder Location
Load Relief Needed (MW and year)
Customer Demographics
Capital Project Avoided
Regulatory DSIP Filings
Capital Expansion Plan

DSIP Update Topical Sections
179
Table 31 provides a listing of data elements request by stakeholders that we currently do not provide due
to Critical Energy Infrastructure Information (CEII) concerns, customer data privacy concerns, or
commercial sensitivity. This data could be provided under confidentiality provisions through an NDA.
Table 31: System Data Requested Not Currently Provided
Data Type Unavailable Data
Historic Data
SCADA Data
Nodal Reliability Data
Customer Reliability Data
Forecasted Data
Hourly Circuit Load and DER – 5 Years
Mapped DER Forecast
Hosting Capacity Forecast
Circuit Data
Conductor Size/Type
Circuit Source Impedance
Protection Devices/settings
Circuit Models
Power Quality Data
Substation Data Load Flow Models
One Line Diagrams
NWA Data Capital Project Avoided cost Estimate
As for the discussion regarding value added data, the following takeaways were derived from the Joint
Utility System Data Working Group stakeholder discussions:
There did not seem to be much interest in paying for more detailed data;
There was potential to improve the user experience and provide more analytics both as "basic"
and potentially more advanced as "value-added“; and
The concept of value-added data should be focused on more “processed” information rather
than including additional raw, granular data (e.g., downloadable data by feeder/substation).
g) Describe in detail the ways in which the utility’s means and methods for
sharing distribution system data with third parties are highly consistent with the
means and methods at the other utilities
As previously mentioned, the Joint Utilities’ stakeholder engagement sessions in 2016 identified (1) the
desire for and the broad value of information and (2) how the utilities could work to enhance what
information is provided. In response to stakeholder feedback, the Joint Utilities developed a central data
DSIP Update Topical Sections
180
portal on the Joint Utilities’ website in June 2017 with links to utility-specific web portals with available
system data. The Joint Utilities’ website43 includes utility-specific links to an expanded range of useful
information.
This new Joint Utilities web portal, in addition to hosting the links to the enhanced utility-specific web
portals, has increased access to and improved the usability of useful stakeholder-requested information.
The Joint Utilities have advanced their efforts to release additional data in more accessible formats and
stakeholders now have a better understanding of the data currently available through utility-specific web
portals. This data provides greater transparency into locations on the distribution system where DER
integration may have higher value relative to other locations, greater insight into areas with potentially
lower interconnection costs, and greater visibility into system characteristics and needs. Combined, these
factors foster market development.
Through the business use case work, and in response to stakeholder comments, the Joint Utilities are
evolving the system data effort to focus more on user experience, data presentation, and potentially
more analytic information presentation. The discussions around business use cases have identified the
volume of requested information that is already publicly available but may not have been easily
accessible and, as a result, the Joint Utilities have enhanced the accessibility and similarity of the
information provided, with the understanding that granularity may vary across utilities. In parallel, the
Joint Utilities have been able to delve further into the specificity of the information requested by
developers and the business reasons behind the requests. Subsequently, the Joint Utilities have made
progress in providing additional information that is of greater value to developers. The use case
discussions also provide a way to share with stakeholders why certain information may have a low
probability for being shared. For example, a piece of information requested may be embedded in utility
planning models and is perhaps not readily available for public presentment, requiring further discussion
around the need for the data and the potential to provide as a value-added service. Central Hudson has
not yet established a fixed definition for the fee structures for data requests, but any such effort would be
related to whether the data is readily available and the level of effort needed to package and deliver the
data. Information that is not readily available and requires additional utility effort to make available and
usable would be considered data provided at a fee.
The Joint Utilities System Data Working Group will continue focusing on updates to and consistency of
individual utility data portals, as well as refining and/or expanding system data use cases to better meet
stakeholder needs. The Joint Utilities will also continue engaging stakeholders on business use case
discussions, which will also continue to provide a forum for further dialogue around potential value-
added information by improving access to more refined “information sets” developed through
analysis/analytic applications. This may offer more value to stakeholders when compared to directing
43 https://jointutilitiesofny.org/system-data/

DSIP Update Topical Sections
181
business developers to the basic data resources they need to derive the needed information on their
own. As identified in some use case discussions, some of this information may already exist or could be
easily created without requiring additional effort and cost to the utilities and their customers.
h) Describe in detail the ways in which the utility’s means and methods for
sharing distribution system data with third parties are not highly consistent with
the means and methods at the other utilities. Explain the utility’s rationale for
each such case.
Central Hudson continues to work with the Joint Utilities to develop consistency in the System Data
online portals and the data being shared. As advances and enhancements are being made by the
individual utilities on the distribution system data being shared and the mechanisms to share this data,
these enhancements are being reviewed in the System Data Working Group so that each of the utilities
can benefit from them. There are currently some aspects of the distribution system data that are
inconsistent among the Joint Utilities in the way they are portrayed or shared, but these inconsistencies
are minimal.

DSIP Update Topical Sections
182
H. Customer Data
1. Context and Background
Central Hudson and the Joint Utilities have been actively exploring different ways to improve access to
aggregated and customer-specific data to support the development of new energy products and services,
while also protecting customers’ privacy. During the last two years, the Joint Utilities have continued to
evolve customer data sharing procedures, standards, and protocols and individually have taken steps to
expand data access.
Central Hudson understands the importance of customer data sharing to support the goal of market
development. Access to customer data is relevant to many stakeholders, such as customers, DER
providers/developers, and institutions. Providing customers with more granular and timely usage and
cost data empowers them to make better energy choices. For DER developers, access to customer-
specific or aggregated data can help them tailor their products and services, as well as better inform their
business prospecting. Finally, customer data can be relevant to local governments (i.e., cities,
municipalities), state agencies, and academic institutions to analyze impacts of policies and create action
plans.
As the Joint Utilities continue to advance customer data sharing mechanisms, they share the
Commission’s interest on strengthening privacy and cyber security to protect customers.44 The protection
of utility IT systems and customer information, including energy usage data and personal information
provided by the customer, is part of the utilities’ responsibilities and commitment to their customers.
The Joint Utilities have been working together and have achieved consensus on proposed state-wide
standards for aggregated45 and whole-building46 customer data sharing privacy standards to enhance
stakeholder access to data in a consistent approach, while still protecting customers’ privacy rights. For
example, aggregated customer usage data that does not pass the privacy standard is not shared without
customer consent, except where required or permitted by Commission order (such as with CCA47 or
44 Case 14-M-0101 Proceeding on Motion of the Commission in Regard to Reforming the Energy Vision, Staff Proposal Distributed System Implementation Plan Guidance (issued October 15, 2015), p. 21.
45 Cases 16-M-0411 et al., In the Matter of Distributed System Implementation Plans (“DSIP Proceeding”), Order on Distributed Implementation Plan Filings (issued March 9, 2017)(“DSIP Order”), p. 26.
46 Cases 16-M-0411 et al., In the Matter of Distributed System Implementation Plans (“DSIP Proceeding”), Joint Utilities’ Benchmarking Of Aggregated Customer Data Privacy And Proposed Privacy Standard For Building Energy Management (June 7, 2017)
47 For all CCA requests, the companies require all parties participating in the formation and operation of a CCA to complete the
Vendor Risk Assessment (VRA) and execute the Data Security Agreement (DSA). Once an Energy Services Company (ESCO) is

DSIP Update Topical Sections
183
energy efficiency programs, such as New York City’s Local Law 8448). As the companies improve their own
access to customer data through the implementation of new technologies (i.e., AMI), they will continue
to evolve data sharing mechanisms and standards that apply to customers and other stakeholders.
2. Implementation Plan
Prior to the Supplemental DSIP, the Joint Utilities did not have an organized forum to discuss customer
data topics on a regular basis, foster collaboration by sharing lessons learned, or to request ad hoc inputs
from stakeholders on specific topics to inform their individual data sharing approaches. The state of New
York had not put aggregated customer data privacy standards in place, and the Joint Utilities had limited
understanding of which data sets might be useful to stakeholders to develop and provide customers with
energy products and services.
In its initial DSIP, Central Hudson recognized the importance of the exchange of customer data between
entities participating in competitive energy markets and the critical aspect of this exchange in the
development of those markets. At the time, Central Hudson identified two broad uses of customer data
which are still relevant today:
1. Provision of regulated utility service – Central Hudson maintains a significant amount of customer
data in its customer information system (CIS), which is available to employees and vendors,
working in areas such as customer service and energy efficiency to help them provide high quality
reliable regulated utility service.
2. Third party availability, including Energy Service Companies (ESCOs) – Central Hudson provides
both individual customer data, with documented customer authorization, and aggregated
customer data to ESCOs, either individually or through a Community Choice Aggregation (CCA).
Individual customer data access methods were, and still are, largely dependent on the type of requestor:
Individual customer – Customers are able to access their data by telephone or through Central Hudson’s website.
Third Party – Individual customer data is available by telephone, through Central Hudson’s website utilizing a custom web transaction (Specific Account Usage Inquiry), or through electronic data interchange (EDI).
selected and has completed the VRA and DSA and is under contract with the CCA, the approved ESCOs may receive customer-
specific information.
48 NYC Admin Code, Title 28, Article 309 (commonly known as Local Law 84). Available at: http://www.nyc.gov/html/planyc2030/downloads/pdf/ll84of2009_benchmarking.pdf

DSIP Update Topical Sections
184
It should be noted that method-specific security measures are in place, such as the use of an account
number, or user name and password convention, before a customer or third party may gain access to
customer data. Additionally, an applicable third party requesting customer data is required to obtain
customer authorization and must maintain records of the authorization in compliance with the Uniform
Business Practices.
The customer data available to individual customers and third parties continues to be consistent with the
data the UBP requires Central Hudson to provide to a customer and/or ESCO, and includes, for gas and
electric service as applicable:
1. The customer’s service address;
2. An electric or gas account indicator;
3. The sales tax district used by the utility and whether the utility identifies the customer as tax
exempt;
4. The rate service class and subclass or rider by account and by meter, where applicable;
5. The electric load profile reference category or code, if not based on service class, Whether the
customer’s account is settled with the ISO utilizing an actual 'hourly' or a 'class shape'
methodology, or Installed Capacity tag, which indicates the customer’s peak electricity demand;
6. The number of meters and meter numbers;
7. Whether the customer receives any special delivery or commodity “first through the meter”
incentives, or incentives from the New York Power Authority;
8. The Standard Industrial Classification (SIC) code;
9. The usage type (e.g., kWh or therm), reporting period, and type of consumption (actual,
estimated, or billed);
10. Whether the customer’s commodity service is currently provided by the utility;
11. Twelve months (or the life of the account for accounts less than one year old) of customer data
via EDI if an ESCO, and, upon separate request, an additional twelve months (or the life of the
account) of customer data, and, where applicable, demand information. If the customer has
more than one meter associated with an account, the distribution utility shall provide the
applicable information, if available, for each meter;
12. Electronic interval data in summary form (billing determinants aggregated in the rating periods
under a distribution utility's tariffs);
DSIP Update Topical Sections
185
13. A weather normalized forecast of the customer’s gas consumption (for gas customers) for the
most recent twelve months (or life of the account), and the factors used to develop the forecast;
14. The meter reading date or cycle and reporting period;
15. The billing date or cycle and billing period;
16. The life support equipment indicator;
17. A gas pool indicator (for gas customers);
18. The gas capacity/assignment obligation code (for gas customers);
19. The customer’s location based marginal pricing zone (for electric customers);
20. A budget billing indicator;
21. Credit information for the most recent 24 months (or life of the account) including the number
of times a late payment charge was assessed and incidents of service disconnection; and
22. Usage data and estimated consumption for a period and, upon request, a class load profile for
the customer’s service class.
Central Hudson provides 24 months of data at no charge upon the request of customers, ESCOs, and
other applicable third parties. A customer or third party may request the same data twice within a 12‐
month period. There is a minimal charge of $15 per request for each additional request after the first two
requests during the current 12‐month period and for requests for information older than 24 months if it
is available. Additionally, a customer, ESCO, or other authorized third party can utilize the Specific
Account Usage Inquiry web transaction to view 24 months of individual customer usage data. This web
transaction is free of charge and can be utilized multiple times.
a) Current Progress
Since the Initial DSIP, the Joint Utilities have collaborated in the Customer Data Working Group to
advance several customer data efforts, including:
Submitting two joint filings on customer privacy standards and approaches;
Defining data sets and costs in support of Customer Choice Aggregation (CCA) efforts through
development and filing of CCA tariffs;
Evaluating potential opportunities for aggregated data automation; and
Engaging with stakeholders to solicit feedback and inform future customer data needs and
means of accessing that information.
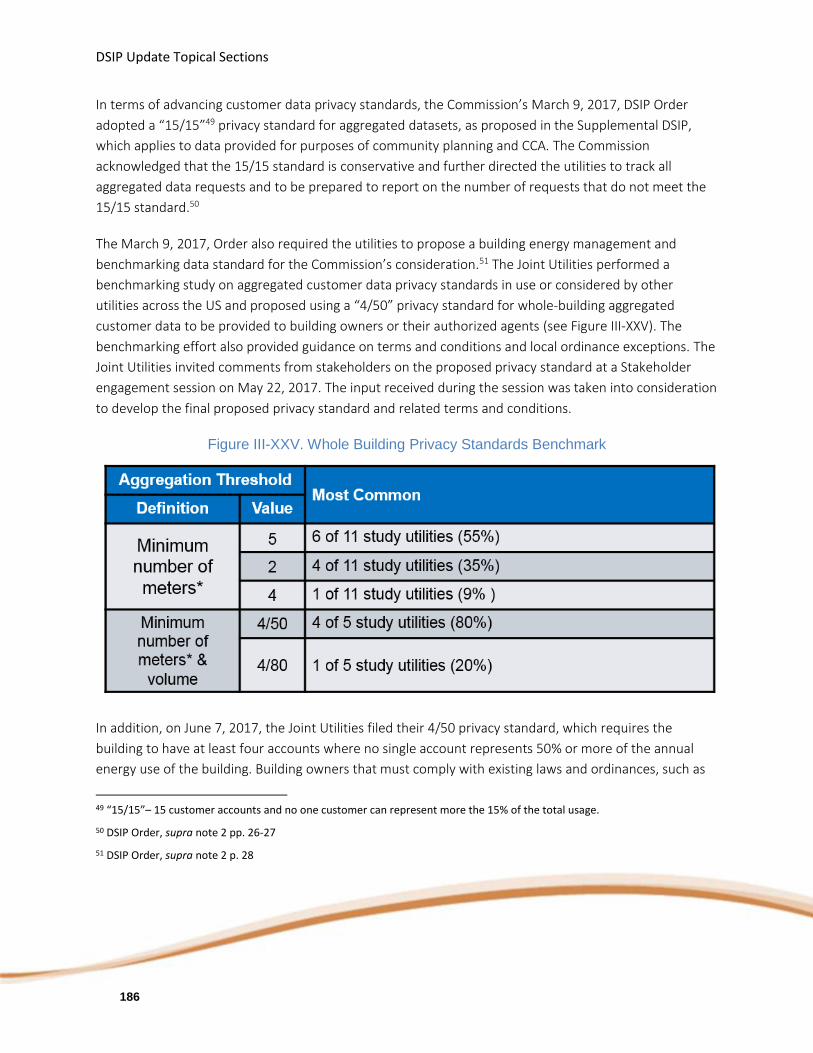
DSIP Update Topical Sections
186
In terms of advancing customer data privacy standards, the Commission’s March 9, 2017, DSIP Order
adopted a “15/15”49 privacy standard for aggregated datasets, as proposed in the Supplemental DSIP,
which applies to data provided for purposes of community planning and CCA. The Commission
acknowledged that the 15/15 standard is conservative and further directed the utilities to track all
aggregated data requests and to be prepared to report on the number of requests that do not meet the
15/15 standard.50
The March 9, 2017, Order also required the utilities to propose a building energy management and
benchmarking data standard for the Commission’s consideration.51 The Joint Utilities performed a
benchmarking study on aggregated customer data privacy standards in use or considered by other
utilities across the US and proposed using a “4/50” privacy standard for whole-building aggregated
customer data to be provided to building owners or their authorized agents (see Figure III-XXV). The
benchmarking effort also provided guidance on terms and conditions and local ordinance exceptions. The
Joint Utilities invited comments from stakeholders on the proposed privacy standard at a Stakeholder
engagement session on May 22, 2017. The input received during the session was taken into consideration
to develop the final proposed privacy standard and related terms and conditions.
Figure III-XXV. Whole Building Privacy Standards Benchmark
In addition, on June 7, 2017, the Joint Utilities filed their 4/50 privacy standard, which requires the
building to have at least four accounts where no single account represents 50% or more of the annual
energy use of the building. Building owners that must comply with existing laws and ordinances, such as
49 “15/15”– 15 customer accounts and no one customer can represent more the 15% of the total usage.
50 DSIP Order, supra note 2 pp. 26-27
51 DSIP Order, supra note 2 p. 28
DSIP Update Topical Sections
187
Local Law 84 in New York City, are exempt from the privacy standard. On December 15, 2017, the
Commission issued a notice requesting additional comments on the NYSERDA Utility Energy Registry
(UER) initiative.52 The Commission requested input on the appropriate balance for the aggregated data
privacy standard, Staff’s proposed data elements, and the additional data elements stakeholders
proposed. The Joint Utilities filed comments on February 26, 2018, and reply comments on March 9,
2018.
On April 20, 2018, the Commission issued its Order in Cases 17-M-0315, 16-M-0411 and 14-M-0224
adopting the UER and maintained a 15/15 privacy standard for residential customer data and a 6/40
privacy standard for small commercial customer data. If a dataset fails the privacy screen the Commission
adopted a methodology to roll the data into other datasets to protect privacy.
The Commission directed the utilities to prepare data sets across their service territories in three layers
including zip code, incorporated municipality and county. Data to be reported included total customer
count, and CCA ineligible customer count (including count of customers served by an ESCO or with a block
on their account and count of TOU customers but not APP count due to the sensitivity of that
information).
The companies created an internal inventory of actual aggregated customer data requests to understand
the volume and types of standard aggregations requested by stakeholders and opportunities to
potentially automate the request and delivery of these aggregated data reports. From this exercise, the
companies determined that none of them had experienced substantial volumes for aggregated customer
data; thus, the companies have postponed further discussion or evaluation of automating processes until
there is a clearer need.
The Joint Utilities have been proactively engaging with stakeholders to share their proposals for
aggregated customer data privacy standards and progress in improving the type of data and the process
for accessing customer-specific data with proper customer authorization. In addition, the Customer Data
Working Group hosted one-on-one conversations with DER developers to better understand their data
needs, share current practices, and inform their future data sharing plans.
52 The NYPSC Notice Initiating Matter and Seeking Comment on Utility Energy Registry (June 12, 2017) fined the UER as “an online platform intended to offer streamlined public access to community-scale utility energy demographics. The UER is designed to collect aggregated data for electricity and natural gas, segmented by customer type and by zip code, in order to inform clean energy planning, implementation, and assessment of locally-defined, community-scale clean energy initiatives and to facilitate tracking of clean energy programs.”
DSIP Update Topical Sections
188
b) Future Implementation and Planning
The Joint Utilities will continue to engage stakeholders to identify and evaluate additional customer data
datasets and process improvements that can support greater customer choice, DER market development,
and the broader REV objectives. The Joint Utilities have a stakeholder engagement session planned for
2018 to provide updates on customer data sharing procedures. Central Hudson will also continue to
evaluate the potential for additional customer data beyond Green Button Download My Data. In addition,
the Customer Data Working Group will continue to monitor other relevant proceedings such as the
privacy standards proceeding, the UER, the Value Stack proceeding and coordinate with other groups,
such as the DER Sourcing Working Group and System Data Working Group.
3. Risks and Mitigation
The Joint Utilities continue to discuss with stakeholders, including customers, ESCOs, EDI Providers, Direct
Customers and DER Suppliers cyber security standards. The continued development of competitive
markets pursuant to REV increases the electronic communications between utilities and competitive
providers, and therefore, cyber security risks. With the support of the Commission as enunciated in Case
18-M-0376, business to business discussions are underway to refine and implement current standards
through DSAs under the authority of the UBP and DER UBP.
Risk mitigation will take the form of information technology security standards required of all parties,
confidential data protection standards, contractual liability protection and cyber insurance. For a more
comprehensive discussion of cyber security see the cyber security section of this report.
4. Stakeholder Interface
In 2017, Central Hudson continued to work with the Joint Utility Customer Data working group to
welcome stakeholder feedback on key priorities and develop the 2018 customer data working group work
plan. The group continued to reach out to additional interested stakeholders to co-develop business use
cases for customer data to develop a deeper understanding of the need and use for various types of
customer data, including public availability, private availability, and possible value-added data elements.
The working group will consider the use of periodic stakeholder sessions in 2018 as use-case data is
developed and updated or customer data issues arise. Additionally, Central Hudson will continue to work
with stakeholders through the Customer Data Working Group or through the ongoing customer data
related proceedings such as the privacy standards, the Utility Energy Registry (UER), the Value Stack.

DSIP Update Topical Sections
189
5. Additional Detail
a) Date Types, Description and Management Processes
(1) Describe the type(s) of customer load and supply data acquired by the utility.
(2) Describe the accuracy, granularity, latency, content, and format for each type of data
acquired.
(3) Describe in detail the utility’s means and methods for creating, collecting, managing, and
securing each type of data.
Central Hudson acquires customer load (use) and supply injection data by capturing information that is
measured and recorded by the customer meter(s). These can be interval, AMI, and/or register-read
meters. There are differences in the type and granularity of the customer load and supply data acquired
based on customer type, existing metering, and the extent AMI has been adopted by the customers.
Generally commercial and industrial customers will have additional data such as demand (kW) and
reactive power (VAR) data for billing under the applicable tariff. As Central Hudson implements new
technologies such as AMI, more granular (interval) data will be available and data sharing mechanisms
and standards will evolve as appropriate.
b) Data Uses, Access and Security
(1) Describe the means and methods that customers and their properly designated agents can
use to acquire their load and supply data directly from their utility meters without going
through the utility, should they want to.
(2) Identify and characterize the categories of legitimate users beyond customers and their
properly designated agents who will be provided access to each type of data.
(3) For each type of data, describe how its respective users will productively apply the data
and explain why the data provided will be sufficient to fully support each type of application.
Central Hudson through the Joint Utilities has been proactively engaging with stakeholders to review
proposal for providing aggregated customer data consistent with customer privacy standards and
improve the type of data and the process for accessing customer-specific data with proper customer
authorization. In addition, the Joint Utilities are actively conducting one-on-one conversations with DER
developers to better understand their specific customer usage data needs, share current practices, and
inform their future data sharing plans. Through the targeted conversations, Central Hudson understands
the underlying basis for the requests and stakeholders gain better insight into the information currently
available and how to access it.

DSIP Update Topical Sections
190
Through collaboration with staff and stakeholders, the Joint Utilities are finalizing development on sharing
aggregated data for whole buildings and through the Utility Energy Registry, at the municipal level. These
new offerings will allow building owners to better manage and benchmark their building energy usage.
Additionally, they will allow communities to make informed decisions on community-based Distributed
Generation Projects, Energy Choice Aggregation programs, and Energy Efficiency initiatives.
(4) For each type of data, describe in detail the utility’s policies, means, and methods for
securely providing legitimate users with efficient, timely, and useful access to the data. Include
information which thoroughly describes and explains the utility’s approach to providing
customer data to third parties who would use the data to identify and design service
opportunities which benefit the utility and/or its customers.
(5) Describe how the utilities are jointly developing and implementing uniform policies,
protocols, and resources for controlling third party access to customer data.
The Joint Utilities are actively working through numerous processes to develop and implement uniform
policies and approaches in response to the Commission and stakeholder requests through the use case
conversations with DER developers. Since the Initial DSIP, the Joint Utilities have collaborated in the
Customer Data Working Group to advance several customer data efforts, including:
Submitting two joint filings on customer privacy standards and approaches;
Defining data sets and costs in support of Customer Choice Aggregation (CCA) efforts through
development and filing of CCA tariffs;
Working with DPS Staff and NYSERDA on UER and appropriate privacy standards;
Developing DER Uniform Business Practices (UBP);
Evaluating potential opportunities for aggregated data automation and developing whole-
building owner aggregated data access and privacy standards; and
Engaging with stakeholders to solicit feedback and inform future customer data needs and
means of accessing that information.
Currently, there are a number of channels that share customer data with customers and their authorized
third parties. These include utility bills, GBD, EDI, UER, SFTP, File Transfer Protocol with PGP Encryption,
online third-party data platforms, and the data identified in UBP for DERs.
DSIP Update Topical Sections
191
(6) Describe in detail the utility’s policies, means, and methods for rigorously anticipating data
risks and preventing loss, theft, or corruption of customer data.
(7) Identify each type of customer data which is/will be provided to third parties at no cost to
the recipient, and the extent to which the practice comports with DPS policies in place at the
time, as appropriate.
(8) Identify each type of customer data which the utility proposes to provide to third parties
for a fee, and the extent to which the practice comports with DPS policies in place at the time,
as appropriate. For each data type identified, describe the proposed fee structure and explain
the utility’s rationale for charging a fee to the recipient.
(9) Describe in detail the ways in which the utility’s means and methods for sharing customer
data with third parties are highly consistent with the means and methods at the other utilities,
and the extent to which these practices comport with DPS policies in place at the time, as
appropriate.
The Joint Utilities are working together to develop a statewide standard in phases, with the
understanding that utilities will have different starting points. Utilities implementing full AMI solutions
plan to provide basic customer usage data to customers via online platforms and to customer-authorized
third parties using the GBC standard or a comparable specification. Utilities not implementing full AMI
solutions expect to provide basic customer usage data to end-users via GBD or an alternative
specification. The Joint Utilities will continue to leverage existing platforms, including GBC, EDI, SFTP, and
online customer engagement platforms.
(10) Describe in detail the ways in which the utility’s means and methods for sharing customer
data with third parties are not highly consistent with the means and methods at the other
utilities. Explain the utility’s rationale for each such case.
Central Hudson access to customer data is primarily consistent with other utilities other than Central
Hudson does not yet offer Green Button Connect but does offer Green Button Download My Data. This
functionality is available through CenHub. The features of Green Button Connect are generally preferred
in instances where data from AMI meters is available to the majority or all of a Utility’s residential
customers. At this time Central Hudson does not have plans to deploy AMI meters on a system-wide
basis. Until there is greater demand for Green Button Connect or a system-wide deployment of AMI
meters is implemented we do not see Green Button Connect as a prudent investment.

DSIP Update Topical Sections
192
c) Green Button Connect Capabilities
(1) Describe where and how DER developers, customers, and other stakeholders can readily
access up-to-date information about the areas where customer consumption data provided via
Green Button Connect (GBC) is available or planned.
Central Hudson does not yet offer Green Button Connect but does offer Green Button Download My
Data. This functionality is available through CenHub.
(2) Describe how the utility is making customers and third parties aware of its GBC resources
and capabilities.
Central Hudson actively markets its customer data functionality and other features through its one stop
customer interface CenHub.
(3) Describe the utility’s policies, means, and methods for measuring and evaluating customer
and third-party utilization of its GBC capabilities.
There are currently a very limited number of Green Button applications available via the Google Play
Store and Apple’s App Store. The applications available offer some of the functionality already available
through CenHub. Central Hudson does not yet offer Green Button Connect. Significant investment is
required by Central Hudson and website host partners in order to enable Green Button Connect
functionality and we have not received any requests from customers to enable Green Button Connect.
We have been monitoring the use of the Green Button Download My Data feature over the life of
CenHub and it is extremely limited. Additionally, the features of Green Button Connect are generally
preferred in instances where data from AMI meters is available to the majority or all of a Utility’s
residential customers. At this time Central Hudson does not have plans to deploy AMI meters on a
system-wide basis. Until there is greater demand for Green Button Connect or a system-wide deployment
of AMI meters is implemented we do not see Green Button Connect as a prudent investment.

DSIP Update Topical Sections
193
I. Cyber Security
1. Context and Background
Cybersecurity and the prevention of security breaches and cyber events is an essential responsibility and
priority of the Joint Utilities. The Supplemental DSIP outlined a common and comprehensive approach to
managing cybersecurity risks in the evolving REV environment. The Joint Utilities Cyber and Privacy
Framework focuses on people, processes, and technology to maintain data security. The Framework
requires the implementation of an industry-approved risk management methodology and an alignment of
control implementations with the control families in the National Institute of Standards and Technology
(“NIST”) Special Publication (SP) 800-53 revision 4. The Joint Utilities periodically assess the need for
updates to the Framework. The current version, as filed in the Supplemental DSIP, remains relevant with
no updates required.
In the Supplemental DSIP, the Joint Utilities are committed to maintain individual cyber and privacy
management program and participate in industry working groups, including the New York State Security
Working Group (NYS SWG). The Joint Utilities also agreed to share lessons learned and advancements in
security technology among themselves. The Joint Utilities continue to meet to discuss multiple security
topics, lessons learned, current threats, and future regional exercises.
Central Hudson’s Cyber Security Working Group (“CSWG”) continues to serve as a governance committee
that oversees the enterprise wide cyber security program. The program consists of a strategic plan,
policies and procedures, security controls, risk management program, security awareness program,
incident response, third-party security and privacy reviews, security assessments, administering and
monitoring security tools, and addressing and resolving security alerts. There are four groups that work
closely together to protect Central Hudson’s information assets, which consists of customer information,
utility information, critical infrastructure information and information technology systems. They are:
Cyber Security, Corporate Security, IT Technical Support and Operational Technology.
2. Implementation Plan
a) Current Progress
Central Hudson continues to assess its cyber security program for further enhancements. In additional to
regularly scheduled security assessments, Central Hudson conducted an assessment in October 2017
based off of the Energy Sector Cybersecurity Capability Maturity Model (C2M2), which was mapped to
the NIST Cybersecurity Framework. Central Hudson will be growing its Cyber Security group by an
additional headcount in 2018 and has already posted for this position.

DSIP Update Topical Sections
194
Since the original DSIP filing in 2016, Central Hudson has formed the Operational Technology division of
Engineering. This group is responsible for the DMS, EMS and internal communications network and cyber
security requirements of any external connections to those systems. As part of this, a set of internal
standards for the Cyber Security of Operational Technology (CSOT) have been formed and are in the
process of being implemented enterprise wide.
b) Future Implementation and Planning
Central Hudson is continuing to implement identified cyber security initiatives and review its privacy
initiatives for opportunities to enhance the cyber security initiatives identified in the 2016 DSIP filing. The
System Information and Event Management (SIEM) solution has been included in Central Hudson’s long
term strategic plan and is slated to be purchased and implemented in 2021. The second cyber security
analyst position will be posted in 2019.
As DSIP initiatives continue to be planned and designed and DER providers look to connect to Central
Hudson’s grid, cyber security requirements will be incorporated into the contractual language and riders
before connection to CH resources.
3. Risks and Mitigation
The main risks pertaining to DSIP initiatives are:
Unauthorized access to confidential customer or utility data;
Unauthorized disclosure of confidential customer or utility data;
Unavailability of critical or significant systems; and
Unavailability to perform a business service.
Central Hudson has assessed these risks in its environment and has controls in place to properly mitigate
them. As part of the planning and design phase of a DSIP initiative, additional risks may be identified. The
Central Hudson cyber security team will assess these risks and implement appropriate controls to
properly mitigate those risks regardless of who is responsible for the controls – Central Hudson or a third
party.
4. Stakeholder Interface
As stakeholders propose new or existing DERs that will interface with our internal communication
network and assets required for monitoring and control capabilities, cost-sharing proposals will be
provided for communication needs and stakeholders will be provided with preliminary Cyber Security
requirements subject to alteration and finalization as additional details of planning and design are

DSIP Update Topical Sections
195
completed, based on risk to data and grid operations. Cyber security requirements will be revised as
required by legal, regulatory, and technical advancements.
5. Additional Detail
a) Describe in detail the utility policies, procedures, and assets that address
the security, resilience, and recoverability of data stored and processes running in
interacting systems and devices which are owned and operated by third-parties
(NYISO, DER operators, customers, and neighboring utilities). Details provided
should include:
The Joint Utilities (JU) have created a framework (JU Framework) to guide New York Utilities as they
develop their own governance and risk management process to address cyber security and privacy risks
that may arise from any REV related initiative. Central Hudson continues to leverage that framework to
enhance its current cyber security and privacy programs. Minimum requirement guidelines are outlined
below; additional requirements will be addressed during planning and design to effectively address
Central Hudson’s specific cyber security concerns based on the design submitted by the third party.
(1) the required third-party implementation of applicable technology standards;
Third parties will be required to have appropriate controls in place, based on industry recognized best
practice, to protect customer and utility information, grid operations, operational and information
technology systems. Some examples of industry recognized best practices are the Energy Sector’s
Cybersecurity Capability Maturity Model (C2M2), NIST Special Publications or Cyber Security Framework,
International Organization for Standardization (ISO) 27001, Control Objectives for Information and
Related Technologies (COBIT), NERC Critical Infrastructure Protection (CIP), Central Hudson’s Cyber
Security of Operational Technology and the JU’s own Cyber Security Framework.
(2) the required third-party implementation of applicable procedural controls;
Third parties will be required to have appropriate controls in place, based off of anon industry recognized
best practices, to protect customer and utility information, and grid operations and information
technology systems. Some examples of industry recognized are the Energy Sector’s C2M2, NIST Special
Publications or Cyber Security Framework, ISO 27001, COBIT or the JU’s own Cyber Security Framework.
(3) the means and methods for verifying, documenting, and reporting third-party compliance
with utility policies and procedures;
The third party must provide formal attestations, evidence, and allow for annual compliance audits.
Central Hudson will review compliance for representative third parties.

DSIP Update Topical Sections
196
(4) the means and methods for identifying, characterizing, monitoring, reporting, and
mitigating applicable risks;
The third party must have a documented risk identification and mitigation program that is assessed on at
least an annual basis.
(5) the means and methods for testing, documenting, and reporting the effectiveness of
implemented security measures;
The third party must complete scheduled assessments of implemented security measures or provide
Central Hudson with an independent third-party audit report, such as SOC II or its equivalent, assessing
the security measures.
(6) the means and methods for detecting, isolating, eliminating, documenting, and reporting
security incidents; and,
The third party must have a documented Cyber Security Incident Response Plan. Central Hudson requires
notification within 24 hours after a third party discovers a potential cyber security incident so that Central
Hudson is alerted when there may be a harmful impact to Confidential Customer or Utility Information,
grid operations, OT or IT systems.
(7) the means and methods for managing utility and third-party changes affecting security
measures for third-party interactions.
The third party must have a documented change management process that includes notifying Central
Hudson of any changes that occur within a reasonable timeframe. For changes that will have a critical or
significant impact to the operation of systems, the third party must notify Central Hudson prior to making
the change so that Central Hudson may assess the risk associated with the change.
b) Describe in detail the security, resilience, and recoverability measures
applied to each utility cyber resource which:
(1) contains customer data;
(2) contains utility system data; and/or,
Central Hudson has a Cybersecurity Policy, Cybersecurity Incident Response Plan and a Disaster Recovery
Plan. The Incident Response and Disaster Recovery plans are tested annually. These plans are consistent
with good utility practice and industry standards to minimize the risk cyber events and confirm the ability
to recover from an event. Central Hudson has primary and backup EMS and DMS, redundancy in the
communication network, and primary and backup power supplies.
DSIP Update Topical Sections
197
(3) performs one or more functions supporting safe and reliable grid operations.
Central Hudson has security, resiliency and recoverability measures as required by the North American
Electric Reliability Corporation Critical Infrastructure Protection plan (NERC CIP). Additionally, for non-
NERC CIP assets that may contain functions supporting safe and reliable grid operations below the
threshold of applicability to the Bulk Electric System (BES), Central Hudson has established Cyber Security
of Operational Technology (CSOT) Standards. The processes and procedures for these standards are in
progress by designated Subject Matter Experts.
c) For each significant utility cyber process supporting safe and reliable grid
operations:
(1) Provide and explain the resilience policy which establishes the utility’s criteria for the
extent of resource loss, damage, or destruction that can be absorbed before the process is
disrupted;
Central Hudson has procedures in place that serve to mitigate the impact of a resource loss or the
damage or destruction of a critical asset. Central Hudson has security controls and tools in place to
monitor and alert on the systems utilized in grid operations. The alerts will be reviewed by Central
Hudson analysts and addressed as needed. Depending on the severity of the alert, Central Hudson may
activate its Incident Response Plan to minimize the potential impact on grid operations. If a situation
warrants the shutdown of a critical asset at the primary location, Central Hudson has a Disaster Recovery
Plan to restore the system at a secondary location.
(2) Provide and explain the recovery time objective which establishes the utility’s criteria for
the maximum acceptable amount of time needed to restore the process to its normal state;
Central Hudson has recovery time objectives defined in its Disaster Recovery Plans for critical assets. The
recovery time objectives are determined based on the impact downtime will have on Central Hudson’s
operations.
(3) Provide and explain the plan for timely recovery of the process following a disruption; and,
Central Hudson’s Disaster Recovery Plans were developed to provide for timely recovery of critical assets.
While an asset is down, Central Hudson has Business Continuity Plans to allow for continuity of business
operations.

DSIP Update Topical Sections
198
(4) Describe each process, resource, and standard used to develop, implement, test,
document, and maintain the plan for timely process data recovery.
Central Hudson’s Incident Response, Disaster Recovery, and Business Continuity Plans are reviewed on an
annual basis and updated as needed. These plans are tested on an annual basis and any lessons learned
are incorporated into the plans.
d) Identify and characterize the types of cyber protection needed for strongly
securing the utility’s advanced metering resources and capabilities. Describe in
detail the means and methods employed to provide the required protection.
Central Hudson is conducting a demo project for advanced metering. This project’s resources were
assessed for security compliance. These resources are not planned to directly interface with any Central
Hudson assets and will continue as a data sharing project only.
e) Identify and characterize the requirements for timely restoring advanced
metering resources and capabilities following a cyber disruption. Describe in detail
the means and methods employed to provide the required recovery capabilities.
Central Hudson has incorporated contractual terms with the third party which address cyber disruptions
and ensure availability of resources.

DSIP Update Topical Sections
199
J. DER Interconnections
1. Context and Background
Since the Initial DSIP filing, Central Hudson has continued to process interconnection applications within
the required timelines specified in the New York State Standardized Interconnection Requirements
(NYSSIR). Figure III-XXVI shows the cumulative growth in MWs for distributed energy resources (DERs)
installed from 2013 to 2017. The majority of DER applications within Central Hudson’s territory are solar
photovoltaic (PV). In 2017, of the total MWs installed, approximately 96% were solar PV.
Figure III-XXVI: DER MWs Installed 2013-2017
As briefly described in the Initial DSIP, 2015 and 2016 saw the bulk of the large applications (nameplate
ratings > 300kW) submitted due to the launch of the Community Distributed Generation program in New
York State. This resulted in Central Hudson’s interconnection queue peaking at 774 MW in February 2017.
As a result, 2016 and 2017 saw an increase in the number of impact studies performed for larger
applications due to the PSC’s Order Adopting Interconnection Management Plan53 (Queue Management
Order) which required applicants to either move forward with the next step in the NYSSIR process or
withdraw their application. This required many applications to commence Coordinated Electric System
Interconnection Reviews (CESIR) simultaneously. To manage the workload associated with these impact
53 Case 16-E-0560, Joint Petition for Modifications to the New York State Standardized Interconnection Requirements and Application Process For New Distributed Generators 5 MW or Less Connected in Parallel with Utility Distribution Systems, Order Adopting Interconnection Management Plan and Cost Allocation Mechanism, And Making Other Findings, (issued January 25, 2017), pp.4-9, 22-28.

DSIP Update Topical Sections
200
studies, Central Hudson continued to utilize two external consultants to assist with performing CESIRs and
also hired a new full-time Junior Engineer in June 2016.
Also since the Initial DSIP filing, Central Hudson implemented a new Interconnection Online Application
Portal (IOAP) described further in Section III.J.5. This portal was established to meet the requirements of
Phase 1 Automating Application Management within the PSC’s March 9, 2017 DSIP Order54 (DSIP Order).
Phase 1 was achieved by implementing Clean Power Research’s PowerClerk software, which went live on
September 26, 2017. The IOAP is currently successfully running and allowing DER developers to submit
interconnection applications electronically. To meet the DSIP Order’s implementation timeline of an in-
service date of October 1, 2017, Central Hudson hired an additional external contractor in 2017 to focus
on processing interconnections to enable a full-time employee to lead the implementation of the IOAP.
In addition to performing the day-to-day responsibilities associated with interconnections, Central
Hudson has also had a leadership role in collaborative working groups including the Interconnection
Technical Working Group (ITWG) and Interconnection Policy Working Group (IPWG). Since the Initial DSIP
filing, these groups have met on a bi-monthly and monthly basis, respectively, with a focus on modifying
interconnections requirements and processes based on industry concerns and benchmarking with other
utilities outside of NY. These groups have also worked together to develop various joint guidelines and
regulatory filings and have allowed for modifications to existing interconnection requirements including:
Establishing an alternative method to direct-transfer trip through the use of reclose block in order
to reduce interconnection upgrade costs;
Establishing new monitoring and control requirements that provide the utility with more insight
into the operation of DG systems without economically burdening the DER installation;
Submitting a joint petition to manage the queue that resulted in the Queue Management Order;
Improving processes for construction timelines, including standardizing reporting for construction
schedules;
Evaluating appropriate screens for updating the NYSSIR, including flicker impacts;
Establishing requirements and processes for energy storage systems to be integrated within the
NYSSIR;
Developing requirements of energy storage system applications; and
Submitting a joint proposal between NY Utilities and DER Developers for an updated NYSSIR.
54 Case 16-M-0411, et. al., In the Matter of Distributed System Implementation Plans, Order On Distributed System Implementation Plan Filings, (issued March 9, 2017), pp. 15-18.

DSIP Update Topical Sections
201
In addition to DERs, Central Hudson has experienced a significant increase in large scale renewable
applications due to the New York State Research and Development Authority’s solicitations for projects.
These projects are primarily proposing interconnection to the transmission system, with some projects
proposed on medium voltage substation buses. This creates significant complexity in coordinating the
queues between NYISO, Central Hudson, and NYSSIR projects. In addition, these substation and
transmission level interconnections will limit the hosting capacity of DERs on feeders, even where the
hosting capacity of the feeders has not been exceeded. Central Hudson has been working with the NYISO
and other New York Transmission Owners (TOs) to establish guidelines on base case inclusion rules that
will help facilitate coordination among the various interconnection queues.
Since the Initial DSIP filing, per the PSC’s March 9, 2017, DSIP Order, Central Hudson was also directed to
establish hosting capacity maps for 12kV feeders and above by October 1, 2017. Details regarding Hosting
Capacity efforts and results can be found in Section III.L. However, the hosting capacity at the substation
and transmission level is not yet available due to its significant complexities and prioritization in the
roadmap.
2. Implementation Plan
a) Current Progress
With Phase 1 of the IOAP in operation, Central Hudson continues to refine and improve the IOAP as more
experience is gained using the software and as new updates are provided by Clean Power Research.
While Phase 2 (Automate Technical Screening) had been placed on hold awaiting updated NYSSIR
Screens, in 2017, Central Hudson began working with Electrical Distribution Design to integrate their
loadflow software, Distribution Engineering Workstation (DEW), to Central Hudson’s ESRI GIS system as
the first step to meeting Phase 2 requirements. The link between these two systems is currently in place
and undergoing quality assurance testing. Final acceptance testing and go-live is expected to take place
by the end of 2018.
As the recent April 19, 2018, PSC Order55 directed the NY Joint Utilities to begin efforts for Phase 2
implementation of the IOAP, Central Hudson has begun working with Clean Power Research on the scope
of work for integrating PowerClerk with DEW. The goal of Phase 2 of the IOAP will be to automate the
technical screening analysis, such that when a customer submits an application using the PowerClerk
software online, the IOAP will link to DEW, which will pull the correct circuit model from Central Hudson’s
server and run a loadflow analysis to compute the results for Preliminary Screens A to F in the NYSSIR.
55 Case 18-E-0018, et. al., In the Matter of Proposed Amendments to the New York State Standardized Interconnection Requirements (SIR) for Small Distributed Generators, Order Modifying Standardized Interconnection Requirements, (issued April 19, 2018), pp. 21.

DSIP Update Topical Sections
202
These results will then be transferred back to PowerClerk. This work requires development of additional
fields and statuses within the IOAP as well as the testing of use cases to ensure the automation is working
as intended, including considering all proposed DERs queued ahead. The mechanisms to automate the
NYSSIR preliminary screens that can be automated are anticipated to be in place by 2019. Full
automation, however, will be in service once ESRI GIS model quality assurance is complete.
While Central Hudson has already made significant progress in improving the interconnection process
through collaborative working groups such as the ITWG and IPWG, Central Hudson along with Joint
Utilities of NY continue to address developer and stakeholder concerns through these mediums. The most
current and upcoming topics for discussion within these groups include:
CESIR Standardization
Effective Grounding
Smart Inverters
Effectiveness of Updated NYSSIR Screens
Guideline Matrices of Utility Requirements
Construction Milestones
Post Construction Requirements
Material Modifications
Working jointly with other NY utilities, Central Hudson is also moving forward with implementing Stage 3
of Hosting Capacity analysis to provide more granular hosting capacity values, as well as including existing
interconnected DERs. Details on current Hosting Capacity efforts can be found in Section III.L.
Due to the significant increase in applications for large solar PV systems, as well as a focus on inverter-
based applications, Central Hudson has also recognized the need to update the Company’s
Interconnection Guidelines. While Central Hudson currently has interconnection protection requirements
publicly posted on the Company’s Distributed Generation website, this document was last overhauled in
2002. The goal for updating the interconnection document will be to guide DER developers and applicants
with a clear understanding of the technical requirements for interconnecting to the grid, based on
current standards as well as the increase in knowledge for inverter-based systems such as solar PV. While
some reference documents and requirements have been updated on the Company’s Distributed
Generation website, a formal consolidated guide is still required. Central Hudson has currently outlined
the contents and details which will be included within the updated guideline and expects to have a draft

DSIP Update Topical Sections
203
document completed by the end of 2018, with a finalized document that can be posted for public use in
2019.
The Company will also work with the NYISO to finalize the queue coordination documents. NYISO staff will
be presenting the content of these documents to the NYISO’s Transmission Planning Advisory
Subcommittee (TPAS) for stakeholder input. A similar presentation will be needed to obtain stakeholder
input from the IPWG.
b) Future Implementation and Planning
As described within EPRI’s Functional Requirements for Implementation of an IOAP, Phase 3 of the IOAP
includes full automation of all utility processes. Future work regarding interconnections will require
integration with distribution planning functions as well as further integration with utility systems.
However, this level of integration first requires the completion of other on-going initiatives as well as
feedback from stakeholders. Hosting capacity, as indicated in Section III.L, as well as stakeholder
prioritization of DER concerns, will influence future requirements in regards to interconnections. The
Company will also work with stakeholders to finalize and fully implement the coordination process
between the NYISO, Central Hudson, and NYSSIR queues.
3. Risks and Mitigation
Application volume for interconnections can significantly vary depending on regulatory changes or new
initiatives. Drivers for volume fluctuations include NYSERDA incentives, policy changes, economics, and
technology. As anticipating the volume at any given point is challenging, there are potential risks in
maintaining the appropriate level of resources to be able to handle a rush of applications. In addition,
there is rising interest in battery storage integration, which will pose new challenges for the Company.
Finally, the coordination with Large Scale Renewables will create a challenge for the Company. However,
as Central Hudson has proven after successfully handling the launch of CDG as well as the Queue
Management Order, the Company has flexibility in shifting internal resources within the Company as well
as externally, to be able to continue to support the interconnection processes, IOAP, and Interconnection
Standard updates, throughout a fluctuation in applications.
4. Stakeholder Interface
Stakeholder interface and feedback has been a significant focus for interconnections since the Initial DSIP
was filed. The ITWG has continued to meet on a bi-monthly basis, in order to provide stakeholders with
the ability to discuss technical topics of concern regarding interconnections. The IPWG has also continued
to meet on a monthly basis and provides DER developers with the ability to voice administrative or policy
related issues. Finally, a queue coordination process has been jointly drafted by the Transmission Owners

DSIP Update Topical Sections
204
(TOs) and NYISO between the NYISO, TO, and NYSSIR processes; the NYISO plans to begin discussion of
queue coordination at an upcoming Transmission Planning Advisory Subcommittee (TPAS) meeting. While
these groups enable discussions and changes related to updating regulatory documents like the NYSSIR,
they also facilitate mutual agreement and standardization of technical requirements such as anti-
islanding requirements, as previously discussed in Section III.J.1. Central Hudson will continue to remain
active within the ITWG and IPWG and future topics of interest which will be discussed on upcoming
agendas are included in Section III.J.2.a).
5. Additional Detail
a) A detailed description (including the Internet address) of the utility’s web
portal which provides efficient and timely support for DER developers’
interconnection applications.
In early 2017, Central Hudson began soliciting Request for Proposals from third party software vendors in
order to obtain new interconnection software that would meet the requirements listed in EPRI’s IOAP
Functional Requirements56. This software was pursued to replace Central Hudson’s previous web portal
developed in-house. Central Hudson’s new IOAP went live September 26, 2017. It can be found by
accessing the following direct link: https://cenhuddg.powerclerk.com/MvcAccount/Login, or by visiting
Central Hudson’s Distributed Generation page at https://www.cenhud.com/dg.
While Central Hudson previously worked to improve the interconnection process internally, the Company
ultimately decided to pursue the PowerClerk software created by Clean Power Research (CPR) to meet
the requirements in the PSC Order as well as provide a more streamlined, user-friendly experience. Based
on the interconnection portal gaps identified in the Initial DSIP, the new IOAP using PowerClerk software
provides enhanced features for the application process and enables the applicant to have more visibility
into the process. Some of these features include, but are not limited to:
Online payment during application submittal, as well as upgrade payments;
Automated e-mails to the applicant each time the application moves to the next stage;
Real-time application status to enable transparency throughout the application process;
Submission of all application components via the web portal including pre-application and final
application documentation;
Built-in electronic signature capabilities;
56 Electric Power Research Institute (“EPRI”), New York Interconnection Online Application Portal Functional Requirements, September 2016, "EPRI's IOAP Functional Requirements".

DSIP Update Topical Sections
205
Updating of existing application information as required;
Convenience of interconnection application data housed in one location which can be used for
real-time data reporting for internal and external use;
Auto-fill application capabilities as well as auto-calculations including system size and transformer
loading; and
Integration to existing utility systems to enable auto population of customer information to
eliminate inaccuracies and duplicative efforts.
b) Where, how, and when the utility will implement and maintain a resource
where DER developers and other stakeholders with appropriate access controls
can readily access, navigate, view, sort, filter, and download up-to-date
information about all DER interconnections in the utility’s system. The resource
should provide the following information for each DER interconnection:
(1) DER type, size, and location;
(2) DER developer;
(3) DER owner operator;
(4) DER operator;
(5) the connected substation, circuit, phase, and tap;
(6) the DER’s remote monitoring, measurement, and control capabilities;
(7) the DER’s primary and secondary (where applicable) purpose(s); and,
(8) the DER’s current interconnection status (operational, construction in-progress,
construction scheduled, or interconnection requested) and its actual/planned in-service date.
Central Hudson’s IOAP provides DER developers the ability to submit applications anytime at their
convenience. The IOAP itself provides the appropriate provisions to ensure only developers who are given
authority to act on a customer’s behalf can view a particular customer’s application information. The
PowerClerk software also uses secure logon with appropriate encryption to ensure the privacy of
customer data. Employees within the Electric Distribution Planning area actively monitor applications as
they are submitted on a daily basis and update the IOAP with the current status and project information.
The following information is available within the IOAP:
DSIP Update Topical Sections
206
DER type, size, and location;
Net-metering eligibility;
DER developer, agent, or contractor;
Connected substation and circuit; and
Current interconnection status.
The bulleted information above is also posted monthly on the New York State Department of Public
Service website under Matter Number 13-00205. This information redacts confidential customer
information and can be downloaded for public use. This New York State Department of Public Service
website also includes a link to the NYISO Planning Services & Requests website which contains links to
interconnection documents and the interconnection queue; the NYISO’s interconnection queue links back
to the this New York State Department of Public Service NYSSIR inventory website.
Central Hudson does not track instances where the DER owner operator and DER operator may be
different entities. Third party lease agreements between the DER developer and utility customer do not
impact the interconnection process, particularly when the utility customer provides the DER developer
with authority to act on his behalf. The IOAP also does not provide developers or the general public with
information on the primary and secondary purposes of the DER system, as the primary means for
interconnection for the majority of applications received under the NYSSIR are to offset load and receive
compensation per the Value of Distributed Energy Resources. However, the IOAP does track when the
use of more than one generator is provided, such as a battery storage system being installed for backup,
as well as the type of net metering system including Community Distributed Generation or remote net
metering.
Central Hudson’s Solar PV Hosting Capacity Map is a public resource available to developers and
stakeholders, for use in determining a distribution circuit’s potential hosting capacity within Central
Hudson’s territory. In addition to hosting capacity, the map also provides pop-up information to indicate
what substation, circuit, and phase currently exists at each feeder location. The following information is
also available within the pop-up: queue information for the feeder and substation, substation
transformer peak information, and 3V0 protection upgrade status.
Monitoring and control capabilities for each individual DER system are not provided as public information.
However, current monitoring and control requirements can be found on the New York State Public
Service Commission’s website.57 These requirements oblige DER systems with nameplate ratings 500kW
and above to have monitoring and control capabilities which can be satisfied by installing a Point of
57 Monitoring and Control Requirements for Solar PV Projects in NY, September 1, 2017.

DSIP Update Topical Sections
207
Common Coupling (PCC) Electronic Recloser at the DER site. For systems with smaller nameplate ratings,
monitoring and basic control may be required depending on system conditions and technical evaluations.
The NYISO has additional requirements for resources interconnecting through their process. Details of
these requirements and processes may be found in the NYISO’s Transmission Expansion and
Interconnection Manual as well as NYISO Open Access Transmission Tariff (OATT) Attachments X, S, and Z.
c) The utility’s means and methods for tracking and managing its DER
interconnection application process to ensure achievement of the performance
timelines established in New York State’s Standardized Interconnection
Requirements.
With the introduction of the new IOAP software, Central Hudson has mapped out the entire
interconnection process from the very initial application submittal to final interconnection and ultimately
reconciliation. Through the use of various workflows and forms, the IOAP provides timestamps and
application statuses to ensure applications are tracked and managed in a timely manner and as required
by the NYSSIR. The utility login page of the IOAP provides a layout and breakdown of all applications’
statuses and type, such as application reviews, pre-applications, and CESIR study, which allow Central
Hudson’s Engineering Technicians and contractors to easily track the approaching deadlines for each of
these projects. The IOAP provides e-mail reminders for upcoming due dates, based on the timelines listed
in the NYSSIR. Employees within the Distribution Planning area actively monitor applications as they are
submitted on a daily basis and provide updated application statuses on the IOAP. The IOAP can also be
reconfigured to align with updates to the NYSSIR.
To ensure each member within the group, including new employees, has an understanding of NYSSIR
timelines and the importance of consistently meeting them, Central Hudson has also developed detailed
documentation on the process flow, including current automations within the IOAP, as well as a
guidelines on reviewing applications under the NYSSIR.
d) Where, how, and when the utility will provide a resource to applicants and
other appropriate stakeholders for accessing up-to-date information concerning
application status and process workflows.
Central Hudson’s IOAP allows applicants and other appropriate stakeholders to create an IOAP account to
login and view the real-time status of their application submitted via the Central Hudson or NYSSIR
process. Automated e-mails are also sent to applicants to inform them of when the application changes
statuses (for example, when it moves from application under review to preliminary screening analysis in
progress). When applications are deemed incomplete, details are provided within the IOAP to inform the
DSIP Update Topical Sections
208
applicant which documents are deficient, along with an explanation of the deficiencies. The IOAP status
also states whether next steps are at the responsibility of the developer or the utility.
In addition to the IOAP, Central Hudson also maintains a centralized e-mail and phone number for
applicants or DER developers to contact with questions or concerns. This contact information can be
found on the IOAP landing page or by visiting Central Hudson’s Distributed Generation website.
The NYISO Interconnection Queue indicates the status of projects that applied for interconnection
through the NYISO Interconnection Process.
e) The utility’s processes, resources, and standards for constructing approved
DER interconnections.
Central Hudson follows the procedures and requirements as listed within the NYSSIR. Through the use of
the IOAP, the customer has the option to submit a pre-application or application as the initial step to move
forward with a DER interconnection. For the application review, Central Hudson currently has one
employee and one contractor available to review applications for completeness and manage the
administration process of interconnections, including application questions and calls. For questions
regarding billing and/or net-metering eligibility, the Company has one employee designated as primary
point of contact to answer these questions. Central Hudson also has one employee designated to manage
and maintain the IOAP.
For systems with nameplate ratings greater than 50kW which are subject to technical screening, Central
Hudson currently has two employees who perform these technical screens. For applications which require
a CESIR, the Company currently contracts these studies out to two consultant resources. However,
assistance and additional review is provided by employees within Central Hudson’s Distribution Planning
and System Protection departments, and input on cost estimates is provided from the Company’s
Distribution Design/Estimating department.
In addition to the requirements within the NYSSIR, Central Hudson utilizes two additional reference
documents for interconnection: the Interconnection Protection Requirements and Central Hudson’s
Requirements for Electric Installations. Both of these documents are publically available on the Company’s
Distributed Generation website. While Central Hudson’s Interconnection Protection Requirements are in
the process of being updated as described in Section III.J.2.a), this document provides applicants with
technical details DG systems must meet before receiving approval for interconnection. As a part of ITWG
discussions and outcomes, some interconnection requirements also have been standardized between the
Joint Utilities of New York. This includes requirements for Unintentional Islanding as well as Monitoring
and Control. These documents can be found on NYS DPS’s ITWG website.

DSIP Update Topical Sections
209
For projects interconnecting through the NYISO, the NYISO’s Transmission Expansion and Interconnection
Manual provides details on the NYISO’s processes. NYISO Open Access Transmission Tariff (OATT)
Attachments X, S, & Z are also helpful in understanding the NYISO processes. These documents contain
NYISO-specific requirements that are in addition to Central Hudson requirements.
f) The utility’s means and methods for tracking and managing construction of
approved DER interconnections to ensure achievement of required performance
levels
For systems with nameplate ratings less than 50kW where the typical upgrade is only a transformer
upgrade, the applicant can pay for the transformer upgrade and obtain information on its status via the
IOAP or contact the centralized DG phone and e-mail. For applications that do not require upgrades to
interconnect and/or new service, the applicants are simply approved to construct their DER system once
the application is deemed complete and only need to contact the utility through the IOAP again to
request a meter change and submit final approval documentation. For applications that require upgrades,
the customer is informed of the upgrades and construction is scheduled upon receipt of payment. Upon
completion of utility and developer construction, the applicant contacts the utility through the IOAP again
to request a meter change and submit final approval documentation.
For applications with nameplate ratings greater than 50kW that require new service and/or utility
upgrades, customers are provided with the contact information for a Project Manager. The Project
Manager remains the primary point of contact for questions regarding construction and next steps,
including receiving estimated construction timelines. The Project Manager remains the liaison between
the DER developer and all appropriate groups within the Company who may have a role in the
construction process. Central Hudson’s District Directors in the New Business Department act as
designated Project Managers in each of the following districts: Catskill/Kingston, Poughkeepsie,
Newburgh, and Fishkill. In addition, an overall Project Manager was recently added to the team.
Once a project provides upgrade payments (both partial and full), employees within the Electric
Distribution Planning Department will contact the Project Manager to inform him of this status change
and to initiate appropriate next steps within the process. All real-time and current statuses of the
application can also be found within the IOAP. On a monthly basis, the Electric Distribution Planning
Department also provides a status report for systems greater than 50kW. As DER system construction
nears completion, the Project Manager will inform the appropriate groups within Central Hudson in order
to coordinate a timely completion on any upgrades needed on Central Hudson’s end as well.
For projects interconnecting through the NYISO, the NYISO maintains an Interconnection Queue on their
website that provides information on each proposed project.
DSIP Update Topical Sections
210
g) Where, how, and when the utility will provide a resource to DER developers
and other stakeholders for accessing up-to-date information concerning
construction status and workflows for approved interconnections.
As indicated in Section III.J.5.f), applications requiring construction upgrades or new service are provided
with contact information for a Project Manager once the applicant opts to move forward with their
project by providing upgrade payment(s). This is typically done after the completion of engineering
studies which identify upgrades and the associated estimated costs. The Project Manager becomes the
primary resource for providing DER developers with construction status, including any new service work
that may be required. In addition, the IOAP continuously provides visibility into the current status of a
project, including differentiation between when a project is approved for construction versus the utility
awaiting for payment.

DSIP Update Topical Sections
211
K. Advanced Metering Infrastructure
1. Context and Background
Central Hudson’s Initial DSIP filing (dated June 30, 2016) contained a comprehensive analysis of the
benefits and costs of implementing an advanced metering infrastructure (AMI) which was performed
pursuant to the Order Adopting Distributed System Implementation Plan Guidance and in accordance with
the Order Establishing the Benefit Cost Analysis Framework.58 AMI deployment was assessed from three
perspectives (societal, utility, and ratepayer), across two scenarios (full and partial deployment), and
between benefit categories (operational only versus incremental AMI enabled benefits contingent on
regulatory changes).
Central Hudson’s analysis recognized the potential for AMI to offer customers, market participants, and
utilities increased visibility and resolution with regard to energy usage and flow. However, the results
across all scenarios of this analysis consistently indicated that the cost to integrate AMI systems with new
and existing applications and devices to improve analytical capabilities and customer tools significantly
exceeded the identified benefits. As a result, the analysis did not support universal implementation across
the service territory. Further, the analysis pointed to several characteristics that explain the significant
gap between AMI benefits and costs of full deployment:
Distribution Automation – The continued deployment of approved distribution automation will
capture a substantial portion of benefits, thus limiting the incremental benefits from AMI.
Existing Advanced Meter Reading (AMR) – The existing and anticipated penetration of AMR will
capture benefits of more efficient meter reading and meter accuracy improvements.
Meter Reading Frequency – Central Hudson’s bi-monthly reading schedule for the majority of
meters results in lower reading costs than a monthly frequency.
Gas Meter Co-Location – The presence of gas meters at approximately 25% of electric customer
sites results in the imposition of AMI installation costs with little incremental benefit.
Remote Geography – The larger distances between meter sites leads to reduced operational
savings and increased costs due to the need for additional network infrastructure and cellular
meters.
58 Case 14-M-0101 – Order Establishing the Benefit Cost Analysis Framework, Issued and Effective January 21, 2016; Order Adopting Distributed System Implementation Plan Guidance, Issued and Effective April 20, 2016.

DSIP Update Topical Sections
212
The analysis also found that a partial AMI deployment is not cost-effective by an even greater margin as
the results are not only impacted by these characteristics, but by two other primary reasons:
Foundational Investments – Significant IT investments are required independent of the number
of meters deployed.
Smaller Meter Base – A smaller meter base translates to reduced savings for operational benefits
that are proportional to meter deployment, such as meter reading and outage management.
As there have been no changes to these characteristics or significant changes in deployment costs,
widespread AMI deployment continues to fail to provide a cost-effective opportunity for Central Hudson
customers to incorporate resources into the REV market.
Although the Company has decided not to pursue widespread AMI deployment, it continues to pursue
and support individual initiatives that present cost-effective opportunities for customers to access and
assess their energy usage data and allow the Company to support demand side management options
through rates and programs, including:
Hourly Pricing Program (HPP) – Customers with demand exceeding 300 kW are subject to the
provisions of the HPP if electing to purchase energy from Central Hudson. As a result, all
customers exceeding the 300 kW threshold are required to have an interval meter with cellular
communications capability. This does not result in a large number of active meters, as only 0.1%
of customers meet this threshold. However, it does result in a significant portion of the
throughput on Central Hudson’s system, approximately 31.7% of deliveries already being
metered on an interval basis, with this data being available to these customers on a daily basis
through a web-based platform.
Commercial System Relief Program (CSRP) – The CSRP is a tariffed program that allows non-
residential customers and third-party aggregators to contract to provide load relief during
Company designated load relief periods. All customers enrolled in the CSRP, either directly or
through an aggregator, are subject to interval metering and telecommunications requirements.
Targeted Demand Response Program (TDRP) – The TDRP is a Commission-approved59, localized
non-wires alternative project which utilizes a combination of non-residential interval metering
and sample of residential interval metering, as discussed further below, for measurement and
verification purposes.
59 Case 14-E-0318 – Order Approving Rate Plan, Issued and Effective June 17, 2015.

DSIP Update Topical Sections
213
Value of Distributed Energy Resources Phase One Value Stack (Value Stack) – Pursuant to
Commission Order on Net Metering Transition, Phase One of Value of Distributed Energy
Resources, and Related Matters and Order on Phase One Value of Distributed Energy Resources
Implementation Proposals, Cost Mitigation Issues, and Related Matters60, Central Hudson
implemented Value Stack compensation for certain DERs on November 1, 2017. The granularity
of compensation embodied in the Value Stack, which will enable a more “distributed, transactive,
and integrated electric system,”61 is necessarily based on the requirement of interval metering
and concomitant telecommunications, in order to more accurately record and value net hourly
customer consumption and electric system injections.
Residential Time-of-Use (TOU) Rate – In response to the Commission’s Order Adopting a
Ratemaking and Utility Revenue Model Policy Framework62, Central Hudson proposed an
alternative residential TOU rate that was approved63 with minor modification and implemented
effective December 1, 2017. Although this rate offering relies only on a general time-of-use
register meter, Central Hudson’s outreach for this new rate offering includes the potential for
TOU customers to access advanced metering through a subscription service, as discussed more
fully below. This service would permit customers to view more granular usage data beyond the
on-peak/off-peak billed totals provided by a register meter.
Mass Market Net Energy Metering Successor Rate Design – Pursuant to the Revised VDER Value
Stack and Rate Design Working Group Process and 2018 Schedule64 issued by the Department of
Public Service Staff, Central Hudson has been working with the Joint Utilities to propose a rate
design that could serve as the basis for a mass market net energy metering successor tariff. While
it is still very early in the process with metering requirements still undefined, the use of interval
metering may be considered, particularly in light of the current requirements for Value Stack
compensation.
Optional Residential Advanced Metering and Data Services (Insights+) – Central Hudson offers a
subscription-based service that includes the installation of an advanced meter which captures 15-
minute interval customer load data and communicates this information over a cellular network.
This enhanced data will provide subscribing customers with the ability to view daily and hourly
60 Case 15-E-0751 - Order on Net Metering Transition, Phase One of Value of Distributed Energy Resources, and Related Matters, Issued and Effective March 9, 2017; Order on Phase One Value of Distributed Energy Resources Implementation Proposals, Cost Mitigation Issues, and Related Matters, Issued and Effective September 14, 2017 (Value Stack Order).
61 Value Stack Order, p. 2.
62 Case 14-M-0101 - Order Adopting a Ratemaking and Utility Revenue Model Policy Framework; Issued and Effective May 19, 2016.
63 Cases 17-E-0369, et al. – Order Approving Voluntary Time of Use Rates; Issued and Effective November 17, 2017.
64 Case 15-E-0751, Matter 17-01277 - Revised VDER Value Stack and Rate Design Working Group Process and 2018 Schedule; issued December 22, 2017.
DSIP Update Topical Sections
214
energy consumption, correlate energy consumption with average daily temperature, set bill and
usage alerts, and participate in various rate structures/programs. Currently, this subscription
service is available at a cost of $4.99 per month. Customers can receive a reduced subscription
cost of $1.99 per month if they sign up for the Voluntary Time of Use rate along with Insights+.
2. Implementation Plan
a) Current Progress
As previously described, Central Hudson currently offers a subscription based service called Insights+
which includes installation of an advanced meter that captures 15-minute interval data with
communication of data over a cellular network. This subscription is available to residential customers only
at a cost of $4.99 per month. Customers can receive a reduced subscription cost of $1.99 per month if
they sign up for the Voluntary Time of Use rate along with Insights+.
Beyond the Insights+ demonstration project scope, Central Hudson has have expanded the use of the
Insights+ meters to assist in accomplishing other operational objectives:
Measurement and Verification (M&V): Itron utilizes a statistical sample set of Insights+ meters for
M&V as part of the Peak Perks NWA program. Itron pays the monthly meter fee and the
customer receives the Insights+ service as part of their Peak Perks program participation
incentives.
Value Stack: The Insights+ meter data meets the criteria for the application of value stack
compensation and the hosted Itron MDM can accommodate the additional meters at no
additional system cost.
Time of Use: The Insights+ meters capture data for our original Time of Use intervals as well as
our new Voluntary Time of Use intervals. They also provide enhanced visual displays that
differentiate time of use time periods and peak and off-peak usage analytics.
b) Future Implementation and Planning
Central Hudson continues to look for ways to expand use of the Insights+ meters to lower operational
costs associated with the startup of new programs and technologies.
3. Risks and Mitigation
The most significant risks related to the Company’s decision to not pursue widespread AMI deployment
would be the Commission’s desire for a broader program, consistent with other utility programs across
the state, and the implementation of additional rate design structures requiring more granular
DSIP Update Topical Sections
215
consumption data. The risk of AMI deployment for statewide consistency is the resulting additional cost
recovery obligations imposed on customers without concomitant benefits as previously discussed. Under
this approach, Central Hudson would tailor customer education and outreach to address customer
concerns. While the analysis of alternative rate design structures should include the costs incurred,
including metering, implementation of such structures over time could lead to a fragmented meter
inventory based on changing technology and design structures. It will be critical for Central Hudson to
continuously monitor and evaluate meter and support technology to maintain an efficient, integrated
system.
In contrast, additional AMI deployment increases cyber security risks and customer opposition to
additional technology, particularly with respect to exposure to electro-magnetic fields (EMF). It will be
critical to adequately address any cyber security concerns to minimize risk associated with the increased
communications and access to data accompanying AMI deployment. There is also the risk of additional
customer opposition to AMI, which utilizes digital and wireless technologies, as customers cite health,
privacy, and security concerns.
4. Stakeholder Interface
Additional AMI deployment will require the Company to expand its customer data initiatives to further
collaborate with interested stakeholders to co-develop business use cases for more granular metering
data in order to develop a deeper understanding of the need and use for various types of consumption
data, including public availability, private availability, and possible value-added data elements.
5. Additional Detail
a) Provide a summary of the most up-to-date AMI implementation plans,
including where AMI has been deployed to date.
Insights+ meters for M&V purposes have been deployed within our Target Demand Response zones of
Merritt Park, Fishkill, and the Northwest Corridor. Overall the Insights+ meters are distributed across our
territory as shown in Figure III-XXVII.
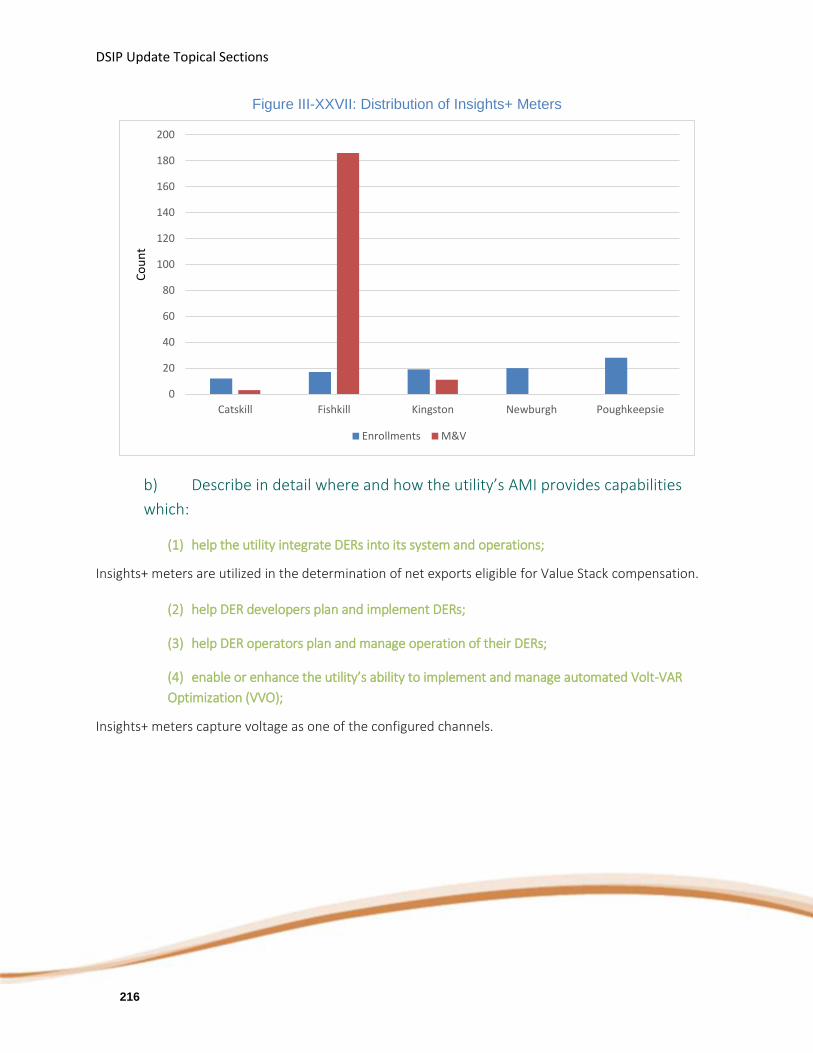
DSIP Update Topical Sections
216
Figure III-XXVII: Distribution of Insights+ Meters
b) Describe in detail where and how the utility’s AMI provides capabilities
which:
(1) help the utility integrate DERs into its system and operations;
Insights+ meters are utilized in the determination of net exports eligible for Value Stack compensation.
(2) help DER developers plan and implement DERs;
(3) help DER operators plan and manage operation of their DERs;
(4) enable or enhance the utility’s ability to implement and manage automated Volt-VAR
Optimization (VVO);
Insights+ meters capture voltage as one of the configured channels.
0
20
40
60
80
100
120
140
160
180
200
Catskill Fishkill Kingston Newburgh Poughkeepsie
Co
un
t
Enrollments M&V

DSIP Update Topical Sections
217
(5) improve the utility’s ability to prevent, detect, and resolve electric service interruptions;
(6) improve the utility’s ability to implement rate programs which facilitate and promote
customer engagement, DER development, and EV adoption;
Insights+ meters capture 15-minute interval data for delivered, received, and net usage and can be
configured to capture peak and off-peak channels. This flexibility enables use of the meters across
dynamic rate offerings. The integration of the meter data into the online engagement platform creates
visualization tools to assist customers in better managing their energy usage and understanding the
effects of usage and rate on their monthly bill.
c) Describe in detail how the AMI enables secure communication with and
among devices at customers’ premises to support customer engagement, energy
efficiency, and innovative rates
The Insights+ meters communicate only to the Itron head end and are not connected to any customer-
level home area network architecture. Data exchange from the head end system to Central Hudson and
associated partners that facilitate delivery of the online engagement platform is executed using secure
file transfer protocols.
d) Describe where and how DER developers, customers, and other
stakeholders can access up-to- date information about the locations and
capabilities of existing and planned smart meters.
Customers can learn about and enroll in Insights+ on CenHubStore.com.

DSIP Update Topical Sections
218
L. Hosting Capacity
1. Context and Background
In order to encourage further DER integration, Central Hudson provides estimates of their system’s
hosting capacity, or the amount of DER that can be accommodated without adversely impacting power
quality or reliability under existing control configurations and without requiring infrastructure upgrades to
the primary line and/or secondary network system.65 This information is of particular interest to
stakeholders as it allows prospective interconnection customers to make more informed business
decisions prior to committing resources to an interconnection application.
Central Hudson calculates each circuit’s hosting capacity by evaluating potential power system criteria
violations as a result of interconnecting large solar PV systems66 to three-phase distribution lines. This
approach was deliberately chosen to deliver value in a timely manner to DER developers most active in
New York State. The analysis increases visibility into hosting capacity for larger-scale solar PV systems that
often target rural areas where land is available but where hosting capacity can vary substantially from
feeder to feeder. The primary use case for hosting capacity data in New York is to help guide DER
investments and marketing activities to areas of the grid where the costs of interconnection are likely to
be the lowest.
Figure III-XXVIII shows a roadmap of the Hosting Capacity milestones for the Joint Utilities.
65 Electric Power Research Institute (“EPRI”), Defining a Roadmap for Successful Implementation of a Hosting Capacity Method for New York State, Report Number 3002008848 (“EPRI Roadmap”), June 2016, p. 2. http://www.epri.com/abstracts/Pages/ProductAbstract.aspx?ProductId=000000003002008848.
66 Solar with an AC nameplate rating starting at and gradually increasing from 300 kW.
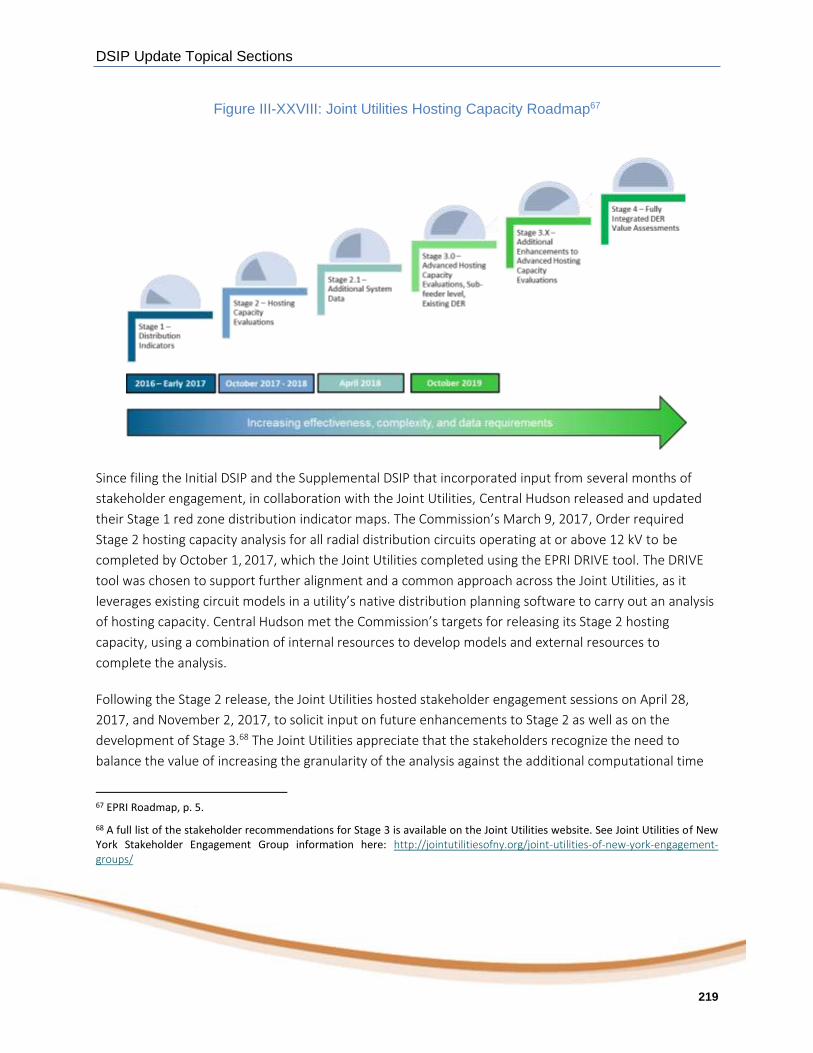
DSIP Update Topical Sections
219
Figure III-XXVIII: Joint Utilities Hosting Capacity Roadmap67
Since filing the Initial DSIP and the Supplemental DSIP that incorporated input from several months of
stakeholder engagement, in collaboration with the Joint Utilities, Central Hudson released and updated
their Stage 1 red zone distribution indicator maps. The Commission’s March 9, 2017, Order required
Stage 2 hosting capacity analysis for all radial distribution circuits operating at or above 12 kV to be
completed by October 1, 2017, which the Joint Utilities completed using the EPRI DRIVE tool. The DRIVE
tool was chosen to support further alignment and a common approach across the Joint Utilities, as it
leverages existing circuit models in a utility’s native distribution planning software to carry out an analysis
of hosting capacity. Central Hudson met the Commission’s targets for releasing its Stage 2 hosting
capacity, using a combination of internal resources to develop models and external resources to
complete the analysis.
Following the Stage 2 release, the Joint Utilities hosted stakeholder engagement sessions on April 28,
2017, and November 2, 2017, to solicit input on future enhancements to Stage 2 as well as on the
development of Stage 3.68 The Joint Utilities appreciate that the stakeholders recognize the need to
balance the value of increasing the granularity of the analysis against the additional computational time
67 EPRI Roadmap, p. 5.
68 A full list of the stakeholder recommendations for Stage 3 is available on the Joint Utilities website. See Joint Utilities of New York Stakeholder Engagement Group information here: http://jointutilitiesofny.org/joint-utilities-of-new-york-engagement-groups/

DSIP Update Topical Sections
220
and its subsequent impact on refresh frequency. The Joint Utilities continue to view stakeholder feedback
as a critical input to further improvements to the hosting capacity analysis and displays.
As a result of stakeholder feedback, the Joint Utilities provided an update with additional system data in
their Stage 2.1 release in mid-April 2018. The hosting capacity displays use pop-up boxes to provide
system data, including minimum and maximum total three-phase feeder hosting capacity, voltage, and
installed and queued DG values. The Joint Utilities worked collaboratively with stakeholders to identify
additional data elements that could further enhance the value of the displays to developers. The Joint
Utilities agreed to provide those additional data elements as part of a “Stage 2.1” release by April 16,
2018. The additional data elements provided at the substation level 69 include:
Installed and queued DG;
Total DG (sum of installed and queued DG);
Peak load; and
3V0 upgrade status (where applicable).
Central Hudson updates popup data fields for installed, queued, and total DG on a monthly basis and
updates peak load information annually. Where appropriate, 3V0 protection upgrade information is
updated annually or upon major changes for relevant circuits.
2. Implementation Plan
a) Current Progress
Utilizing internal resources, Central Hudson will also publish an annual update to the feeder-level hosting
capacity by October 1, 2018, and the Company is on track for a Stage 3.0 release by no later than October
1, 2019. This release will provide sub-feeder level hosting capacity incorporating existing installed DERs
into the modeling.70 The evolution to this more granular hosting capacity analysis allows better visibility
into Hosting Capacity for sub-feeder segments. Developers will be able to identify specific locations with
higher levels of hosting capacity and potentially lower interconnection costs. The Joint Utilities will
evaluate additional enhancements to the hosting capacity portal following the publication of the Stage
3.0 analysis. The future Stage 3.X releases could include enhancements such as increased analysis refresh
frequency, transmission and substation constraints, and additional information such as forecasted hosting
69 Substation-level information may be provided at the individual substation transformer bank level when appropriate. A unique identifier is included noting the specific substation transformer bank in those instances.
70 The impacts of all existing DERs are reflected in the underlying circuit load curves and load allocations of the analysis in Stage 2. This enhancement incorporates the interconnected DER to date into the circuit models used for the hosting capacity analysis with a priority on large PV, which remains the DER technology with the most significant impacts on hosting capacity.

DSIP Update Topical Sections
221
capacity evaluations. Prioritization of these future releases will be informed by use cases and stakeholder
engagement, as described in the following sections of this document.
b) Future Implementation and Planning
Following the October 2018 Stage 2.1 refresh, Central Hudson will begin preparing the release of Stage 3
(with an anticipated release no later than October 1, 2019). Consistent with the Supplemental DSIP and in
alignment with stakeholder feedback, the Stage 3.0 release will include modeling of existing
interconnected DERs and sub-feeder level hosting capacity analysis. These enhancements will provide
more valuable information for developers using the tool. For example, while the impact of existing DERs
on circuit load curves was already reflected in the Stage 2 results, the Stage 3.0 release will reflect
installed DERs in the circuit models directly to better reflect their impact on PV hosting capacity. In
addition, the increased granularity of data in the Stage 3.0 release will provide more locational-specific
sub-feeder level information to better inform developers.
Subsequent Stage 3.X releases will further enhance the information provided on the hosting capacity
portal. The Joint Utilities are evaluating options to further improve the analysis and will continue to solicit
the input from stakeholders on the continued development of the JU hosting capacity roadmap (shown in
Figure III-XXIX). Possible enhancements in Stage 3.X releases identified thus far include:
Forecasted hosting capacity;
Increased analysis refresh frequency;
Circuit reconfiguration assessments and operation flexibility;
Upstream constraints such as 3V0; and
Incorporation of use cases for energy storage.
Consistent with the DSIP guidance and stakeholder feedback to date, the Joint Utilities will evaluate
options for forecasting hosting capacity that take into account the accuracy of such an analysis given the
uncertainty in the location, timing and configuration of DER adoption forecasts, projected changes to
individual customer loads, and any upgrades or changes to the utility system. The roadmap for
forecasting hosting capacity must incorporate models of future utility system configurations, gross load
forecasts, DER forecasts, and large scale renewable forecasts at the transmission and substation level.
Each of these items has its own roadmap and consideration of scenario-based planning, probabilistic, and
deterministic approaches covered in Section III.A of this DSIP. These concepts must be integrated to
produce a forecast, and it must be decided what level of granularity is appropriate before the level of
uncertainty rises significantly.

DSIP Update Topical Sections
222
The Joint Utilities are actively coordinating with EPRI and other Utilities in North America on the DRIVE
tool roadmap in order to evaluate options for including aspects such as upstream constraints and
operational flexibility in future Stage 3.X releases.
Figure III-XXIX: JU Roadmap for HCA Stages 2.1, 3.0 and 3.X
While substantial effort and accomplishments will be achieved by July 31, 2023, the prioritization of
components of Stage 3.X and Stage 4 will be determined through stakeholder engagement and continued
evaluation of market needs to facilitate DER implementation. For example, storage may be implemented
with an infinite number of use cases, and the EV market is relatively immature; the specific needs of
developers of these DERs will evolve and also must be related to the Integrated System Planning roadmap
for Central Hudson.
As a part of its recent rate proceeding, Central Hudson was approved for additional Engineering resources
to support Integrated Planning and related initiatives. Central Hudson added an additional Junior
Distribution Planning Engineer in June 2018, which will facilitate bringing hosting capacity analysis in-
house beginning with the Stage 2 refresh. Central Hudson is also working with Electric Distribution Design
to automate the file extraction from the Distribution Engineering Workstation (DEW) loadflow software
to the EPRI DRIVE tool for analysis. The mechanisms to automate this process will be in place by
December 2018. Full automation will be in service once the ESRI GIS model quality assurance testing is
complete. Depending upon the extent to which Stage 3.X is implemented, additional Distribution Planning
and GIS resources will be required to close out work orders at an accelerated pace and update system
models, as well as manually reconfigure circuits to consider alternate configurations and incorporate
additional DERs with their own complex set of operating characteristics.
DSIP Update Topical Sections
223
3. Risks and Mitigation
The risks to Hosting Capacity Analysis are primarily driven by software and analytical capabilities,
availability of data, and the accuracy and speed of model updates. To mitigate this risk, Central Hudson
participates in the EPRI DRIVE users group to help influence the development and prioritization of
software capabilities to align with the needs of stakeholders in New York. Since completion of the 2016
DSIP, Central Hudson has continued to refine the loadflow models of its entire distribution system to
facilitate hosting capacity analysis as well as distribution automation. Additionally, the availability of
hourly load data, including minimum load data required for hosting capacity analysis, continues to
improve along with the execution of our capital plan. As a part of the Company’s ESRI GIS roadmap, there
will be closer integration of distribution design work into the ESRI platform, so field changes will be more
quickly incorporated into the GIS model and other interfacing software such as loadflow models that
drive hosting capacity analysis. However, there will still be limitations to reflecting the impacts at the
substation and transmission level into these models.
There is also risk in integrating new DER technologies into hosting capacity analysis. Initial hosting
capacity analysis has been focused on solar photovoltaics. As other technologies with distinct operating
characteristics are introduced, the process may become more manual, slowing the speed and accuracy.
The balance between complexity, speed, and accuracy must be considered to provide timely and effective
information to stakeholders.
4. Stakeholder Interface
The Joint Utilities will continue to engage stakeholders for their input on these approaches to further
inform the continued expansion of the roadmap for hosting capacity, although the group may need to
expand to include emerging developers and those representing all DERs being evaluated. In the case of
hosting capacity analysis for energy storage, input on developer use cases will help inform the
appropriate work product that will be most beneficial to stakeholders. This input will be especially
important given the broad range of energy storage technologies, applications, and operating
characteristics that such analyses could reflect. Forecasted hosting capacity will likewise benefit from
stakeholder input given the level of complexity of the analysis that impacts the accuracy and precision of
its results.
Similar to the approach in 2017, the Joint Utilities plan to hold stakeholder engagement sessions
corresponding with the release of each stage to provide an update to stakeholders on progress to date
and solicit input on future stages. The Joint Utilities will continue facilitating open discussions with
stakeholders via the engagement group sessions beyond the Stage 3.0 release. As described in the
Supplemental DSIP, completion of Stages 3 and 4 of the hosting capacity roadmap is intended to be a
DSIP Update Topical Sections
224
long-term focus for utilities based on lessons learned from previous stages and the availability of
enhanced analytical tools to conduct this degree of analysis.71 The longer-term focus on Stages 3 and 4
complements the Joint Utilities’ interest in engaging stakeholders to provide the highest value results for
users.
5. Additional Detail
a) The utility’s current efforts to plan, implement, and manage projects
related to hosting capacity. Information provided should include:
(1) a detailed description of each project, existing and planned, with an explanation of how
the project fits into the utility’s long range hosting capacity plans;
(2) the original project schedule;
(3) the current project status;
(4) lessons learned to-date;
(5) project adjustments and improvement opportunities identified to-date; and,
(6) next steps with clear timelines and deliverables
Although not the primary project driver, Central Hudson has initiated and continues to complete several
T&D infrastructure projects that increase the hosting capacity of DERs on its system. As shown in detail in
our 2019-2023 Electric Capital Plan72, there are many programs Central Hudson will continue to execute
over the next five years that convert areas from 4kV to 13.2kV operation and/or reconductor wire to
reduce voltage drop. All of these projects have the added benefit of increasing hosting capacity. The
Company has identified ten locations where 4800V circuitry will be converted to 13.2kV operation over
the next three years. The Company will also retire and convert three substations that operate at 4kV to
13.2kV operation over the next five years. In addition, a significant amount of circuitry will be
reconductored as a part of the copper wire replacement program, operating/infrastructure programs,
and the distribution automation program. Finally, the Distribution Automation/Distribution Management
System projects described in further detail in Sections III.A and III.C will allow for enhanced monitoring
and control of DERs, and the projects will also increase hosting capacity. These projects will be fully
71 Case 16-M-0411, In the Matter of Distributed System Implementation Plans, Supplemental Distributed System Implementation Plan (“Supplemental DSIP”), (filed November 1, 2016), p. 56.
72 Case 14-E-0318 et. al,, Prior Rate Case, Central Hudson Gas & Electric Corporation’s Compliance Filing of its 2019-2023 Corporate Capital Forecast, (filed June 29, 2018).
DSIP Update Topical Sections
225
designed, managed, and completed following Central Hudson’s Project Management Manual: Procedures
& Best Practices, updated in August 2016.
Section III.D of this document describes the Energy Storage projects that have been completed or are
currently being evaluated at Central Hudson. While there are several benefits of energy storage being
explored as a part of these projects, PV smoothing will be evaluated particularly as a part of the SUNY
New Paltz PV + battery storage project described in Section III.D. The ability to smooth PV may increase
hosting capacity in an area, although the costs and benefits will need to be weighed against more
traditional transmission and distribution upgrades.
b) Where and how DER developers/operators and other third parties can
readily access the utility’s hosting capacity information.
Hosting capacity maps are available on Central Hudson’s Distributed Generation website at:
www.cenhud.com/dg.
c) How and when the existing hosting capacity assessment information
provided to DER developers/operators and other third parties will increase and
improve as work progresses.
Please see Section III.L.2 for more information.
d) The means and methods used for determining the hosting capacity
currently available at each location in the distribution system.
Central Hudson developed an interactive map that illustrates hosting capacity for its distribution circuits.
The analyses presented in these displays provide the feeder level hosting capacity for distribution circuits
emanating from a substation operating at 12kV and above. The analyses were conducted under current
configurations, without installed DERs, and prior to infrastructure upgrades such as: installing a recloser
or remote terminal unit at the Point of Common Coupling, replacing a voltage regulating device or
controller to allow for reverse flow, substation-related upgrades including 3V0 protection, and other
protection-related upgrades. However, 3V0 upgrade information is included in a separate pop-up display
on the map.
For the Stage 2 displays, each circuit’s hosting capacity is determined by evaluating impacts of large,
centralized solar PV installations (300kW and greater) along the three phase distribution mainline. These
analyses represent the overall feeder-level hosting capacity only and do not account for all factors that
could impact interconnection costs (including substation constraints).

DSIP Update Topical Sections
226
Issues related to circuit protection require further analysis to make a definitive determination of hosting
capacity. This data is being provided for informational purposes only and is not intended to be a
substitute for the established interconnection application process. Additional displays with tabulated data
have been included in the form of data pop-up displays to indicate that the hosting capacity may be lower
at any given location. As a rule of thumb, the minimum hosting capacity value is indicative of the available
hosting capacity across the length of the feeder and most often defined by the hosting capacity value
located at the most downstream node or lowest operating voltage from the substation. The maximum
hosting capacity value is indicative of the available hosting capacity at a specific location, most often
located at the node closest to the substation. As previously mentioned, existing DERs are not considered
in this stage of the hosting capacity analysis, and the data pop-ups are intended to provide additional
context to the displays. For these reasons, the installed and queued DG values in the data pop-ups have
been included and will be updated on a monthly basis.
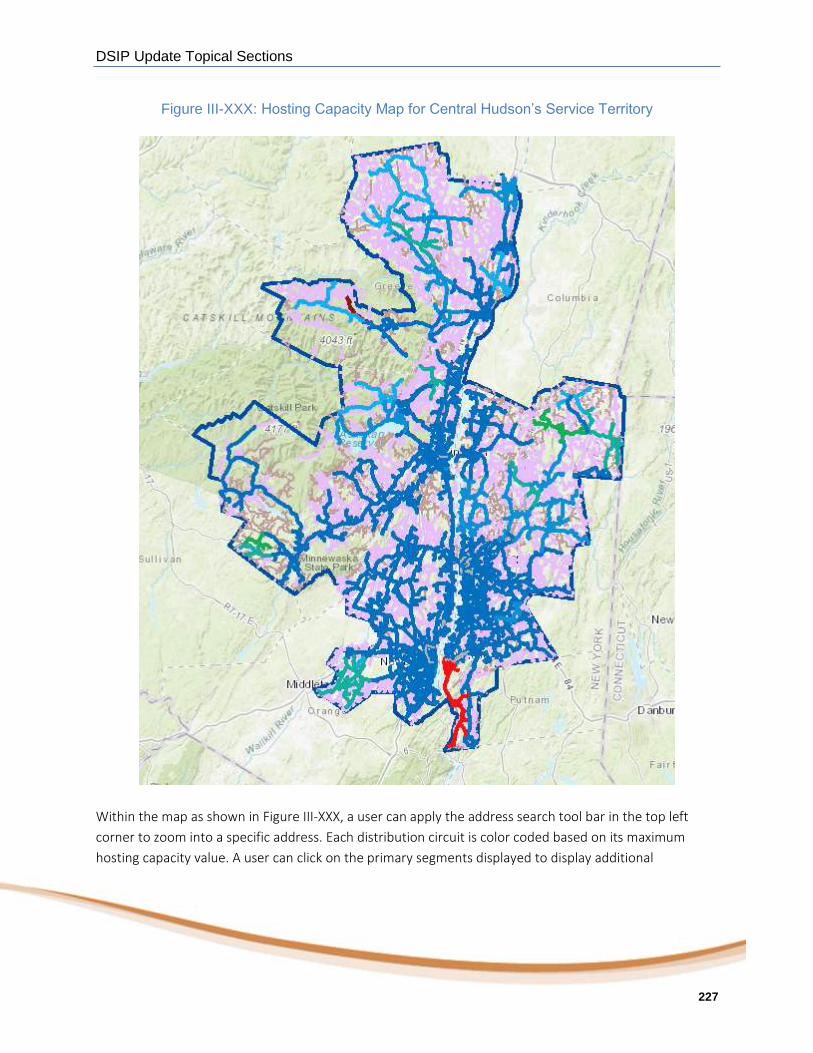
DSIP Update Topical Sections
227
Figure III-XXX: Hosting Capacity Map for Central Hudson’s Service Territory
Within the map as shown in Figure III-XXX, a user can apply the address search tool bar in the top left
corner to zoom into a specific address. Each distribution circuit is color coded based on its maximum
hosting capacity value. A user can click on the primary segments displayed to display additional

DSIP Update Topical Sections
228
information about the circuit including: the circuit’s ID, operating voltage level, number of phases,
minimum and maximum feeder hosting capacity values, as well as interconnected and proposed DG in
queue. Additional information on the substation is also provided including: the substation ID,
interconnected and proposed DG in queue, prior year substation peak, and 3V0 protection status. A
legend can also be found in the top right corner of the map.
The operating voltage may denote voltages below 12kV such as: 2.4kVLine-Gnd, 4.16kVLine-Gnd, 4.8kVdelta, or
7.62kVLine-Gnd. Hosting capacity values, however, are only included for the three phase mainline of
distribution feeders which emanate from a substation operating at 12kV and above. Voltages below 12kV
classification indicate locations served by one or two phases or locations that are located downstream of
a step-down transformer (e.g., transformation from 13.2kV to 4.16kV).
Additional information regarding means and methods for hosting capacity analysis can be found in the
Supplemental DSIP73.
e) The means and methods used for forecasting the future hosting capacity
available at each location in the distribution system.
The detailed means and methods will be determined as forecasting of hosting capacity is further defined
and prioritized within the Hosting Capacity roadmap. Section III.L.2.b) describes required components of a
hosting capacity forecast.
f) How and when the future hosting capacity forecast information provided to
DER developers/operators and other third parties will begin, increase, and
improve as work progresses.
Central Hudson will update the www.cenhud.com/dg website with additional hosting capacity
information and maps as they are available. Additionally, the Joint Utilities as well as Central Hudson will
host stakeholder webinars as needed to roll out new features of the analysis.
73 Supplemental DSIP, pp. 48-61.

DSIP Update Topical Sections
229
g) The utility’s specific objectives and methods to:
(1) identify and characterize the locations in the utility’s service area where limited hosting
capacity is a barrier to productive DER development; and,
(2) timely increase hosting capacity to enable productive DER development at those locations.
While Central Hudson does not have capital funding allocated to specifically increase hosting capacity,
Section III.L.5.a) identifies capital projects and programs in our current capital plans where increasing
hosting capacity will provide an additional benefit and also details our plans to move forward with those
projects and programs. In addition, projects that result in utility upgrades will be provided a construction
schedule for completion, similar to how routine utility capital projects are scheduled.

DSIP Update Topical Sections
230
M. Beneficial Locations for DERs and Non-Wires Alternatives
1. Context and Background
Non-wires alternative (NWA) solicitations are an important mechanism for bringing distributed energy
resources (DERs) onto the system. They offer opportunities for developers to propose innovative
solutions to meet a clearly defined system need, while also driving customer benefits. Collectively, the
Joint Utilities undertook significant efforts in 2017 to advance NWA processes and released several NWA
solicitations to the market. As the volume of opportunities increases, developing uniform NWA suitability
criteria and establishing more consistent solicitation processes may facilitate more NWA opportunities
and make it faster, easier, and cheaper for developers to respond. A key underlying component of this
process is the identification of beneficial locations for DERs and NWAs.
As part of the initial DSIP filing in 2016, Central Hudson worked with consultants to develop a
methodology utilizing probabilistic forecasting to determine location-specific transmission and
distribution avoided costs. This study recognized that to avoid or defer infrastructure upgrades, DERs
need to ramp up at the right time and right place. In addition, the DERs procured must target the right
hours, with the right amount of availability and the right level of certainty so that infrastructure
investments can be deferred. Areas with sufficient load serving capability and areas where local,
coincident peaks are declining are generally not well suited for NWA projects. Likewise, locations may not
be suitable for non-wire projects if the infrastructure investments must take place either because of aging
or failed equipment or because of the need to improve reliability and modernize the grid.
Beneficial locations are areas where loads are growing but there is limited room to accommodate growth.
The results of the 2016 study indicated that, with a few exceptions, most of Central Hudson’s locations
were either experiencing declining loads or had ample room for growth. Locations with a load growth
factor above 100% are experiencing growth and locations where the 2015 loading (peak demand /load
serving capability) was closer to 100% had less room for growth. This approach, however, is overly
simplistic. It does not reflect that, all other things equal, a location with a 3% annual growth rate will
begin to exceed rating in 1/3 the time as a location with a 1% growth rate. It also does not factor in
uncertainty and, in particular, the reality that many growth trajectories are possible and the growth
pattern is less certain further into the future.
To identify beneficial locations, Central Hudson relied on the probabilistic analysis developed as part of
the study. Locations were identified as potentially benefitting from DERs when there was a 5% or greater
likelihood of triggering and infrastructure investment by 2025 (10 years). In total, this included one
transmission area (the RD RJ Lines) and four substations (Coldenham, Lawrenceville, Grimley Road, and
Woodstock). Two of the substations, Lawrenceville and Woodstock, were winter peaking. While the

DSIP Update Topical Sections
231
locations can benefit from DERs, in some instances Central Hudson could provide temporary relief
through load transfer or other low cost steps. For example, roughly 10.6 MW can be transferred from the
RD-RJ Line to neighboring areas, if needed, at a relatively low cost. This may postpone the timing of the
upgrades and their inclusion as NWA projects.
As part of the current DSIP filing, Central Hudson engaged with Demand Side Analytics to further develop
the probabilistic forecasting methodology and complete a new study based on current loading data. The
results of this study are included in Appendix E of this filing.
2. Implementation Plan
a) Current Progress
Identification of Beneficial Locations for DERs and NWAs
As noted, Central Hudson’s 2018 Avoided T&D cost study (see Appendix E) helps Central Hudson
determine beneficial locations for DERs and NWAs on our system. This study focuses on substation and
transmission costs (it does not include circuit feeders) and was designed to meet the following objectives:
Analyze load patterns, excess capacity, load growth rates, and the magnitude of expected
infrastructure investments at a local level;
Develop location-specific forecasts of growth with uncertainty;
Quantify the probability of any need for infrastructure upgrades at specific locations;
Calculate local avoided T&D costs by year and location using probabilistic methods; and
Identify beneficial locations for DERs.
Within this study, the T&D avoided costs estimates being produced are at a local level. The study uses a
bottom‐up approach to quantify historical year‐to‐year growth patterns and the amount of variability in
growth. In addition, load growth forecasts and avoided cost estimates are developed using probabilistic
methods rather than straight‐line forecasts. The approach takes into account the reality that we have
much greater uncertainty ten years out than one year out, and it accounts for the risk mitigation value of
resources that manage local peak loads.
As a general rule, only growth‐related T&D investments that are shared across multiple customers can be
avoided by DERs or demand management. As loads grow, the excess distribution capacity dwindles. If a
customer helps reduce coincident demand, either by injecting power within the distribution grid or by
reducing demand, the unused capacity can accommodate another customer’s load growth, thereby

DSIP Update Topical Sections
232
helping avoid or defer investments required to meet load growth. Avoided or deferred T&D investments
free up capital for other alternate uses, improving the efficient use of resources.
Not all distribution investments are driven by local, coincident peak loads. Some investments are tied to
customer interconnection costs and are essentially fixed. Other investments must take place because of
aging or failed equipment or because of the need to improve reliability and modernize the grid. These
investments typically cannot be avoided by managing loads with DERs.
The value of T&D deferral varies significantly across local system areas because of:
Load growth rates and anticipated changes in load curve shapes, which affect whether growth
related upgrades can be avoided and how long they can be deferred;
The seasonality of the peak load (i.e., summer vs. winter);
The amount of existing excess capacity or the amount of additional load that can be supported
without upgrades;
The magnitude, timing, and cost of projected system upgrades;
The design of the distribution system; and
The ability to make fairly inexpensive operational changes (i.e., switching alternatives) in some
cases to address constraints.
In areas with excess capacity – or areas where local, coincident peaks are declining or growing slowly –
the value of capacity relief can be minimal. In areas where a large, growth‐related investment is
imminent, the value of capacity relief can be quite substantial, especially if it is possible to delay or defer
infrastructure upgrades for a substantial time. However, many Central Hudson areas have declining or
slowly growing loads, or they have sufficient capacity already built such that investments are not needed
in the foreseeable future.
The key findings from the T&D study are:
1. Most substations and transmission areas are experiencing declining loads or have ample room for
growth over the next ten years.
2. The expected avoided costs vary by location, year, season, and hour, and they are highly
concentrated. Avoided costs are realized if additional resources are placed in the right locations
and can deliver load relief at the right times. Without targeting, the value of distributed resources
is diluted.
DSIP Update Topical Sections
233
3. For many distribution substations and transmission areas that have expected growth, the
potential for avoided infrastructure upgrades through DERs is minimal because there is already
sufficient capacity built in the area to meet load growth.
4. The avoided cost estimates reflect the uncertainty in the forecasts and the risk mitigation value of
demand management. Despite a low likelihood of exceeding design rating in the next ten years,
DER resources can provide risk mitigation value at targeted transmission areas and substations if
they are at the right locations, target the right hours, and are available at the right times.
5. In practice, all avoided T&D costs are location specific. For system‐wide untargeted values, the
estimates take into account the likelihood reductions would be in locations with value due to
random chance. Without precise targeting, the likelihood that reductions defer or delay
transmission upgrades is relatively low.
Within the study, locations were identified as potentially benefitting from DERs when there was a 5% or
greater likelihood of triggering an infrastructure investment by 2028 (ten years). In total, no transmission
areas were identified and five substations were identified. While the locations can benefit from DERs, in
some instances Central Hudson can provide temporary relief through distribution load transfers. This is
specifically the case for three of the substations: Woodstock, Maybrook, and Tioronda. For areas that lack
load transfer options for deferring upgrades further, the right type of DERs with the right availability may
allow for deferral of infrastructure investment. This is the case for the other two substations, Hunter and
Lawrenceville. However, both are winter peaking – rather than summer peaking – and therefore cannot
be managed by Dynamic Load Management programs designed for the summer. In addition, in both of
these locations, the top ten usage hours occur during the late evening/night time period. Importantly,
DERs would need to address these winter evening/night time peaks to provide value in these locations.
Our 2016 Avoided T&D Cost Study identified two transmission areas (RD-RJ area and WM area) and three
substation areas as having locational value. Both the RD-RJ and WM areas had low probabilities (< 7%) of
triggering upgrades by 2025. Both of these areas had a reduction in peak load in the 2018 study. In
addition, the RD-RJ projected load growth rate declined, while the WM Area showed only a slight increase
in the projected load growth rate. Based on the updated data, neither area had a greater than 5%
probability of triggering an upgrade in ten years in the current study. Of the three substations identified
in the 2016 study, one is a current NWA (Coldenham) and the remaining two were identified as beneficial
locations in the current study. In comparison to the 2016 study, the 2018 T&D marginal costs are lower
for several reasons, the system peak loads continues to decline, the significant portion of Central
Hudson’s territory that has active non-wire alternative projects, locations with value in the 2016 study no
longer trigger upgrades, improved historical data and cleaning procedures, and additional distributed
energy resources.

DSIP Update Topical Sections
234
NWA Implementation
Through stakeholder engagement in 2017, the Joint Utilities provided third parties with greater
transparency and visibility into the NWA planning and sourcing processes. The planning process is shown
in Figure III-XXXI.
Figure III-XXXI: Joint Utilities Planning Process and Sourcing Overview
Each utility continues to coordinate with the Joint Utilities as part of the DER Sourcing / NWA Suitability
Criteria Working Group to develop RFPs that have a similar structure and supporting information when
possible. RFPs provide the detail necessary for respondents to develop solutions and craft a proposal, and
generally include a detailed project overview. The detailed project overviews may include a description of
the specific need, area of need, and customer demographic information, including annualized
consumption and peak and average billing demand. During the annual planning process in the fall of
2017, each utility identified additional NWA projects that may go out for RFPs in 2018. Table 32
summarizes the Central Hudson RFPs released to date. The demand within these existing NWA areas
represents approximately 16% of Central Hudson’s system peak demand. The Company has identified
two winter-peaking LSRV areas, as discussed in the Avoided T&D Study, which will be evaluated further to
determine if they are appropriate for a future Non-Wires Alternative.
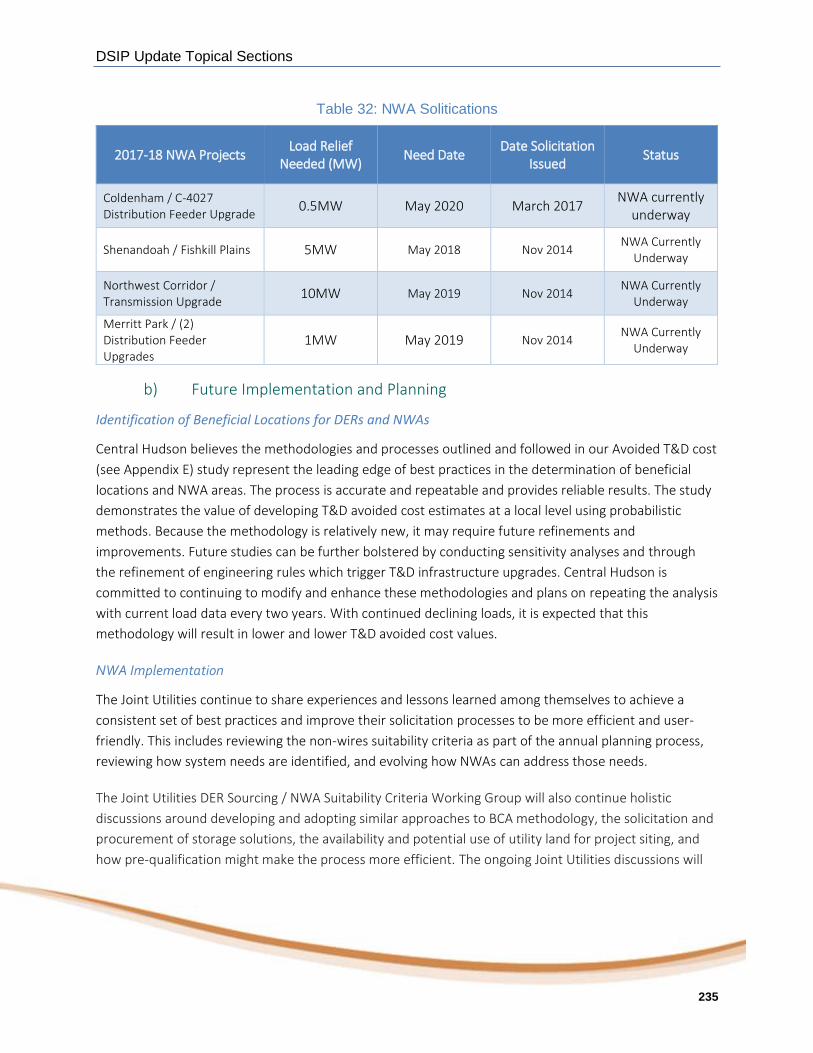
DSIP Update Topical Sections
235
Table 32: NWA Solitications
2017-18 NWA Projects Load Relief
Needed (MW) Need Date
Date Solicitation Issued
Status
Coldenham / C-4027 Distribution Feeder Upgrade
0.5MW May 2020 March 2017 NWA currently
underway
Shenandoah / Fishkill Plains 5MW May 2018 Nov 2014 NWA Currently
Underway
Northwest Corridor / Transmission Upgrade
10MW May 2019 Nov 2014 NWA Currently
Underway
Merritt Park / (2) Distribution Feeder Upgrades
1MW May 2019 Nov 2014 NWA Currently
Underway
b) Future Implementation and Planning
Identification of Beneficial Locations for DERs and NWAs
Central Hudson believes the methodologies and processes outlined and followed in our Avoided T&D cost
(see Appendix E) study represent the leading edge of best practices in the determination of beneficial
locations and NWA areas. The process is accurate and repeatable and provides reliable results. The study
demonstrates the value of developing T&D avoided cost estimates at a local level using probabilistic
methods. Because the methodology is relatively new, it may require future refinements and
improvements. Future studies can be further bolstered by conducting sensitivity analyses and through
the refinement of engineering rules which trigger T&D infrastructure upgrades. Central Hudson is
committed to continuing to modify and enhance these methodologies and plans on repeating the analysis
with current load data every two years. With continued declining loads, it is expected that this
methodology will result in lower and lower T&D avoided cost values.
NWA Implementation
The Joint Utilities continue to share experiences and lessons learned among themselves to achieve a
consistent set of best practices and improve their solicitation processes to be more efficient and user-
friendly. This includes reviewing the non-wires suitability criteria as part of the annual planning process,
reviewing how system needs are identified, and evolving how NWAs can address those needs.
The Joint Utilities DER Sourcing / NWA Suitability Criteria Working Group will also continue holistic
discussions around developing and adopting similar approaches to BCA methodology, the solicitation and
procurement of storage solutions, the availability and potential use of utility land for project siting, and
how pre-qualification might make the process more efficient. The ongoing Joint Utilities discussions will
DSIP Update Topical Sections
236
also focus on the development of similar operational and performance requirements that inform bidders
of the specific expectations and services required to meet the system need and allow bidders to explore
other revenue streams for DERs, where applicable.
The Joint Utilities will continue to invite input from stakeholders through direct discussions and broader
stakeholder engagement meetings. As utilities gain more experience with NWAs, the Joint Utilities see
great value in working together and with stakeholders to make NWA solicitations consistent, repeatable,
and easy-to-use processes for developers.
3. Risks and Mitigation
Any forecasting technique includes inherent risks in terms of overall accuracy. The longer the time period
included within the forecast window, the higher the risk of inaccuracy. No one knows in advance precisely
when loads will exceed design ratings or by how much; however, linear forecasts assume precise
knowledge. In practice, actual growth trajectories are rarely linear and growth patterns trend across time
– both load growth and load declines follow cyclical patterns. Forecasts inherently include uncertainty
and become more uncertain further into the future. Because a linear forecast assumes exact knowledge,
no value is assigned to the years before the linear forecast exceeds the risk tolerance. Probabilistic
methods, on the other hand, reflect the potential reality that infrastructure could be triggered earlier.
Probabilistic methods will assign value to periods earlier than the linear forecast would dictate based on
the probability of triggering an earlier infrastructure upgrade.
Risks are mitigated within the methodology in several ways. The year‐by‐year growth estimates are
estimated using econometric models designed to disentangle year-by-year growth rates from differences
in weather patterns, day of week effects, and seasonality. For the most part, the year-by-year estimates
of growth are relatively precise. Historical year-by-year growth does not follow a linear pattern and varies
around the general trend line. This variation was used to develop the standard error of the forecast,
which reflects how year-to-year growth can vary. This variability or uncertainty in the growth pattern is
critical to probabilistic forecasting. Because growth and declining loads compound over time, growth
patterns can deviate substantially from the straight-line forecast. An area where loads are projected to
remain flat can exceed the load serving capability five to ten years out due to the uncertainty in the
forecast, though the likelihood of doing so is lower than for an area that is growing.
Overall, the probabilistic methods quantify the risk mitigation value of managing demand. The estimates
produced within the report are based on 5,000 simulations of potential load growth patterns for each
substation and transmission area, respectively. For each simulation, we are thus able to assess if the
relevant design rating is exceeded, identify the timing of infrastructure upgrade, quantify the magnitude
of demand reductions needed to avoid the infrastructure upgrade, and calculate what the avoided costs
associated with deferral of infrastructure upgrades would be if demand reductions were in place. The
DSIP Update Topical Sections
237
detailed calculations from each of the simulations at each location are used to estimate the expected
avoided costs per kW/year. That is, the probabilistic method assigns T&D avoided costs when, for
example, only 5% of potential growth trajectories leads to infrastructure upgrades. This approach
quantifies the risk mitigation value provided by resources that reduce demand at the right times at each
location.
4. Stakeholder Interface
The Joint Utilities continue to engage stakeholders to produce useful information about stakeholder
needs and utility plans that have resulted in greater alignment. The Joint Utilities met with stakeholders
twice in 2017 to provide insight into the NWA solicitation processes and request feedback on future
solicitations. A stakeholder engagement meeting on April 20, 2017, in New York City reviewed outcomes
of the 2016 stakeholder engagement process on NWA suitability criteria and DER sourcing and presented
the Joint Utilities’ implementation efforts planned for 2017 based on the commitments made in the
Supplemental DSIP. The meeting included the Joint Utilities’ presentation and discussion of the NWA
sourcing process, which provided stakeholders an opportunity to ask questions and provide input. For
example, the group discussed the time frame for developers to respond to RFPs and generally agreed that
additional time would result in higher quality proposals, recognizing that the appropriate response time
depends on the type, size, and location of the project. Additionally, stakeholders encouraged the use of
broader channels to share announcements of upcoming NWA opportunities, such as industry associations
and conferences, and as a result some utilities have implemented this suggestion. The Joint Utilities value
the input received from stakeholders through the engagement meetings and will continue to incorporate
the feedback into their processes as they evolve.
As another example, stakeholders suggested that a central portal with links to each utility’s NWA
opportunities would be a valuable resource. In response, the Joint Utilities published webpages with links
to utility-specific portals that contain notifications of NWA opportunities and NWA RFPs:
Central Hudson webpage (https://www.cenhud.com/workingwithus/non-wires-alternative-
opportunities)
Joint Utilities of New York central data portal (http://jointutilitiesofny.org/utility-specific-
pages/nwa-opportunities/)
REV Connect (https://nyrevconnect.com/non-wires-alternatives/)
The Joint Utilities also hosted a stakeholder meeting via webinar on November 9, 2017, to discuss
challenges in past solicitations and identify potential improvements to the RFP process. During this
session, the Joint Utilities shared some of the challenges that surfaced during current solicitations and
DSIP Update Topical Sections
238
how they are addressing these challenges to improve the NWA RFP process. A key objective for the
webinar was to learn more about the experiences of stakeholders who have participated in the NWA RFP
processes. Stakeholders expressed value in regular communication during the solicitation process,
requested clear and specific requirements about system need and the supporting information, and
emphasized the need for clarity around the award process.
Prior to the webinar, the Joint Utilities offered stakeholders the opportunity to provide feedback through
focused discussions regarding their experiences with the NWA RFP process. The prior conversations with
the DER developer community were captured into organized presentations which helped facilitate more
productive two-way discussion on the topics presented during the webinar. A summary of the questions
and responses captured during the webinar is posted on the Joint Utilities website.74
As the NWA solicitation process evolves, the Joint Utilities will continue to hold focused conversations
with stakeholders regarding the information available, requested, and useful for both utilities and
developers to allow for efficient and repeatable market transactions.
Due to the unique circumstances of Central Hudson’s service territory, which is characterized by flat to
declining load and areas with ample capacity for growth, only four NWA opportunities have been
identified since the initiation of REV. As indicated previously, the demand in these four NWA areas
represent 16% of the Central Hudson peak system demand. No solicitations have occurred within the past
year which would have allowed Central Hudson to integrate process improvements which resulted from
the stakeholder engagement process. The Company strives to integrate such improvements in future
solicitations, however.
5. Additional Detail
a) The resources provided to developers and other stakeholders for:
(1) accessing up-to-date information about beneficial locations for DERs and/or energy
efficiency measures; and,
As indicated, Central Hudson utilizes the results of our avoided T&D cost study to identify and evaluate
both beneficial locations and locations in the distribution system where a NWA compromising one or
more DERs and/or energy efficiency measures could reduce, delay, or eliminate the need for upgrading
distribution infrastructure and/or materially benefit distribution system operations. Appendix E provides
the details of the methodologies utilized and the results of our current study. Central Hudson completes
these studies every two years.
74 http://jointutilitiesofny.org/joint-utilities-of-new-york-engagement-groups/

DSIP Update Topical Sections
239
The locational data is available within this study and is inputted into a GIS based web-mapping application
that is available to all stakeholders on the System Data portal on Central Hudson’s Website at
www.cenhud.com/dg. This application provides a geographical representation of the beneficial locations
including the serving substation and circuits.
(2) efficiently sorting and filtering locations by the type(s) of capability needed, the timing and
amount of each needed capability, the type(s) and value of desired benefit, the serving
substation, the circuit, and the geographic area.
Due to the unique circumstances of Central Hudson’s service territory, which is characterized by flat to
declining load and areas with ample capacity for growth, only four NWA opportunities have been
identified since the initiation of REV. As indicated previously, the demand in these four NWA areas
represent 16% of the Central Hudson peak system demand. With this limited number of projects, there
has not yet been a need to develop a process in which stakeholders are provided with advanced
searching capabilities.
b) The means and methods for identifying and evaluating locations in the
distribution system where:
(1) a NWA comprising one or more DERs and/or energy efficiency measures could timely
reduce, delay, or eliminate the need for upgrading distribution infrastructure and/or materially
benefit distribution system reliability, efficiency, and/or operations; and/or,
Central Hudson utilizes the results of our avoided T&D cost study to identify and evaluate both beneficial
locations and locations in the distribution system where a NWA compromising one or more DERs and/or
energy efficiency measures could reduce, delay, or eliminate the need for upgrading distribution
infrastructure and/or materially benefit distribution system operations. Appendix E provides the details of
the methodologies utilized and the results of our current study. Central Hudson completes these studies
every two years. Based on the results of the current study, no transmission areas and five substations
were identified as potential beneficial locations. Temporary relief through distribution load transfers can
be performed for three of the substation locations. For the other two substations, Hunter and
Lawrenceville, the right type of DERs with the right availability may allow for deferral of infrastructure
investment. However, both are winter peaking – rather than summer peaking – and therefore cannot be
managed by Dynamic Load Management programs designed for the summer. These two areas will either
be eligible for LSRV compensation or will be leveraged to develop an overall system wide relief value
(DRV).
DSIP Update Topical Sections
240
(2) one or more DERs and/or energy efficiency measures could reduce, delay, or eliminate the
need for upgrading bulk electric system resources and/or materially benefit bulk electric
system reliability, efficiency, and/or operations.
The NYISO completes a Reliability Needs Assessment (RNA) to determine both the transmission and
resource adequacy and the transmission security of the New York Control Area (NYCA) bulk power
transmission system. Along with Central Hudson’s own analyses, the results of the RNA are utilized to
determine the adequacy and security of Central Hudson’s portion of the NYCA bulk power transmission
system. The RNA is completed every two years and looks out across a ten year horizon. As part of the
NYISO process, the NYISO solicits market-based and alternative regulated proposals from interested
parties to address any identified reliability needs. The NYISO will also designate one or more Responsible
Transmission Owners to develop a regulated backstop solution to address each identified reliability need.
The most current RNA did not identify any resource adequacy needs or any Central Hudson transmission
security needs.
c) Locations where energy exported to the system, or load reduction, would
be eligible for:
(1) compensation under the utility VDER Value Stack tariff;
(2) utility dynamic load management programs, including the Commercial System Relief
Program, Distribution Load Relief Program, and Direct Load Control Program;
(3) and/or, increased value-based customer incentives for energy efficiency measures with
load profiles that align with the system needs through utility energy efficiency programs or New
York State Energy Research and Development Authority’s (NYSERDA) Clean Energy Fund (CEF)
programs, while ensuring utility-NYSERDA coordination.
Central Hudson’s avoided T&D cost study (see Appendix E) identifies beneficial locations where energy
exported to the system, or load reduction, would potentially be eligible for compensation under the
utility VDER Value Stack tariff. Based on the results of the current study, no transmission areas and five
substations were identified as potential beneficial locations. Temporary relief through distribution load
transfers can be performed for three of the substation locations. For the other two substations, Hunter
and Lawrenceville, the right type of DERs with the right availability may allow for deferral of infrastructure
investment. However, both are winter peaking – rather than summer peaking – and therefore cannot be
managed by Dynamic Load Management programs designed for the summer. In addition, in both of these
locations, the top ten usage hours occur during the early morning/late evening/night time period. These
two areas will either be eligible for LSRV compensation or will be leveraged to develop an overall system
wide relief value (DRV).

DSIP Update Topical Sections
241
Central Hudson’s Dynamic Load Management portfolio is comprised exclusively of the Commercial
System Relief Program (CSRP). Customers are eligible to enroll a minimum of 50kW of load reduction
anywhere in Central Hudson’s service territory in accordance with the program tariff.75 Load reductions
are calculated using a Customer Baseline Load or “CBL” methodology76, similar to the NYISO SCR program.
This methodology compares event day load to the customer’s predicted load based an analysis of their
load during comparable days and other factors. There is currently no restriction on energy export
contributing to performance. Energy export is simply treated as negative load within the performance
calculation. Because a CBL methodology is used, however, energy export would need to be incremental
to that which occurs outside of CSRP event hours to make a positive contribution to performance.
Central Hudson’s Energy Efficiency programs have traditionally been system-wide programs which are
implemented consistently throughout the geography of the Company’s service territory. It is possible,
however, to leverage additional value streams within NWA areas in order to enhance incentives or other
operational aspects of the program in the interest of increase or accelerate Energy Efficiency penetration.
Central Hudson is currently assessing this strategy within multiple NWA areas.
75 https://www.cenhud.com/static_files/cenhud/assets/demandresponse/CSRP%20Tariff%202017.pdf
76 https://www.cenhud.com/static_files/cenhud/assets/pdf/CBL%20Methodology%202016.pdf

DSIP Update Topical Sections
242
N. Procuring Non-Wires Alternatives
1. Context and Background
Non-wires alternatives (NWAs) are an important vehicle for deploying distributed energy resources
(DERs) via market mechanisms, which is a core policy goal of REV and a critical aspect of DSP 1.0. NWAs
offer opportunities to defer or avoid a subset of traditional “wires” investments, potentially resulting in
cost savings for customers and/or environmental benefits while maintaining system reliability and
resiliency. NWAs are defined as any action or strategy that addresses the defined system need while
deferring, reducing, or eliminating the need to construct or upgrade distribution infrastructure. They are
identified as part of the Avoided T&D Cost Study and the annual capital planning process and can be
sourced through RFPs, auctions, sole source contracts, and other procurement vehicles.
2. Implementation Plan
a) Current Progress
The Company has made significant progress in increasing NWA opportunities and improving the
solicitation process. All projects in the capital plan that met the suitability criteria and were deemed
feasible as NWA candidates were posted on the Company’s website and advanced for consideration for
the solicitation process, which is discussed further in the Section III.M Beneficial Locations for DERs and
Non-Wires Alternatives.
In 2017, the Joint Utilities shared additional information with stakeholders on the NWA identification and
evaluation process in order to improve transparency and support developers’ business planning. For
example, the Joint Utilities submitted two filings in 2017 related to NWA suitability criteria and NWA
sourcing processes. The first, submitted March 1, 2017, provided utility-specific guidance for the three
criteria included in the common Supplemental DSIP NWA suitability criteria framework: project type,
timeline, and cost.77 To provide greater developer insight into the planning and sourcing processes, the
Joint Utilities submitted another filing on May 8, 2017, which addressed the Commission’s directive to
describe “how the Suitability Criteria will be incorporated into utility planning procedures, and how and
when the Suitability Criteria will be applied to projects in their current capital plans.”78 This filing
describes the end-to-end process for identifying and sourcing NWAs, including the capital planning
77 DSIP Proceeding, Joint Utilities Utility-Specific Implementation Matrices For Non-Wires Alternatives Suitability Criteria (filed March 1, 2017)(“March 1 Filing”).
78 DSIP Proceeding, DSIP Order, p. 32.
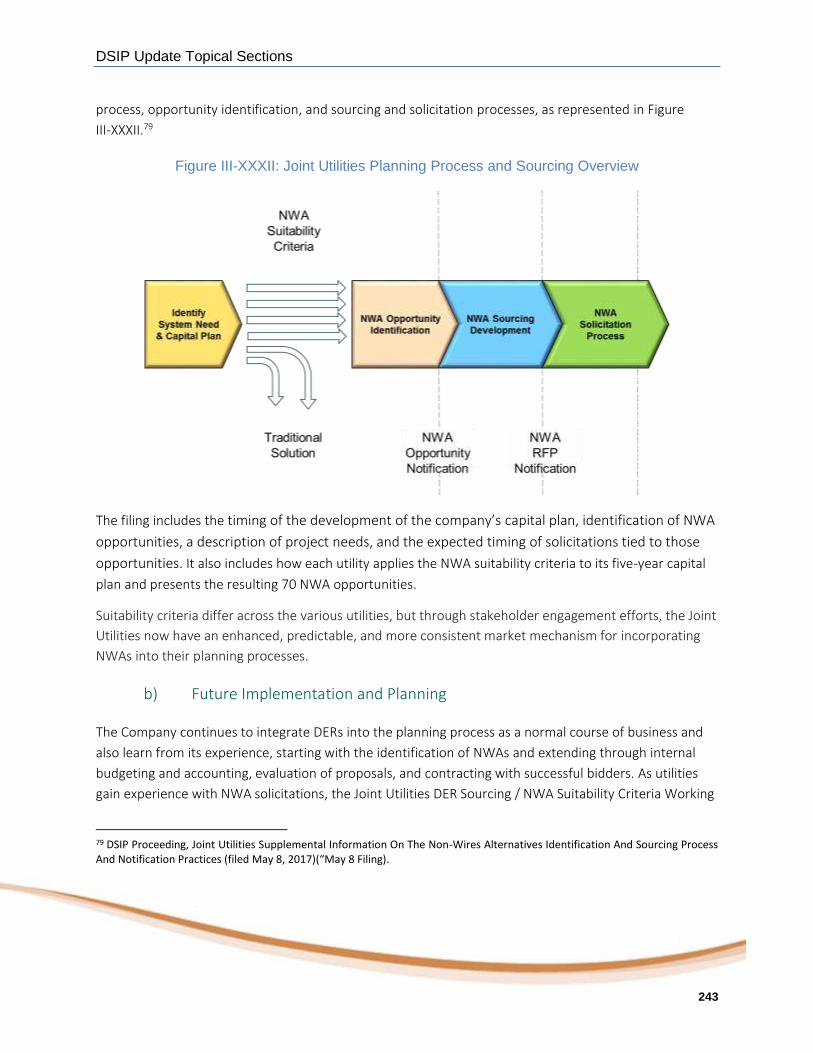
DSIP Update Topical Sections
243
process, opportunity identification, and sourcing and solicitation processes, as represented in Figure
III-XXXII.79
Figure III-XXXII: Joint Utilities Planning Process and Sourcing Overview
The filing includes the timing of the development of the company’s capital plan, identification of NWA
opportunities, a description of project needs, and the expected timing of solicitations tied to those
opportunities. It also includes how each utility applies the NWA suitability criteria to its five-year capital
plan and presents the resulting 70 NWA opportunities.
Suitability criteria differ across the various utilities, but through stakeholder engagement efforts, the Joint
Utilities now have an enhanced, predictable, and more consistent market mechanism for incorporating
NWAs into their planning processes.
b) Future Implementation and Planning
The Company continues to integrate DERs into the planning process as a normal course of business and
also learn from its experience, starting with the identification of NWAs and extending through internal
budgeting and accounting, evaluation of proposals, and contracting with successful bidders. As utilities
gain experience with NWA solicitations, the Joint Utilities DER Sourcing / NWA Suitability Criteria Working
79 DSIP Proceeding, Joint Utilities Supplemental Information On The Non-Wires Alternatives Identification And Sourcing Process And Notification Practices (filed May 8, 2017)(“May 8 Filing).

DSIP Update Topical Sections
244
Group will review NWA suitability criteria annually and propose modifications to the criteria, if
appropriate. This working group will also engage stakeholders to review any proposed changes to the
suitability criteria and provide justifications and objectives for making any changes.
Targeted Demand Response
The Company is currently in the process of implementing four Non-Wires Alternatives, as described in
Section III.N of this document. Three of those Non-Wires Alternatives have been combined and are being
implemented jointly as the Company’s “Targeted Demand Response” Program or “CenHub Peak Perks”.
Combined, the Company aims to achieve a localized peak load reduction of 16MW across the three areas
(see Figure III-XXXIII).
Figure III-XXXIII: CenHub Peak Perks Map
Table 33 illustrates the load reductions that have been achieved as of the end of the 2017 control season.
The Company anticipates achieving the full 16MW target by the end of 2019.
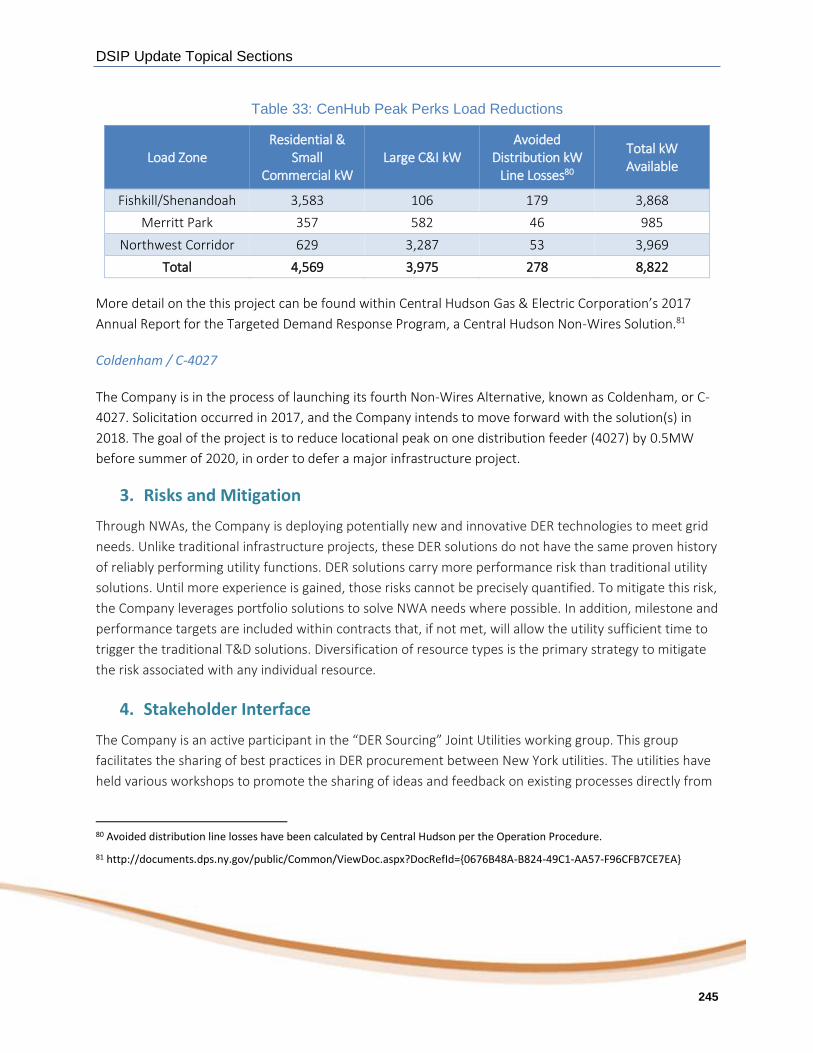
DSIP Update Topical Sections
245
Table 33: CenHub Peak Perks Load Reductions
Load Zone Residential &
Small Commercial kW
Large C&I kW Avoided
Distribution kW Line Losses80
Total kW Available
Fishkill/Shenandoah 3,583 106 179 3,868
Merritt Park 357 582 46 985
Northwest Corridor 629 3,287 53 3,969
Total 4,569 3,975 278 8,822
More detail on the this project can be found within Central Hudson Gas & Electric Corporation’s 2017
Annual Report for the Targeted Demand Response Program, a Central Hudson Non-Wires Solution.81
Coldenham / C-4027
The Company is in the process of launching its fourth Non-Wires Alternative, known as Coldenham, or C-
4027. Solicitation occurred in 2017, and the Company intends to move forward with the solution(s) in
2018. The goal of the project is to reduce locational peak on one distribution feeder (4027) by 0.5MW
before summer of 2020, in order to defer a major infrastructure project.
3. Risks and Mitigation
Through NWAs, the Company is deploying potentially new and innovative DER technologies to meet grid
needs. Unlike traditional infrastructure projects, these DER solutions do not have the same proven history
of reliably performing utility functions. DER solutions carry more performance risk than traditional utility
solutions. Until more experience is gained, those risks cannot be precisely quantified. To mitigate this risk,
the Company leverages portfolio solutions to solve NWA needs where possible. In addition, milestone and
performance targets are included within contracts that, if not met, will allow the utility sufficient time to
trigger the traditional T&D solutions. Diversification of resource types is the primary strategy to mitigate
the risk associated with any individual resource.
4. Stakeholder Interface
The Company is an active participant in the “DER Sourcing” Joint Utilities working group. This group
facilitates the sharing of best practices in DER procurement between New York utilities. The utilities have
held various workshops to promote the sharing of ideas and feedback on existing processes directly from
80 Avoided distribution line losses have been calculated by Central Hudson per the Operation Procedure.
81 http://documents.dps.ny.gov/public/Common/ViewDoc.aspx?DocRefId={0676B48A-B824-49C1-AA57-F96CFB7CE7EA}

DSIP Update Topical Sections
246
DER developers and other stakeholders. This feedback is utilized to optimize procurement procedures
and optimize the participation experience of developers. The Company makes every effort to provide the
most detailed information available directly to prospective DER providers through RFPs. For each
solicitation, the Company will respond to specific questions and discuss topics requested by stakeholders
during a pre-bid conference.
Detailed information on past and current solicitations can currently be found on the REV Connect
website82, the Joint Utility website83, and Central Hudson’s website84.
5. Additional Detail
a) How the NWA procurement process works within utility time constraints
while enabling DER developers to properly prepare and propose NWA solutions
which can be implemented in time to serve the system need.
The timing of system needs factors into the suitability of an NWA solution being considered for that need.
The Company continually monitors the T&D system to identify potential areas which could benefit from
an NWA solution, as described in Section III.N of this document. When a need is identified that meets the
criteria, the Company strives to begin the solicitation for a NWA to meet that need as early as practicable.
b) The NWA procurement means and methods; including:
(1) how the utility and DER developers time and expense associated with each procurement
transaction are minimized;
(2) the use of standardized contracts and procurement methods across the utilities.
To enhance the DER integration process, the Joint Utilities continue to share lessons learned from
developing and implementing specific NWA RFPs (including supporting data) and resultant contract terms
and conditions. This helps to work towards a similar approach to procurement across the utilities. For
example, a successful NWA contract will clearly state assumptions, incentives, and expectations for the
intended use of the resource by the utility, constraints a resource may have to generate additional
revenue streams through participating in other markets (e.g., wholesale), operational and commercial
requirements including expected performance and corresponding payment terms. In terms of payment
guidelines, the utility must clearly outline payment duration and schedule and include language that holds
82 https://nyrevconnect.com/non-wires-alternatives/[nyrevconnect.com]
83 http://jointutilitiesofny.org/utility-specific-pages/nwa-opportunities/
84 https://www.cenhud.com/workingwithus/non-wires-alternative-opportunities

DSIP Update Topical Sections
247
DER vendors accountable for commercial payment and ensures bids include the cost of any security
instruments required. Through information sharing across the utilities, the Joint Utilities have agreed that
contracts should also include clear and consistent use of key terms and descriptions regarding the NWA
DER vendor’s market participation, regardless of payment cadence. Draft non-wires contracts are
intended to be released with the RFPs and included publically on the Company’s website.
While other utilities are working through initial NWA solicitations and contract negotiations, Central
Hudson has a contract in place for our initial three NWA areas and are in negotiations for our fourth. At
this time, Central Hudson agrees with the Joint Utilities that developing and using a standardized contract
is premature as solicitation and contracting lessons are still being learned, but the JU will continue to
share best practices for issuing contracts and implementing procurement methods.
c) Where, how, and when the utility will provide a resource to DER developers
and other stakeholders for accessing up-to-date information about current NWA
project opportunities. For each opportunity, the resource should describe the
location, type, size, and timing of the system need to be addressed by the project.
Detailed information on past and current solicitations can currently be found on the REV Connect
website85, the Joint Utility website86, and Central Hudson’s website87.
d) How the utility considers all aspects of operational criteria and public policy
goals when selecting which DERs to procure as part of a NWA solution.
Considerations for selection a solution for a NWA include:
Is/are the solution(s) cost effective? What benefits/costs are associated with each solution? Cost
effectiveness is determined in accordance with the BCA Handbook (see Appendix H).
How reliably will the solution(s) meet the operational needs? The main factors considered are:
o Coincidence: Does the solution perform when needed? If so, to what extent?
o Dispatch: Is the resource dispatchable? If so, what limits to the frequency and duration of
dispatch exist?
85 https://nyrevconnect.com/non-wires-alternatives/[nyrevconnect.com]
86 http://jointutilitiesofny.org/utility-specific-pages/nwa-opportunities/
87 https://www.cenhud.com/workingwithus/non-wires-alternative-opportunities
DSIP Update Topical Sections
248
o Intermittency: Is the solution available only intermittently? If so, how is that
intermittency characterized? Does the resource need to be “de-rated” to account for
intermittency?
o Limitations: What general and technical limitations exist for this DER?
o Timing: Can the solution be operational in time to meet a forecasted need?
o Technology: Is the solution viable? If so, Central Hudson remains technology agnostic.
How timely is the need? What is the risk to the T&D system associated with failure to meet the
identified need? If the initial solution is unsuccessful, what is the risk to the T&D system
associated with finding a replacement technology?
Will any solution(s) help this NWA meet additional policy objectives in addition to meeting its
primary grid need?
How does this NWA impact the Company’s public relations? Does it engage customers? If so, how
many and to what degree? Will the NWA improve customers’ opinion of Central Hudson?
e) Where, how, and when the utility will provide DER developers and other
stakeholders with a resource for accessing up-to-date information about all
completed and in-progress NWA projects. The information provided for each
project should:
(1) describe the location, type, size, and timing of the system need addressed by the project;
(2) describe the location, type, size, and provider of the selected alternative solution;
Detailed information on past and current solicitations can currently be found on the REV Connect
website88, the Joint Utility website89, and Central Hudson’s website90.
(3) provide the amount of traditional solution cost which was/will be avoided;
Central Hudson does not provide this information, because the Company believes doing so would have a
negative impact on the solicitation and procurement process. The traditional solution competes with DER
88 https://nyrevconnect.com/non-wires-alternatives/[nyrevconnect.com]
89 http://jointutilitiesofny.org/utility-specific-pages/nwa-opportunities/
90 https://www.cenhud.com/workingwithus/non-wires-alternative-opportunities

DSIP Update Topical Sections
249
solutions just as solution providers compete with each other by providing confidential bids through a
solicitation.
Costs may only be provided after the NWA need is sufficiently met to account for the possibility that all or
part of the need may still need to be procured after the original solicitation in the event the primary
solution is unsuccessful.
(4) explain how the selected alternative solution enables the savings; and,
Detailed benefit cost analyses are developed in collaboration with DPS Staff and ultimately filed with the
Department of Public Service as part of a Non-Wires Alternative project. Due to the sensitive nature of
these analyses, these filings are confidential.
(5) describe the structure and functional characteristics of the procurement transaction
between the utility and the solution provider(s).
The nature of the desired pricing arrangement between Central Hudson and its providers is described in
some detail within each RFP. Each contract, however, is vendor specific and reflects the unique needs of
the particular project.

Other DSIP-Related Information
250
Other DSIP-Related Information
251
IV. Other DSIP-Related Information A. DSIP Governance
a) Describe the DSP’s scope, objectives, and participant roles and
responsibilities. A participant could be a utility employee, a third party supporting
the utility’s implementation, or a party representing one or more stakeholder
entities.
As has been previously defined within REV, the DSP is segregated into three main functional areas:
Distribution Planning, Distribution Grid Operations and Distribution Markets.
Central Hudson’s 2018 DSIP filing provides an opportunity for the Company to share with interested
stakeholders the progress to date and the roadmap going forward of key initiatives within these three
main functional areas. Organizationally, Central Hudson has aligned functional responsibility under two
groups heads: the Senior Vice President of Engineering and System Operations and the Senior Vice
President of Customer Services and T&D Operations. The responsibilities under the SVP of Engineering
include all responsibilities associated with Distribution Planning, Distribution Grid Operations and
Distribution Market policy including integration and coordination with wholesale markets. The
responsibilities under the SVP of Customer Services include more of the market function and customer
engagement initiatives including NWA solicitations and implementations, demonstration projects, and
development of service and rate offerings to enhance the customer experience. While these
organizations work collaboratively, we feel strongly that functionally separating the planning and
operations functions from the market implementation functions is important. This organizational
construct is very similar to how we operate today with transmission planning and operations and the
wholesale markets.
In order to best coordinate with the Joint Utilities and receive valuable input from stakeholders, Central
Hudson has been an active participant and played a leadership role in the Joint Utility REV leadership
Tram and the DSP steering Committee. Additionally, Central Hudson has been active under ten functional
implementation working groups that fall under the Steering Committee which include the
Interconnection Technical Working Group and Interconnection Policy Working Group. These coordinated
efforts have been invaluable in providing a streamlined forum for stakeholder participation, utility
collaboration, and information sharing as well as receiving valuable input from our consultant who has
the benefit of pulling in experiences from other jurisdictions.

Other DSIP-Related Information
252
b) Describe the nature, organization, governance, and timing of the work
processes that comprise the utility’s current scope of DSP work. Also describe and
explain how the work processes are expected to evolve over the next five years.
Workflow diagrams that show significant internal and external dependencies will
be especially useful.
As described above, Central Hudson has implemented an organizational structure that segregates the
distribution planning and operations functions from market operations functions. As was detailed in the
System Planning and Grid Operations sections of the report, the Company is in the midst of a multiyear
implementation of its foundational investments which include Distribution Automation, Distribution
Management System and Network Strategy, communication backbone. The completion of these
initiatives is currently projected to occur at the end of 2021; detailed timelines are included in the Grid
Operations Section. Aligned with the completion of these investments is the buildout and staffing of the
Transmission and Distribution Operations Center. Due to the complexity of managing and operating a
distribution system with a significant penetration of DERs and two-way power flows, the Company has
recognized the need to put in place a new Control center as well as develop the resources and the
procedures necessary to operate this much more dynamic and complex grid. Highlighted in the Grid
Operations Section (Section III.C) is a project timeline for the Operations Center as well as the Electric
Distribution System Operations Whitepaper, which lays the groundwork for the Company’s current vision
of the major operational policy and resource changes needed to make this transition. With regard to
Distribution Markets, the Company continues to develop improvements that allow us to better interact
and improve customer engagement. In addition, the JU have shared their DSP roadmap of how we
anticipate these markets will evolve over time. Staff’s issued Guidance for 2018 DSIP Updates includes an
additional joint filing at a later date on DSP Market Design and Integration. We anticipate that we will
continue to collaboratively work Staff and the JU group to more clearly develop a roadmap for how the
distribution level markets will evolve.
c) Identify and describe in detail the tools (i.e. project management,
collaboration, and content management software) and information resources
currently employed internally by the utility and/or presented for stakeholder use.
Also describe and explain how the tools and information resources are managed
and how they are expected to evolve over the next five years.
Throughout the report, we have identified the numerous tools that the Company has implemented or is
in the process of implementing for both internal and stakeholder use. Internal tools include the utilization
of probabilistic planning tools and the ongoing implementation of the Distribution Management System.
With regard to external facing tools, the Company has recently deployed a new Interconnection Online

Other DSIP-Related Information
253
Application Portal meeting the requirements established by the Commission. It is anticipated that
functionality will be enhanced over time as additional requirements are defined. The Company has also
established a comprehensive web based system data portal. This data portal provides detailed 8760
historical data and forecasts, including probability-banded load data at both the transmission area and
substation area as well as facility ratings. Information is also provided on probabilistic forecasts of DERs at
the same level. Our CenHub platform provides a location for customers to get information on program
offerings including energy efficiency projects and ideas and various rate offerings that are available.
Through the JU stakeholder process, we have been responsive to providing additional information that
stakeholders have identified as being valuable and is also consistent with Customer and System data
security requirements. A comprehensive listing of the tools is provided in Appendix B.
d) Describe the Joint Utilities of New York Website contents and functions
which support aspects of the utility’s implementation program. Provide specific
examples to explain how those contents and functions help both the utility and its
stakeholders.
As indicated above, the Joint Utilities collectively maintain and regularly update their website
(www.jointutilitiesofny.org) with valuable resources for interested parties. For example, a summary of
current Joint Utilities DSP enablement activities is posted to the website homepage each month to keep
third parties informed of company efforts to advance DSP implementation. The Joint Utilities have also
enhanced their website by developing central portals with utility-specific links for hosting capacity,
system data, and NWA opportunities. These efforts have helped to increase transparency, usability, and
availability of information. The granularity and availability of information provided on the website has
been improved through targeted conversations with DER developers as part of the implementation team
stakeholder efforts, such as the system data business use case focused discussions described in Section
III.G. The website also serves as a valuable repository for stakeholder information, providing key policy
and regulatory documents, detailing past stakeholder meetings, summarizing inputs that stakeholders
have previously provided and next steps for addressing them, and providing links to other resources such
as REV Connect. The Joint Utilities welcome suggestions to enrich the website through their email address

Other DSIP-Related Information
254
e) Describe and explain the planned sequence and timing of key DSP
management activities and milestones. Using calendars, Gantt charts, and
narrative text, provide information addressing management functions,
collaborative processes (stakeholder engagement and Joint Utilities coordination,
for example), and development and maintenance of program tools and
information resources.
As described in Section IV.A.a), the DSP implementation efforts at Central Hudson have been segregated
under the SVP of Engineering and SVP of Customer Services with the goal to segregate the planning and
operations functions from the market functions. The activities are well coordinated between these two
organizations as well as with the JU work efforts. The specific timing of the efforts underway at Central
Hudson have been outlined in detail in the report and highlighted again in Section IV.A.b).
In the 2016 DSIP Order, the Commission directed that the DSIP process should include active
collaboration among utilities, stakeholders, and the Department of Public Service Staff to promote the
transition of the utilities to DSPs.91 Building on the structure established in 2016 and in the course of the
preparation of the Initial DSIPs and the Supplemental DSIP, the Joint Utilities have continued to
collaborate effectively to enhance communication channels with stakeholders to develop the 2018 DSIP
filings.
To support consistency across the companies, the Joint Utilities aligned around a common definition of
the platform, which includes the three core DSP services of DER integration, information sharing, and
market services. Information and updates organized around these three aspects of the platform were
presented in a conference with stakeholders on November 30, 2017. The Joint Utilities then developed a
common outline for the 2018 DSIP filings in order to align with the requests for information provided in
the May 2018 DSIP Guidance to make it easier for stakeholders to access the same information across
company filings. The companies also shared timelines and key milestones for filing development in order
to support continued comparison and consistency.
In 2017 and the first six months of 2018, the Joint Utilities focused on implementation efforts based on
commitments made in the Supplemental DSIP and individual 2016 DSIP filings. The Joint Utilities
maintained nine implementation working groups. These groups allowed the companies to share
information, jointly develop consistent methodologies and Joint Utilities filings, and work with
stakeholders to solicit feedback on those methodologies and filings. As a result, the approaches described
in the 2018 DSIP filings have greater uniformity and stakeholders will experience DSPs and market
functions that are more consistent across the companies. For example, hosting capacity displays will
91 DSIP Order, p 2.

Other DSIP-Related Information
255
include the same information and visual elements across companies. To support these collaborative
processes across the six companies, the Joint Utilities retained ICF to provide project management office
functions and technical expertise, as well as coordination of the implementation working groups and
related stakeholder engagement efforts.
The Joint Utilities also continued to collaborate on stakeholder engagement, both through the
stakeholder Advisory Group as well as through meetings organized around specific topics across the nine
working groups.92 The 2017 implementation teams and stakeholder engagement meeting schedule are
summarized in Figure IV-I.
Figure IV-I: 2017 Stakeholder Engagement Efforts
As the companies advanced development of the DSIPs into 2018, the Joint Utilities continued to engage
stakeholders, as needed, parallel to the working group efforts. Each company is holding utility-specific
meetings with stakeholders in the third quarter of 2018, and the Joint Utilities anticipate holding a larger
stakeholder conference in the fourth quarter of 2018 to discuss implementation efforts since the DSIP
filings and preview plans for 2019. The anticipated stakeholder engagement efforts for 2018 are
summarized in Figure IV-II.
92 The Advisory Group, made up of about 15 representative companies, is an open forum for stakeholders who are actively engaged in the REV process and the DSIP filings to advise the Joint Utilities on a productive and collaborative stakeholder engagement process.

Other DSIP-Related Information
256
Figure IV-II: Anticipated 2018 Stakeholder Engagements Efforts
f) Describe and explain the planned sequence and timing of the notable
activities, dependencies, milestones, and outcomes affecting implementation.
Using calendars, Gantt charts, and narrative text, provide information addressing
all significant utility processes, resources, and capabilities. Explain how each
notable outcome enables one or more significant DSP applications.
The Company’s 2018 DSIP filing provides significant details on the timing and key milestones of a number
of initiatives that are currently under way. On a summary basis, the key initiatives within the Planning and
Operations functional areas include:
Enhanced capabilities related to probabilistic forecasting including the granular forecasting of DERs;
Improvements in Hosting Capacity analysis including the Stage 2 refresh and Stage 3 implementation;
Continued improvements to the Interconnection Online Application Portal with enhanced automation;
Completion of the implementation of the foundational investments of Distribution Automation, Distribution Management System and Network Strategy enterprise communication infrastructure;

Other DSIP-Related Information
257
Development of the new Transmission and Distribution Primary Control Center; and
Development and Implementation of the policies and procedures and resource needs identified in the Distribution System Operations Whitepaper.
With regard to Markets and Customer engagement, there is a significant number of activities that are
being coordinated through the JU efforts. These include:
Continued implementation of aggressive energy efficiency programs that are economically justified;
Continued solicitation and implementation of NWA opportunities;
Improving the process of accurately compensating DERs through participate in the VDER phase 2 proceeding;
Actively participating in the implementation of the Energy Storage Roadmap and identifying roles for utilities to play and defining use cases that actually provide customer value;
Actively participating in the Electric Vehicle proceeding and help to develop rate structures that foster adoption but are consistent with the goals of REV of improving system load factor; and
Defining reasonable standards for customer data and cyber security that allow for active participation without the threat of security and data breaches.
Continued efforts with the NYISO either through the Joint Utility efforts or other stakeholder forums to develop rules and reduce barriers to allow DER to participate in the wholesale market.

Other DSIP-Related Information
258
B. Marginal Cost Study/Avoided T&D Cost Study
Central Hudson has updated its Location Specific Transmission and Distribution Avoided Cost Study as
part of the 2018 DSIP filing. The focus of the study is in quantifying the T&D costs associated with an
increase or decrease of kW coincident with location-specific peaks. The study focuses on substation and
transmission costs (it does not include circuit feeders) and was designed to meet the following objectives:
Analyze load patterns, excess capacity, load growth rates, and the magnitude of expected
infrastructure investments at a local level;
Develop location-specific forecasts of growth with uncertainty;
Quantify the probability of any need for infrastructure upgrades at specific locations;
Calculate local avoided T&D costs by year and location using probabilistic methods; and
Identify beneficial locations for DERs.
There are several aspects of the study that make it unique. First, the T&D avoided cost estimates are
produced by substation and transmission area. Most T&D marginal cost and avoided costs studies
produce system-wide values or region-specific results, often concentrating on historical T&D
expenditures rather than future infrastructure investments. Second, the study estimates historical year‐
to‐year growth patterns and variability in growth for individual substations and transmission areas. Third,
load growth forecasts and avoided cost estimates are developed using probabilistic methods rather than
straight‐line forecasts. The approach takes into account the reality that there is much greater uncertainty
ten years out than one year out, and it accounts for the risk mitigation value of resources that manage
local peak loads.
As a general rule, only growth‐related T&D investments that are shared across multiple customers and a
small subset of reliability based projects can be avoided by DERs or demand management. When loads
grow, the excess distribution capacity that may exist dwindles. If a customer helps reduce coincident
demand, either by injecting power within the distribution grid or by reducing demand, the unused
capacity can accommodate another customer’s load growth, thereby helping avoid or defer investments
required to meet load growth. Avoided or deferred T&D investments free up capital for other alternate
uses, improving the efficient use of resources.
Not all investments are driven by local, coincident peak loads. Some investments are tied to customer
additions and are essentially fixed. Other investments must take place because of aging or failed

Other DSIP-Related Information
259
equipment or because of the need to improve reliability and modernize the grid. These investments
typically cannot be avoided by managing loads with DERs.
The value of transmission and distribution deferral varies significantly across local system areas because
of:
Load growth rates and anticipated changes in load curve shapes, which affect whether growth
related upgrades can be avoided and how long they can be deferred;
The seasonality of the peak load (i.e., summer vs. winter);
The amount of existing excess capacity or the amount of additional load that can be supported
without upgrades;
The magnitude, timing, and cost of projected distribution upgrades;
The design of the distribution system; and
The ability to make fairly inexpensive upgrades (i.e., switching alternatives) in some cases to
address constraints.
In areas with excess capacity – or areas where local, coincident peaks are declining or growing slowly –
the value of capacity relief can be minimal. In areas where a large, growth‐related investment is
imminent, the value of capacity relief can be quite substantial, especially if it is possible to delay or defer
infrastructure upgrades for a substantial time. However, many Central Hudson areas have declining or
slowly growing loads or they have sufficient capacity already built, since the system peak of 1295 MW
was set in 2016 and system load has dropped significantly since that time, such that investments are not
needed in the foreseeable future.
In 2016, Central Hudson implemented the first location-specific avoided T&D cost study that relied on
probabilistic analysis and quantified the option value of reducing peak demand. This study updates the
avoided T&D Costs. In comparison to the 2016 study, the 2018 T&D marginal costs are lower for these
primary reasons:
Two of the transmission areas with value in the 2016 study had relatively low probability of T&D
upgrades 10 years out. As a result of lower forecasts in these areas the triggering of upgrades no
longer occurs
The system peak loads continue to decline due to the continued economic decline in the Hudson
Valley;

Other DSIP-Related Information
260
Growth rates were based on a longer period of data, 2010-2017, and additional data cleaning
procedures were implemented; and
To a much lesser extent, additional distributed energy resources have been installed since 2016,
lowering the need for incremental resources.
Central Hudson’s 2018 Location Specific Transmission and Distribution Avoided Costs report can be
found as Appendix E.
There is currently no avoided transmission cost value in the Central Hudson territory. A total of two
substations have potential avoided costs – Hunter, Lawrenceville. The two substations are adjacent,
winter peaking, and near a winter resort area. Table 34 shows the results of the Avoided T&D Cost
study and the levelized system value.
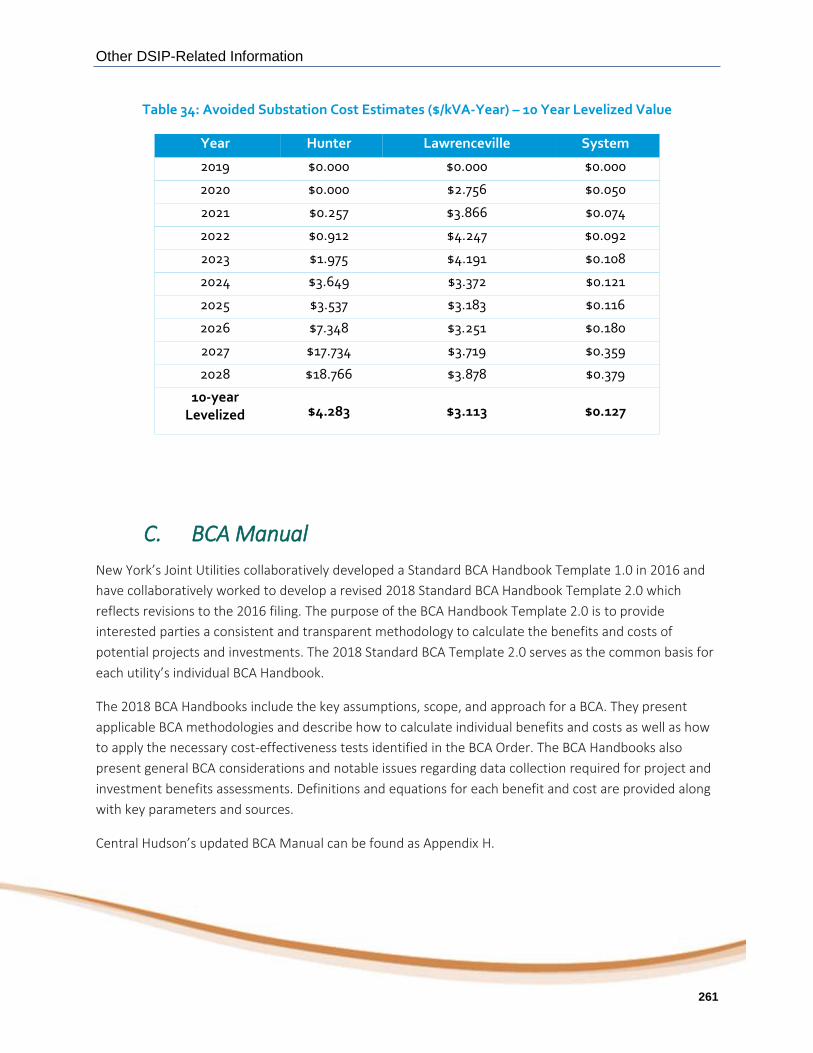
Other DSIP-Related Information
261
Table 34: Avoided Substation Cost Estimates ($/kVA‐Year) – 10 Year Levelized Value
Year Hunter Lawrenceville System
2019 $0.000 $0.000 $0.000
2020 $0.000 $2.756 $0.050
2021 $0.257 $3.866 $0.074
2022 $0.912 $4.247 $0.092
2023 $1.975 $4.191 $0.108
2024 $3.649 $3.372 $0.121
2025 $3.537 $3.183 $0.116
2026 $7.348 $3.251 $0.180
2027 $17.734 $3.719 $0.359
2028 $18.766 $3.878 $0.379
10-year Levelized $4.283 $3.113 $0.127
C. BCA Manual
New York’s Joint Utilities collaboratively developed a Standard BCA Handbook Template 1.0 in 2016 and
have collaboratively worked to develop a revised 2018 Standard BCA Handbook Template 2.0 which
reflects revisions to the 2016 filing. The purpose of the BCA Handbook Template 2.0 is to provide
interested parties a consistent and transparent methodology to calculate the benefits and costs of
potential projects and investments. The 2018 Standard BCA Template 2.0 serves as the common basis for
each utility’s individual BCA Handbook.
The 2018 BCA Handbooks include the key assumptions, scope, and approach for a BCA. They present
applicable BCA methodologies and describe how to calculate individual benefits and costs as well as how
to apply the necessary cost-effectiveness tests identified in the BCA Order. The BCA Handbooks also
present general BCA considerations and notable issues regarding data collection required for project and
investment benefits assessments. Definitions and equations for each benefit and cost are provided along
with key parameters and sources.
Central Hudson’s updated BCA Manual can be found as Appendix H.

Appendices
262

Appendices
263
V. Appendices

Appendices
264
A. Load and DER Forecast

Appendices
265
B. Tools and Information Sources
The following is a listing of the various tool and information resources, and links to the various web
pages for DER developers and customers to access the information:
Central Hudson Gas & Electric Corporation - www.cenhud.com
Distributed Generation Links - www.cenhud.com/dg
Interconnection Application Documents - www.cenhud.com/dg
Application Portal - www.cenhud.com/dg
Interconnection Technical Requirements - www.cenhud.com/dg
Interconnection Queue - www.cenhud.com/dg
Interconnection FAQs - www.cenhud.com/dg
System Data Links
Hosting Capacity Map - www.cenhud.com/dg
System Data Portal - www.cenhud.com/dg
Joint Utilities - http://jointutilitiesofny.org/system-data/
Electric Vehicles Link - www.cenhud.com/electricvehicles
Programs and Incentives - www.cenhud.com/electricvehicles
Consumer Information - www.cenhud.com/electricvehicles
Charging - www.cenhud.com/electricvehicles
FAQs - www.cenhud.com/electricvehicles
Energy Efficiency - www.cenhud.com/energyefficiency
Programs - www.cenhud.com/energyefficiency
Appendices
266
Savings Central - http://www.savingscentral.com/
Consumer information - www.cenhud.com/energyefficiency
CenHub Store - https://www.cenhubstore.com/
Capital Plan Link - http://jointutilitiesofny.org/system-data/
Reliability Data Link - http://jointutilitiesofny.org/system-data/
Related REV Proceedings
The following is a listing of the related NYS PSC proceedings and efforts underway:
In the Matter of Distributed System Implementation Plans (Case 16-M-0411)
In the Matter of the Value of Distributed Energy Resources (“VDER”) (Case 15-E-0751)
VDER Working Group Regarding Value Stack (Matter 17-01276)
VDER Working Group Regarding Rate Design (Matter 17-01277)
VDER Low Income Working Group Regarding Low and Moderate Income Customers
Matter 17-01278)
Proceeding on Motion of the Commission Regarding Electric Vehicle Supply Equipment and Infrastructure (Case 18-E-0138)
In the Matter of Offshore Wind Energy (Case 18-E-0071)
In the Matter of Energy Storage Deployment Program (Case 18-E-0130)
In the Matter of Utility Energy Efficiency Programs (Case 15-M-0252)
In the Matter of the Utility Energy Registry (“UER”) (Case 17-M-0315)
Whole Building Energy Data Aggregation Standard (Cases 16-M-0411 and 14-M-0101)

Appendices
267
C. Long Range Electric System Plan

Appendices
268
D. Electric Distribution System Operations Whitepaper

Appendices
269
E. Location Specific T&D Avoided Cost Study Report

Appendices
270
F. Central Hudson Storage Pilot Project Final Report

Appendices
271
G. EV Readiness Framework
Appendices
272
H. Benefit Cost Analysis (BCA) Handbook

Appendices
273
I. Sample Distribution Automation Study