centre for geo-information - wur
TRANSCRIPT

Centre for Geo-Information Thesis Report GIRS-2005-017
LAND USE CHANGES IN MOROBE PROVINCE 1975 – 2000
PAPUA NEW GUINEA
Tine Fabian Ningal
May
200
5

Land Use Changes in the Morobe province 1975 – 2000
Papua New Guinea
Tine Fabian Ningal Registration number 67 04 22 605 060
Supervisors:
Prof. Dr. Ir. Arnold K. Bregt
Dr. Alfred E. Hartemink
John Stuiver
A thesis submitted in partial fulfillment of the degree of Master of Science at Wageningen University and Research Centre, The Netherlands.
May 2005 Wageningen, The Netherlands
Thesis code number: GRS-80337 Wageningen University and Research Centre Laboratory of Geo-Information Science and Remote Sensing Thesis Report: GIRS-2005-017

………....… Dedicated to my late parents for all the inspiration, dedication and encouragements …..........

Acknowledgement The work in this thesis would not have been possible without the help and support from a number of important people and organizations. First, I would like to thank my three dynamic supervisors, Prof. Dr. Ir. Arnold K. Bregt, Mr. John Stuiver and Dr. Alfred E. Hartemink. You were all pleasant to work with, Prof. Bregt for keeping accurate dates for meetings and creating a pleasant atmosphere in your office during meetings, Dr. Hartemink for suggesting the topic of this thesis and for the sharp eyes in pointing out anomalies in results. John’s expert knowledge in ArcInfo and Oracle that streamlined the processing is particularly acknowledged and applauded. It was a privilege to work with you all as supervisors. Next, I would like to acknowledge the support of my employer, PNG University of Technology for releasing me for study. Then, I would like to thank the study advisor for MGI, Mr. Willy ten Haaf for his worthy efforts in making adjustments to my course schedule when I had to return to PNG for my mother’s funeral. On this note, I would also like to express my gratitude to the Dean for International students; Carla Haenen for encouragement, assistance and friendliness. Then I would like to extend my appreciation to my course mates for the friendship, support and collaboration. Your voices and faces will fade but your impressions would live on. I would like to acknowledge the friendships of Taye Mengesha, Angela Kros, Jie Li, Jun Wang, Lucie Homolova, Worku Zwedie, Elisa Liras, Jochem Verrelst, Teshome Esethe, Ernesto Bastidas, Marc Vis, Babs Stuiver and many more there is no space for all. I would like to thank the staff of CGI in Alterra for occasional support, the ICT personal for keeping the computers running and Cartography section for assisting me in scanning all the topographic maps. Others that I cannot omit are Dr. Michael Govorov from Guelp University, Ontario, Canada for support and advice, David Freyne with European Commission in Port Moresby for sending the topographic maps, Ripa Karo for publications on PNGRIS and Forestry. I particularly thank Dr. Bryant Allen from Australian National University (ANU) for supplying much needed data and answering my questions about land use in PNG. I am indebted to you all. Finally, I would like to acknowledge the silent patience exhibited by my two young sons, Junior and Edwin during the long separation. I am proud of you two. Last but not least, many thanks go Marlous for all the support.
Acknowledgement ii

Abstract Land use change is an ongoing and dynamic phenomenon as a result of human interactions with environment and from natural forces. Population, technology and affluence are regarded as the three main forces that can influence land use change in any society. Papua New Guinea (PNG) is a developing nation with a growing population that relies mainly on agriculture. About 97% of the total land is owned and controlled by the people who have intimate knowledge and relationships with their environment. More than 85% of the total population lives in the rural areas and depends on subsistence agriculture. Although there is documented evidence of agricultural practices in the highlands of PNG dating back thousands of years, studies on land use and land use change have begun only in the early fifties. Studies on land use hitherto have revealed weak relationship between land use change and population growth on a national scale. This draws questions for more detail studies with appropriate datasets to gain a better understanding on land use changes. Therefore, this study focuses on Morobe province as a representative with the objective to determine if there is a significant relationship between population growth and land use change from 1975 to 2000. To achieve the objective, topographic data of 1975, Landsat TM images of 1990 and 2000 over Morobe province are used to represent land use conditions for the respective dates. Population data for the same period are georeferenced to Resource Mapping Unit (RMU) polygons and are assumed to be equally distributed. RMU boundary is defined by landform, rock type and altitude, hence, forms the Minimum Mapping Unit (MMU) in this study. Land use for the different dates are digitized and geometrically intersected by spatial operations with RMU, and the areas are updated by computing area statistics per RMU in ArisFlow, ArcInfo, Oracle RDBMS and ArcGIS environments. Land use change criteria are defined and by means of relational SQL queries, land use and population change tables are created in Oracle from which land use type change and population per RMU are derived. The result showed that agriculture gained significantly from the loss in forest. Some of the areas gained by agriculture indicate high land use intensity and high population density. However, there are other areas that show significant population growth but no corresponding expansion in agriculture. The correlation between population growth and agriculture change appears to be a weak one as the growth in population is twice the expansion in agriculture. It can be assumed that the land is used more intensively and expansions into new areas are governed by ownership rights, technology and ecological constraints such as slope, altitude, temperature, rainfall, soil type et cetera. Other classes show little variations with gains in grassland, plantation and urban while water experienced loss. Keywords: Land use change, Land use intensity, population growth, Morobe province, Resource Mapping Unit (RMU), GIS, Remote Sensing, spatial overlay, processing, SQL, analysis, correlation.
Abstract iii

Acronyms and abbreviations
Acronyms
AGSYST Agricultural Systems
AIDAB Australian International Development Assistance Bureau (now
AusAID)
ANU Australian National University
AusAID Australian Agency for International Development (formerly AIDAB)
CSIRO Commonwealth Scientific and Industrial Research Organization
DAL Department of Agriculture and Livestock
DSLS Department of Surveying & Land Studies
FARMSYS Farming Systems
FIMS Forest Inventory & Mapping Systems
FMU Forest Mapping Unit
MASP Mapping Agricultural Systems Project
NMA National Mapping Agency/Authority
NMB National Mapping Bureau (NMA in PNG)
NSO National Statistical Office (PNG)
PNG Papua New Guinea
PNGRIS Papua New Guinea Resource Information System
UNITECH University of Technology
Abbreviations AGD66 Australian Geodetic Datum 1966
AMG Australian Map Grid
GIS Geographic Information System
MMU Minimum Mapping Unit
RDBMS Relational Database Management System
TM Thematic Mapper
UTM Universal Transverse Mercator
UN United Nations
WGS84 Wold Geodetic System 1984
Acronyms and Abbreviations iv
Table of Contents ACKNOWLEDGEMENT ....................................................................................................................II ABSTRACT ......................................................................................................................................... III ACRONYMS AND ABBREVIATIONS............................................................................................ IV TABLE OF CONTENTS ......................................................................................................................V LIST OF FIGURES............................................................................................................................VII LIST OF TABLES............................................................................................................................ VIII LIST OF APPENDICES..................................................................................................................... IX CHAPTER 1 - INTRODUCTION .................................................................................................1
1.1 BACKGROUND .........................................................................................................................1 1.2 PROBLEM DEFINITION ..............................................................................................................2 1.3 OBJECTIVES .............................................................................................................................3 1.4 STIPULATIVE DEFINITION FOR LAND USE CLASSES ...................................................................3 1.5 STRUCTURE OF THESIS ............................................................................................................4
CHAPTER 2 - LITERATURE REVIEW .....................................................................................5 2.1 LAND USE CHANGE ..................................................................................................................5 2.2 INTERACTIONS BETWEEN CANDIDATE DRIVING FORCES OF LAND USE CHANGE .......................5 2.3 METHODS OF DETERMINING LAND USE CHANGE ......................................................................6 2.4 REVIEW ON LAND USE CHANGE IN PNG...................................................................................7 2.5 COMPARING LAND USE WITH OTHER TROPICAL COUNTRIES.....................................................9 2.6 PNG AT A GLIMPSE................................................................................................................11
CHAPTER 3 - DATASETS OVER STUDY AREA...................................................................15 3.1 TOPOGRAPHIC MAPS ..............................................................................................................15 3.2 SATELLITE - LANDSAT THEMATIC MAPPER IMAGES ..............................................................15 3.3 RESOURCE MAPPING UNIT (RMU) ........................................................................................16 3.4 AUXILIARY DATASETS ...........................................................................................................16
3.4.1 Population ........................................................................................................................16 3.4.2 Agriculture Systems of PNG (AGSYS) ..............................................................................16 3.4.3 Forest Inventory Mapping System (FIMS) .......................................................................17
3.5 DATA PREPARATION ..............................................................................................................17 3.5.1 Topographic maps for T1 Land Use .................................................................................18 3.5.2 Satellite images for T2 and T3 Land Uses........................................................................18 3.5.3 Digitizing land use classes................................................................................................18 3.5.4 Land use class transformations ........................................................................................19 3.5.5 Land use class assignment................................................................................................20
CHAPTER 4 - METHODOLOGY ..............................................................................................22 4.1 STUDY AREA – MOROBE PROVINCE.......................................................................................22
4.1.1 General description ..........................................................................................................22 4.1.2 Climate and Topography ..................................................................................................25 4.1.3 Resources indicators.........................................................................................................26 4.1.4 Land use systems ..............................................................................................................26
4.2 METHOD ................................................................................................................................27 4.2.1 Data processing................................................................................................................30 4.2.2 Analysis.............................................................................................................................34
CHAPTER 5 - RESULTS AND DISCUSSION..........................................................................35 5.1 RESULTS ................................................................................................................................35
5.1.1 General land use and population changes........................................................................35 5.1.2 Changes by land use type and population ........................................................................36 5.1.3 Correlation Surface between Changes .............................................................................37
List of Figures v

5.1.4 Changes in hotspots..........................................................................................................39 5.2 DISCUSSION ...........................................................................................................................40
5.2.1 General result ...................................................................................................................40 5.2.2 Correlation between population and land use changes....................................................40 5.2.3 Observed trend .................................................................................................................41 5.2.4 Possible Implications........................................................................................................42 5.2.5 Discussion on the methods used in this study ...................................................................43
CHAPTER 6 - CONCLUSION ....................................................................................................44 REFERENCES .....................................................................................................................................46 APPENDICES ......................................................................................................................................50
List of Figures vi

List of Figures
Figure 1.1. Location map of PNG. ........................................................................................................1 Figure 2.1. Regions, provinces and towns of PNG.............................................................................11 Figure 2.2. Population growth in PNG by urban and rural sectors.................................................13 Figure 3.1. Data pre-processing...........................................................................................................17 Figure 3.2. Before and after images using 5x5 filters to smooth classified images..........................18 Figure 3.3. Disjointed land use objects in T1 merged into a single object in T2 ..............................21 Figure 3.4. Land use object in T1 disappeared in T2..........................................................................21 Figure 3.5. Emergence of new land use objects in T2 ........................................................................21 Figure 3.6. Example of a new feature (red) intersecting over two land use types...........................21 Figure 4.1. Location of study area.......................................................................................................22 Figure 4.2. Population and area by districts ......................................................................................23 Figure 4.3. General reference map of Morobe. ..................................................................................24 Figure 4.4. Rainfall and elevation of Morobe....................................................................................26 Figure 4.5. Land use classification schema.........................................................................................27 Figure 4.6. Overview of conceptual methodology..............................................................................29 Figure 4.7. General Land use change Entity Relationship (ER) diagram. ......................................30 Figure 4.8. Union function in spatial overlay (adopted from ESRI ArcGIS manual) ...................31 Figure 4.9. ER diagram for computing statistics ..............................................................................32 Figure 4.10. ER diagram for creating Cartesian product and multi-attribute table.....................32 Figure 4.11. SQL representation of computing change tables in Oracle RDBMS.........................34 Figure 5.1. Change classification for thematic maps, a-f, h (%), (g) ordinal scale .........................37 Figure 5.2. Different change correlations between land use and population ..................................38 Figure 5.3. Areas considered being hotspots for Population and agriculture .................................39
List of Figures vii

List of Tables Table 2-1.Natural hazards and environmental issues .......................................................................10 Table 2-2. Comparison of population and land use with 6 countries in the Tropics ......................10 Table 3-1. Appearance of Features on Composite Images. (Adapted and modified from
www.earthsat.com) ......................................................................................................................19 Table 3-2. Land use feature change possibilities................................................................................20 Table 5-1. Summary statistics of land use and population changes .................................................35 Table 5-2. Land use From To change matrix ..................................................................................36
List of Tables viii

List of Appendices Appendix A: Land problems related to population growth.............................................................50 Appendix B: Topographic map sheets of 1975 for Time 1 (T1) .......................................................51 Appendix C: Clipped Landsat image of 1990 for Time 2 (T2) .........................................................52 Appendix D: Clipped Landsat image of 2000 for Time 3 (T3) .........................................................53 Appendix E: The concept of RMU.....................................................................................................54 Appendix F: Resource Mapping Units (RMU) of Morobe...............................................................55 Appendix G: Detailed data processing steps .....................................................................................56 Appendix H: Data flow of input, processing, and output.................................................................57 Appendix I: ArisFlow data action model for computing land use areas ........................................58 Appendix J: ArisFlow data action model for creating and converting tables to Oracle tables ....59 Appendix K: Creating intermediate tables for land use change computation in Oracle ..............60 Appendix L: SQL script for generating change tables.....................................................................61 Appendix M: ArisFlow data action model for converting change tables from Oracle to info
tables .............................................................................................................................................65 Appendix N: Land use change matrix in km2 ....................................................................................65 Appendix O: Land use intensity and villages of Morobe ..................................................................66 Appendix P: Comparison of changes in Population and Agriculture..............................................66 Appendix Q: TIN of Morobe in elevation (meters) ...........................................................................67 Appendix R: Annual rainfall in Morobe ............................................................................................68 Appendix S: Soil types in Morobe.......................................................................................................69 Appendix T: Using forest concession areas to assess loss in forest and gain in agriculture...........70
List of Appendices ix

Chapter 1 - Introduction
1.1 Background Papua New Guinea, (PNG) lies 6 degrees south of the Equator and 147 degrees east of Greenwich Meridian, (Figure 1.1). PNG comprises more than 600 islands and covers a total area of 474,000 square kilometres. The population in 2000 national census was over 5 million according to the National Statistical Office (URL 1).
Figure 1.1. Location map of PNG.
PNG’s geographic location and social structure supports a diverse bio-physical and cultural diversity (Sem, 1995). Forests cover more than 70% of the total land area (Saunders, 1993) and 97% of the land is owned and used for subsistence agriculture by tribal groups; 3% is in the hands of the state and private sector (Pat, 2003). Tribal groups comprise of clans in tribal hierarchies (White, 1965) and differ in languages and customs. There are more than 800 different languages although Pidgin-English (unofficial national language) is spoken by most Papua New Guineans. More than 80% of the population lives in rural areas and depends on subsistence agriculture for food production (URL 2; Pat, 2003). Studies on land use change in tropical countries emphasis on utilizing satellite remote sensing (Townshend, 1987; Pahari, Umezaki et al., 2001; and Epema, Botoro, 2000). Developers of Papua New Guinea Resource Information System (PNGRIS) focused on developing a database system that links a mapping interface to serve predefined
Introduction 1

maps from custom queries (McAlpine, 1998). Others advocate integrating Remote Sensing and GIS in monitoring land use change (Venkatachalam, 1991; Vicar, 1991). Previous studies carried out on land use and land cover change in PNG differed in scope and objectives (DSLS, 2000) and made little use of the combined potential of GIS and Remote Sensing. However, the approach used to determine the changes were GIS oriented where spatial operations were performed on vector layers and tables computed to determine the magnitude of changes. All studies tend to focus on either GIS or Remote Sensing with little overlap. The TREES II project carried out by PNG University of Technology utilized both GIS and Remote Sensing but targeted at major logging areas. This study will use both GIS and Remote Sensing techniques to quantify land use changes in Morobe province.
1.2 Problem definition The population of PNG has increased from 2.3 million in 1975 to 5.2 million in 2000 (URL 1- National Statistical Office of PNG). Since 85% of the total population lives in rural areas and depends on subsistence agriculture, food production must increase to meet the population’s needs (Macfarlane, 2000; Pat, 2003). More land is required for cultivation to maintain food supply. When PNGRIS database was updated with 1980 and 1990 rural census and land use information to 1996 using Landsat imagery, the area for food production showed an increase by 10% (McAlpine et al., 2000). Between 1980 and 1990 the total population grew by 25% and rural population by almost 20% (Bellamy et al., 1995). Between 1975 and 1996, rural population grew by 40-50%. Land use appears to expand less significantly. There tends to be intensification and continuous cultivation with little or no fallow. A study on agricultural systems in PNG by Bourke reported that in the early 1980s and mid 1990s, there were few major land use changes, although population grew more than 20% in the same period (Bourke et al., 1998). It was anticipated there will be continuing changes in agricultural systems, but no major changes for the next 10-15 years. Therefore, the question is how can food production, supply, and distribution support the growing population without significant land use change? Although PNG’s population is increasing rapidly, population density is low, if not the lowest compared to other countries of comparable land area (URL 4). Complex and sensitive land ownership systems inhibit uniform land policy implementations by the government (URL 2; URL 3; Pat, 2003; Windybank, 2003; Appendix A). PNG differs from other countries from the assumption that high population density is a proxy for increased agricultural land use (Kok, 2004). More research effort to asses and evaluate land use change and relating to population growth has been suggested by
Introduction 2

Sem (1995). An approach combining GIS and Remote Sensing is reported to be on the agenda of PNGRIS developers for future implementation (B.J. Allen, ANU - personal communication, 2004). Therefore, there is a need for research to determine land use change in relationship to population growth. This research is relevant for PNG and the results could be useful for planning and support decision-making by authorities. One of the aims of this study is to utilize GIS and Remote Sensing techniques to quantify land use change in order to gain specific information on a provincial level.
1.3 Objectives The main objective of this research is: To quantify land use change in the Morobe province of PNG between 1975 and 2000 using GIS and remote sensing techniques. To achieve the main objective, the following questions are relevant: 1. Which data are relevant to evaluate and determine land use change? 2. How can the available data be used to quantify land use change? 3. What is the land use change in Morobe? 4. How can the changes be explained?
1.4 Stipulative definition for land use classes In this research, land use is understood to be a specific piece of land that relates to human activity or economic function. • Agriculture areas are gardens under cultivation and/or abandoned gardens in
fallow between 5-15 years. Fallow period could be more than 15 years according to Bourke et al., (1998). Rural populated areas are in this category as they generally engage in subsistence and cash crop small holder activities and cannot be distinguished for a separate class.
• Areas with sago stands are classed under forests as they could not be discerned on the images. These areas provide staple food source for populations in wetland areas, (Bellamy and McAlpine, 1995)
• Grassland and savannah are caused by human activities like cultivation followed by regular burning/hunting or are naturally occurring such as high altitude plateaus. Grassland areas under fallow or inhabited by man are not included in this class but come under agriculture class.
Introduction 3

• Urban areas have a population of more than 3000 people with infrastructural facilities and services. Rural sub-district headquarters are classed as urban for their administrative functions. The minimum number of population in urban centres is 3000 (URL 7: City Population - PNG).
• Plantations are areas planted with food and non-food crops. Non-food crops are forest plantations while food crops are sugar cane, coconut, cocoa, coffee, and tea.
• Forests areas are undisturbed areas. Other less significant areas like quarry, mining and bare land are grouped into forests as forest tend to dominate at 30 meter resolution.
1.5 Structure of Thesis This thesis comprises six chapters. Chapter 1 covers the background, research problem, objective, and land use definitions for this study. Chapter 2 reviews land use change in general and PNG in particular by elaborating on past works relating to land use and land cover change. Chapter 3 deals with data collection, description, and preparation for processing and analysis (research question 1). The methodology (research question 2) is treated in chapter 4 which covers study area and method used. Various physical and demographic characteristics like, geography, climate, resources, demography, and land use systems are discussed under study area. The method describes the steps carried out to determine land use change phenomena. In chapter 5, the results (research question 3) are presented with a discussion (research question 4) based on the results. Chapter 6 concludes the report, followed by references and appendices.
Introduction 4
Chapter 2 - Literature review
2.1 Land use change Land use and land cover change is dynamic in nature and caused by various natural and cultural forces interacting with the environment. While natural forces relate to naturally occurring events like floods, earthquakes, volcanoes, land slips, tsunamis etc, human-induced forces can be grouped into six categories: population; level of affluence; technology; political economy; political structure; and attitudes and values (URL5). Others broadly classify these forces as human institutions, population size and distribution, economic development and technology among others (Loveland et al., 2003). Environmental factors that pose constraints on land use are: soil characteristics, climate, topography, and vegetation. Human activities that cause land cover change result from a wide range of objectives (Turner, 1993). These objectives range from local to global and individual to collective such as the need for food, living space, recreation or for large scale development. The amount of land used is determined by ownership rights and structures of power. Other factors such as population density, level of economic and social development also place demand on land while technology influences the intensity of exploitation. These are by no means exhaustive and depending on the environmental, historical, and social contexts, there can be a myriad of incentives that motivate different land use approaches. While land use change is often a driver of environmental and climate changes, a changing climate can in turn affect land use (Loveland et al., 2003).
2.2 Interactions between candidate driving forces of land use change The environmental condition and changes observed result from the interaction between the driving forces coupled with climatic conditions over time. Out of the possible six human-induced forces driving land use changes, the first three; population, level of affluence and technology relate to the impact (I) on environment expressed as I=PAT where (I) is considered to be a function of population (P), affluence (A) and technology (T) (Commoner, 1972). It is a common assumption that population growth has a direct relationship to land use changes, hence a contribution towards environmental damage (Ambio, 1992). This is because accurate worldwide population data are available for statistical assessment. Other studies using the same data disagreed that population change is the cause of environmental changes (Boserup, 1965, 1981; Ehrlich and Ehrlich, 1990, 1988 and Simon, 1981). This illustrates the complexity in trying to establish the geophysics of
Literature Review 5

climate with the socioeconomic drivers of land use change using a single driver; for instance: population. At the regional scale, several studies relate population growth and deforestation in developing countries in the tropics although the findings and methods have been questioned (URL5). Other studies on comparative assessments of population and land use suggest that population growth is positively associated with the expansion of agricultural land and deforestation but the relationships are weak and dependent on inclusion or exclusion of statistical outliers (Geores et al., 1991). A study by Zaba (1991) on Africa concluded that population density was related to agricultural expansion and intensification everywhere, but only in some regions to deforestation. Detailed studies of specific regions for example, modelling exercises with Amazonian data indicate subtle and varying relationships (O'Neill, 1992; Skole, 1992). The interactions of population, affluence, and technology as causes of environmental change shows that direct association of affluence or technology with land use change is not common. This is due to lack of globally comparative data for statistical assessments. Furthermore, the levels of affluence or technology do not by themselves govern human-environment relationships and population plays a pivotal role (URL5). The role of technology as a potential cause of land use change places different demands for different natural resources. The other three forces are: political economy, which includes the systems of exchange, ownership, and control; political structure, involving the institutions and governing organizations, and attitudes and values of individuals and groups. The candidate driving forces within these categories have received much less attention than population growth because they do not encompass clearly defined variables and causal relationships.
2.3 Methods of determining land use change In order to determine land change, data collection at different times over the same area is a prerequisite for comparative analyses. Data collection methods have changed dramatically as technology advances, from classical field surveying to aerial photography and Remote Sensing. Remote Sensing provides quick and comparatively inexpensive information about land cover over large areas (Loveland et al., 2003; Townshend, 1987). Most studies carried out to detect and measure changes on land use monitoring focus on raster based environment and less attention is paid to vector based GIS processing (Sonneveld et al., 2000). One of the reasons could be that the processing time is long
Literature Review 6

and a substantial understanding of geoprocessing and database skills are required. A study aimed at reducing noise propagation in vector based GIS land use change monitoring shows how noise can be reduced (Sonneveld et al., 2000). In this study, the most recent data was taken as reference from which to test previously known data. Ontology was defined for land use classes and super-classes and relating them to land use objects, both spatially and thematically representing T=1 and T=2. The method developed is called MonGIS and operates in ArcInfo environment where the user has the option to alter criteria through a menu interface. This could be useful for calibration purposes. Studies on raster based land use changes take advantage of built in statistical analyses programs and various simulation and predictive models (Loveland et al., 2003) that is lacking in vector GIS environment. A study by Civco and others (Civco et al., 2002) compared land use change detection methods by testing several existing methods. These include traditional post-classification cross-tabulation, cross-correlation analysis, neural networks, knowledge based expert system, and image segmentation and object oriented classification. The purpose was to compare the results of the different land use change detection approaches. One of the major outcomes from this study was that there is merit to each of the change detection methods but much research remains to be done to improve the results.
2.4 Review on land use change in PNG Literature relating to land use change in PNG started from the 1950s (Bellamy, 1986). The CSIRO regional resource survey program was undertaken between 1953 and 1972 to provide rapid and large area information on natural resources over PNG. Nearly half the country was covered in this program with 15 regional surveys including major proportions of population, used areas, and major environments. The methods employed in this survey made use of aerial photographs and rapid ground missions. Information was provided in two spatial resolutions, descriptive and map. Descriptive information describes portions of land units which were mapped into land systems. Since the regional resource survey program collected and presented information in an integrated manner, no information was provided for the whole of PNG about specific criteria like landform, soils or other geographic or resource characteristics. This need triggered research for the creation of a national agricultural resource database to determine the nature, variability, and distribution of major natural resources; which led to the development of PNGRIS. The development of PNGRIS database made use of resources gathered during the regional survey program by CSIRO. Several publications on PNG were released
Literature Review 7

around that time which covered vegetation by Paijmans, (1975), geomorphology by Löffler, (1977), soils (Bleeker, 1983) and climate by McAlpine et al., (1983). Additional information that became available and included during the PNGRIS development were: the 1980 national population census, the 1:250,000 geological series maps and 1:100,000 topographic maps of PNG. The documentation was published by Bellamy (1986) on the inventory of natural resources, population, and land use which became PNGRIS handbook. The regional natural resources survey and PNGRIS implementation became the formal head start relating to land use documentation covering PNG. Publications on land use and population cite PNGRIS publications as the primary reference. Bellamy and McAlpine (1995) explained the derivation, classification, and presentation of the information in PNGRIS database like natural resources, demographic and socio-economic. Its specific objective was to determine both the current use and development potential of the nation’s natural resources for food and cash crop production taking into account present and future population growth and distribution. The authors noted that between 1980 and 1990 population increased by 20%. When PNGRIS was updated from 1975 to 1996 with 1980 and 1990 population data and manual Landsat imagery interpretations with selective ground missions, the land area for food production showed an increase by 10% (McAlpine et al., 2000). The population between 1980 and 1990 increased by 25% and rural population by almost 20%. The estimated rural population growth between 1975 and 1996 was between 40-50%; however, the actual increase was 64% according to the population figures of 2000. It appeared that land use was intensified with little or not fallow in cultivation areas for subsistence agriculture. Climatic conditions and physical limitations such as extreme slopes, stoniness, swamps, and cultural practises like, ownership rights and farming systems impede expansion and variations on land use. PNGRIS data is derived from a scale of 1:500,000 and is suitable for regional analysis of natural resources and lacks agricultural data at local scale. The text summaries on Agricultural Systems of PNG by Bourke and others (1998) and the related database bridges this gap. The spatial mapping unit is based on RMU (Appendix E); however, discrete agricultural units are defined within the RMUs. By retaining RMUs, the agricultural information can be related to PNGRIS for querying and mapping. All provinces of PNG are summarized with data on agricultural systems, population, area of land used for agriculture and density per agricultural system. Based on past studies and historical data on agricultural systems and subsystems, it is shown that between early 1980s and mid 1990s, there were few major changes in PNG. It is anticipated that there will be continuing changes in farming systems but no major changes in agriculture are expected for the next 10-15 years.
Literature Review 8

A recent study by Pahari and others (2001) made use of multi-sensor satellite data to evaluate Land use dynamics in Tari Basin in the remote Southern Highlands province of PNG. Data from Landsat MSS (1974), SPOT HRV (1988), and Landsat TM (1994) were used for broad land use classification using maximum likelihood classification. The multi-temporal datasets were used to get a synoptic view of environmental and resource condition of the area. This data would be combined with a detailed study over a small area using IKONOS images at 4 meter multi-spectral and 1 meter panchromatic bands and the results are expected to be released in a final report. This study tends to use various satellite images for a comparative analysis on human impacts on the environment. The preliminary result concluded that population pressure resulted in forest areas being cleared for food cultivation and the primary forests remaining are found on high altitude areas where it is steep or difficult for cultivations. This finding is in agreement with Land Management Dilemma in Papua New Guinea by Bryant Allen (URL 9).
2.5 Comparing land use with other Tropical countries To investigate land use patterns caused by biophysical and socio-economic dynamics in PNG, a comparison is necessary with countries in the tropics that share similar climatic conditions and biophysical characteristics (Table 2-2), however, the land use system area largely dependent on the local socio-economic forces at play, native to the respective countries. Land use is grouped into 5 classes: arable, crops, pasture, forests, and others. PNG has the highest area dominated by forest and Costa Rica the least (Table 2-2). This could be due to forest areas being converted to pasture after deforestation in Costa Rica. Pasture is not present in PNG but varies among the other countries. All countries show cropland below 15% which could imply absence of large scale agricultural farming. The natural hazards and current environmental issues that have varying influences on land use changes are summarised in Table 2-1.
Literature Review 9

Table 2-1.Natural hazards and environmental issues
Country Hazards Issues
Brazil droughts; floods and occasional frost
deforestation in Amazon Basin, illegal wildlife trade; land degradation and water pollution from mining activities; wetland degradation; oil spills
Brunei typhoons, earthquakes, and flooding
seasonal smoke/haze resulting from forest fires in Indonesia
Cameroon
Volcanoes, poisonous gases from Lake Nyos and Lake Monoun volcanoes
water-borne diseases; deforestation; overgrazing; desertification; poaching; over fishing
Costa Rica
earthquakes, hurricanes along Atlantic coast; flooding, landslides; volcanoes
deforestation and land use change, as a result of clearing land for cattle ranching and agriculture; soil erosion; coastal marine pollution; solid waste management; air pollution
Fiji cyclonic storms, November to January
deforestation; soil erosion
PNG
volcanoes; situated along the Pacific "Ring of Fire"; frequent and severe earthquakes; mud slides; tsunamis
rain forest subject to deforestation as a result of growing commercial demand for tropical timber; pollution from mining projects; severe drought
Philippines
typhoon, 5-6 cyclonic storms per year; landslides; volcanoes; earthquakes; tsunamis
deforestation, soil erosion; air and water pollution, increasing pollution of coastal mangrove swamps which are important fish breeding grounds in Manila
Source: United Nations (URL 6) Table 2-2. Comparison of population and land use with 6 countries in the Tropics
Population Land area Land use (%) Density Country sq km arable crops pastures forest others 2000 Brazil 172,860,370 8,511,965.00 5 1 22 58 14 20 Brunei 343,653 5,770 1 1 1 85 12 60 Cameroon 15,803,220 475,440.00 13 2 4 78 3 33 Costa Rica 3,773,057 51,100.00 6 5 46 31 12 74 Fiji 844,330 18,270.00 10 4 10 65 11 46 PNG 5,049,055 462,840.00 0 1 0 93 6 11 Philippines 82,841,518 300,000.00 19 12 4 46 19 276
Source: United Nations (URL 6) It must be noted that forest composition (Table 2-2) of 93% for PNG is based on estimated figures from CIA fact book and is higher than reliable sources like FIMS and PNGRIS. Recently, the land use categories have been reduced to: (i) arable, (ii) permanent crops and (iii) others, from the Web site. The information in the above table shows relative comparison with other countries in the tropical region.
Literature Review 10

2.6 PNG at a glimpse Land use change and population in PNG is well summarised by Graham Sem (Sem, 1995). The tropical location of PNG with its diverse geomorphologic characteristics and prehistoric remains of farming systems in the highlands set it apart from other civilizations. The social, cultural, and biophysical diversities consolidate its unique nature. PNG is located on a tectonically active area between the northward moving Australian continental plate and the northwest moving Pacific plate (Sem, 1995). The main islands are reported to be formed by plate tectonics as block-faulted, folded with mountainous interiors, especially in the highlands region. Mt. Wilhelm in the Simbu province is the highest mountain which is 4,509 m above sea level. Major navigable rivers are Fly River in Western province, Sepik River in East Sepik, Ramu River in Madang province and Purari River in the Gulf province. The longest road network starts from Lae in the Morobe province to Wabag in the Enga province. Infrastructural developments are mostly concentrated in the major cities and towns like Port Moresby, Lae, Madang, Rabaul, Goroka and Mount Hagen. Except the five Highlands provinces in the interior, the rest are Maritime Provinces. Western province with the capital Daru has the largest land area and Manus province with Lorengau capital is the smallest. PNG is divided into four major regions, Highlands, Islands, Momase and Southern (Figure 2.1).
Figure 2.1. Regions, provinces and towns of PNG
The coastal provinces supplement staple diets (sago, taro, yam, banana, and cassava) with both terrestrial and marine resources like wild pigs, kangaroos, deer, cassowaries, possums, bandicoots, fish, crustaceans, crocodiles, and sharks. Most
Literature Review 11

coastal villages are sparsely populated while the highlands provinces are densely populated. The main staple food in the highlands is kaukau or sweet potato (Ipomoea batata) and domesticated livestock like pigs, chicken, cattle, goats, and sheep are raised for consumption and sale. The highlanders are notorious for tribal warfare that can stem from disputes relating to land, pigs, or women. The bulk of the population in the rural areas depends on subsistence agriculture and has a closer spiritual attachment to the land. Development initiatives by government and companies at national, provincial or local scales are slow because negotiations with land owners is a painstaking process and can cause delays and at times lead to cancellations. Logging and mining companies are major industry players that involve resource owners in negotiations for resource exploitations.
2.6.1 Land use prior to 1975
Land use observations before independence (1975) were from investigations such as gold exploration and plantations. The Land Use Research Division of CSIRO carried out more systematic investigations of the geology and landscape, including land evaluation investigations. The method used for land-evaluation was based on the land systems survey (Christian and Stewart, 1953). This system defines land system as a unique assembly of land features like soils, vegetation, land-forms, rainfall, land use, and population. The main objective of this survey was to assess land for agricultural suitability. The data were based on aerial photo interpretation and representative field checking of each area under investigation. About 50% of the total land area was covered in this survey and 15 land systems were identified (Bellamy, 1995). Land use was divided into three broad categories, subsistence cultivation, cash cropping (indigenous), and plantation. Most people in each land system were involved in subsistence cultivation for cash cropping, mainly tree crops, such as coconuts, cocoa, coffee. Some rice was practiced by the indigenous population in both lowland and highland areas and some pyrethrum (Pyrethrum cinerariifolium), passion fruit, tea, and livestock were introduced in the highlands (Sem, 1995). Plantations were owned and managed by the non-indigenous population in both lowland and highland areas.
Based on land-system surveys between 1954 and 1976, it was estimated that 20% of PNG land was under shifting cultivation (Sem, 1995). This figure may have changed due to population growth, economic and social demands. Land use intensity was not clear due to incomplete population figures between 1954 and 1976. Where sweet potato (Ipomoea batatas) was dominant in densely populated areas of the highlands, intensive, almost permanent short-fallow cultivation was evident. McAlpine (1970) suggested that the length of cultivation and fallow cycles differed markedly in the highland areas and was probably related to land pressure, environment, and cultivation techniques. Growth of interest in cash cropping among the indigenous
Literature Review 12

people was stimulated by a variety of land-tenure and marketing schemes when expatriate owned plantations could not survive after the Second World War because of shortage of labor, low commodity prices and high shipping costs (Crocombe, 1964). From 1951 agricultural extension efforts concentrated mainly on cash crops (Bourke, Carrad et al., 1981). Land systems under various uses were divided into subsistence cultivation, cash cropping, both indigenous and non-indigenous, and plantations which were mainly owned by expatriates.
Due to increasing malnutrition in rural PNG, the National Food and Nutrition Policy (NFNP) was formulated in 1975 to increase domestic food production. The need for cash crop and food production brought much of the land into some form of use (Sem, 1995). As a result, significant changes have occurred in food production during the last 40 years, which has led to other changes in food production and the nutrition system in PNG. The current land use patterns could be related to past policies and events that triggered subsequent changes to land use as population increases.
2.6.2 Population dynamics
A long-term population trend of PNG is difficult to understand because censuses have been conducted for relatively short periods. Censuses were conducted in 1966, 1971, 1980, 1990 (Sem, 1995) and lately 2000. Prior to 2000 census, only 1980 and 1990 census attempted a complete enumeration of the rural and urban populations (Figure 2.2). The population of PNG has grown from 2.2 million in 1966 to 3.6 million in 1990 and 5.2 million in 2000. This increase represents a growth rate of 2.7% per annum between 1966 and 1990 and 4.4% per annum between 1990 and 2000.
1 000 000
2 000 000
3 000 000
4 000 000
5 000 000
6 000 000
1980 1990 2000
Urban
Rural
Figure 2.2. Population growth in PNG by urban and rural sectors
Literature Review 13

The population of PNG grew rapidly and almost doubles every 20 years. The land ownership system is based on traditional system and varies between provinces and regions, where land is passed from father to son or from mother to daughter. As a result of different land ownership and inheritance systems by tribes, clans and families, the land use systems vary between provinces and regions. Where there is population pressure such as the Highlands region, land is used more intensively because; there are limited alternatives like fishing, gathering or hunting. These limitations force people to work on the land for all their needs. Although other regions and provinces have alternate sources of food, subsistence cultivation is still a common way of life. The difference lies in the intensity of use on the same piece of land. Where there is low population density, the fallow periods are longer in between different plantings as opposed to highly dense areas. With the current situation where the government has little, if not no control over ownership and distribution on traditional land, the increase in population is likely to compound the existing problems relating to land. Moreover, the social structures vary between provinces, regions and localities and the amount of land used is not necessarily a direct indication of population growth.
Given the current population growth rate of 4.4%, and the increasing threat of logging and conversion of primary rainforest, it is likely that more land will be used for cultivation. The fallow systems are likely to be reduced because; it relies on low population densities and large areas of undisturbed forest. Shorter fallows will cause forest and land degradation and environmental stress assuming little or no technological changes. Farming will not be sustainable in the longer term without soil fertility maintenance techniques, and introducing new crops and new technology.
The distribution of population shows that the southern and northwestern coastal regions have low population densities, while the islands and highland regions are densely populated. The Western, Gulf, and West Sepik provinces are sparsely populated (Sem, 1995). Over one-third of PNG's population is concentrated in the highlands region. Although 22 persons/km² is the average density for the highlands region, reports indicate that the densities exceed 200 persons km² in some parts, especially fertile highland valleys (Allen, 1984). It is in these areas that reports of "population pressure" on land have been experienced most frequently.
Literature Review 14
Chapter 3 - Datasets over study area This chapter attempts to answer the first research question by providing descriptions and pre-processing on relevant datasets. The timestamps are 1975 as Time 1 (T1),
1990 as Time 2 (T2), and 2000 as Time 3 (T3).
3.1 Topographic maps Topographic maps at scale 1:100,000 (25 sheets of 1.5 x 1.5 degrees or 5.5 x 5.5 kilometres) compiled between 1974 and 1979 by Australian Army Corps represented land use conditions at T1 (Appendix B). These maps were compiled from aerial photogrammetric interpretations based on Transverse Mercator (TM) projection and referenced to Australian Geodetic Datum of 1966 (AGD66) and Australian Map Grid Zone 55 (AMG55). Geometric accuracy varies between map sheets up to 40 meters horizontally and 17 meters vertically. Contour interval is 40 meters and the legend shows major land use classes, hence T1 was adopted as baseline data. Topographic maps of PNG are printed and distributed by the National Mapping Bureau (NMB) of the Lands Department.
3.2 Satellite - Landsat Thematic Mapper images The satellite data for T2 is from Landsat-5 (Appendix C) and T3 from Landsat-7; Enhanced Thematic Mapper Plus (ETM+) (Appendix D). T2 and T3 images represent land use conditions for 1990 and 2000 respectively. The spatial resolution for T2 is 28.5 meters and T3 at 14.25 meters and come in Mr.SID format. The images are orthorectified and come in tiles or mosaics of 6 degrees in longitude by 5 degrees in latitude. The spectral bands are preselected to Green (2), Near Infra Red (4) and Short Wave Infra Red (7) by the supplier. Band 2 is useful for vegetation and cultural feature identification, while band 4 is useful for determining vegetation types and band 7 sensitive to mineral and rock discrimination. Moreover, a company contrast stretch filter, LOCAL, (Locally Optimized Continuously Adjusted Look-up-tables) is applied by the provider to maximize the information of each tile. The panchromatic sharpening band in Landsat-7 has a spatial resolution of 15 meters with a broad spectral response which, when applied across other bands, sharpens the resolution from 28.5 to 14.25 meters. Each tile is referenced to the World Geodetic System of 1984 (WGS84) and projected in UTM coordinates. The images over the study area are downloaded free from NASA Earth Science Enterprise; https://zulu.ssc.nasa.gov/mrsid/. Landsat TM data is chosen because it covers the entire study area for both 1990 and 2000 with less than 10% cloud cover and have spatial resolutions considered suitable for this study.
Data 15

3.3 Resource Mapping Unit (RMU) PNG Resource Information System (PNGRIS) is polygon based natural resources database in MapInfo tables compiled from 1:500,000 topographic base maps and aerial photo interpretations (Appendix F). The spatial unit is Resource Mapping Unit (RMU) which is based on landform, rock type, and altitude; (Appendix E). PNGRIS contains data on natural resources, agriculture, and basic demographic indicators. The Department of Agriculture and Livestock (DAL) is the main custodian of PNGRIS database and other government departments and agencies have access to use PNGRIS. RMU is the spatial mapping unit in our study from which land use layers are spatially intersected with to derive land use and population change information.
3.4 Auxiliary datasets 3.4.1 Population
Population figures for 1975, 1980, 1990, and 2000 over the study area formed an important demographic data. Since the baseline date for this study is 1975 and with no official population data for 1975, the mean of 1970 and 1980 population figures were assumed for 1975 as there was no other way to obtain the exact figures for 1975. The rest of the population data were official census figures. Prior to 2000, various census units were used to record population data. During 2000 national census, all census points (villages) were georeferenced with GPS. The previous census units are updated to conform to 2000 census by matching and geocoding the previous census units. The geocoding enables census data to be integrated with RMU and other GIS layers for spatial querying, analyses and mapping. The population in any RMU is assumed to be evenly distributed. The National Statistical Office (NSO) of PNG is the authority on census data.
3.4.2 Agriculture Systems of PNG (AGSYS)
AGSYS is agriculture systems data based on RMU in MapInfo polygons and maintains basic PNGRIS attributes but customized to agriculture. AGSYS contains information on small holder agriculture at provincial and national levels that relates to farming systems, crop types, land use intensity, cash crop activity, and other agricultural aspects. The data were collected between 1990 and 1996 and is deemed to be valid for the next 5 to 10 years (Bourke et al., 1998). Department of Agriculture and Livestock (DAL) is the custodian of AGSYS data. AGSYS is used to derive land use intensity and to verify land use interpretations in this study.
Data 16

3.4.3 Forest Inventory Mapping System (FIMS)
FIMS is polygon based forestry database in MapInfo table compiled from 1:100,000 topographic base maps and contains forest information. The spatial unit is Forest Mapping Unit (FMU) and based on major forest types and forest zones in PNG. The PNG Forest Authority (PNGFA) is mandated to manage FIMS. FIMS shows vegetation classes including land use areas which are used to compare and verify the digitized land uses.
3.5 Data preparation The data preparation steps are prerequisites to the final input data for processing and analysis (Figure 3.1).
Figure 3.1. Data pre-processing
Data 17

3.5.1 Topographic maps for T1 Land Use
The topographic maps are scanned and georeferenced to AGG66 and AMG55 to conform to source datum and projection (Appendix H). The images are tiled and clipped to the study area. The scan resolution is 300 dpi to assist clarity when delineating land use types during digitizing at different zoom levels.
3.5.2 Satellite images for T2 and T3 Land Uses
The T2 and T3 images are first reprojected from UTM coordinate system to AGD66 AMG55 (Appendix H). Subsets of the images are clipped to the study area and saved into TIFF format. Erdas Imagine software is used to perform unsupervised classifications on both images and smoothed with a 5x5 majority filter to aid digitizing (Figure 3.2).The 5x5 majority filter gave a satisfactory result after comparisons were made with other smoothing filters.
Before filter After filter
Figure 3.2. Before and after images using 5x5 filters to smooth classified images
3.5.3 Digitizing land use classes
Land use for T1 is captured by screen digitizing using the tiled image as background. The topographic map legend is used to label the land use classes. The geometry of T1 is checked for errors and attributes updated prior to converting to coverage. A copy of the digitized T1 land use is made to T2 and using T2 image and T2 classified image as background, the land use for T2 is adjusted according to changes observed. The same procedure is repeated for T3 by making a copy of T2 land use to T3 and using T3 image and T3 classified image as background, land use classes are adjusted to T3. When uncertainties arise in labelling for T2 and T3 land uses, AGSYS, RMU and FIMS layers are used in complementary to assign land use labels. T2 and T3 band combinations and the reflected colour composite on different surface features are shown in Table 3-1 with other band combinations in true and false colours.
Data 18

Table 3-1. Appearance of Features on Composite Images. (Adapted and modified from
www.earthsat.com)
True Colour
Red: Band 3 Green: Band 2 Blue: Band 1
False Colour
Red: Band 4 Green Band 3 Blue: Band 2
SWIR (GeoCover)
Red: Band 7 Green: Band 4 Blue: Band 2
Trees and bushes
Olive Green Red Shades of green
Crops Medium to light green Pink to red Shades of green Wetland Vegetation
Dark green to black Dark red Shades of green
Water Shades of blue and green
Shades of blue Black to dark blue
Urban areas
White to light blue Blue to gray Lavender
Bare soil White to light gray Blue to gray Magenta, Lavender, or pale pink
Examples
3.5.4 Land use class transformations T1 land use classes are explicitly inherited from the topographic map legends and need no further definition. However, for T2 and T3, several land use changes are possible, three being significantly noticeable when digitized T1 land use is overlaid on T2 image and digitized T2 on T3 image. Changes can occur at feature level where land use objects in a class changes or at land use level where complete land use classes can transform into other classes. At feature level, first is the spatial change (expansion/reduction) of land use objects in T2, then the emergence of new land use objects in T2 and third, the disappearance of land use object in T2, from T1, see Table 3-2 for all the possible changes. The same applies for T2 on T3 and T1 on T3.
Data 19

Table 3-2. Land use feature change possibilities
From 1975
To 1990/2000
Criteria Change Domain
Land use emerging Spatial & attribute
Land use disappeared Spatial & attribute
No change in area and land use – remain same
Spatial & attribute
No change in area but change in land use
attribute
Increase in area but land use remains unchanged
spatial
Decrease in area but land use remains unchanged
spatial
Change in both area (increase) and land use
Spatial & attribute
Change in both area (decrease) and land use
Spatial & attribute
3.5.5 Land use class assignment
Land use class assignments for T2 and T3 are done in the following manner. Where land use objects for a class in T1 is observed to have corresponding adjacent spatial changes on T2 image, the change is considered an increase/decrease of the same land use, hence, the land use label of T1 is retained and the boundary is adjusted in T2. If disjointed (fragmented) features of the same land use class in T1 are observed to fall within a single object discerned in T2, these features are merged to one object with the same land use label from T1 and the boundary is reshaped accordingly (Figure 3.3). Objects in T1 that are not observed in T2 are considered to have transformed into other land use, hence, the object is deleted in T2 (Figure 3.4). Objects that are not in T1 but emerge in T2 are considered new land use objects (Figure 3.5) and a decision is made to assign land use labels. The Agricultural system dataset is used to assign land use label to new objects. If the new object intersects with more than one agricultural land use system, the label of the biggest area of intersection is transferred to the new object (Figure 3.6).
Data 20

Disjointed objects
Merged object
Figure 3.3. Disjointed land use objects in T1 merged into a single object in T2
Object disappeared in T2
Object in T1
Figure 3.4. Land use object in T1 disappeared in T2
New object Forest
Figure 3.5. Emergence of new land use objects in T2
Figure 3.6. Example of a new feature (red) intersecting over two land use types
New object gets agriculture label based on area of intersection.
Data 21

Chapter 4 - Methodology
4.1 Study Area – Morobe province Morobe provides an excellent opportunity as study area because it is representative of a set of conditions that are generally prevalent in much of PNG and has clear links to land use. In addition, there is comprehensive existence of data available. Some of the conditions are size of land area, demographic trends, diversity of natural and cultural phenomena and related historical significance.
Figure 4.1. Location of study area.
4.1.1 General description
Morobe province is located 147° east and 6° south of the equator, approximately in the centre of PNG (Figure 4.1) with a land area of 33,933 km2 (McAlpine and Quigley, 1998) and a population of 536,591. Morobe is in the Momase region with Madang, East Sepik and West Sepik provinces all situated towards the northwest (Figure 2.1). Morobe shares common land border with Madang, Eastern Highlands, Gulf, Oro and Central provinces and maritime border with West New Britain. Morobe is by far the largest in terms of land mass and population, representing over 7% of PNG’s total land area and over 10% of PNG total population in 2000. There are more than 14 different tribes that speak 171 distinct languages or over 20% of the total languages spoken in PNG (URL 8: Languages of PNG). The majority of the
Methodology 22

population depend on subsistence agriculture and small holder cash crop activities. Morobe’s population grew steadily since 1975 and Lae comprises close to a quarter of the total population for Morobe in 2000. Bulolo has the second highest followed by Menyamya and Nawae district has the lowest population. The annual population growth between 1990 and 2000 is 5% compared to 2% between 1980 and 1990 (Figure 4.2).
Population by Districts
0
5
10
15
20
25
30
1975 1980 1990 2000
Pop
ulat
ion
(%) TEWAE/SIASSI
FINSCHAFEN
NAWAE
HUON
MARKHAM
KABWUM
MENYAMYA
BULOLO
Population by Districts - 2000
MARKHAM9%
HUON11%
KABWUM8%
LAE23%
NAWAE6%
FINSCHAFEN8%
TEWAE/SIASSI8%
BULOLO14%
MENYAMYA13%
Land area by Districts
TEWAE/SIASSI8%
FINSCHAFEN7%
NAWAE7%
HUON17%
MARKHAM13%
KABWUM10%
MENYAMYA11%
BULOLO27%
Figure 4.2. Population and area by districts
Methodology 23

Figure 4.3. General reference map of Morobe.
The humid tropical climate, complex landform, and soil types (Appendix S) support an abundant biodiversity of flora and fauna. Over 60% of the land is canvassed by tropical forest. Morobe sports a geographically contrasting topography (Figure 4.3) from the long Markham valley, a fault zone with frequent earthquakes and spans 190 kilometres east–west separating Huon and the Highlands mountain systems. Huon’s rugged Finisterre and Sarawaget ranges rise steeply from the sea to some of PNG’s highest mountains, Mount Sarawaget 4,121 m and Mount Bangeta 4,005 m which are raised coral limestone. The Highlands Mountain Systems southward are not as high but rich in mineral deposits like gold, silver, nickel, and chromium. Morobe has 93 lakes of which Lake Wanum and Lake Trist are the largest with exotic aquaitic
Methodology 24

species. The Markham River is PNG’s sixth largest swift flowing but unnavigable river and receives other tributaries as it courses 180 kilometres to meet the Solomon Sea near Lae city. Markham Bridge is the longest bridge (550 meters) in PNG and is a crucial link between Lae and the populous sub-districts of Mumeng, Bulolo, Wau, Aseki, Menyamya and Garaina where most of Morobe’s economic activities like agriculture, forestry and mining take place. There are 57 islands and Umboi (Siassi); a volcanic Island is the largest. The Vitiaz Strait between Umboi Islands and Finschhafen is considered one of the most dangerous waters due to strong winds along the Vitiaz corridor. Lae developed from a noble mission station into the second largest city and industrial capital. Its strategic location serves as the gateway to the Highlands and Islands provinces. The bulk of the indigenous people of Morobe are subsistence farmers scattered across the province while Lae city has a high proportion of population that migrate from other provinces in search of jobs or other opportunities. Lae is the industrial hub where all vessels berth at Lae Harbour for loading and unloading of cargoes from agricultural products to merchandise and machinery. The Highlands provinces and parts of Momase region depend on Lae Harbour. All the equipment for mining, oil and gas companies in the Highlands region and Madang province pass through Lae port. The following sections briefly give a sketch of Morobe such as, soils, rainfall, demography, and land use.
4.1.2 Climate and Topography The climatic pattern in Morobe ranges from dry (1,000-1,500 mm) of rainfall per year generally along the Markham valley to wet (4,000-5,000 mm) around Lae, Finschhafen, Siassi, Salamua and Aseki (Figure 4.4-A). The variables used to describe the climate from RMUs are mean annual rainfall, seasonal variability of monthly rainfall, rainfall deficit; mean maximum and mean minimum temperatures (Bellamy, 1986). The monthly seasonal variability of rainfall for Finschhafen and Aseki shows significant variation. Rainfall deficit indicates the probability of drought to measure water balance and soil moisture content. When compared with annual and monthly rainfalls, there is significant variation, meaning the loss of water to transpiration is proportional to altitude (Figure 4.4-B). In PNG, altitude is closely related to temperature, hence a direct surrogate of temperature and is of importance to climatic description as well as to landform description (Bellamy, 1986).
Methodology 25

A B
Annual rainfall (see Appendix R for detail) Elevation (see Appendix Q for detail)
Figure 4.4. Rainfall and elevation of Morobe
4.1.3 Resources indicators The combination of landform, soil, and climate provides the condition for various forms of flora and fauna to flourish. The notable natural resources in Morobe are minerals, forests, marine resources such as fish and agricultural potential. Wau was famous in the 1930s when gold was discovered and Salamua Island became one of the busiest airfields in the world where gold dredges were airlifted to Wau. Forest covers more than 80% of the province providing significant potential for logging. However, the physical topographic constraints like high slopes and rugged terrains render these areas inaccessible.
4.1.4 Land use systems Agriculture accounts for 35% of the land use activity in Morobe according to AGSYS dataset. The dominant staple foods in most districts are sweet potato, banana, and taro. In Finschhafen district Chinese taro and sago are dominant staple foods. Other staple subdominant crops like Chinese taro, cassava, yam, and coconut vary between districts. Most staple foods are grown for consumption and excess is sold for cash income. Plantation comprises 2% while urban is less than 1% and the remaining occupied by forests (Bourke et al., 1998). Soil type has influence on the type of crop and number of plantings at which the same area is cultivated. A soil map of Morobe is on Appendix S. The land use classes for this study are similar to Bourke’s notes on PNG Agricultural Systems (Figure 4.5). Sub land use classes in level iii for 1975 are aggregated to super-classes in level ii in this study.
Methodology 26

Figure 4.5. Land use classification schema The land use classes in this study are: U Urban - residential, commercial, industrial areas and settlements on urban
fringes. Ag Agriculture - gardens with food crops, secondary growths and areas in
fallow after a period of cultivation. P Plantation – planted crops and non-crops covering large areas. Gl Grassland/savannah – result of farming, hunting, burning or naturally
occurring F Forests – all forests including smaller areas like cemetery, quarry, mining,
and logging. W Water – water bodies.
4.2 Method The main objective of this study is to determine the land use changes over Morobe province. The principal datasets used for this study are two temporal land use datasets of 1975 and 2000. For the same years there is population data based on Resource Mapping Unit. From this data the aim is to derive changes on land use and population by RMU as mapping unit. Therefore, in methodology the main objective of the study is addressed by answering the second research question on how the available data can be used to determine the land use changes. This approach involves GIS and database functionalities and comprised two major steps: processing and analysis (Figure 4.6). The immediate outcome from the processing and analysis would be (i) geometrically intersected polygon coverage with updated attribute table for land use type per year per RMU (ii) a multi-attribute table with all possible combinations of land use and RMU for both years with population changes and (iii) change tables per land use type and population, see Appendix G for detailed diagram. Based on these outcomes, some of the expected results to derive are; (a) general land use change pattern (b) specific changes by land use type, (c) changes in population (d) changes in agriculture and
Methodology 27

corresponding changes in population (d) general relationship between land use and population changes, (e) cross-tabulation of From To changes, (f) change correlation between agriculture and population. The software used in processing and analysis are; ArcGIS, Oracle RDBMS, ArisFlow and ArcInfo. The first step undertaken in processing involved a spatial overlay of the input datasets. Within this process, several sub steps such as computing area statistics by land use type per year per RMU and creating intermediate tables are accomplished as illustrated in Figure 4.6. The desired output at the end of the processing are change tables representing each land use type and population by RMU (Appendix G). The land use change tables are created from a set of criteria on change conditions for both 1975 and 2000; see the script in Appendix K and Appendix L for details. The change tables are related to the overlay for mapping the changes in land use classes and population. The specific steps are described in the method. Figure 4.7 gives a generic view on the tables and their relationships.
Methodology 28

Figure 4.6. Overview of conceptual methodology
Methodology 29

Figure 4.7. General Land use change Entity Relationship (ER) diagram.
Note: The ER diagram shows the main tables and their relationships. The lookup tables can be inferred or found in the appendix and specific ER diagrams. The conversion of Info tables to Oracle and the change tables are not depicted above.
4.2.1 Data processing
The input data for processing are (i) land use 1975, (ii) land use 2000 and (iii) RMU. The spatial mapping unit is RMU and population data is integrated into RMU. Since changes in land use and population are required, spatial overlay becomes necessary to compute and analyse changes. The land use data for 1990 has been left out in processing due to volume of processing and analysis required compared to time.
Spatial overlay
Spatial overlay is the first step in processing, however, ESRI user guide and online resources deal comprehensively on spatial operations, hence descriptions here would be repetitious. Figure 4.8 is a classical example of union operation used in this step. More information of spatial operations can be found under spatial over and geometric intersections in ArcGIS.
Methodology 30

Figure 4.8. Union function in spatial overlay (adopted from ESRI ArcGIS manual)
Computing statistics
The second task involves computing and updating land use type areas per RMU per year. Three lookup tables; (i) RMU, (ii) RMU/land use 75 and (iii) RMU/land use 2000 are generated from the intermediate result to achieve this task. By means of relational queries with the intermediate data and the lookup tables, the area statistics per land use type per RMU for 1975 and 2000 are computed and output to a final coverage (Appendix I). The common join item for the lookup tables and the intermediate result is RMU. Land use 1975 and 2000 have a combination of RMU and land use candidate-keys as unique join item (Figure 4.9).
Methodology 31

Figure 4.9. ER diagram for computing statistics
Creating Multi-attribute table and converting to Oracle
In the third task, the final coverage is used to generate three tables: (i) RMU number, (ii) land use type and (iii) RMU/land use combinations. The first two are lookup tables and the third is a combination of all existing RMU and land use. Through Oracle RDBMS connectivity, a cartesian product is created from RMU number and land use type lookup tables and then joined with the RMU/land use combination table to produce a multi attribute table for analysis (Figure 10, Appendix J). Then, the three tables, RMU number, land use and multi-attribute tables are converted to Oracle for multi-key attribute querying which is presently lacking in ArcGIS environment.
Figure 4.10. ER diagram for creating Cartesian product and multi-attribute table
Methodology 32

Evaluating land use and population changes in Oracle
The fourth task comprises two major activities. First, 8 intermediate tables are created representing various land use conditions in an 8-step activity (Appendix K). These tables are (1) unique land use class, (2) all RMU and selected land use class, (3) all RMU with selected land use in 1975, (4) all RMU with selected land use in 2000, (5) selected land use type in both 1975 and 2000, (6) selected land use type appearing only in 1975, (7) selected land use type appearing only in 2000, (8) selected land use type that neither exists in 1975 nor in 2000. Second, from the 8 tables in the first activity, 4 SQL cases are built to create 4 change tables where case 1 would create a table when land use exists in both years. Case 2 would create a table when land use exists only in 1975, case 3 when land use exists only in 2000 and case 4, when land use does not exist in both 1975 and 2000. In all cases, the presence and absence of population are evaluated (Figure 4.11, Appendix L). The SQL executes iteratively for 6 times with user input of land use type. The changes in area and population are computed in percentages and saved to output oracle tables after each run.
Converting change tables from Oracle to Info tables
The fifth task requires the conversion of the change tables from Oracle to Info format. This is achieved through ArisFlow data action model (Appendix M).The tables are returned with RMU as unique identifiers and can be related to the coverage for querying, analysis, and mapping.
Methodology 33

Figure 4.11. SQL representation of computing change tables in Oracle RDBMS
4.2.2 Analysis The sixth task involves analysis of the multi-attribute table, the land use type change tables and the final coverage. The multi-attribute table is used to compute cross-tabulation of From To land use transformations while the change tables are joined with the final coverage to produce choropleth maps representing each land use type and population between 1975 and 2000. The correlation between population change and forest to agriculture change is compared with a moving window script in ArcView. The general correlation of total population change to total land use change is also compared. The summary changes in population and land use are analysed by conventional means and presented in tables, graphs, and charts.
Methodology 34

Chapter 5 - Results and Discussion This chapter attempts to answer the third research question on land use changes in Morobe Province by providing the results of the processing and analysis.
5.1 Results
5.1.1 General land use and population changes
Table 5-1. Summary statistics of land use and population changes
1975 1990 2000 Land use sq.km (%) sq.km (%) sq.km (%) Agriculture 5001 15 7266 21 7918 23 Forest 26463 78 23170 68 22287 66 Grassland 2169 6 2764 8 2945 9 Plantation 237 1 632 2 678 2 Urban 25 0 64 0 67 0 Water 37 0 38 0 39 0 Total 33933 100 33933 100 33933 100
Population 270701 359892 536591 Annual growth 2% (75-90) 5% (90-2000) 4% (75-2000) Per Capita 1.85 2.02 1.5
There is growth in both agriculture and population for Morobe between 1975 and 2000 (Table 5-1). Population increased by 98% or an annual increment of 4% or about 10,600 persons. Agriculture increased by 58% between 1975 and 2000, an increment of 2% or 117 km2 annually. The area under forest decreased, indicating conversion to other forms of land use. There is little change in grassland, plantation and urban. Between 1975 and 1990, agriculture shows significant increase compared to 1990 and 2000. The decrease in forest likewise accelerated between 1975 and 1990 compared to 1990 and 2000. The total loss in forests between 1975 and 1990 is 10% or 3,300 km2 or an annual clearing of almost 220 km2. On the other hand, population growth between 1975 and 1990 was 2% per annum compared to 5% between 1990 and 2000. The annual population growth between 1975 and 2000 is almost twice the rate of change in agricultural areas (Appendix P). The population density of Morobe in 1975 was 8 persons per km2 and doubled in 2000. The density in agricultural area was 54 in 1975 and 68 in 2000. However, when density was computed using population within the agricultural areas and the areas under agriculture, the densities for 1975 and 2000 were respectively 64 and 72, approximately 1% annual increase. The overall change shows that forest continue to lose to other land use types (Table 5-2). Annual urban population growth between 1975 and 2000 was 6% compared to approximately 3% expansion in area for the same period but these figures are too small to represent in percentages. Grassland shows steady growth between 1975 and
Results and Discussion 35

2000 while water shows loss. Agricultural areas where population densities per RMU are high show relatively high land use intensities (Appendix O). Agriculture and plantation increased by 100% while grassland increased by 43% between 1975 and 2000. Forest decreased by 20% in the same period. Urban and water show negligible changes in percentage although they show changes in absolute values (Appendix N). The area that remained unchanged between 1975 and 2000 was 75%, see Table 5-2.
Table 5-2. Land use From To change matrix
1975 Change 2000 Agriculture Forest Grassland Plantation Urban Water 2000
Agriculture 8 15 1 0 0 0 24 Forest 1 62 1 0 0 0 64 Grassland 3 2 5 0 0 0 10 Plantation 1 0 0 0 0 0 2 Urban 0 0 0 0 0 0 0 Water 0 0 0 0 0 0 0 75 Change 75 12 80 7 1 0 0 100
5.1.2 Changes by land use type and population The objective to quantify the changes in land use is achieved by evaluating the changes in areas by land use type between 1975 and 2000. The four land use change criteria evaluated during the SQL execution tested for the presence and absence of each land use type in both, either or none of the years (Appendix L) The result of the SQL execution are six land use change tables with population data which can be mapped by relating to RMU layer (Figure 5.1). The changes when mapped show that forest suffered mainly losses with water (Figure 5.2-a,f). Agriculture gained, although some areas transformed to other land use types (Figure 5.2-b). There is net gain in grassland (Figure 5.1-c) while plantation and urban gained (Figure5.2-d, e). Population changes show both positive and negative growths, however, there are areas with no population in both years (Figure 5.2-g).
Results and Discussion 36

(a) Forest (b) Agriculture (c) Grassland
(d) Plantation (e) Urban (f) Water
(g) Population growth (h) Population change
Figure 5.1. Change classification for thematic maps, a-f, h (%), (g) ordinal scale
5.1.3 Correlation Surface between Changes The spatial correlation surfaces between population change and changes from to respective land use classes were generated (Figure 5.2) by using custom Avenue script in ArcView. This script uses moving window to compute surface of correlation coefficients between two grid themes. The size of the moving window was set to 16 km (156 cells or measurements) and overlapping area was 5 km between windows. The percentage of maximum no-data for each moving window was 10%. The grid cell
Results and Discussion 37

size was 1x1 km. The moving window size, overlap and the percentage of no data are user-defined. The first case tested the local correlation between total land use change and total population change. The correlation coefficient scale is from -1 to 1. The results were classified to be represented in three intervals: -1 to -0.5 as strong negative correlation; -0.5 to 0.5 as no significant correlation and 0.5 to 1 as strong positive correlation. Figure 5.2-a shows that correlation between total population change and total land use change is strong and mostly positive across Morobe, especially in the populated areas along the Markham valley, Bulolo, Wau, Menyamya, Kabwum and parts of Garaina. There is also correlation between total population change and forest to agriculture changes and these areas are spreading randomly across the province. (Figure 5.2-b). The correlation between total population change and forest to grassland change showed good relationship on smaller regions (Figure 5.2-c). Correlation surface between total population change and grassland to agriculture change shows a positive relationship in highly populated areas (Figure 5.2-d). This could mean that areas under fallow are re-cultivated for subsistence agriculture or the fallow periods have been shortened.
(a) Total area and population change (b) Population and Forest to Agriculture
(c) Population and forest to grassland (d) Population and grassland to agriculture
Figure 5.2. Different change correlations between land use and population
Results and Discussion 38

5.1.4 Changes in hotspots Certain areas in Morobe characterise varying relationships between population and agriculture which can be regarded as hotspots. Seven conditions were tested for positive and negative growths between population and agriculture (Figure 5.3). Menyamya sub-district showed strong positive correlation between population growth and agriculture but also experienced negative growth in agriculture while population increased. Kaiapit sub-district showed a variation of population and agriculture; however, negative growths both in population and agriculture are observed. Mumeng, Bulolo, Wau, and Garaina areas in the Bulolo sub-district show contrasting relationships where agriculture decreased when population increased but some areas within the same sub-district experienced growth in agriculture while population decreased. .
Figure 5.3. Areas considered being hotspots for Population and agriculture
Results and Discussion 39

5.2 Discussion
5.2.1 General result The changes in land use between 1975 and 2000 show positive growths in both agriculture and population, however, the growth rate in population is greater than expansion in agriculture. The general trend where population growth is faster than expansion in agriculture supports the results of past works such as McAlpine (2000). At RMU level, there can be a number of bio-physical and socio-economic actors directly or indirectly influencing the outcome. Population has a positive relationship to agricultural change, but in certain parts of Morobe, there is negative correlation. Forest lost significantly between 1975 and 1990 and during the same period agriculture gained markedly. It can be assumed that most of the loss in forest converted to agriculture. Whether this transformation is from direct clearing of forest for agricultural purposes or initially cleared for other uses and subsequently converted to agriculture requires additional data to investigate. From observations and basing on expert knowledge, it is a common trend to clear forest areas for small scale subsistence agriculture. If large forest areas are cleared, this could be assumed to be for reasons other than agriculture, for example; logging. This assumption is confirmed when the forest concession layer is overlaid on forest types, forest change layer and agriculture change layer (Appendix T). Most of the gains in agriculture fall within the forest areas that experienced most loss. This indicates that forest have been cleared for agricultural purposes. These areas also show high population density and the villages are clustered together. Only a small fraction of the loss in forest falls within concession areas and this indicates minimum logging activities. The rate of loss in forest between 1975 and 1990 was more rapid than 1990 to 2000. This can be due to a country wide moratorium on logging in the late eighties and early nineties for illegal practices in the logging industry. Large timber rights areas for commercial logging have been declared in Morobe; however, little logging activities are taking place to this date apart from Bulolo forest plantation.
5.2.2 Correlation between population and land use changes
The surface correlations show that population depends on agriculture in most parts of Morobe province. The relationship between population and forest to grassland is random and this could mean that clearing of forest areas for cultivation is not widespread which also reflects the real situation. Interestingly, population and forest to grassland correlation shows both positive and negative relationships but localized in certain parts of the province. The locations of the negative correlation when compared with forest data, (FIMS), show that these areas area dominated mostly by grassland or vegetation other than forest. The positively correlated areas fall within
Results and Discussion 40

areas of agricultural potential on lower altitudes. There is one exception and that is Bulolo where there is Forest plantation and the assumption that clearing of forest to grassland would require further investigation. The forest to grassland areas are also within or in the vicinity of allocated or planned concession areas (Appendix T). The correlation of population and grassland to agriculture shows positive relationship and this is observed to be occurring at currently populated places. In places where there is negative correlation between population and agriculture but show high population density, it is assumed that the population has other means of livelihood than entirely on agriculture. The possible food sources are like relying on store food, buying from markets, fishing and hunting.
5.2.3 Observed trend
The concentrations of populated places (villages) are more clustered for both periods indicating no significant relocation (migration) to new areas as a result of population increase. There can be other factors that limit this from happening such as land ownership rights, physical constraints such as difficult terrain, isolation from transportation system and others. The other indicator is that people live together in communities more than in isolation which is a known pattern in many parts of PNG. About 75% of the areas remain unchanged which indicates that land use areas transformed from one land use type to another more than taking new areas from the forest. This is also indicated by 20% loss in forest between 1975 and 2000. The urban population showed significant growth for Lae city and other major centres but the corresponding changes in land area in the last 25 years are comparatively small. This shows that more people are migrating to towns and cities in search of jobs, education, or other opportunities. The slow growth in areas for urban expansion is mostly related to land ownership issues. Customary land owners tend to be reluctant in giving land away and have tight controls over their land, especially in the urban fringes. In Morobe, this is a common trend. Plantation gained significantly which reflects introduction of agricultural crops and reforestation, mostly along the Markham valley and Bulolo. Sugar plantation was introduced in the early nineties and other agricultural and forestry efforts are taking place which reflects in plantation growths. The large scale forest plantation in the Bulolo Wau area is one of the biggest in the country and is still in active operation. Some forest areas that lost to grassland are gained by agriculture or first to agriculture, then to grassland. The loss in water can be due to seasonal variations during the year when lakes and streams shrink during dry periods. A direct relationship between land use intensity and distribution of villages is evident where highly conglomerated locations show high land use intensity. There are areas
Results and Discussion 41

that were not inhabited in both 1975 and 2000. These places were also tested with the 1980 and 1990 population data and appear to remain unpopulated; however, about 8% of this area comes under agriculture. This could mean that people use the areas for agricultural purposes but live away in villages. Population growth could be the possible cause that forces people to cultivate further from villages. When the agricultural areas for both 1975 and 2000 are overlaid with the elevation data, some agricultural areas are observed to have expanded into higher altitudes. This can be due to local restrictions and constraints as mentioned earlier and population growth, forcing people to cultivate at higher altitudes. This trend is also similar to the findings of the case study in Tari Basin by Pahari and others (2001). The rugged Sarawaget Mountains and the Highlands mountainous areas around Garaina show zero population for both years. The per capita (Table 5-1) showed that between 1975 and 2000, the agriculture area decreased from 1.85 to 1.5 km2 per person indicating increase in population. The rise in population could be caused by in migration than high fertility rate of women in Morobe.
5.2.4 Possible Implications
The main observation for land use change in Morobe can be clearly stated that there is growth in Agricultures. Relating to the literature regarding the possible causes such as population, affluence and technology, population appears to be the major driving force. The level of affluence is difficult to assign and is subjective to local conditions like ownership. Technology could safely be ruled out as a cause of land use change driver. The other drivers like political economy, political structure; and attitudes and values do apply in the case of Morobe and in most parts of PNG. Most decisions are made collectively in groups and leaders have more influence and tend to be in power and have more wealth. There are no major known logging operations in Morobe although there are concessions in the areas where there is positive correlation between population and forest to grassland. A new trend that is gaining popularity is that forests are cleared by small scale sawmills operators who are hired to fell trees for the local owners. This is not significant but if consistently carried out over a period of time, it will have consequences on land use. At the current population growth of 4.4% per year and observing the areas that have been converted from forest to agriculture (15%) in the last 25 years, it can be stated that this trend will continue unless there is a significant decline in population (unlikely to happen) or a policy in place to control and monitor land use (also unlikely). Log prices are falling in Asia for some time now and the chances of large scale logging that would affect land use change in Morobe is unlikely, at least, in the foreseeable future. This study is based on a province level and using satellite imagery, however, for specific case studies; smaller areas must be
Results and Discussion 42

selected with accurate and highly detailed data complemented with field missions. To this end, the methods used in this study would be discussed.
5.2.5 Discussion on the methods used in this study
This section reviews the methods used in quantifying the land use changes in Morobe. Initially, a number of software and methods were considered such as eCognition, Erdas and Envi as well as GIS software like ESRI ArcGIS. In the end, ArcGIS, ArcInfo, ArishFlow and Oracle were used. Based on the results achieved in meeting the research objective using the above software, the strengths and weakness encountered would be reported. The use of ArishFlow data modelling software combined with ArcInfo, any geoprocessing task in vector format can be performed efficiently. The disadvantage in the ArcInfo-Arisflow combination is the lack of querying many relational tables as in conventional DBMS. This was the main reason Oracle was used. The reason for using a number of different software is due to the nature of the processing and analysis to output the required change tables by land use type after evaluating all the criteria defined. No single software above can perform all the required tasks. Therefore the capability of Oracle was utilized to perform a compound SQL statement. This SQL statement (Appendix L) executed a series of functions from evaluating the conditions for land use change criteria in an 8-step process until four final tables are created. In between, numerous sequences of SQL statements were carried out. This is where GIS capability is limited. On the other hand, Oracle RDBMS lacks the fully fledged capabilities of GIS, although there is a spatial component in Oracle called Oracle spatial. The main user interface in Oracle is command prompt and requires substantial knowledge of Oracle and database languages, unlike the user-friendly GUI based GIS environment. The required functionalities of both systems were used to create the change tables to achieve the aim of this study. Any development in marrying the two systems or a new system with the capabilities of both GIS and relational database would meet the current need, especially in GIS environments.
Results and Discussion 43

Chapter 6 - Conclusion The land use change in Morobe have been evaluated by using different datasets from topographic maps of 1975, satellite images of 1990 and 2000 to quantify changes on RMU level. In data preparation, the land use classes were digitized from the scanned topographic maps and satellite images. The images were smoothed using a 5x5 majority filter to aid digitizing of 1990 and 2000 land use. It was necessary to implement a series of geoprocessing steps from data preparation, processing and analysis. The spatial overlay by union enabled geometric intersection of all data layers. The land use attributes were computed and updated with land use areas and population. Through relational database connectivity and SQL executions using predefined land use change criteria in Oracle RDBMS, the changes in land use and population were computed by land use type and population per RMU. This made querying and analysis possible for changes relating to both population and land use. The result of this study indicated that in the last 25 years, there have been significant changes in forest and agriculture in regard to land use in the Morobe province. The rapid growth in population forced people to cultivate more land for agriculture and this is reflected on the growth in agriculture. Forest areas decreased by 20% and with no significant commercial logging taking place in Morobe, it can be attested that most of the loss in forest are gained by agriculture. However, the response to increase food production can be local and not directly in proportion to population growth throughout the province. Almost a quarter of the population lives in urban areas and depends on imported food like rice and meat and supplement the diet with locally grown foods from markets or stores. The population in the coastal areas and Islands depend on the sea and swamps for food sources as well which can lead to less cultivation. The uninhabited areas are identified as inaccessible or not suitable for agriculture given the physical and ecological constraints like latitudinal difference, soil type and others. With other limiting factors relating to bio-physical and socio-economic aspects, significant agricultural changes are observed in places where there is high concentration of villages. The land use intensity in these places is high. The areas that show significant gain in agriculture are also known for suitable conditions in terms of soil and climate. The Menyamya region is one of the isolated areas with rugged terrains but show significant gain in agriculture. This is due to people turning to small scale cash crop like coffee production. The same can be said about Wantoat region, another area that showed significant gain in agriculture. Plantation and urban gained in the same period
Conclusion 44

The main conclusion that can be drawn from this study to answer the main research objective is that there is significant growth in agriculture, although population escalated twice as high. Whether this growth is in direct response to population pressure needs more research at the local level because; the significant growths are happening in areas known for having potential for commercial cash cropping. The population in these areas are not being the only factor that would drive the changes in agriculture. Any concrete statement about the future land use in Morobe would be premature because; land has been a complicated issue involving many tribes with differing customs, traditions and languages within the province. However, we can predict basing on this study that agriculture will continue to grow whether it takes land from forest or grassland as population grows. Relating the main result to the research objective, research questions and the hypothesis based on literature search, the following can be stated. The literature cited were mostly based on studies on national, regional or local scales in PNG. This study is based on a province. The research objective has been achieved by measuring the changes in land use and population at RMU level which indicated that population doubled and agriculture gained significantly in the last 25 years in Morobe province. Taking into consideration that 25% of the population is based in urban areas, the growth for rural population was 75% and the 58% growth in Agriculture indicates a parallel growth in both population and Agriculture. Therefore the hypothesis that there is no direct correlation between population growth and land use change in PNG could not be completely supported in the light of the results from this study. Agriculture, forestry and PNGRIS data were used to verify the digitizing because; there is no suitable data for validation available. A field validation would be necessary in relation to this study or any future extension regarding land use in Morobe.
Conclusion 45

References
Allen, B. J. (1984). Agricultural and Nutritional Studies on the Nembi Plateau, Southern Highlands. Port Moresby, Papua New Guinea, Department of Geography, University of Papua New Guinea. Bellamy, J. A. (1986). Papua New Guinea Inventory of Natural Resources, Population distribution and Land Use Handbook. Canberra, Commonwealth Scientific and Industrial Research Organization (CSIRO). Bellamy, J. A. and J. R. McAlpine (1995). Papua New Guinea Inventory of Natural Resources, Population Distribution and Land use Handbook. Canberra, Australian Agency for International Development. Bourke, R. M., B. J. Allen, et al. (1998). Papua New Guinea: Text Summaries. Canberra, Department of Human Geography, Research School of Pacific and Asian Studies, The Australian National University. 1: 221. Bourke, R. M., B. J. Allen, et al. (1998). Papua New Guinea: Text Summaries. Canberra, Department of Human Geography, Research School of Pacific and Asian Studies, The Australian National University. 2: 461. Bourke, R. M., B. Carrad, et al. (1981). "Papua New Guinea's Food Problems: Time for Action." Department of Primary Industry Research Bulletin 29. Port Moresby.(29). Christian, C. S. and G. A. Stewart (1953). General report on survey of Katherine-Darwin Region, 1946. . Commonwealth Scientific and Industrial Research Organisation, Australian Land Research Service 1. Canberra: C.S.I.R.O. Canberra, Australia. Civco, D. L., J. D. Hurd, et al. (2002). A comparison of Land Use and Land Cover Change Detection Methods. ASPRS-ACSM XXII, Washington. Coiffer, C. (1994). "Of People and Plants - a Botanical Ethnography of Nokopo Village, Madang and Morobe Provinces, Papua-New-Guinea- Schmid,Ck." Homme 34(3): 197-198. Commoner, B. (1972). The Environmental Cost of Economic Growth in Population. Resources and the Enviromnent, Government Printing Office, Washington, DC: 24 (339-63). Crocombe, R. G. (1964). "Communal Cash-cropping Among the Orokaiva." New Guinea Research Bulletin, Australian National University, Canberra 4. DSLS, D. o. S. a. L. S. (2000). Trees II Report. Lae, Papua New Guinea University of Technology: 17.
References 46
Epema, G. F., M. F. Botoro, et al. (2000). Monitoring Land use in Tigray (Ethiopia). Remote Sensing for Developing Countries, Ghent, Belgium, European Association of Remote Sensing Laboratories. Ferraz, S. F. d. B., C. A. Vettorazzi, et al. (2004). "Landscape dynamics of Amazonian deforestation between 1984 and 2002 in Central Rondonia, Brazil: assessment and future scenarios." Elsevier - Science Direct: 17. Kok, K. (2004). "The role of population in understanding Honduran land use patterns." Journal of Environmental Management (JEM) - Elsevier(in press): 17. Loveland, T., G. Gutman, et al. (2003). Land Use / Land Cover Change. Strategic Plan for the U.S. Climate Change Science Program. Washington DC, US Climate Change Science Program: 8. Macfarlane, D. (2000). Country Pasture/Forage Resource Profiles - Papua New Guinea. Grassland and Pasture Crops. J. M. Suttie and S. G. Reynolds. Queensland, Kilbirinie: 18. McAlpine, J. and J. Quigley (1998). Forest Resources of Papua New Guinea - Summary Statistics from the Forest Inventory Mapping (FIM) System. C. M. P. Ltd. Port Moresby, PNG Forest Authority: 13. McAlpine, J. R. (1970). "Population and land use in the Goroka-Mt Hagen Area. In: H.A. Hanntjens (ed.), Lands of the Goroka-Mt Hagen Area, Territory of Papua New Guinea." CSIRO Land Research Series No. 27. CSIRO. Canberra(27). McAlpine, J. R., D. F. Freyne, et al. (2000). Land Use and Rural Population Change in PNG, 1975-1996. Food Security for Papua New Guinea, PNG University of Technology, Lae, Papua New Guinea, ACIAR publications. Pahari, K., M. Umezaki, et al. (2001). Land use dynamics in Tari basin of Papua New Guinea using multi sensor satellite data. 22nd Asian Conference on Remote Sensing, Singapore, Asian Association on Remote Sensing (AARS). Pat, R. L. K. (2003). Customery Land Tenure in a Changing Context. Port Moresby, Department of Lands and Physical Planning: 10. Saunders, J. C. (1993). Forest Resources of Papua New Guinea. Canberra, Australian International Development Assistance Bureau (AIDAB). Sem, G. (1995). Land use change and population in Papua New Guinea. Population, Land Management and Environmental Change, Tokyo, Japan, The United Nations University (UNU). Sonneveld, M. P. W., J. A. T. v. d. Brink, et al. (2000). Noise Reduction in GIS-based Land Use Monitoring. Spatial Data Handling, Beijing, China.
References 47
Townshend, J. R. G. and C. O. Justice (1987). "Selecting the Spatial Resolution of satellite sensors required for global monitoring of land transformations." International Journal of Remote Sensing 9(2): 49. Turner, B. L., R. H. Moss, et al. (1993). Relating land use and global land-cover change: A poposal for an IGBP core project. Land-Use and Land-Cover Change. Stockholm, Royal Swedish Accademy of Sciences. Venkatachalam, P., C. V. S. S. B. R. Murty, et al. (1991). "Integration of Remote Sensing and Geographic Information System to Study temporal changes in Land Use." 11 th ACRS - Asian Conference on remote Sensing ii: 3. Verschuren, P. and H. Doorewaard (1999). Designing a Research Project.
Utrecht, Lemma. White, O. (1965). Parliament of a Thousand Tribes. Melbourne, Wren Publishing Pty Ltd. Windybank, S. and M. Manning (2003). "Papua New Guinea On the Brink." The Centre for Independent Studies (CIS) 30. (White 1965; Venkatachalam, Murty et al. 1991; Vicar, Jupp et al. 1991; Verschuren
and Doorewaard 1999; Vanniere, Bossuet et al. 2003; Windybank and Manning 2003; Watson 2004; Woodock and Ozdogan 2004)
ONLINE REFERENCES [URL:1]
National Statistical Office of PNG. http://www.nso.gov.pg/Accessed 02-Jul-04
[URL:2]
Third World Network Features. http://www.hartford-hwp.com/archives/24/083.htmlAccessed 05-Jul-04
[URL:3]
PNG says no to the “terrible twins.” http://www.greenleft.org.au/back/1995/197/197p22.htmAccessed 05-Jul-04
[URL:4]
List of countries by Population Density http://www.fact-index.com/l/li/list_of_countries_by_population_density.htmlAccessed 05-Jul-04
[URL:5]
Human causes of Land use change http://www.ciesin.org/docs/002-105/002-105b.html
References 48
Accessed 20-Jul-04
[URL:6]
Countries of the World http://www.geographic.org/countries/countries.htmlAccessed 01-Mar-05
[URL:7]
City Population – Papua New Guinea http://www.citypopulation.de/PapuaNewGuinea.html#i1456Accessed 03-Mar-05
[URL:8]
Languages of Papua New Guinea http://www.ethnologue.com/show_country.asp?name=Papua+New+GuineaAccessed 06-Feb-05
[URL:9] Land Management: Papua New Guinea’s Dilemma http://www.ulb.ac.be/soco/apft/GENERAL/PUBLICAT/ARTICLES/ARTICLE.HTMAccessed 22-Feb-05
Personal Communication: Dr. Bryant Allan, Department of Human Geography, Australian National University, Australia
References 49

Appendices Appendix A: Land problems related to population growth
Appendices 50

Appendix B: Topographic map sheets of 1975 for Time 1 (T1)
Appendices 51

Appendix C: Clipped Landsat image of 1990 for Time 2 (T2)
Appendices 52

Appendix D: Clipped Landsat image of 2000 for Time 3 (T3)
Appendices 53

Appendix E: The concept of RMU
Attribute I (e.g. landform type: H - hills)
Attribute II (e.g. rock type: a – ultrabasics b –fine grained metamorphics)
Attribute III (e.g. altitude: X – 1200-1800 m) Y –1800-2100 m)
RMU map
1 2
3 4
H
a b
X
Y
Attributes RMU Number I II III Description
1 H a X Hills on ultrabasics between 1200 and 1800 m 2 H b X Hills on fine grained metamorphics between 1200 and 1800 m 3 H a Y Hills on ultrabasics between 1800 and 2100 m 4 H b Y Hills on fine grained metamorphics between 1800 and 2100 m
(Adapted from PNGRIS Handbook)
Appendices 54

Appendix F: Resource Mapping Units (RMU) of Morobe
There is a discrepancy of 153 sq. km between RMU (green) and Administrative (red) boundaries. PNGRIS developers used slightly different RMU boundary.
Appendices 55

Appendix G: Detailed data processing steps
Appendices 56

Appendix H: Data flow of input, processing, and output
Topographic maps 1975 Landsat TM 1990 Landsat ETM+ 2000 RMU Population table
Scanned, georef. tiled Masked and clipped Masked and clipped Updated RMU with population data
Digitized 1975 land use Digitized 1990 land use Digitized 2000 land use Updated RMU map Forest hull
Spatial overlay and tables of land use 1975, land use 2000, updated RMU with population and Forest hull
Population change 75-00 Forest change Agriculture change Grassland change Plantation change
Urban change Water change From To Change Land use intensity Correlation map
Appendices 57
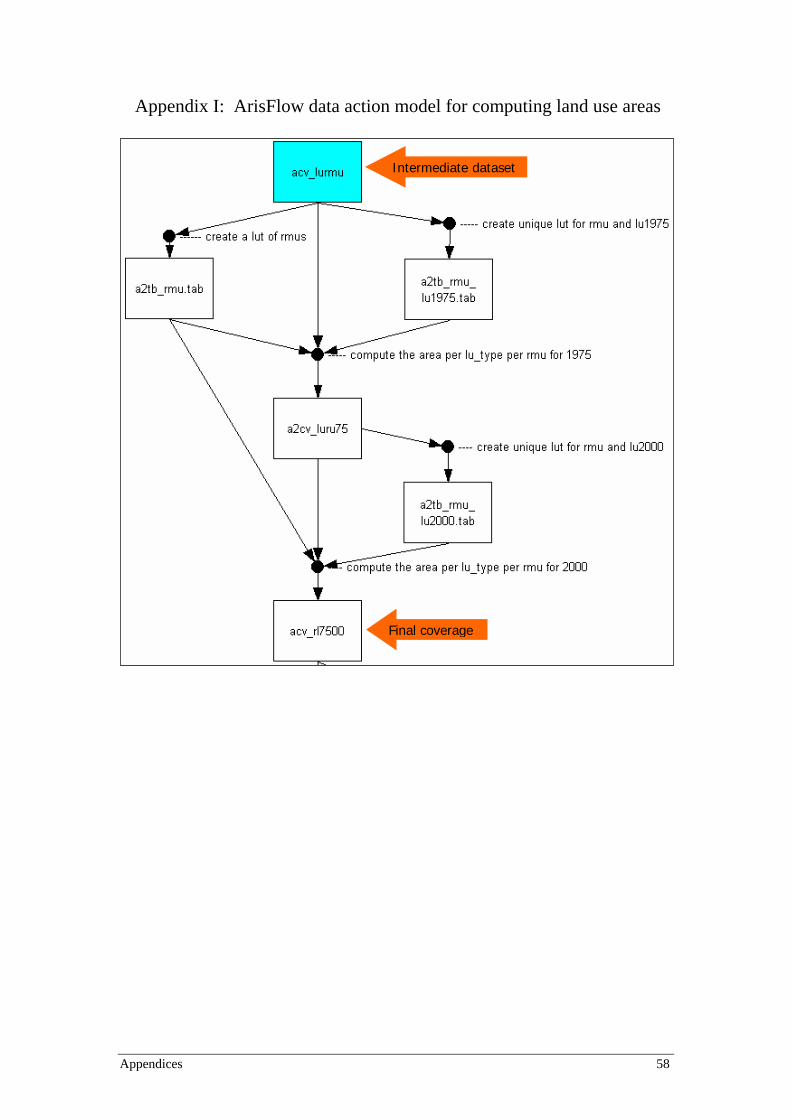
Appendix I: ArisFlow data action model for computing land use areas
Final coverage
Intermediate dataset
Appendices 58

Appendix J: ArisFlow data action model for creating and converting tables to Oracle tables
Final coverage
Multi-attribute table
Appendices 59

Appendix K: Creating intermediate tables for land use change computation in Oracle
Appendices 60

Appendix L: SQL script for generating change tables
Appendices 61

Appendices 62
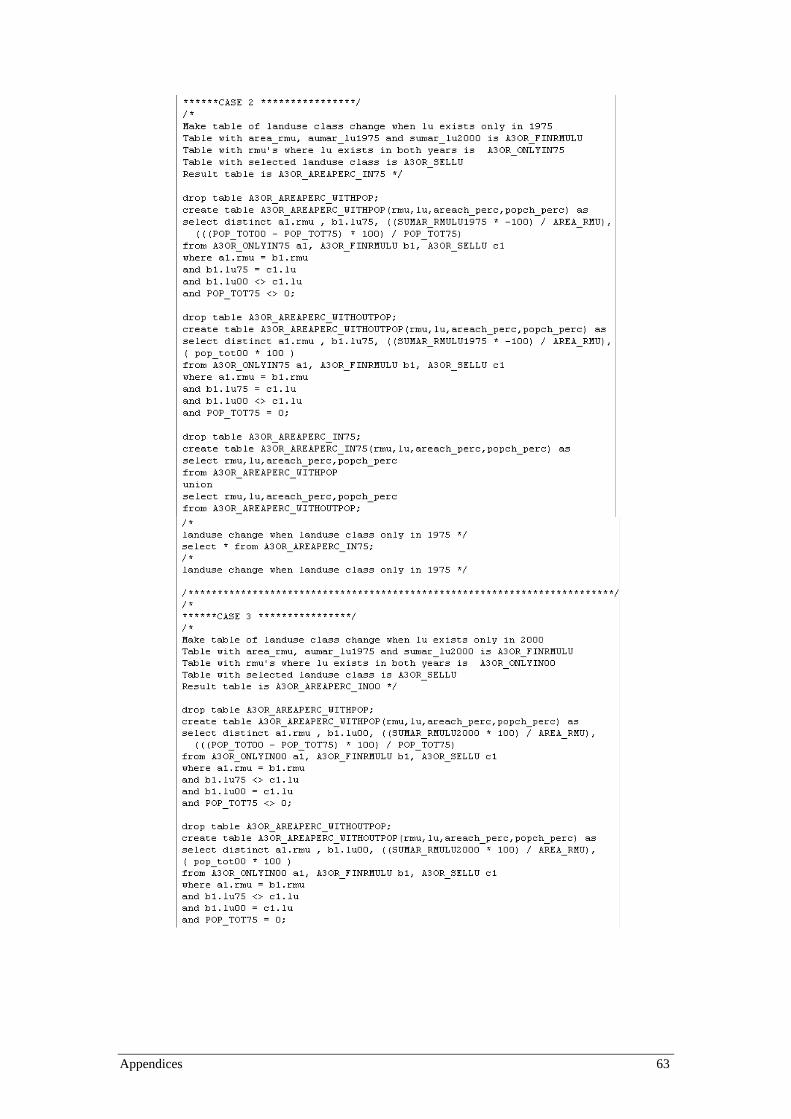
Appendices 63

Appendices 64

Appendix M: ArisFlow data action model for converting change tables from Oracle to info tables
Appendix N: Land use change matrix in km2
1975 Change
2000 Agriculture Forest Grassland Plantation Urban Water 2000 Agriculture 2536 5034 322 39 1 4 7938 Forest 282 20895 311 16 0 6 21509 Grassland 962 817 1574 8 0 1 3363 Plantation 351 125 34 167 0 0 678 Urban 22 11 10 2 22 0 67 Water 1 9 1 0 0 16 27 25210 Change 75 4154 26890 2253 232 24 26 33581
Appendices 65

Appendix O: Land use intensity and villages of Morobe
High Land use intensity areas are in Menyamya, Bulolo and parts of Huon sub-districts.Number of plantings refers to the number of continuous plantings before fallow. Higher number of planting means high land use intensity.
(Source: Agriculture systems of PNG)
Appendix P: Comparison of changes in Population and Agriculture
Change in Population Change in Agriculture 1975-2000 annual growth 1975-2000 annual change
265890 persons 98% 4% 2917 km2 58% 2%
Population Density (persons/km2) 1975 2000
8 – Morobe province 16 – Morobe province 54 – in agriculture areas 68 – in agriculture areas
64 – in agriculture areas with population within agricultural areas
72 – in agriculture areas with population within agricultural areas
Appendices 66

Appendix Q: TIN of Morobe in elevation (meters)
Appendices 67

Appendix R: Annual rainfall in Morobe
Appendices 68

Appendix S: Soil types in Morobe
Appendices 69

Appendix T: Using forest concession areas to assess loss in forest and gain in agriculture
Forest change with concession overlay Morobe forest and concession types
Agriculture change with concession overlay Growth in agriculture overlay on forest change and concessions
When gain in agriculture is overlaid over forest, most of the gains in agriculture fall within the forest areas that lost more. This indicates the forest have been cleared for agricultural purposes. Those areas also show high population figures and clustered villages. Only a small fraction of the loss in forest falls within concession areas.
Appendices 70