ceo incentives-it's not how much you pay, but how
TRANSCRIPT

8/8/2019 CEO Incentives-it's Not How Much You Pay, But How
http://slidepdf.com/reader/full/ceo-incentives-its-not-how-much-you-pay-but-how 1/36
CEO Incentives—It’s Not How Much You Pay, But How
Michael C. JensenHarvard Business School
And
Kevin J. MurphyUniversity of Rochester
ABSTRACT
Paying top executives “better” would eventually mean paying them more. The arrival of springmeans yet another round in the national debate over executive compensation. Soon the business
press will trumpet answers to the questions it asks every year: Who were the highest paid CEOs?How many executives made more than a million dollars? Who received the biggest raises?Political figures, union leaders, and consumer activists will issue now-familiar denunciations of executive salaries and urge that directors curb top-level pay in the interests of social equity andstatesmanship.
The critics have it wrong. There are serious problems with CEO compensation, but “excessive” pay is not the biggest issue. The relentless focus on how much CEOs are paid diverts publicattention from the real problem—how CEOs are paid. In most publicly held companies, thecompensation of top executives is virtually independent of performance. On average, corporateAmerica pays its most important leaders like bureaucrats. Is it any wonder then that so manyCEOs act like bureaucrats rather than the value-maximizing entrepreneurs companies need toenhance their standing in world markets?
We recently completed an in-depth statistical analysis of executive compensation. Our studyincorporates data on thousands of CEOs spanning five decades. The base sample consists of information on salaries and bonuses for 2,505 CEOs in 1,400 publicly held companies from 1974through 1988. We also collected data on stock options and stock ownership for CEOs of the 430largest publicly held companies in 1988. In addition, we drew on compensation data for executives at more than 700 public companies for the period 1934 through 1938.
Keywords: incentives, compensation, salaries, bonuses, CEO, performance based pay, stock options
© Michael C. Jensen and Kevin J. Murphy 1990
Harvard Business Review , May-June 1990, No. 3, pp 138-153.
also published inFoundations of Organizational Strategy , Michael C. Jensen, Harvard University Press, 1998.
You may redistribute this document freely, but please do not post the electronic file on the web. I welcomeweb links to this document at : http://papers.ssrn.com/abstract=146148 . I revise my papers regularly, and
providing a link to the original ensures that readers will receive the most recent version. Thank you,Michael C. Jensen

8/8/2019 CEO Incentives-it's Not How Much You Pay, But How
http://slidepdf.com/reader/full/ceo-incentives-its-not-how-much-you-pay-but-how 2/36
CEO INCENTIVES—IT’S NOT HOW MUCH YOU PAY, BUT HOW
By Michael C. Jensen and Kevin J. Murphy* Harvard Business Review , May-June 1990, No. 3, pp 138-153.
The arrival of spring means yet another round in the national debate over
executive compensation. Soon the business press will trumpet answers to the questions it
asks every year: Who were the highest paid CEOs? How many executives made more
than a million dollars? Who received the biggest raises? Political figures, union leaders,
and consumer activists will issue now-familiar denunciations of executive salaries and
urge that directors curb top-level pay in the interests of social equity and statesmanship.
The critics have it wrong. There are serious problems with CEO compensation,
but “excessive” pay is not the biggest issue. The relentless focus on how much CEOs are
paid diverts public attention from the real problem— ho w CEOs are paid. In most
publicly held companies, the compensation of top executives is virtually independent of
performance. On average, corporate America pays its most important leaders like
bureaucrats. Is it any wonder then that so many CEOs act like bureaucrats rather than the
value-maximizing entrepreneurs companies need to enhance their standing in world
markets?
We recently completed an in-depth statistical analysis of executive compensation.Our study incorporates data on thousands of CEOs spanning five decades. The base
sample consists of information on salaries and bonuses for 2,505 CEOs in 1,400 publicly
* Michael C. Jensen is the Edsel Bryant Ford Professor of Business Administration at the Harvard BusinessSchool. Kevin J. Murphy is an associate professor at the University of Rochester’s William E. SimonSchol of Business Administration.

8/8/2019 CEO Incentives-it's Not How Much You Pay, But How
http://slidepdf.com/reader/full/ceo-incentives-its-not-how-much-you-pay-but-how 3/36
Jensen and Murphy May 19902
held companies from 1974 through 1988. We also collected data on stock options and
stock ownership for CEOs of the 430 largest publicly held companies in 1988. In
addition, we drew on compensation data for executives at more than 700 public
companies for the period 1934 through 1938.
Our analysis leads us to conclusions that are at odds with the prevailing wisdom
on CEO compensation:
Despite the headlines, top executives are not receiving record salaries and
bonuses. Salaries and bonuses have increased over the last 15 years, but CEO pay levels
are just now catching up to where they were 50 years ago. During the period 1934
through 1938, for example, the average salary and bonus for CEOs of leading companies
on the New York Stock Exchange was $882,000 (in 1988 dollars). For the period 1982
through 1988, the average salary and bonus for CEOs of comparable companies was
$843,000.
Annual changes in executive compensation do not reflect changes in corporate
performance . Our statistical analysis posed a simple but important question: For every
$1,000 change in the market value of a company, how much does the wealth of that
company’s CEO change? The answer varied widely across our 1,400-company sample.
But for the median CEO in the 250 largest companies, a $1,000 change in corporate value
corresponds to a change of just 6.7 cents in salary and bonus over two years. Accounting
for all monetary sources of CEO incentives—salary and bonus, stock options, shares
owned, and the changing likelihood of dismissal—a $1,000 change in corporate value
corresponds to a change in CEO compensation of just $2.59.
Compensation for CEOs is no more variable than compensation for hourly and
salaried employees. On average, CEOs receive about 50% of their base pay in the form
of bonuses. Yet these “bonuses” don’t generate big fluctuations in CEO compensation.
A comparison of annual inflation-adjusted pay changes for CEOs from 1975 through
1988 and pay changes for 20,000 randomly selected hourly and salaried workers shows

8/8/2019 CEO Incentives-it's Not How Much You Pay, But How
http://slidepdf.com/reader/full/ceo-incentives-its-not-how-much-you-pay-but-how 4/36
Jensen and Murphy May 19903
remarkably similar distributions. Moreover, a much lower percentage of CEOs took real
pay cuts over this period than did production workers.
With respect to pay for performance, CEO compensation is getting worse rather
than better. The most powerful link between shareholder wealth and executive wealth is
direct stock ownership by the CEO. Yet CEO stock ownership for large public
companies (measured as a percentage of total shares outstanding) was ten times greater in
the 1930s than in the 1980s. Even over the last 15 years, CEO holdings as a percentage
of corporate value have declined.
Compensation policy is one of the most important factors in an organization’s
success. Not only does it shape how top executives behave but it also helps determine
what kinds of executives an organization attracts. This is what makes the vocal protests
over CEO pay so damaging. By aiming their protests at compensation levels , uninvited
but influential guests at the managerial bargaining table (the business press, labor unions,
political figures) intimidate board members and constrain the types of contracts that are
written between managers and shareholders. As a result of public pressure, directors
become reluctant to reward CEOs with substantial (and therefore highly visible) financial
gains for superior performance. Naturally, they also become reluctant to impose
meaningful financial penalties for poor performance. The long-term effect of this risk-
averse orientation is to erode the relation between pay and performance and entrench
bureaucratic compensation systems.
Are we arguing that CEOs are underpaid? If by this we mean “Would average
levels of CEO pay be higher if the relation between pay and performance were stronger?”
the answer is yes. More aggressive pay-for-performance systems (and a higher
probability of dismissal for poor performance) would produce sharply lower
compensation for less talented managers. Over time, these managers would be replaced
by more able and more highly motivated executives who would, on average, perform
8/8/2019 CEO Incentives-it's Not How Much You Pay, But How
http://slidepdf.com/reader/full/ceo-incentives-its-not-how-much-you-pay-but-how 5/36
Jensen and Murphy May 19904
better and earn higher levels of pay. Existing managers would have greater incentives to
find creative ways to enhance corporate performance, and their pay would rise as well.
These increases in compensation—driven by improved business performance—
would not represent a transfer of wealth from shareholders to executives. Rather, they
would reward managers for the increased success fostered by greater risk taking, effort,
and ability. Paying CEOs “better” would eventually mean paying the average CEO
more. Because the stakes are so high, the potential increase in corporate performance and
the potential gains to shareholders are great.
How Compensation Measures Up
Shareholders rely on CEOs to adopt policies that maximize the value of their
shares. Like other human beings, however, CEOs tend to engage in activities that
increase their own well-being. One of the most critical roles of the board of directors is
to create incentives that make it in the CEO’s best interest to do what’s in the
shareholders’ best interests. Conceptually this is not a difficult challenge. Some
combination of three basic policies will create the right monetary incentives for CEOs to
maximize the value of their companies:
• Boards can require that CEOs become substantial owners of company stock.
• Salaries, bonuses, and stock options can be structured so as to provide big
rewards for superior performance and big penalties for poor performance.
• The threat of dismissal for poor performance can be made real.
Unfortunately, as our study documents, the realities of executive compensation
are at odds with these principles. Out statistical analysis departs from most studies of
executive compensation. Unlike the annual surveys in the business press, for example,
we do not focus on this year’s levels of cash compensation or cash compensation plus
stock options exercised. Instead, we apply regression analysis to 15 years’ worth of data

8/8/2019 CEO Incentives-it's Not How Much You Pay, But How
http://slidepdf.com/reader/full/ceo-incentives-its-not-how-much-you-pay-but-how 6/36
Jensen and Murphy May 19905
and estimate how changes in corporate performance affect CEO compensation and
wealth over all relevant dimensions.
We ask the following questions: How does a change in performance affect
current cash compensation, defined as changes in salary and bonus over two years? What
is the “wealth effect” (the present value) of those changes in salary and bonus? How
does a change in corporate performance affect the likelihood of the CEO being dismissed,
and what is the financial impact of this new dismissal probability? Finally, how does a
change in corporate performance affect the value of CEO stock options and shares,
whether or not the CEO exercised the options or sold the shares? (For a discussion of our
methodology, see the insert, “How We Estimate Pay for Performance.”)
The table “The Weak State of Pay for Performance” provides a detailed review of
our main findings for a subsample of CEOs in the 250 largest publicly held companies.
Together, these CEOs run enterprises that generate revenues in excess of $2.2 trillion and
employ more than 14 million people. The results are both striking and troubling. A
$1,000 change in corporate market value (defined as share price appreciation plus
dividends) corresponds to a two-year change in CEO salary and bonus of less than a
dime; the long-term effects of that change add less than 45 cents to the CEO’s wealth. A
$1,000 change in corporate value translates into an estimated median change of a nickel
in CEO wealth by affecting dismissal prospects. At the median, stock options add
another 58 cents worth of incentives. Finally, the value of shares owned by the median
CEO changes by 66 cents for every $1,000 increase in corporate value. All told, for the
median executive in this sub-sample, a $1,000 change in corporate performance translates
into a $2.59 change in CEO wealth. The table also reports estimates for CEOs at the
lower and upper bounds of the middle two quartiles of the sample. (For an extensive
review and comparison of the pay-for-performance relation for individual CEOs, see “A
New Survey of Executive Compensation” that follows this article.)

8/8/2019 CEO Incentives-it's Not How Much You Pay, But How
http://slidepdf.com/reader/full/ceo-incentives-its-not-how-much-you-pay-but-how 7/36
Jensen and Murphy May 19906
THE WEAK STATE OF PAY FOR PERFORMANCE
ESTIMATES FOR CEO S IN THE
250 L ARGEST COMPANIES
A $1,000 C HANGE IN SHAREHOLDER WEALTH CORRESPONDS TO MEDIAN M IDDLE 50%
Change in this year’s and next year’s salary and bonus $0.067 $0.01 to $0.18
Present value of the two-year change in salary and bonus 0.44 0.05 to 1.19Change in the value of stock options 0.58 0.16 to 1.19Wealth effect for change in likelihood of dismissal 0.05 0.02 to 0.14Total change in all pay-related wealth $1.29 $0.43 to $2.66Change in value of direct stockholdings 0.66 0.25 to 1.98Total change in CEO wealth $2.59 $0.99 to $5.87
Note: The median individual components do not add to the median total change in CEO wealth since sums of medians donot in general equal the median of sums.
This degree of pay-for-performance sensitivity for cash compensation does not
create adequate incentives for executives to maximize corporate value. Consider a
corporate leader whose creative strategic plan increases a company’s market value by
$100 million. Based on our study, the median CEO can expect a two-year increase in
salary and bonus of $6,700—hardly a meaningful reward for such outstanding
performance. His lifetime wealth would increase by $260,000—less than 4% of the
present value of the median CEO’s shareholdings and remaining lifetime salary and
bonus payments.1
Or consider instead a CEO who makes a wasteful investment—new aircraft for
the executive fleet, say, or a spanking addition to the headquarters building—that benefits
him but diminishes the market value of the company by $10 million. The total wealth of
this CEO, if he is representative of our sample, will decline by only $25,900 as a result of
this misguided investment—not much of a disincentive for someone who earns on
average $20,000 a week.
1 The median CEO in our sample holds stock worth $2.4 million. The average 1988 salary and bonus forthe CEOs in our sample was roughly $1 million. At a real interest rate of 3%, the present value of thesalary and bonus for the next five years to retirement (the average for the sample) is $4.6 million. Thustotal lifetime wealth from the company is $7 million.

8/8/2019 CEO Incentives-it's Not How Much You Pay, But How
http://slidepdf.com/reader/full/ceo-incentives-its-not-how-much-you-pay-but-how 8/36

8/8/2019 CEO Incentives-it's Not How Much You Pay, But How
http://slidepdf.com/reader/full/ceo-incentives-its-not-how-much-you-pay-but-how 9/36
Jensen and Murphy May 19908
than the average return on the 25 companies with the worst CEO incentives. A $100
investment in the top 25 companies in 1970 would have grown to $1,310 by 1988, as
compared with $702 for a similar investment in the bottom 25 companies.
As a percentage of total corporate value, CEO share ownership has never been
very high. The median CEO of one of the nation’s 250 largest public companies own
shares worth just over $2.4 million—again, less than 0.07% of the company’s market
value. Also, 9 out of 10 CEOs own less than 1% of their company’s stock, while fewer
than 1 in 20 owns more than 5% of the company’s outstanding shares.
It is unreasonable to expect all public-company CEOs to own as large a
percentage of their company’s equity as Warren Buffett’s share of Berkshire Hathaway.
Still, the basic lesson holds. The larger the share of company stock controlled by the
CEO and senior management, the more substantial the linkage between shareholder
wealth and executive wealth. A few companies have taken steps to increase the share of
corporate equity owned by senior management. Employees of Morgan Stanley now own
55% of the firm’s outstanding equity. Companies such as FMC and Holiday have used
leveraged recapitalizations to reduce the amount of outstanding equity by repurchasing
public shares, and thus allow their managers to control a bigger percentage of the
company. After FMC adopted its recapitalization plan, for example, employee ownership
increased from 12% to 40% of outstanding equity. These recapitalizations allow
managers to own a bigger share of their company’s equity without necessarily increasing
their dollar investment.
Truly giant companies like IBM, General Motors, or General Electric will never
be able to grant their senior executives a meaningful share of outstanding equity. These
and other giant companies should understand that this limitation on executive incentives
is a real cost associated with bigness.
Cash compensation should be structured to provide big rewards for outstanding
performance and meaningful penalties for poor performance . A two-year cash reward of

8/8/2019 CEO Incentives-it's Not How Much You Pay, But How
http://slidepdf.com/reader/full/ceo-incentives-its-not-how-much-you-pay-but-how 10/36
Jensen and Murphy May 19909
less than 7 cents for each $1,000 increase in corporate value (or, conversely, a two-year
penalty of less than 7 cents for each $1,000 decline in corporate value) does not create
effective managerial incentives to maximize value. In most large companies, cash
compensation for CEOs is treated like an entitlement program.
There are some notable exceptions to this entitlement pattern. The cash
compensation of Walt Disney CEO Michael Eisner, whose pay has generated such
attention in recent years, is more than ten times more sensitive to corporate performance
than the median CEO in our sample. Yet the small number of CEOs for whom cash
compensation changes in any meaningful way in response to corporate performance
shows how far corporate America must travel if pay is to become an effective incentive.
Creating better incentives for CEOs almost necessarily means increasing the
financial risk CEOs face. In this respect, cash compensation has certain advantages over
stock and stock options. Stock-based incentives subject CEOs to vagaries of the stock
market that are clearly beyond their control. Compensation contracts based on company
performance relative to comparable companies could provide sound incentives while
insulating the CEO from factors such as the October 1987 crash. Although there is some
evidence that directors make implicit adjustments for market trends when they set CEO
pay, we are surprised that compensation plans based explicitly on relative performance
are so rare. 2
The generally weak link between cash compensation and corporate performance
would be less troubling if CEOs owned a large percentage of corporate equity. In fact, it
would make sense for CEOs with big chunks of equity to have their cash compensation
less sensitive to performance than CEOs with small stockholdings. (For example,
Warren Buffet’s two-year cash compensation changes by only a penny for every $1,000
increase in market value.) In some cases, it might even make sense for pay to go up in
2 See Gibbons and Murphy [, 1990 #664, p. 30-S].

8/8/2019 CEO Incentives-it's Not How Much You Pay, But How
http://slidepdf.com/reader/full/ceo-incentives-its-not-how-much-you-pay-but-how 11/36
Jensen and Murphy May 199010
bad years to serve as a financial “shock absorber” for losses the CEO is taking in the
stock market. Yet our statistical analysis found no correlation between CEO stock
ownership and pay-for-performance sensitivity in cash compensation. In other words,
boards of directors ignore CEO stock ownership when structuring incentive
compensation plans. We find this result surprising—and symptomatic of the ills
afflicting compensation policy.
Make real the threat of dismissal. The prospect of being fired as a result of poor
performance can provide powerful monetary and nonmonetary incentives for CEOs to
maximize company value. Because much of an executive’s “human capital” (and thus
his or her value in the job market) is specific to the company, CEOs who are fired from
their jobs are unlikely to find new jobs that pay as well. In addition, the public
humiliation associated with a high-visibility dismissal should cause managers to carefully
weigh the consequences of taking actions that increase the probability of being dismissed.
Here too, however, the evidence is clear: the CEO position is not a very risky job.
Sports fans are accustomed to baseball managers being fired after one losing season.
Few CEOs experience a similar fate after years of underperformance. There are many
reasons why we would expect CEOs to be treated differently from baseball managers.
CEOs have greater organization-specific capital; it is harder for an outsider to come in
and run a giant company than it is for a new manager to take over a ball club. There are
differences in the lag between input and output. The measure of a baseball manager’s
success is the team’s won-lost record this year; the measure of a corporate manager is the
company’s long-term competitiveness and value. For these and other reasons, it is not
surprising that turnover rates are lower for CEOs than for baseball managers. It is
surprising that the magnitude of the discrepancy is so large.
On average, CEOs in our base sample (2,505 executives) hold their jobs for more
than ten years before stepping down, and most give up their title (but not their seat on the
board) only after reaching normal retirement age. Two recent studies, spanning 20 years

8/8/2019 CEO Incentives-it's Not How Much You Pay, But How
http://slidepdf.com/reader/full/ceo-incentives-its-not-how-much-you-pay-but-how 12/36
Jensen and Murphy May 199011
and more than 500 management changes, found only 20 cases where CEOs left their jobs
because of poor performance. 3 To be sure, directors have little to gain from publicly
announcing that a CEO is leaving because of failure—many underperforming CEOs
leave amidst face-saving explanations and even public congratulations. But this culture
of politeness does not explain why so few underperforming CEOs leave in the first place.
University of Rochester’s Michael Weisbach found that CEOs of companies that rank in
the bottom 10% of the performance distribution (measured by stock returns) are roughly
twice as likely to leave their jobs as CEOs whose companies rank in the top 10% of the
performance distribution. Yet the differences that Weisbach quantifies—a 3% chance of
getting fired for top performers versus a 6% chance of getting fired for laggards—are
unlikely to have meaningful motivational consequences for CEOs.
Our own research confirms these and other findings. CEOs of large public
companies are only slightly more likely to step down after very poor performance (which
we define as company earnings 50% below market averages for two consecutive years)
than after average performance. For the entire 1,400 -company sample, our analysis
estimates that the poor-performing CEOs are roughly 6% more likely to leave their jobs
than CEOs of companies with average returns. Even assuming that a dismissed CEO
never works again, the personal wealth consequences of this increased likelihood of
dismissal amounts to just 5 cents for every $1,000 loss of shareholder value.
With respect to pay for performance, there’s no denying that the results of our
study tell a bleak story. Then again, perhaps corporate directors are providing CEOs with
substantial rewards and penalties based on performance, but they are measuring
performance with metrics other than long-run market value. We tested this possibility
and reached the same conclusion as in our original analysis. Whatever the metric, CEO
compensation is independent of business performance.
3 See Warner, Watts, and Wruck [, 1989 #521, p. 461] and Weisbach [, 1988 #523, p. 431].
8/8/2019 CEO Incentives-it's Not How Much You Pay, But How
http://slidepdf.com/reader/full/ceo-incentives-its-not-how-much-you-pay-but-how 13/36
Jensen and Murphy May 199012
For example, we tested whether companies rewarded CEOs on the basis of sales
growth or accounting profits rather than on direct changes in shareholder wealth. We
found that while more of the variation in CEO pay could be explained by changes in
accounting profits than stock market value, the pay-for-performance sensitivity was
economically just as insignificant as in our original model. Sales growth had little
explanatory power once we controlled for accounting profits. 4
Of course, incentives based on other measures will be captured by our
methodology only to the extent that they ultimately correlate with changes in shareholder
wealth. But if they don’t—that is, if directors are rewarding CEOs based on variables
other than those that affect corporate market value—why use such measures in the first
place?
Moreover, if directors varied CEO compensation substantially from year to year
based on performance measures not observable to us, this policy would show up as high
raw variability in CEO compensation. But over the past 15 years, compensation for
CEOs has been about as variable as cash compensation for a random sample of hourly
and salaried workers—dramatic evidence of compensation’s modest role in generating
executive incentives. 5 “Common Variability: CEO and Worker Wages” compares the
distribution of annual raises and pay cuts of our CEO sample with national data on hourly
and salaried workers from 1975 through 1986. A larger percentage of workers took real
pay cuts at some time over this period than did CEOs. Overall, the standard deviation of
annual changes in CEO pay was only slightly greater than for hourly and salaried
employees (32.7% versus 29.7%).
4 For more detail on these tests, see Jensen and Murphy [, 1990 #354].5 Data on hourly and salaried workers come from the Michigan Panel Study on Income Dynamics. Thesample includes 21,895 workers aged 21 to 65 reporting wages in consecutive periods. See McLaughlin [,1989 #781].

8/8/2019 CEO Incentives-it's Not How Much You Pay, But How
http://slidepdf.com/reader/full/ceo-incentives-its-not-how-much-you-pay-but-how 14/36
Jensen and Murphy May 199013
Looking Backward: Pay for Performance in the 1930s
CEO compensation policies look especially unsatisfactory when compared with
the situation 50 years ago. All told, CEO compensation in the 1980s was lower, less
variable, and less sensitive to corporate performance than in the 1930s. To compare the
current situation with the past, we constructed a longitudinal sample of executives from
the 1930s using data collected by the Works Projects Administration. The WPA data,
covering fiscal years 1934 through 1938, include salary and bonus for the highest paid
executive (whom we designate as the CEO) in 748 large U.S. corporations in a wide
range of industries. Nearly 400 of the WPA sample companies were listed on the New
York Stock Exchange, and market values for these companies are available on the CRSP
Monthly Stock Returns Tape. In order to compare similar companies over the two time
periods, we restricted our analysis to companies in the top 25% of the NYSE, ranked by
market value. WPA compensation data are available for 60% of this top quartile group
(averaging 112 companies per year), while data for more recent times are available for
90% of the top quartile companies (averaging 345 companies per year).
Common Variability: CEO and Worker Wages
0
5
10
15
20
25
30
35
Lessthan
–25%
–25%to
–10%
–10%to 0%
0% to+10%
+10%to
+25%
+25%to +50
Morethan
+50%Annual Percentage Wage Changes
P
e r c e n t a g e o f C E O s a n d W o r k e r s
Hourly and salaried workers (1975-1986) CEOs (1975-1988)
8/8/2019 CEO Incentives-it's Not How Much You Pay, But How
http://slidepdf.com/reader/full/ceo-incentives-its-not-how-much-you-pay-but-how 15/36
Jensen and Murphy May 199014
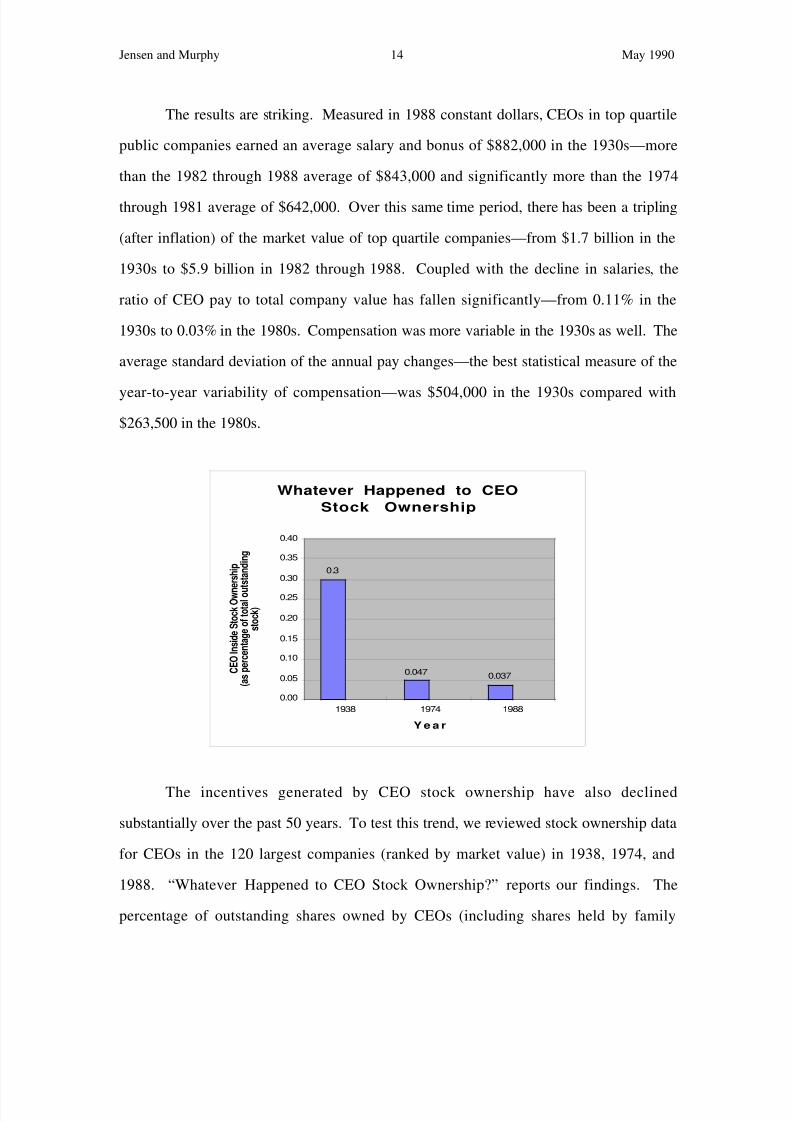
The results are striking. Measured in 1988 constant dollars, CEOs in top quartile
public companies earned an average salary and bonus of $882,000 in the 1930s—more
than the 1982 through 1988 average of $843,000 and significantly more than the 1974
through 1981 average of $642,000. Over this same time period, there has been a tripling
(after inflation) of the market value of top quartile companies—from $1.7 billion in the
1930s to $5.9 billion in 1982 through 1988. Coupled with the decline in salaries, the
ratio of CEO pay to total company value has fallen significantly—from 0.11% in the
1930s to 0.03% in the 1980s. Compensation was more variable in the 1930s as well. The
average standard deviation of the annual pay changes—the best statistical measure of the
year-to-year variability of compensation—was $504,000 in the 1930s compared with
$263,500 in the 1980s.
Whatever Happened to CEOStock Ownership
0.3
0.047 0.037
0.00
0.05
0.10
0.15
0.20
0.25
0.30
0.35
0.40
1938 1974 1988
Ye a r
C E O I n s i d e S t o c k O w n e r s h i p
( a s p e r c e n t a g e o f t o t a l o u t s t a n d i n g
s t o c k )
The incentives generated by CEO stock ownership have also declined
substantially over the past 50 years. To test this trend, we reviewed stock ownership data
for CEOs in the 120 largest companies (ranked by market value) in 1938, 1974, and
1988. “Whatever Happened to CEO Stock Ownership?” reports our findings. The
percentage of outstanding shares owned by CEOs (including shares held by family

8/8/2019 CEO Incentives-it's Not How Much You Pay, But How
http://slidepdf.com/reader/full/ceo-incentives-its-not-how-much-you-pay-but-how 16/36
Jensen and Murphy May 199015
members) in the top 120 companies fell by a factor of nearly ten from 1938 to 1988. The
trend is unmistakable: as a percentage of total market value, CEO stock ownership has
declined substantially over the last 50 years and is continuing to fall.
The Costs of Disclosure
Why don’t boards of directors link pay more closely to performance?
Commentators offer many explanations, but nearly every analysis we’ve seen overlooks
one powerful ingredient—the costs imposed by making executive salaries public.
Government disclosure rules ensure that executive pay remains a visible and
controversial topic. The benefits of disclosure are obvious; it provides safeguards against
“looting” by managers in collusion with “captive” directors. The costs of disclosure are
less well appreciated but may well exceed the benefits.
Managerial labor contracts are not a private matter between employers and
employees. Third parties play an important role in the contracting process, and strong
political forces operate inside and outside companies to shape executive pay. Moreover,
authority over compensation decisions rests not with the shareholders but with
compensation committees generally composed of outside directors. These committees
are elected by shareholders but are not perfect agents for them. Public disclosure of
“what the boss makes” gives ammunition to outside constituencies with their own
special-interest agendas. Compensation committees typically react to the agitation over
pay levels by capping—explicitly or implicitly—the amount of money the CEO earns.
How often do shareholder activists or union leaders denounce a corporate board
for under paying the CEO? Not very often—and that’s precisely the problem. Most
critics of executive pay want it both ways. They want companies to link pay to
performance, yet they also want to limit compensation to arbitrary amounts or some
fuzzy sense of “what’s fair.” That won’t work. Imposing a ceiling on salaries for
outstanding performers inevitably means creating a floor for poor performers. Over time,

8/8/2019 CEO Incentives-it's Not How Much You Pay, But How
http://slidepdf.com/reader/full/ceo-incentives-its-not-how-much-you-pay-but-how 17/36
Jensen and Murphy May 199016
by cutting off the upper and lower tails of the distribution, the entire pay-for-performance
relation erodes. When mediocre outfielders earn a million dollars a year, and New York
law partners earn about the same, influential critics who begrudge comparable salaries to
the men and women running billion-dollar enterprises help guarantee that these
companies will attract mediocre leaders who turn in mediocre performances.
Admittedly, it is difficult to document the effect of public disclosure on executive
pay. Yet there have been a few prominent examples. Bear, Stearns, the successful
investment bank, went public in 1985 and had to submit to disclosure requirements for
the first time. CEO Alan Greenberg’s $2.9 million salary and bonus was the nation’s
fourth highest that year, and his ranking drew attention to the firm’s compensation
system. Under private ownership, compensation of the firm’s managing directors was set
at a modest $150,000 base plus a bonus pool tied to earnings—a tight link between pay
and performance. Because the firm was so profitable in 1986, the bonus pool swelled to
$80 million, an average of $842,000 for each of the firm’s 95 managing directors. A
public outcry ensued. Six months after going public, Bear, Stearns announced it was
lowering the bonus pool from 40% to 25% of the firm’s adjusted pretax earnings in
excess of $200 million. According to one account, the firm’s business success had
“yielded an embarrassment of riches for top executives.” 6
More recently, we interviewed the president of a subsidiary of a thriving publicly
traded conglomerate. This president is compensated with a straight fraction of his
subsidiary’s earnings above a minimum threshold, with no upper bound. Today he
makes roughly five times what he made before his operation was acquired by the
conglomerate, and corporate headquarters recognizes him as one of the company’s
outstanding executives. Why doesn’t he want to be an officer of the conglomerate? For
6 Wall Street Journal , March 21, 1986.

8/8/2019 CEO Incentives-it's Not How Much You Pay, But How
http://slidepdf.com/reader/full/ceo-incentives-its-not-how-much-you-pay-but-how 18/36
Jensen and Murphy May 199017
one, because his salary would have to be made public—a disclosure both he and the CEO
consider a needless invitation to internal and external criticism.
We are not arguing for the elimination of salary disclosure. (Indeed, without
disclosure we could not have conducted this study.) But it’s time compensation
committees stood up to outside criticism and stopped adopting policies that make their
companies’ incentive problem worse. The costs of negative publicity and political
criticism are less severe than the costs to shareholder wealth created by misguided
compensation systems.
Corporate Brain Drain
The level of pay has very little to do with whether or not CEOs have incentives to
run companies in the shareholders’ interests—incentives are a function of how pay,
whatever the level, changes in response to corporate performance. But the level of pay
does affect the quality of managers an organization can attract. Companies that are
willing to pay more will, in general, attract more highly talented individuals. So if the
critics insist on focusing on levels of executive pay, they should at least ask the right
question: Are current levels of CEO compensation high enough to attract the best and
brightest individuals to careers in corporate management? The answer is, probably not.
Who can disagree with these propositions?
• It is good when our most talented men and women are attracted to the
organizations that produce the goods and deliver the services at the heart of
the economy.
• People evaluate alternative careers at least in part on the basis of lifetime
monetary rewards.
• People prefer to make more money than less, and talented, self-confident
people prefer to be rewarded based on performance rather than independent of
it.

8/8/2019 CEO Incentives-it's Not How Much You Pay, But How
http://slidepdf.com/reader/full/ceo-incentives-its-not-how-much-you-pay-but-how 19/36
Jensen and Murphy May 199018
• If some organizations pay more on average and offer stronger pay-for-
performance systems than other organizations, talent will migrate to the
higher paying organizations.
These simple propositions are at the heart of a phenomenon that has inspired
much handwringing and despair over the last decade—the stream of talented, energetic,
articulate young professionals into business law, investment banking, and consulting.
Data on career choices of Harvard Business School graduates document the trend that
troubles so many pundits. Ten years ago, nearly 55% of newly graduated HBS students
chose careers in the corporate sector, while less than 30% chose investment banking or
consulting. By 1987, more than half of all HBS graduates entered investment banking or
consulting, while under 30% chose careers in the corporate sector. Last year, just over
one-third of all graduating HBS students chose corporate careers, while nearly 40% chose
careers in investment banking or consulting. And Harvard Business School is not alone;
we gathered data on other highly rated MBA programs and found similar trends.
We don’t understand why commentators find this trend so mysterious. A highly
sensitive pay-for-performance system will cause high-quality people to self-select into a
company. Creative risk takers who perceive they will be in the upper tail of the
performance and pay distribution are more likely to join companies who pay for
performance. Low-ability and risk-averse candidates will be attracted to companies with
bureaucratic compensation systems that ignore performance.
Compensation systems in professions like investment banking and consulting are
heavily weighted toward the contributions made by individuals and the performance of
their work groups and companies. Compensation systems in the corporate world are
often independent of individual, group, or overall corporate performance. Moreover,
average levels of top-executive compensation on Wall Street or in corporate law are
considerably higher than in corporate America. Financially speaking, if you are a bright,
eager 26-year old with enough confidence to want to be paid based on your contribution,

8/8/2019 CEO Incentives-it's Not How Much You Pay, But How
http://slidepdf.com/reader/full/ceo-incentives-its-not-how-much-you-pay-but-how 20/36
Jensen and Murphy May 199019
why would you choose a career at General Motors or Procter & Gamble over Morgan
Stanley or McKinsey & Company?
Most careers, including corporate management, require lifetime investments.
Individuals must choose their occupation long before their ultimate success or failure
becomes a reality. For potential CEOs, this means that individuals seeking careers in
corporate management must join their companies at an early age in entry-level jobs. The
CEOs in our sample spent an average of 16 years in their companies before assuming the
top job. Of course, many people who reach the highest ranks of the corporate hierarchy
could also expect to be successful in professional partnerships such as law or investment
banking, as proprietors of their own businesses, or as CEOs of privately held companies.
It is instructive, therefore, to compare levels of CEO compensation with the
compensation of similarly skilled individuals who have reached leadership positions in
other occupations.
SALARIES FOR TOP LAWYERS ARE HIGH . . .
RANK FIRM AVERAGE I NCOME PER PARTNER
NUMBER OF
PARTNERS
1 Cravath, Swaine, & Moore $1,595,000 67
2 Cahill Gordon & Reindel $1,420,000 573 Sullivan & Cromwell $1,375,000 914 Wachtell Lipton, Rosen & Katz $1,350,000 465 Skadden, Arps, Slate, Meagher & Flom $1,155,000 177
Source: The American Lawyer, July-August 1989, p. 34.
The compensation of top-level partners in law firms is one relevant comparison.
These numbers are closely guarded secrets, but some idea of the rewards to top partners
can be gleaned from data on average partner income reported each year in a widely read
industry survey. The table “Salaries for Top Lawyers Are High . . .” reports 1988
estimated average incomes earned by partners in the highest paying corporate law firms.
These five firms paid their 438 partners average incomes ranging from $1.35 million to
nearly $1.6 million. Partners at the very top of these firms earned substantially more.

8/8/2019 CEO Incentives-it's Not How Much You Pay, But How
http://slidepdf.com/reader/full/ceo-incentives-its-not-how-much-you-pay-but-how 21/36
Jensen and Murphy May 199020
When comparing these results with corporate compensation, the appropriate question to
ask is “How many public companies paid their top 67 or 177 executives average salaries
of $1.6 million or $1.2 million in 1989?” The answer is, few or none. How surprising is
it, then, that law school classes are bulging with some of the country’s brightest students?
. . . S O ARE SALARIES ON WALL STREET
FIRM
NUMBER OF PARTNERS
EARNING MORE THAN $3M ILLION IN 1988
AVERAGE EARNINGS FOR
PARTNERS EARNING MORE
THAN $3 M ILLION IN 1988
Drexel Burnham Lambert 20 $18,000,000Goldman, Sachs 18 $ 9,100,000Morgan Stanley 11 $ 4,300,000Sterling Group 6 $36,700,000Kohlberg Kravis Roberts 5 $59,000,000
Lazard Freres 5 $17,200,000Salomon Brothers 5 $ 4,700,000Neuberger & Berman 5 $ 4,700,000
Source: Financial World, July 11, 1989. Average earnings are based on Financial World’s lower bound earningsestimate, p. 32.
Compensation for the most successful corporate managers is also modest in
comparison with compensation for the most successful Wall Street players. Here too it is
difficult to get definitive numbers for a large sample of top executives. But the most
recent annual survey, as reported in the table “. . . So Are Salaries on Wall Street,”
documents the kinds of rewards available to top investment bankers. At Goldman, Sachs,
for example, 18 partners earned more than $3 million in 1988, and the average income
for those partners was more than $9 million. Only nine public-company CEOs had
incomes in excess of $9 million in 1988 (mostly through exercising stock options), and
no public company paid its top 18 executives more than $3 million each. The Wall Street
surveys for 1989 are not yet available, but consistent with high pay-for-performancesystems, they will likely show sharp declines in bonuses reflecting lower 1989 industry
performance.
The compensation figures for law and investment banking look high because they
reflect only the most highly paid individuals in each occupation. Average levels of
8/8/2019 CEO Incentives-it's Not How Much You Pay, But How
http://slidepdf.com/reader/full/ceo-incentives-its-not-how-much-you-pay-but-how 22/36
Jensen and Murphy May 199021
compensation for lawyers or investment bankers may not be any higher than average pay
levels for executives. But that’s not the relevant comparison. The very best lawyers or
investment bankers can earn substantially more than the very best corporate executives.
Highly talented people who would succeed in any field are likely to shun the corporate
sector, where pay and performance are weakly related, in favor of organizations where
pay is more strongly related to performance—and the prospect of big financial rewards
more favorable.
Money Isn’t Everything
Some may object to our focus on monetary incentives as the central motivator of
CEO behavior. Are there not important nonmonetary rewards associated with running a
large organization? Benefits such as power, prestige, and public visibility certainly do
affect the level of monetary compensation necessary to attract highly qualified people to
the corporate sector. But unless nonmonetary rewards vary positively with company
value, they are no more effective than cash compensation in motivating CEOs to act in
the shareholders’ interests. Moreover, because nonmonetary benefits tend to be a
function of position or rank, it is difficult to vary them from period to period based on
performance.
Indeed, nonmonetary rewards typically motivate top managers to take actions that
reduce productivity and harm shareholders. Executives are invariably tempted to acquire
other companies and expand the diversity of the empire, even though acquisitions often
reduce shareholder wealth. As prominent members of their community, CEOs face
pressures to keep open uneconomic factories, to keep the peace with labor unions despite
the impact on competitiveness, and to satisfy intense special-interest pressures.
Monetary compensation and stock ownership remain the most effective tools for
aligning executive and shareholder interests. Until directors recognize the importance of

8/8/2019 CEO Incentives-it's Not How Much You Pay, But How
http://slidepdf.com/reader/full/ceo-incentives-its-not-how-much-you-pay-but-how 23/36
Jensen and Murphy May 199022
incentives—and adopt compensation systems that truly link pay and performance—large
companies and their shareholders will continue to suffer from poor performance.
How We Estimate Pay for Performance
Our analysis draws primarily on two sources of data: annual executive
compensation surveys published in Forbes magazine from 1975 through 1988 and
Standard & Poor’s Compustat file. The base sample includes information on 2,505 CEOs
from 1,400 companies. We estimated pay-for-performance sensitivities for each CEO
using a variety of statistical techniques. The findings reported in the table “The Weak
State of Pay for Performance” represent the median and “middle 50%” CEOs in a sample
of the 250 largest companies.
Perhaps the best way to illustrate our methodology is to review pay-for-
performance calculations for a single CEO—for example, David H. Murdock of Castle &
Cooke, Inc., who tops our list of large-company CEOs with the best incentives. For each
element of Mr. Murdock’s compensation, we estimated answers to the same question:
How does that compensation element change in response to a $1,000 change in corporate
value, as measured by annual share price appreciation and dividends?
Two-Year Change in Salary and Bonus. We used least squares regression to
calculate the relation between the dollar change in salary and bonus and the dollar change
in shareholder wealth for all companies with at least seven years of pay-change data from
1975 through 1988. We estimate a single pay-for-performance sensitivity for each
company, therefore our estimates for Castle & Cooke use data on both Murdock and his
predecessor Donald Kirchhoff. We did not use data on three other former CEOs—Robert
Cook, Ian Wilson, and Henry Clark, Jr. —because they each served as CEO for less than
two years and we could therefore not calculate pay changes. The regression equation
uses last year’s performance in addition to this year’s performance as explanatory
variables. The result was:
8/8/2019 CEO Incentives-it's Not How Much You Pay, But How
http://slidepdf.com/reader/full/ceo-incentives-its-not-how-much-you-pay-but-how 24/36
Jensen and Murphy May 199023
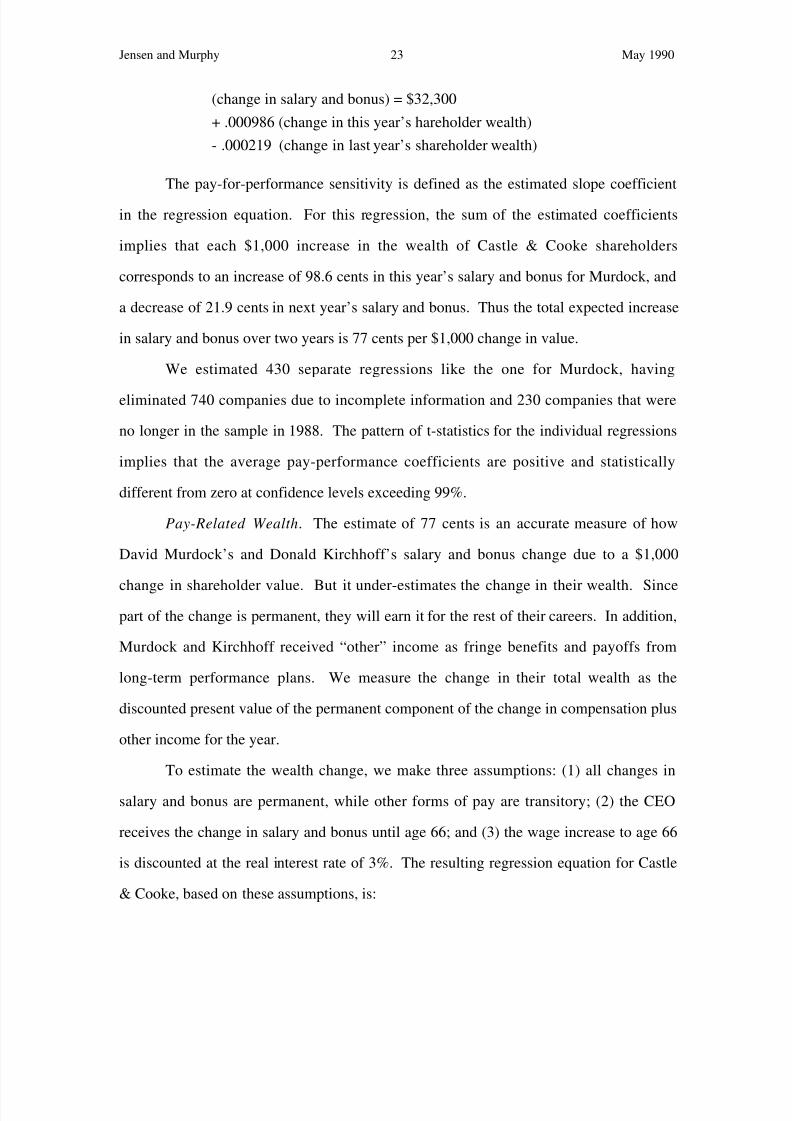
(change in salary and bonus) = $32,300+ .000986 (change in this year’s hareholder wealth)- .000219 (change in last year’s shareholder wealth)
The pay-for-performance sensitivity is defined as the estimated slope coefficient
in the regression equation. For this regression, the sum of the estimated coefficients
implies that each $1,000 increase in the wealth of Castle & Cooke shareholders
corresponds to an increase of 98.6 cents in this year’s salary and bonus for Murdock, and
a decrease of 21.9 cents in next year’s salary and bonus. Thus the total expected increase
in salary and bonus over two years is 77 cents per $1,000 change in value.
We estimated 430 separate regressions like the one for Murdock, having
eliminated 740 companies due to incomplete information and 230 companies that were
no longer in the sample in 1988. The pattern of t-statistics for the individual regressions
implies that the average pay-performance coefficients are positive and statistically
different from zero at confidence levels exceeding 99%.
Pay-Related Wealth . The estimate of 77 cents is an accurate measure of how
David Murdock’s and Donald Kirchhoff’s salary and bonus change due to a $1,000
change in shareholder value. But it under-estimates the change in their wealth. Sincepart of the change is permanent, they will earn it for the rest of their careers. In addition,
Murdock and Kirchhoff received “other” income as fringe benefits and payoffs from
long-term performance plans. We measure the change in their total wealth as the
discounted present value of the permanent component of the change in compensation plus
other income for the year.
To estimate the wealth change, we make three assumptions: (1) all changes in
salary and bonus are permanent, while other forms of pay are transitory; (2) the CEO
receives the change in salary and bonus until age 66; and (3) the wage increase to age 66
is discounted at the real interest rate of 3%. The resulting regression equation for Castle
& Cooke, based on these assumptions, is:
8/8/2019 CEO Incentives-it's Not How Much You Pay, But How
http://slidepdf.com/reader/full/ceo-incentives-its-not-how-much-you-pay-but-how 25/36
Jensen and Murphy May 199024
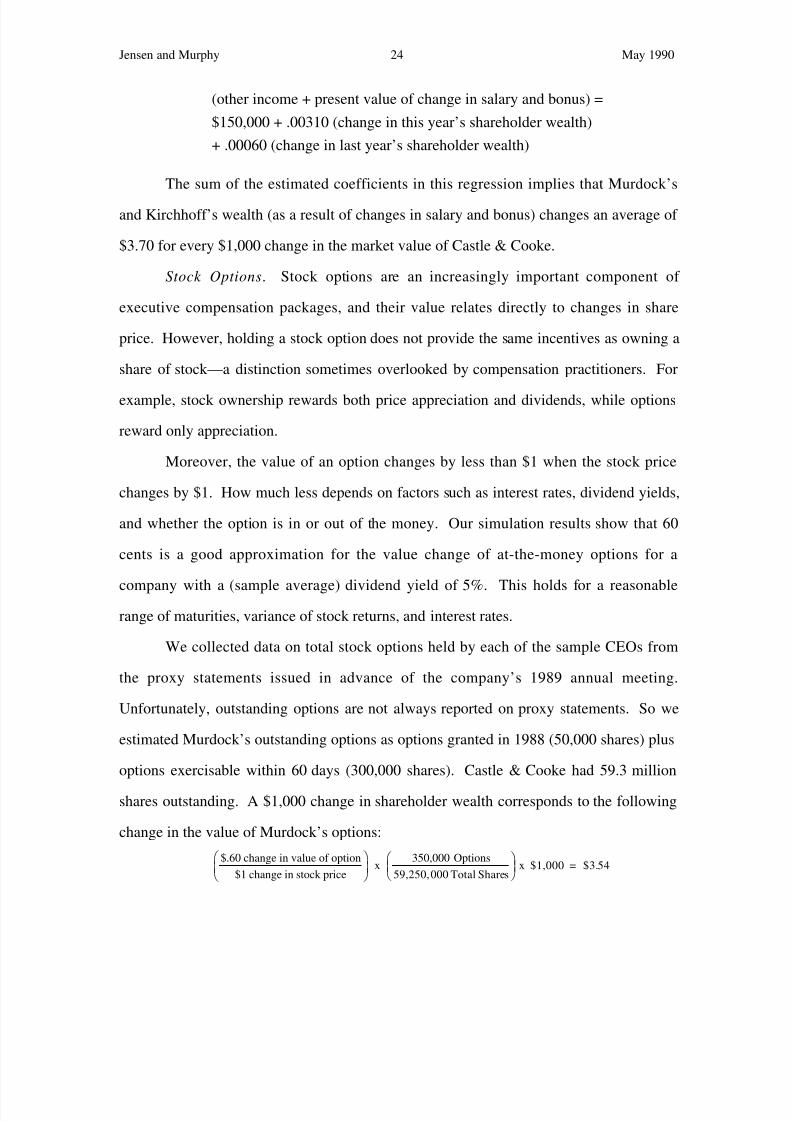
(other income + present value of change in salary and bonus) =$150,000 + .00310 (change in this year’s shareholder wealth)+ .00060 (change in last year’s shareholder wealth)
The sum of the estimated coefficients in this regression implies that Murdock’s
and Kirchhoff’s wealth (as a result of changes in salary and bonus) changes an average of
$3.70 for every $1,000 change in the market value of Castle & Cooke.
Stock Options . Stock options are an increasingly important component of
executive compensation packages, and their value relates directly to changes in share
price. However, holding a stock option does not provide the same incentives as owning a
share of stock—a distinction sometimes overlooked by compensation practitioners. For
example, stock ownership rewards both price appreciation and dividends, while options
reward only appreciation.
Moreover, the value of an option changes by less than $1 when the stock price
changes by $1. How much less depends on factors such as interest rates, dividend yields,
and whether the option is in or out of the money. Our simulation results show that 60
cents is a good approximation for the value change of at-the-money options for a
company with a (sample average) dividend yield of 5%. This holds for a reasonablerange of maturities, variance of stock returns, and interest rates.
We collected data on total stock options held by each of the sample CEOs from
the proxy statements issued in advance of the company’s 1989 annual meeting.
Unfortunately, outstanding options are not always reported on proxy statements. So we
estimated Murdock’s outstanding options as options granted in 1988 (50,000 shares) plus
options exercisable within 60 days (300,000 shares). Castle & Cooke had 59.3 million
shares outstanding. A $1,000 change in shareholder wealth corresponds to the following
change in the value of Murdock’s options:
$.60 change in value of option$1 change in stock price
x350,000 Options
59,250,000 Total Sharesx $1,000 = $3.54

8/8/2019 CEO Incentives-it's Not How Much You Pay, But How
http://slidepdf.com/reader/full/ceo-incentives-its-not-how-much-you-pay-but-how 26/36
Jensen and Murphy May 199025
Thus Murdock’s option-related wealth changes by $3.54 for every $1,000 change
in shareholder wealth. This estimate understates the change in the value of his options to
the extent that he holds options granted prior to 1988 that are not exercisable within 60
days. We also underestimate the option-value change if his outstanding options are in the
money, while we overstate the value change of out-of-the-money options.
Dismissal Incentives . The threat of being fired for poor performance provides
monetary as well as nonmonetary incentives for CEOs to maximize value. We estimate
the financial incentives associated with dismissal through a four-stage process. First,
using nonlinear “logistic” regression techniques on our 1974 through 1988 sample of
2,505 CEOs, we estimate the probability that a CEO will leave the job as a function of
industry, company size, CEO age, market-relative performance, and lagged market-
relative performance. Second, we compute point estimates of the departure probabilities
when the company earns the market rate of return for two years versus when the
company realizes share-price returns 50% below the market in two consecutive years.
Third, we multiply the difference in these two “dismissal probabilities” by the discounted
value of the CEO’s potential lost wages, assuming that the CEO would have received the
current salary until age 66, and, if dismissed, never works again. Fourth, we calculate the
dismissal performance sensitivity by dividing the CEO’s potential wealth loss by the
shareholder loss associated with earning 50% below-market returns for two years.
In Murdock’s case, the probability that a 65-year-old CEO in a smaller-than-
median-size company leaves his job is 20.7% in years when the company earns the
market return and 23.9% when his company earns 50% below the market return for two
straight years. The probability that Murdock will be fired (or encouraged to leave) for
poor performance is 3.2%. Murdock’s dismissal-related loss is his $1.5 million 1988 pay
multiplied by the turnover-probability difference, or about $48,000. (If Murdock had
been younger than 65, we would have calculated the present value of his 1988 pay until
he reached 66.) Castle & Cooke shareholders, on the other hand, would lose about $1.25

8/8/2019 CEO Incentives-it's Not How Much You Pay, But How
http://slidepdf.com/reader/full/ceo-incentives-its-not-how-much-you-pay-but-how 27/36
Jensen and Murphy May 199026
billion of their $1.67 billion equity from two straight years of 50% below-market
performance. Thus Murdock’s potential wealth loss is about 3.8 cents per $1,000 lost by
shareholders.
It is important to note that while our estimates of other CEO incentive sources use
data for the individual CEO’s company, our estimates of CEO-dismissal performance
sensitivities are based on the entire sample. It is generally impossible to make company-
specific estimates of the wealth effects of dismissal threats.
Stock Ownership . The most important component of CEO incentives is also the
easiest to measure. As of March 1989, Murdock held directly 13,203,932 shares of
Castle & Cooke. In addition, his children hold 80,870 shares in trusts. All told, his
family holds 13,284,802 shares, or 22.42% of Castle & Cooke’s outstanding stock. His
total stock-related incentives are roughly $224.24 per $1,000 change in market value.
Putting It All Together. David Murdock’s total pay-for-performance sensitivity is
simply the sum of the sensitivities of each compensation element, of $231.53 per $1,000
change in shareholder value. This makes Murdock the CEO with the best incentives in
the 250 largest companies.

8/8/2019 CEO Incentives-it's Not How Much You Pay, But How
http://slidepdf.com/reader/full/ceo-incentives-its-not-how-much-you-pay-but-how 28/36
Jensen and Murphy May 199027
Appendix
A New Survey of Executive Compensation
Routinely misused and abused, surveys contribute to the common ills of corporatecompensation policy. Surveys that report average compensation across industries help
inflate salaries, as everyone tries to be above average (but not in front of the pack).
Surveys that relate pay to company sales encourage systems that tie compensation to size
and growth, not performance and value. Surveys that rank the country’s highest paid
executives stir public outrage, raise legislative eyebrows, and provide emotional
justification for increased demands in labor negotiations.
The basic problem with existing compensation surveys is that they focus
exclusively on how much CEOs are paid instead of how they are paid. Our focus on
incentives rather than levels leads naturally to a new and different kind of survey. Instead
of reporting who’s paid the most, our survey reports who’s paid the best—that is, whose
incentives are most closely aligned with the interests of their shareholders.
Our survey considers incentives from a variety of sources—including salary and
bonus, stock options, stock ownership, and the threat of getting fired for poor
performance. It includes only companies listed in the Forbes executive compensation
surveys for at least eight years from 1975 through 1989, since we require at least seven
years of pay change to estimate the relation between pay and performance. Our
methodology is described in the insert “How We Estimate Pay for Performance.”
Compensation surveys in the business press, such as those published by Fortune
and Business Week , are really about levels of pay and not about pay for performance. Yetthey often include an analysis or ranking of the appropriateness of a particular CEO’s pay
by relating it to company performance in some fashion. The methods adopted by
Fortune and Business Week share a common flaw. CEOs earning low fixed salaries
while delivering mediocre performance look like stars; on the flip side, CEOs with
8/8/2019 CEO Incentives-it's Not How Much You Pay, But How
http://slidepdf.com/reader/full/ceo-incentives-its-not-how-much-you-pay-but-how 29/36
Jensen and Murphy May 199028
genuinely strong pay-for-performance practices rank poorly. For example, Business
Week’ s 1989 survey calculates the ratio of the change in shareholder wealth to the CEO’s
total compensation, both measured over three years. Executives with the highest ratios
are labeled the “CEOs Who Gave the Most for Their Pay.” Low-ratio CEOs purportedly
gave shareholders the least. Fortune ’s 1989 compensation issue uses a regression model
to estimate how compensation varies with factors such as the CEO’s age and tenure,
company size, location, industry, and performance. Although the author cautions against
taking the results too literally, CEOs earning more than predicted are implicitly
designated as “overpaid,” while those earning less than predicted are “underpaid.”
Consider the case of Disney’s Michael Eisner. By all accounts, Mr. Eisner’s pay
is wedded to company performance—in addition to loads of stock options, he gets 2% of
all profits above an annually increasing threshold. Shareholders have prospered under
Eisner, and few have complained that his compensation is unreasonable in light of the $7
billion in shareholder wealth he has helped create since joining the company in 1984.
But Business Week ranks Eisner second on the list of CEOs who gave their shareholders
the least (right behind option-laden Lee Iacocca, who over the past decade helped created
$6 billion in wealth for the Chrysler shareholders), while Fortune flags Eisner as the
nation’s third most overpaid CEO. Survey’s ranking Eisner and Iacocca low are clearly
not measuring incentives. In contrast, our survey ranks Eisner and Iacocca as the nation’s
fourth and ninth respectively “best paid” CEOs measured on the basis of pay-related
wealth alone.
We estimated the pay-for-performance relation for each of the 430 companies for
which we have sufficient data. The results are summarized in the four nearby tables.
Three of the tables include results for the 250 largest companies ranked by 1988 sales.
The 25 CEOs with the best and worst overall incentives, as reflected by the relation
between their total compensation (composed of all pay-related wealth changes and the
change in the value of stock owned), are summarized in the first two tables. Castle &

8/8/2019 CEO Incentives-it's Not How Much You Pay, But How
http://slidepdf.com/reader/full/ceo-incentives-its-not-how-much-you-pay-but-how 30/36
Jensen and Murphy May 199029
Cooke, whose current CEO is David Murdock, ranks first with a total change in CEO
wealth of $231.53 for every $1,000 change in shareholder wealth. His stockholdings
contribute $224.24 of this amount, while the change in all pay-related wealth adds
another $7.29.
With a few exceptions, it is clear that the best incentives are determined primarily
by large CEO stockholdings. Donald Marron of Paine Webber is such an exception, with
more than $55 of his total of $67 coming from changes in pay-related wealth. So too are
Philip Hawley of Carter Hawley Hale, Henry Schacht of Cummins Engine, and Disney’s
Eisner.
The 25 companies providing their CEOs with the worst total incentives are led by
Navistar International whose CEO James Cotting on average receives a $1.41 increase in
wealth for every $1,000 decrease in shareholder value. Carolina Power & Light’s
Sherwood Smith, Jr. receives a 16-cent increase for every $1,000 decrease in shareholder
wealth. Other well-known corporations whose CEOs appear on the worst-incentives list
include Chevron, Johnson & Johnson, Eastman Kodak, and IBM.
Although one has to recognize that there is statistical uncertainty surrounding our
estimates of pay-related wealth sensitivity, no CEO with substantial equity holdings
(measured as a fraction of the total outstanding equity) makes our list of low-incentive
CEOs. As we point out in the accompanying article, an important disadvantage of
corporate size is that it is extremely difficult for the CEO to hold a substantial fraction of
corporate equity.
The inverse relation between size and stockholdings (and therefore the negative
effect of size on incentives) is readily visible in the much higher sensitivities shown for
the top 25 CEOs in smaller companies, those ranking from 251 to 430 in 1988 sales.
(See the table “The Best of the Rest: CEO Incentives in Smaller Companies.”) Warren
Buffett of Berkshire Hathaway leads this list with $446 per $1,000, followed by William
8/8/2019 CEO Incentives-it's Not How Much You Pay, But How
http://slidepdf.com/reader/full/ceo-incentives-its-not-how-much-you-pay-but-how 31/36
Jensen and Murphy May 199030
Swindells, Jr. of Williamette Industries, Joe Allbritton of Riggs National, and Barron
Hilton of Hilton Hotels. Again, the importance of large stockholdings is clear.
Indeed, one problem with current compensation practices is that boards often
reward CEOs with substantial equity through stock options but then stand by to watch
CEOs undo the incentives by unloading their stockholdings. Boards seldom provide
contractual constraints or moral suasion that discourage the CEO from selling such shares
to invest in a diversified portfolio of assets. One of the ironies of the situation is that the
corporation itself often funds executive financial counseling by consultants whose
common mantra is “sell and diversity, sell and diversify.” While this can be personally
advantageous to executives, it is not optimal for shareholders or society because it
significantly reduces CEOs’ incentives to run their companies efficiently.
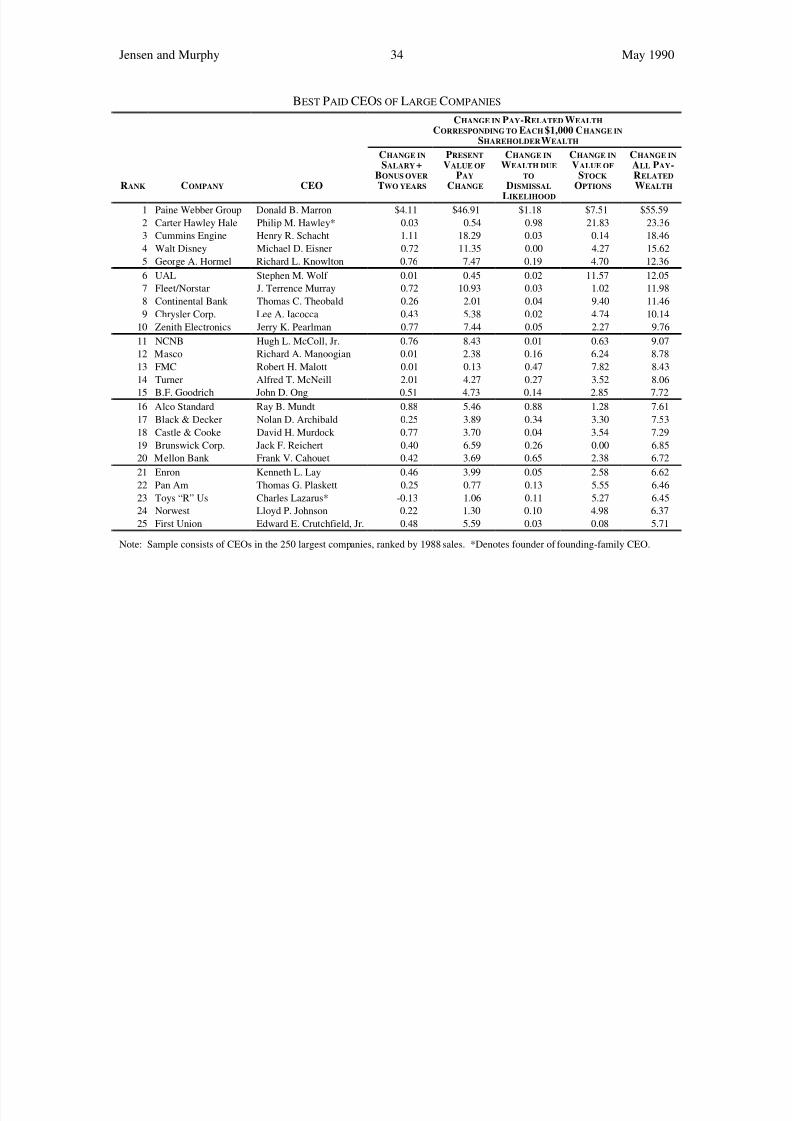
Pay-related incentives are under the direct control of the compensation committee
and the board. The table “Best Paid CEOs of Large Companies” lists the 25 companies
that reward their CEOs in a way that provides the best incentives from pay-related wealth
alone—changes in salary and bonus, long-term incentive plans, dismissal likelihood, and
stock options. Each of these estimates is given in the table, along with the sum of the
effects in the last column. The table makes clear that the major contributors to pay-
related incentives are stock options and the present value of the change in salary and
bonus.
Authors’ note: The accompanying tables present estimates of pay-for-
performance sensitivities for only a fraction of the CEOs in our full survey. Readers who
would like a copy of the full 430-company survey, along with a detailed technical
appendix fully describing our methodology, can write to Professor Kevin J. Murphy at
the University of Southern California, 4165 Chevy Chase Drive, LaCanada, CA 91011.

8/8/2019 CEO Incentives-it's Not How Much You Pay, But How
http://slidepdf.com/reader/full/ceo-incentives-its-not-how-much-you-pay-but-how 32/36
Jensen and Murphy May 199031
THE 25 CEO S OF LARGE COMPANIES WITH THE BEST INCENTIVES
TOTAL EFFECTS (OVER TWO YEARS ) ON CEOWEALTH CORRESPONDINGTO EACH $1,000 C HANGE
IN SHAREHOLDER WEALTH
RANK COMPANY CEO
CHANGE IN ALL
PAY -RELATED
WEALTH
CHANGE IN
THE VALUE OF
STOCK WNED
CHANGE IN
TOTAL CEOWEALTH
1 Castle & Cooke David H. Murdock $7.29 $224.24 $231.532 Amerada Hess Leon Hess* 0.02 152.71 152.733 Wang Laboratories An Wang* 0.84 137.83 138.684 Aon Corp. Patrick G. Ryan 0.76 137.46 138.225 Loews Laurence A. Tisch 0.00 126.40 126.40
6 Ethyl Floyd D. Gottwald, Jr. -0.25 90.73 90.487 Marriott J. Willard Marriott, Jr.* 1.55 72.58 74.148 MCA Lew R. Wasserman 0.05 70.10 70.159 Paine Webber Group Donald B. Marron 55.59 11.44 67.03
10 Paccar Charles M. Pigott 2.25 50.86 53.12
11 Times Mirror Robert F. Erburu 3.29 45.39 48.6712 Coastal Corp. Oscar S. Wyatt, Jr.* 0.43 44.33 44.75
13 Archer-Daniels-Midland Dwayne O. Andreas -0.15 41.23 41.0714 Carter Hawley Hale Philip M. Hawley* 23.36 16.25 39.6015 McDonnell Douglas John F. McDonnell* 0.09 33.79 33.88
16 CBS Laurence A. Tisch 1.79 31.58 33.3717 Humana David A. Jones* 1.34 25.88 27.2218 Winn-Dixie Stores A. Dano Davis 2.72 23.22 25.9519 Masco Richard A. Manoogian 8.78 14.08 22.8620 American Int’l Group Maurice R. Greenberg 0.50 21.72 22.22
21 Digital Equipment Kenneth H. Olsen* 1.00 19.06 20.0722 MCI Communications William G. McGowan* 1.77 17.95 19.7323 Cummins Engine Henry B. Schacht 18.46 0.87 19.3324 Walt Disney Michael D. Eisner 15.62 2.88 18.5025 FMC Robert H. Malott 8.43 7.04 15.47
Note: Sample consists of CEOs in the 250 largest companies, ranked by 1988 sales. *Denotes founder or founding-family CEO.

8/8/2019 CEO Incentives-it's Not How Much You Pay, But How
http://slidepdf.com/reader/full/ceo-incentives-its-not-how-much-you-pay-but-how 33/36
Jensen and Murphy May 199032
THE 25 CEO S OF LARGE COMPANIES WITH THE WORST INCENTIVES
TOTAL EFFECTS (OVER TWO YEARS ) ON CEOWEALTH CORRESPONDING TO EACH $1,000 C HANGE
IN SHAREHOLDER WEALTH
RANK COMPANY CEO
CHANGE IN ALL
PAY-RELATED
WEALTH
CHANGE IN THE
VALUE OF
STOCK OWNED
CHANGE IN
TOTAL CEOWEALTH
226 Central & South West Merle L. Borchelt $0.14 $0.32 $0.46227 Campbell Soup R. Gordon McGovern $0.07 0.38 0.44228 3M Allen F. Jacobson 0.28 0.11 0.39229 Sears Roebuck Edward A. Brennan 0.17 0.20 0.37230 AMP Walter F. Raab -0.03 0.39 0.36
231 Consolidated Edison Arthur Hauspurg 0.22 0.12 0.34232 Detroit Edison Walter J. McCarthy, Jr. 0.24 0.07 0.31233 Commonwealth Edison James J. O’Connor 0.24 0.06 0.30234 Texas Utilities Jerry S. Farrington 0.23 0.07 0.29235 Exxon Lawrence G. Rawl 0.14 0.11 0.25
236 AT&T Robert E. Allen 0.19 0.04 0.24237 ARCO Lodwrick M. Cook -0.10 0.33 0.23
238 IBM John F. Akers 0.13 0.06 0.19239 Borden Romeo J. Ventres -0.20 0.38 0.18240 Eastman Kodak Colby H. Chandler -0.09 0.08 0.17
241 R.R. Donnelley & Sons John R. Walter -0.18 0.34 0.16242 Johnson & Johnson Ralph S. Larsen 0.11 0.05 0.15243 Chevron Corp. Kenneth T. Derr -0.04 0.15 0.11244 GTE James J. Johnson 0.04 0.07 0.11245 Pacific Gas & Electric Richard A. Clarke 0.06 0.04 0.10
246 Philadelphia Electric Joseph F. Paquette, Jr. 0.07 0.01 0.08247 PacifiCorp Al M. Gleason -0.04 0.08 0.04248 Honeywell James J. Renier -0.51 0.40 -0.10249 Carolina Power & Light Sherwood H. Smith, Jr. -0.61 0.45 -0.16250 Navistar International James C. Cotting -1.61 0.20 -1.41
Note: Sample consists of CEOs in the 250 largest companies, ranked by 1988 sales.

8/8/2019 CEO Incentives-it's Not How Much You Pay, But How
http://slidepdf.com/reader/full/ceo-incentives-its-not-how-much-you-pay-but-how 34/36
Jensen and Murphy May 199033
THE BEST OF THE REST: CEO I NCENTIVES IN SMALLER COMPANIES
TOTAL EFFECTS (OVER TWO YEARS ) ON CEOWEALTH CORRESPONDING TO EACH $1,000
CHANGE IN SHAREHOLDER WEALTH
RANK COMPANY CEO
CHANGE IN ALL
PAY-RELATED
WEALTH
CHANGE IN THE
VALUE OF
STOCK OWNED
CHANGE IN
TOTAL CEOWEALTH
1 Berkshire Hathaway Warren E. Buffett $0.06 $446.77 $446.832 Williamette Industries William Swindells, Jr. 0.64 427.10 427.753 Riggs National Joe L. Allbritton 1.22 358.19 359.404 Hilton Hotels Barron Hilton* 0.85 245.90 246.755 Timken William R. Timkin, Jr.* 5.20 142.46 147.66
6 United Missouri Bancshares R. Crosby Kemper 1.08 118.65 119.737 Zions Bancorporation Roy W. Simmons 2.76 89.17 91.938 First Empire State Robert G. Wilmers 18.72 71.63 90.369 Florida National Banks John D. Uible 1.85 87.66 89.51
10 Equimark Alan S. Fellheimer 15.53 72.28 87.81
11 W.W. Grainger David W. Grainger* 0.21 79.13 79.3412 Fin’l Corp. of Santa Barbara Philip R. Brinkerhoff 54.68 21.41 76.09
13 Golden West Financial Herbert M. Sandler* 4.48 67.36 71.8314 Merchants National Otto N. Frenzel, III 9.59 60.19 69.7915 First City Bancorp of Texas A. Robert Abboud -0.21 58.75 58.54
16 First Security Spencer F. Eccles 2.63 44.84 47.4717 Central Bancshares of the South Harry B. Brock, Jr.* 4.89 38.25 43.1518 Freuhauf T. Neal Combs 16.20 21.14 37.3419 Holiday Michael D. Rose 14.01 20.94 34.9420 Cullen/Frost Bankers Thomas C. Frost* 8.90 25.95 34.85
21 Beneficial Corp. Finn M.W. Caspersen 3.37 29.87 33.2322 Yellow Freight System George E. Powell, Jr. 0.86 30.90 31.7623 Data General Edison D. deCastro* 1.89 29.79 31.6824 Equitable Bancorporation H. Grant Hathaway 11.01 17.23 28.2425 Imperial Corp. of America Kenneth J. Thygerson 24.98 2.52 27.51
Note: Sample consists of CEOs in companies ranked 251 to 430 by 1988 sales. *Denotes founder or founding-familyCEO.
8/8/2019 CEO Incentives-it's Not How Much You Pay, But How
http://slidepdf.com/reader/full/ceo-incentives-its-not-how-much-you-pay-but-how 35/36
Jensen and Murphy May 199034
BEST PAID CEOS OF LARGE COMPANIES
CHANGE IN PAY -RELATED WEALTHCORRESPONDING TO EACH $1,000 C HANGE IN
SHAREHOLDER WEALTH
RANK C OMPANY CEO
C HANGE INSALARY +
BONUS OVERTWO YEARS
PRESENTVALUE OF
PAYCHANGE
CHANGE INWEALTH DUE
TODISMISSAL
LIKELIHOOD
CHANGE INVALUE OF
STOCKOPTIONS
C HANGE INALL PAY -R ELATEDWEALTH
1 Paine Webber Group Donald B. Marron $4.11 $46.91 $1.18 $7.51 $55.592 Carter Hawley Hale Philip M. Hawley* 0.03 0.54 0.98 21.83 23.363 Cummins Engine Henry R. Schacht 1.11 18.29 0.03 0.14 18.464 Walt Disney Michael D. Eisner 0.72 11.35 0.00 4.27 15.625 George A. Hormel Richard L. Knowlton 0.76 7.47 0.19 4.70 12.366 UAL Stephen M. Wolf 0.01 0.45 0.02 11.57 12.057 Fleet/Norstar J. Terrence Murray 0.72 10.93 0.03 1.02 11.988 Continental Bank Thomas C. Theobald 0.26 2.01 0.04 9.40 11.469 Chrysler Corp. Lee A. Iacocca 0.43 5.38 0.02 4.74 10.14
10 Zenith Electronics Jerry K. Pearlman 0.77 7.44 0.05 2.27 9.7611 NCNB Hugh L. McColl, Jr. 0.76 8.43 0.01 0.63 9.0712 Masco Richard A. Manoogian 0.01 2.38 0.16 6.24 8.7813 FMC Robert H. Malott 0.01 0.13 0.47 7.82 8.4314 Turner Alfred T. McNeill 2.01 4.27 0.27 3.52 8.06
15 B.F. Goodrich John D. Ong 0.51 4.73 0.14 2.85 7.7216 Alco Standard Ray B. Mundt 0.88 5.46 0.88 1.28 7.6117 Black & Decker Nolan D. Archibald 0.25 3.89 0.34 3.30 7.5318 Castle & Cooke David H. Murdock 0.77 3.70 0.04 3.54 7.2919 Brunswick Corp. Jack F. Reichert 0.40 6.59 0.26 0.00 6.8520 Mellon Bank Frank V. Cahouet 0.42 3.69 0.65 2.38 6.7221 Enron Kenneth L. Lay 0.46 3.99 0.05 2.58 6.6222 Pan Am Thomas G. Plaskett 0.25 0.77 0.13 5.55 6.4623 Toys “R” Us Charles Lazarus* -0.13 1.06 0.11 5.27 6.4524 Norwest Lloyd P. Johnson 0.22 1.30 0.10 4.98 6.3725 First Union Edward E. Crutchfield, Jr. 0.48 5.59 0.03 0.08 5.71
Note: Sample consists of CEOs in the 250 largest companies, ranked by 1988 sales. *Denotes founder of founding-family CEO.

8/8/2019 CEO Incentives-it's Not How Much You Pay, But How
http://slidepdf.com/reader/full/ceo-incentives-its-not-how-much-you-pay-but-how 36/36
Jensen and Murphy May 199035
References
Gibbons, Robert and Murphy, Kevin J. “Relative Performance Evaluation for Chief Executive Officers.” Industrial and Labor Relations Review (February 1990).
Jensen, Michael C. and Murphy, Kevin J. “Performance Pay and Top Management Incentives.” Journal of Political Economy 98 (1990), pp. 225-264.
McLaughlin, Kenneth J. “Rigid Wages?” University of Rochester Working Paper. Rochester, NY:University of Rochester, 1989.
Warner, Jerold, Watts, Ross L. and Wruck, Karen H. “Stock Prices and Top Management Changes.” Journal of Financial Economics (January-March 1988).
Weisbach, Michael S. “Outside Directors and CEO Turnover.” Journal of Financial Economics (January-March 1988).