how monetary incentives improve outcomes in moocs
TRANSCRIPT

How Monetary Incentives Improve Outcomes in
MOOCs: Evidence from a Field Experiment
Jie Gong Tracy Xiao Liu Jie Tang∗
June 13, 2021
Abstract
In this study, we examine the impact of monetary incentives on user engagement and
learning outcomes in massive open online courses (MOOCs). While MOOCs offer high-
quality interactive educational resources to users worldwide, maintaining user engagement
and enthusiasm on these platforms is a challenge. To address this issue, we conduct a field
experiment in which users are given monetary incentives to engage in online learning. Our
results show that those given a monetary incentive are more likely to submit homework
and to gain higher homework grades. We further find that the effect persists even after we
remove the monetary incentives and that it spills over into learning behavior in other courses
in the same and subsequent semester. Overall, our findings suggest that monetary incentives
counteract engagement decay and may help online users form persistent learning habits.
Keywords: Online platform design, MOOCs, Field experiment
∗Gong: Department of Strategy and Policy, NUS Business School, National University of Singapore.Email: [email protected]. Liu: Department of Economics, School of Economics and Management, TsinghuaUniversity, Beijing, China. Email: [email protected]. Tang: Department of Computer Scienceand Technology, Tsinghua University, Beijing, China. Email: [email protected]. We thank YanChen, Jonathan Guryan, Jennifer Hunt, Peter Kuhn, Erica Li, Sherry Xin Li, Fangwen Lu, Ben Roth, andseminar participants at the National University of Singapore, Renmin University, Beijing Normal University,Queensland University of Technology, Tsinghua University, 6th Annual Xiamen University InternationalWorkshop on Experimental Economics, the First International Workshop on AI and Big Data Analyticsin MOOCs (AI-MOOC), 2017 International Symposium on Contemporary Labor Economics Institute forEconomic and Social Research, Jinan University for helpful discussions and comments, and Jiezhong Qiu,Han Zhang, Fang Zhang, and Shuhuai Zhang for excellent research assistance. We gratefully acknowledgesupport from XuetangX and the Online Education Office, Tsinghua University. Financial support fromMinistry of Education of the People’s Republic of China (MOE) Research Center for Online Education, NSFCfor Distinguished Young Scholar (61825602) and the National Key Research and Development Program ofChina (No.2018YFB1004503) is gratefully acknowledged.
1

1 Introduction
Over the past decade, online learning has become an established component of higher educa-
tion and corporate training and a multibillion-dollar market in modern economies.1 MOOCs
offer affordable (often free) educational content from highly reputable sources and have the
potential to vastly increase human capital accumulation. However, MOOCs struggle with
low completion rates and a significant decay in learner activity across the semester. For
instance, Kizilcec et al. (2013) and Seaton et al. (2014) document that only 5% of MOOC
users have completed a course. The low completion rates could be a result of a matching
process if, for example, the users just shop around or engage in the sections that are most
important to them. For such users, it is rational and expected not to complete a course, as
the opportunity cost of testing interest in a new subject is negligible.
However, the low completion rates can be a significant concern if it is due to either
content or individual problems. If the quality of content and instruction discourage user
engagement, it is relatively easier to fix. But if the specific nature of an online environment—
e.g., lack of monitoring and peer groups—leads to severe self-control problems, it could be
more challenging to alter individual learning habit. Indeed, Banerjee and Duflo (2014) find
that less organized students are less likely to succeed in a MOOC due to a failure to complete
assignments rather than poor performance on completed assignments.
The aim of this study is to examine alternative methods of incentivizing online users
and motivating self-discipline. In particular, we examine whether monetary incentives can
effectively mitigate the observed decay in activity across an online course. We conduct a field
experiment on XuetangX, the third largest MOOC platform worldwide. The setting appears
to entail an engagement challenge due to individual learning habits. Past complement rates
have been low but a good share of registered users have clear goals (i.e., they are not shopping
around). Of the participants in our study, 23% state that they enrolled in the course to earn
a certificate and 22% because the content would be helpful in their jobs.
We select two courses offered in Spring 2015, Cultural Treasure and Chinese Culture
(Chinese Culture) and Data Structure and Algorithm (Data Structure), and reward 760
participants for completing homework assignments across a 4-week period in the middle of
the course. For each course, we randomly assign subjects to either the control group or
one of six treatment groups. In three of the treatment groups, subjects are rewarded 1, 10,
and 100 rmb (the official currency of China),2 respectively, for each completed assignment
that exceeds our prespecified grade threshold. In the other three treatment groups, subjects
1Coursera, for instance, raised $103 million in Series E funding that valued the company around $1 billion.21 rmb ≈ 0.15 US dollars.
2

initially receive a deposit and then lose 1, 10, and 100 rmb, respectively, for each assignment
that falls short of the grade threshold. We implement the incentive for three assignments
around the middle of the semester and collect learners’ activity and grades before, during,
and after the intervention.
Overall, our experimental results show that providing a monetary incentive improves both
engagement and performance in online courses. Specifically, we find that a large incentive
(100 rmb reward or loss) on average improves the assignment completion rate by 12.8%
and assignment grades by 9.2% (conditional on submission). A medium incentive (10 rmb
reward or loss) shows significant effects for users taking Chinese Culture, but not for those
taking Data Structure; a small incentive (1 rmb reward or loss) shows no effects on student
engagement in either course. The improved engagement reflects sustained activity by regular
users rather than an uptake in activity by inactive users. In addition, we find that the
effects persist even after we remove the monetary incentive, and that they spill over to
engagement and performance in other courses in the same semester and course completion
in the subsequent semester. Lastly, we find that female subjects and those from regions with
fewer higher education institutions are more responsive to monetary incentives.
Our findings suggest that offering a monetary incentive could be a scalable solution to
sustain online users’ engagement and performance. In our experiment, 100 rmb is universally
effective and more than sufficient for one course; the scheme covers only three assignments
over 4 weeks. In comparison, the benefits are large in magnitude and persistent over time;
we do not find evidence of a monetary incentive crowding out intrinsic motivation. Our
findings on persistence of the incentive effects also provide evidence that the baseline low
engagement may be suboptimal. The evidence of spillover across time and courses further
implies that increased engagement is more likely to be driven by changes in learning habits
rather than selection of courses. Another point worth noting is that offering an incentive may
affect the decision to enroll in a course (e.g., attract more users); although offline classrooms
have limited seats, the online environment does not have such crowding costs, and therefore
can accommodate more users who are attracted by the incentives. Along the same line, we
are aware of the potential sample selection due to the way we recruit participants. Users
who volunteered to participate in the experiment may differ from those who did not. Our
findings might be biased towards frequent or attentive users. We are therefore cautious in
extending the estimated effects to more representative samples.
Our study contributes to the stream of literature that puts behavioral economics to prac-
tice; in particular, regarding the effect of financial incentives in motivating learning. Prior
studies mostly focus on traditional offline classrooms and find mixed results.3 Several studies
3Campos-Mercade and Wengstrom (2020) provides a comprehensive review for monetary incentives in
3
find a short-term, positive effect of incentives on students’ learning performance (Angrist et
al., 2002, 2009; Angrist and Lavy, 2009; Braun et al., 2011; Levitt et al., 2016a), though
significant treatment heterogeneity exists between courses (Bettinger, 2012) and students
(De Paola et al., 2012). A few also find a long-term post-incentive effect (Angrist et al.,
2006, 2009; De Paola et al., 2012) while others find negative impact in the long-run, espe-
cially for low-ability students (Campos-Mercade and Wengstrom, 2020; Leuven et al., 2010).
Additionally, using a large-scale field experiment in three U.S. cities, Fryer (2011) finds no
significant effect of a financial incentive on students’ scores. One of the most relevant field
experiments is Belles-Obrero (2020), which reports a significant interaction effect between
incentive schemes and students type in the online education setting. For example, rewarding
top students has positive (negative) impact on those with high (low) intrinsic motivation.
We also make a first attempt to experimentally investigate the size and framing effect of
financial incentives on online learning. Examining previous evidence in offline classrooms, it
is ex ante unclear whether these results will hold in online settings. It is possible that online
learners may have different and/or more diverse motivations for pursuing their education,
including intrinsic goals, personal interest in the topic, or career advancement. Therefore,
they may be less responsive to monetary incentives than offline students who learn in order
to obtain credits and grades toward a degree. Another difference between offline and on-
line learners is that the online learning environment does not provide monitoring and peer
group control mechanisms to motivate learning. Thus, the self-control problem becomes a
significant hurdle that may be mitigated by the use of a strengthened incentive.
Our study further contributes to the literature of behavioral economics that documents
the persistent and spillover effects of incentives. Charness and Gneezy (2009) find that
paying people to visit a gym helps develop exercise habits and improves health outcomes
in the long run. Royer et al. (2015) show that although incentive programs that target
the use of a gym have limited lasting effects, an additional commitment option has strong
long-run effects that extend beyond the end of the commitment-contract period. Hussam et
al. (2017) find that providing monitoring and incentives can boost hand-washing rates even
when those manipulations are removed, suggesting that participants internalize the habit of
hand washing in the long run. However, other studies show that treatment effects do not
persist over time (Gneezy and List 2006; Meier 2007). We suggest that understanding the
long-term and spillover effects of incentives is useful in designing and implementing monetary
incentives at both the academic and policy level.
A growing literature studies the effectiveness of online learning. Deming et al. (2015) find
evidence that colleges charge lower prices for online coursework, suggesting that online learn-
education.
4

ing technologies make higher education more economically feasible for students. In another
study, Acemoglu et al. (2014) argue that web-based technology has the power to democra-
tize education by distributing resources more equally among students and by complementing
the non-web-based inputs of low-skilled local teachers. However, Hansen and Reich (2015)
find that MOOC participants from the U.S. tend to live in better neighborhoods than the
general population, and students from better socioeconomic backgrounds are more likely to
succeed in MOOCs. Cacault et al. (2019) show that online live streaming of lectures lowers
achievement for low-ability students and increases achievement for high-ability ones.
Regarding learning effectiveness, Banerjee and Duflo (2014) document significant engage-
ment decay in online courses and find evidence for a self-control problem. To combat this
issue, Patterson (2018) tests three behaviorally motivated tools and shows that a commit-
ment device can increase effort and performance in an online course, while an alert or a
distraction blocking tool fail to motivate online learners. Jaggars and Xu (2016) and Zhang
et al. (2017) find that promoting social interaction significantly improves both students’
completion rates and their course grades. Kizilcec and Brooks (2017) further survey a broad
range of field experiments on MOOCs. Our experiment aims to evaluate the effectiveness of
another possible mechanism to encourage student engagement and performance: offering a
monetary incentive under different framing.
2 Field Setting: XuetangX
XuetangX was launched in China in 2013 as a start-up MOOC platform affiliated with
Tsinghua University and the Ministry of Education (MOE) of China. By 2015, when we
conducted the experiment, it had offered 670 courses to more than 1,700,000 registered
users.4 In addition to providing its own course content, XuetangX also partners with EdX
and collaborates with top universities, providing users with access to courses offered by
U.S. universities including MIT, Stanford, and UC Berkeley. Compared with other MOOCs,
XuetangX is more public in nature and provides a greater number of free courses and accounts
to alleviate education inequality and promote life-long learning in China.5
XuetangX courses can be roughly divided into two fields: art and literature and science
and engineering. Courses in the two fields typically differ in their style, workload, learning
objectives, and student composition (Qiu et al., 2016).6 We draw on one course from each of
4As of May 2018, XuetangX had attracted more than 10 million users and offered more than 1,000 courses.5For instance, XuetangX and Tsinghua University provide half a million free accounts to more than 0.5
million delivery staff working at Meituan-Dianping, the world’s largest online on-demand delivery platform.Source: http://news.sina.com.cn/o/2018-04-02/doc-ifysvmhv5582478.shtml.
6For instance, art and literature courses on average attract more female users than science and engineering
5

these fields, i.e., Chinese Culture and Data Structure, to conduct our experiment. Most of the
courses on XuetangX follow a semester system. At the beginning of each semester, courses
are listed for users to browse through and decide whether to enroll. There is no restriction
on the number of courses any user can register for in a single semester. Enrollment for the
courses remains open throughout the semester, so that users can enroll or drop out any time
before the course ends. Dropping a course does not trigger any penalty. Compared to other
MOOCs, such as Coursera, that require prepayment as an incentive for course completion,
XuetangX employs very few structures to foster learning incentives. As such, it provides a
blank canvas for us to implement a learning incentive treatment.
Courses on XuetangX are structured by chapters, with corresponding lecture videos and
assignments posted frequently. Science and engineering courses are generally perceived as
more demanding than their art and literature counterparts, in that they require more aca-
demically challenging assignments. Students taking a course on XuetangX receive a final
grade for the course determined by some combination of assignments, exams, and projects.
Once enrolled in a course, a user can access the posted course materials from her account
and view lecture videos, complete assignments, post a thread in a course forum, or respond
to other students’ posts. Qiu et al. (2016) describe these activities and summarize observed
patterns in student activities on the platform.
Like other MOOCs, XuetangX faces a participation issue reflected in low user engagement
and a decrease in engagement over a course. For example, Qiu et al. (2016) show that both
viewing lecture videos and submitting assignments decrease significantly over time. Similarly,
Feng et al. (2018) find that the likelihood of a user dropping a course is positively correlated
with dropping another course, suggesting an overall engagement decrease rather than effort
reallocation among courses. Figure 1 presents the average homework submission rate and
grades of XuetangX users in our two selected courses over time, using 2014 fall data from
Chinese Culture and Data Structure, i.e., one semester before we conducted the experiment.
For both courses, homework submission rates and grades dropped quickly after the first
2 weeks, with a reduction of more than half by midterm. This finding is consistent with
engagement patterns found in other MOOC studies (e.g., Banerjee and Duflo 2014).
3 Experimental Design
To investigate the effect of monetary incentives on learner engagement and performance,
we use a 3×2 factorial design with our control group receiving no incentive. In treatment
groups, we vary the incentive size and framing. On the size dimension, we offer three levels
courses.
6

of incentives—small, medium and large—to investigate the degree to which incentive size
affects engagement and performance. On the framing dimension, we investigate whether
positive versus negative framing (i.e., gain versus loss) leads to different effects for a given
size of incentive.
As documented by Qiu et al. (2016), courses in art and literature differ from those in
science and engineering in their requirements, difficulty level, and composition of students
enrolled. Consequently, we select one course from each category to capture any possible
heterogeneous treatment effects across courses and disciplines. Chinese Culture and Data
Structure are chosen because both have been offered on XuetangX for three semesters. Their
relatively mature course design and materials provide greater confidence that our results are
not affected by idiosyncratic shocks from the courses per se. For both courses, users receive
a certificate if their final grades exceed 60 out of 100 points.
The first course in our experiment, Chinese Culture, is offered by the Department of
History at Tsinghua University and lasts from March 2, 2015 to June 22, 2015. The course
consists of 16 lectures, with one assignment posted that corresponds to each lecture.7 Stu-
dents can complete the assignments anytime before the course ends. These homework as-
signments collectively account for 40% of a student’s final grade. In addition, a midterm
exam accounts for 20% and a final exam 40% of the grade. For our experiment, three sets of
assignments—i.e., assignments 8, 9, and 10—are subject to our incentive scheme; we collect
data on user activities throughout the whole semester. We choose three sets of assignments
around the middle of the semester for two reasons. First, enrollment is not stabilized during
the first few weeks and we don’t want to risk losing a large number of participants during
the experiment; second, the first few assignments are not subject to any intervention, and
provide useful information about participants’ baseline activity and performance. We use
the data to test randomization and as further controls in the regression.
The second course in our experiment, Data Structure, is offered by the Department of
Computer Science and Technology at Tsinghua University and lasts from March 3, 2015
to June 23, 2015. There are 12 lectures and, similar to Chinese Culture, an assignment is
posted at the end of each lecture. Each assignment is due one month after it is posted, and
accounts for 5% of a student’s final grade (60% in total). In addition, four programming
projects account for 40%. Our intervention targets three assignments—assignments 6, 7,
and 8; again, we collect data on user activities throughout the whole semester.
7The only exception is the last lecture, which has two assignments.
7

3.1 Treatments
Each of our treatment groups is given a monetary incentive for successful completion of
homework. We define successful completion as a homework submission that correctly an-
swers at least 80% of the questions. This threshold is determined using benchmark data
from homework records for each course in its previous offerings. Specifically, we summarize
student performance for each course in the fall 2014 semester—i.e., one semester before our
experiment—and find that conditional on submission (nonzero grades), both the mean and
median scores are 80% for each course. We therefore consider this to be a feasible target
that students can meet with a reasonable amount of effort. Interviews with TAs suggest that
an average student should be able to complete an assignment within 30 minutes for Data
Structure and 10 minutes for Chinese Culture.
The participants in our experiment are randomly assigned to the control or one of six
treatment groups. Users in the control group receive no incentive. They receive only one
email at the beginning of the experiment that encourages them to complete their assignments.
The same email is sent to the treatment groups. For instance, the control group in the Data
Structure course receives the following message:
Data Structure has been updated to the 6th homework assignment. If you want
to get your certificate, you should finish your homework on time and try your
best to get high grades!
In addition to this message, treatment groups receive a paragraph in their email that out-
lines their monetary incentive. Depending on which treatment they are assigned to, students
may be offered one of three different levels of payment size: 1 rmb, 10 rmb and 100 rmb.
In determining the amount of incentive to offer, we draw on Gneezy and Rustichini (2000),
who show that small incentives may crowd out intrinsic motivations and lead to inferior
performance, as well as Ariely et al. (2009), who find that excessively high incentives may
also have a detrimental effect on individual productivity. Therefore, one rmb is considered a
small amount. We use the one rmb treatment group to test whether a small monetary incen-
tive may crowd out the intrinsic motivation of learning. Moreover, it can help account for
other common confounding factors in the literature, such as reference-dependency, saliency,
goal-setting, and anchoring.8 Ten rmb represents a medium amount, which is an acceptable
amount as a reward. One hundred rmb is the largest amount and is considered a generous
reward. For comparison, student TAs at Tsinghua University are paid 24 rmb per hour.
Regarding framing, findings from prior literature are mixed. Hossain and List (2012)
and Hong et al. (2015) find that framing bonus as loss significantly increases factory work-
8We thank an anonymous referee for pointing this out.
8

ers’ productivity. Andreoni (1995) finds that positive framing of an incentive significantly
increases participants’ contributions in public goods. Furthermore, both Fryer et al. (2012)
and Levitt et al. (2016b) find that framing incentives in the loss domain is more effective for
enhancing students’ performance. Finally, Karlan et al. (2016) find no significant effect of
incentive framing on individuals’ saving behavior, and Chen et al. (2018) similarly find no
framing effect on students arrival time for experimental sessions. In our experiment, we vary
how the incentives are framed using a similar implementation as in Hossain and List (2012).
For example, our positive framing introduces the incentive as a gain for each assignment that
receives a score of at least 80%. Positive-framing participants receive the following message:
For the next 3 assignments, you will receive an X rmb reward for every assignment
grade that is ≥80% of the total score.9
By contrast, negative framing introduces the incentive as a loss for each assignment that
fails to meet the 80% threshold. Negative-framing participants receive the following message:
For the next 3 assignments, you will receive a one-time bonus of 3×X rmb.
However, for every assignment grade <80% of the total score, the bonus will be
reduced by X rmb.
To minimize potential collusion between students, we impose a deadline such that to
claim the monetary reward, students must submit their assignment within 2 weeks of the
assignment’s posting date. User activity from the past semester shows that most homework
submissions are made within 2 weeks of the assignment posting date.10 Online Appendix A
includes a sample of the experimental emails sent to subjects in the treatment groups.
3.2 Experimental Procedure
Table 1A summarizes the experiment timeline and data. We conducted our experiment in
the spring of 2015. On April 6, 2015, we sent recruiting emails to enrolled students in the two
courses (5,714 users in Chinese Culture and 9,720 users in Data Structure). We also posted a
recruiting message on the announcement board for each course on behalf of XuetangX. Online
Appendix B includes a sample of the recruiting email/message. By sending recruiting emails
explicitly, we target active learners who at least may respond to messages and manipulation
(Chen and Konstan 2015).
9X ∈ {1, 10, 100}.10In the pre-experiment survey, only 7.8% of participants report that they have friends taking the same
course. Users’ IP addresses are also geographically scattered.
9

By April 14, 337 users from Chinese Culture and 455 users from Data Structure had
signed up for our study and completed a survey on their demographic characteristics. Online
Appendix C includes pre-experiment survey questions. Participants understood that they
had signed up for a study on online learning, but were not told the details or the purpose
of the experiment. Our sample group excludes users who signed up for XuetangX after we
posted the recruiting message and individuals who signed up for our study but did not enroll
in either course. Nine users registered for both courses. We only randomly assign them to
treatments for Data Structure.
Altogether, our subject group consists of 328 users enrolled in the Chinese Culture course
and 432 in the Data Structure course. Table 2 reports summary statistics for participant
demographic characteristics and pre-experiment course performance. The statistics in Ta-
ble 2 show that our participants are generally young (mean age is 25 years), educated (the
majority have a college degree), and experienced with MOOC platforms (on average they
have taken two courses at XuetangX). A notable difference between the two courses is the
gender composition. There are more female than male participants in the Chinese Culture
course and more male than female participants in the Data Structure course. Comparing
their activity and performance in the first 6 weeks of the course (before they sign up for
the experiment), we also see that the Chinese Culture class in general has a higher partic-
ipation rate and student performance profile, possibly due to less challenging content and
requirements.
The way we recruit participants could introduce selection bias in that the participants
are different from the nonparticipants. We formally compare the two groups of users, in
particular their gender, age, education background, the number of courses they have taken
at the platform, and the number of certificates they have obtained so far.11 As shown
in Appendix Table C, we draw more female users, who are slightly older (although the
magnitude of the age difference is negligible) and more educated than users who registered for
either of the two courses but did not participate in our study. Interestingly, the participants
tend to register fewer courses but manage to gain more certificates than the nonparticipants.
As the participants are not perfect representative of the universe of XuetangX users, one
should be cautious in extending the treatment effects to a broader population.
For each course, we randomly assign each subject to either the control or one of the six
treatment groups (i.e., complete randomization). Table 1B lists the number of subjects by
treatment and course. For each of the user demographics and learning experience variables,
we conduct two-sided t-tests between our treatment groups and the control group and adjust
11We could not compare all the variables as in Table 2, as the nonparticipants are not surveyed for theirmotivation, time commitment, etc.
10

the p-values by employing the False Discovery Rate of Benjamini and Hochberg (1995)
(Appendix Tables B1 and B2).12 All comparisons yield p > 0.10 for both courses, suggesting
that subjects are well balanced across our treatment groups.
Within each course, we send our incentive (control) email to participants on April 20, right
before the 8th (6th) assignment posting for Chinese Culture (Data Structure). As mentioned
in Section 3.1, the control group receives an email that encourages them to complete their
homework, while treatment groups receive an additional paragraph in the email, describing
how their homework activity is linked to a monetary incentive. Those offered an incentive
have 2 weeks to complete their assignment to qualify for the incentive scheme. For each of the
three homework assignments selected for our intervention, we collect participants’ submission
records and grades at the end of the 2-week period. After each collection, participants are
immediately informed how much they have earned from the previous assignment. On average,
participants in Chinese Culture earn 61.21 rmb from the intervention stage and those in Data
Structure earn 38.91 rmb.
Our intervention covers a span of three assignments for each course and ends on June
12. After completion of the intervention, we send participants a survey that asks for their
responses to the experiment and the previous homework assignments. After we remove the
incentive, there remain seven homework assignments for Chinese Culture and four homework
assignments for Data Structure. After both courses end on July 1, we send participants a final
survey to collect their long-term responses to the experimental manipulation. To encourage
participation in the post-experiment surveys, we pay 5 rmb for filling out each survey and
also award a 100 rmb prize drawn randomly from the respondents. All payments are trans-
ferred to participants through XuetangX, and they were informed of this procedure before
participating in the study. Online Appendices C and D contain our two post-experiment
survey questionnaires.
4 Results
In this section, we first examine treatment effects on homework submission rates, homework
grades, and lecture video viewing time during our intervention, and then study long-term
effects on the same set of outcome variables after incentives are removed. We exclude one
participant from Data Structure and four from Chinese Culture, as they dropped their re-
spective courses before any monetary incentive occurred.13 Altogether, we have 324 subjects
12This method reduces false positives, and is commonly used to address multiple hypothesis testing problem(e.g., Edmonds and Theoharides 2020; Masset et al. 2020).
13The dropouts occurred after the randomization procedure. We test whether dropout correlates withtreatment and find no significant effect.
11

in Chinese Culture and 431 in Data Structure.
4.1 Treatment Effects on Grades
Figure 2a presents the homework submission rate before and during the intervention. The
control group exhibits a significant decay over the course.14 The average submission rate
before the intervention across two courses is 36%; this drops to 18% during the intervention
(p < 0.01, 2-sided test of proportions). We find a similar decrease for our 1 rmb group
(32% to 17%, p < 0.01, 2-sided test of proportions) and a smaller drop for 10 rmb group
(32% to 21%, p < 0.01, 2-sided test of proportions), and that our 100 rmb group exhibits a
much smaller and statistically insignificant drop from 32% to 28% (p = 0.15, 2-sided test of
proportions). Thus, the 100 rmb incentives are effective in maintaining users’ motivation to
complete homework assignments. There is no evidence that 1 rmb incentive maintains users
engagement or even has negative impact on engagement.15
We next examine the effect of a monetary incentive at the individual level. Examining
within-user changes before and during our intervention, we classify subjects into three types:
users who decrease submissions, users who increase submissions, and those who never submits
homework. Figure 2b presents the share of each type of user. We find that, on average 44%
of users in the control group reduce their submission rate during our intervention period,
compared with 38% in the 1 rmb group, 34% in the 10 rmb group, and 23% in the 100 rmb
group, with a significant difference for the control and 100 group (p < 0.01, 2-sided test of
proportions). We further find that 14% of users in the control group increase their submission
rate during our intervention, compared with 20% in the 10 rmb group and 27% in the 100
rmb group, with a significant difference for the control and 100 rmb groups (p < 0.01, 2-sided
test of proportions). Of those who increase their submissions during intervention, only 2%
(1%, 5%) of the control (10 rmb, 100 rmb) group had not previously submitted assignments.
Overall, our individual-level analysis suggests that the treatment effect (higher submission
rate) reflects the maintenance of existing engagement levels rather than any motivation to
begin submitting homework assignments.
14We do not find significant difference between framing the incentive as gain versus loss, and combinethe two framing treatments. The only exception is that in Chinese Culture, a 1 rmb loss induces fewersubmissions than a 1 rmb reward (p < 0.01, 2-sided test of proportions).
15When we separately analyze the two courses, we find that in Chinese Culture, the decrease in submissionrate is insignificant for 10 rmb group (Appendix Figure 1a: 42% to 38%, p = 0.11, 2-sided test of proportions).This indicates the difference in engagement across the two courses. Data Structure has a much lower baselinesubmission rate, and a 10 rmb incentive is sufficient to keep users engaged in Chinese Culture but not inData Structure. One reason could be the higher cost required to complete assignments in Data Structure. Weobserve that assignment questions for Chinese Culture mostly cover facts delivered in course lecture videos,while those for Data Structure require the user to master and apply a method and algorithm.
12

Lastly, we supplement the above findings with a regression analysis. We apply a simple
OLS estimation on the sample during the intervention period to estimate the treatment effect
on homework submission. The econometric specification is as follows:
Yijt = α +∑j
βj × Treatmentj +Xi + εij (1)
where i indexes individual participants, j indexes treatment groups and t indexes time
periods (weeks). Yijt is the submission record (1 if submitted, 0 otherwise) of participant
i in treatment group j at week t. Treatmentj are dummy variables for treatment groups.
Xi includes participant characteristics such as gender, age, education, job status, experience
with online learning, and baseline activity before the experiment. Lastly, εijt is the error
term and is clustered at the individual user level. The coefficients of interests are βj, which
capture the difference in homework submission between the respective treatment group and
the control. We fit equation (1) with linear probability models and present the results in
Table 3.16 We pool two courses together in the main analysis and include course fixed effects
in all specifications.
Overall, regression results confirm our graphical evidence. First, a 100 rmb incentive sig-
nificantly increases homework submission. As shown in Column 1, a 100 rmb incentive raises
the probability of submission by 12.8 percentage points. A 10 rmb incentive has positive
effects but the coefficient is not statistically significant. A small amount of incentive (1 rmb)
does not show positive or adverse effects.17 Second, we include the interaction between in-
centive amount and frame and present the results in Column 2. These results show that the
coefficients of the interaction terms are small and statistically insignificant, suggesting that
framing the incentive as rewards or punishments does not have differential effects. Lastly, we
include the interaction between treatment and a dummy variable indicating whether a par-
ticipant’s pre-intervention submission rate is above or below the sample mean.18 As shown
in Columns 3, the coefficients of the interaction terms are positive and significant, implying
that our observed treatment effects are driven largely by sustained activity by regular users
rather than an uptake in activity by inactive users.19
16Probit or logit models yield similar results. Also, the estimates are not sensitive to the inclusion of weeknor homework fixed effects.
17The effects for the 1 rmb and 10 rmb groups are significantly different from that of the 100 group(p < 0.001).
18The pre-intervention activities are also included in the baseline control.19We also repeat the same regression analysis for each course separately (Appendix Table D). The main
findings are consistent across courses, except that a 10 rmb incentive has a positive effect in Chinese Culturebut not Data Structure.
13

4.2 Treatment Effects on Grades
In this section, we examine whether a monetary incentive impacts assignment grades during
the intervention. Figure 3a presents the unconditional mean of homework grades and a non-
submission is coded as zero. We find results similar to those of our homework assignment
submission analysis. For example, the 100 rmb groups exhibit a significant continuance of
performance. The 1 rmb group show similar pattern as the control group while the 10 rmb
groups perform slightly better than the control.20
Figure 3b presents the conditional mean of homework grades for the courses. Here, a
non-submission is excluded from the sample. Conditional on assignment completion, we find
that average grades during the intervention period are higher for our treatment groups than
for the control group, although this difference is statistically insignificant. However, it is
possible that our incentive biases the subset of students who are motivated to submit their
homework assignments. If so, it is possible that a higher grade reflects a bias due to the
self-selection of higher-performing students. To address this possibility, we first test whether
our treatments motivate different types of users to submit homework assignments. Appendix
Tables A1 and A2 report the estimations for our treatment effects on user demographic char-
acteristics and baseline performance. These statistics show no strong evidence of differential
user composition. Second, we formally address any potential bias using Lee bounds in a
regression analysis described below.
As a baseline, we fit equation (1) to estimate the treatment effects on assignment grades
during the intervention period. Table 4 reports OLS estimates for pooling across courses.
All specifications include user controls and course fixed effects. The dependent variable is
the grade in terms of the correction rate (0 to 1), and the sample includes participants’
homework grades during the weeks when an incentive is offered. Therefore, coefficients on
the treatment indicators can be interpreted as the differences in grades between the respective
treatment group and the control group during our intervention. Column 1 show that a 10
rmb incentive has a marginally significant effect on the unconditional grade, while a 100 rmb
incentive significantly improves homework grades relative to the control group. Column 2
shows that all three treatments have positive and significant effects on conditional grades.
Continuing with Table 4, Columns 3 and 4 report the upper and lower bounds, respec-
tively, of the treatment effects on conditional grades using the method developed by Lee
(2009).21 The estimated upper and lower bounds for all three treatments are always positive
20Similar to the difference in submission across the two courses, in Chinese Culture, both the 10 rmb and100 rmb groups exhibit a significant continuance of performance while in Data Structure, only 100 rmb hasa significant impact (Appendix Figure 2).
21In our context, we consider, for example, the case in which the 12.8% increase in assignment submissionsin the 100 rmb group arises from the least capable students, i.e., the largest downward bias. Then, to
14

and very precisely estimated. Taken together, we find positive effects on assignment grades,
which are unlikely to be entirely driven by sample selection.
In our final set of analyses, we examine the effect of a monetary incentive on the amount
of time a user spends watching the course lecture videos. Here, we conjecture that spending
more time on the videos could be a mechanism through which treated participants gain
higher grades. For both courses, lectures are delivered as videos. We collect data on par-
ticipants’ daily video activity (e.g., when they start a video, pause or resume the video, or
spend idle time with the video open), and apply a machine-learning algorithm of Qiu et al.
(2016) to capture their effective viewing time.22 This measure allows us to measure learning
activity and effort, which is difficult to observe or quantify in a traditional offline classroom
environment.
The raw data for viewing time have critical flaws in capturing user learning time. For
instance, a user sometimes turns on a lecture video but switches to other unrelated tasks
without watching the video. Such data may introduce measurement errors and contaminate
our estimates. Therefore, we apply the algorithm developed in Qiu et al. (2016), which
can subtract such “idle time” from effective learning time. For example, a “pause” activity
triggers students from playing video to “idle” state.
The results in Table 5 show that the 100 rmb treatment increases weekly video time
by 5.8% (Column 1). Interestingly, we find that neither the 1 rmb nor 10 rmb treatment
motivates participants to increase their course video viewing time. One explanation for this
finding is that learners are using a nonlinear navigation strategy. As documented by Guo
and Reinecke (2014), successful users (certificate earners) skip 22% of the content in a course
and frequently jump backward to earlier lecture sequences to gain specific information. This
nonlinear navigation implies that better performance does not necessarily come from more
hours spent viewing course materials. Results shown in Columns 2 and 3 are consistent with
our findings on treatment effects on submission rate, that framing the incentives as rewards
or punishments does not have different effects and the treatment effects are largely driven
by sustained activity of regular users.
construct a balanced sample, we drop these bottom 12.8% grades in the 100 rmb group so that the resultingestimates constitute the upper bound of the true effect. Similarly, if we assume that the increased submissionsare made by the most capable students, then we exclude the top 12.8% grades of the 100 rmb group so thatthe estimate from the refined and balanced sample represents the lower bound of the true effect.
22The raw data for viewing time may fail to capture user effective learning time. For example, a usersometimes turns on a lecture video but switches to other unrelated tasks without watching the video. Wetherefore apply the algorithm developed in Qiu et al. (2016), which can subtract such “idle time” fromeffective learning time.
15
4.3 Post-intervention and Spillover Effects
Our results indicate that providing a monetary incentive can improve both engagement and
performance in an online learning environment. We next examine whether this effect persists
after the incentive is removed. A number of studies have shown that short-term incentives
may fail in the long run (Gneezy and List 2006; Meier 2007).23 By contrast, Charness and
Gneezy (2009) find more promising results that a monetary incentive can instill long-term
exercise habits. Moreover, there are concerns that offering students financial incentives may
weaken or crowd out their intrinsic motivation on similar subsequent tasks (Gneezy et al.
2011). If so, the removal of incentives may decrease student effort and performance.
We examine learning behavior and course performance on the remaining assignments in
each course after we stop the intervention. About 2 months remain until the courses end, dur-
ing which participants in Chinese Culture are assigned seven more homework assignments,
and those in Data Structure four more assignments. Table 6 presents the results for our
treatment effects on the submission rate, unconditional grades, and conditional grades for
these post-intervention assignments. We find that the 100 rmb group continues to increase
their homework submission rates and assignment performance. For instance, participants
who were offered a 100 rmb incentive are still 10.2 percentage points more likely to sub-
mit their homework, and their (unconditional) grades are 0.106 points higher. While the
magnitude is lower than during the intervention, we cannot reject the hypothesis that the
treatment effects are equal between during- and post-intervention phases—i.e., no signifi-
cant decay. The 10 rmb group also show some positive effects although the coefficients on
submission and conditional grades are marginally significant. Overall, our post-intervention
results suggest that the positive effect of a monetary incentive does not decay once the in-
centive is over. This finding may indicate that our incentive makes students more aware of
the marginal return of submitting assignments, and thus they are more likely to continue
doing so.
The finding of a persistent treatment effect after the incentives are removed is important
for several reasons. First, we demonstrate a long-run effect of monetary incentives on learn-
ing, which is promising for practitioners and policy makers because most incentive programs
in education are only temporary and are restricted to certain tasks or tests. Second, treated
students continue to engage more and perform better, suggesting habit formation or certain
types of learning about the online course experience.24 Third, there is no evidence of a
23In particular, Gneezy and List (2006) shows that the positive reciprocity that arises from the receipt ofa gift persists for only a few hours. Meier (2007) finds that the success of a matching mechanism in the areaof charity donations does not carry over to post-experiment periods, generating a negative net effect on theparticipation rate.
24Another explanation for the persistent effect is that the value of doing well—e.g., the likelihood of
16
decrease in performance, suggesting that offering incentives, either small or large, does not
necessarily crowd out students’ intrinsic motivation to learn. Also, the fact that the removal
of incentives does not reverse student engagement toward the pre-intervention level suggests
that the baseline low engagement is suboptimal for the students.
Lastly, we investigate the spillover effect of a monetary incentive to other courses during
the same and the subsequent semester. Since 89% of the subjects in our experiment are
enrolled in multiple courses, we are interested in whether our observed increase in engagement
extends to other courses (a positive spillover) or is achieved at the expense of time and effort
spent on other courses (a negative spillover). Using data on our subjects’ video viewing time
and assignment grades in other courses, we find an overall positive spillover effect: Treated
participants, especially those in the 100 rmb group, spend more time watching course videos
and achieve higher homework grades in their other, non-rewarded courses (Table 7, Columns
1 to 3). Furthermore, we find that treated participants still outperform the control group in
their subsequent semester courses, as measured by obtaining a certificate (Table 7, Column
5).25
Our findings on spillover effects lend further support to long-run improvement in student
engagement. If offering a monetary incentive in one course improves student engagement
at the expense of lowering effort in other courses, the overall effect is ambiguous and such
a policy is not a scalable solution. However, we find that participants do not compromise
their engagement and performance in other courses, or stop exerting effort once the incentive
is removed. Our intervention appears to have helped them learn about the online learning
process, or about disciplining themselves—which, in turn, shifts their learning behavior
toward a more persistent and sustainable pattern.
5 Discussion
To the best of our knowledge, ours is one of the first attempts to evaluate the effectiveness
of a monetary incentive in online learning. Overall, our findings suggest that providing a
monetary incentive can help improve user engagement and raise the return of MOOCs. In
the literature of incentives in education, there is variation in what input tasks (e.g., reading
a book) or final outputs (e.g., test scores) are rewarded. One finding by Fryer (2011) is that
incentives for inputs, such as attendance, tend to work better than incentives that reward
outcomes, such as better grades. Clark et al. (2017) conduct two field experiments using
completing the course and receiving a certificate—on later assignments may be higher conditional on doingwell on previous assignments. Our analysis of spillover effect does not support this alternative explanation.
25The criteria for earning a certificate vary by courses, but usually involve students’ homework, project,and exam performance.
17

college students and find that setting task-based goals has larger positive effects on course
performance than setting performance-based goals. Our experiment rewards students for
completing homework assignments, and therefore the positive treatment effects echo the
efficacy of rewarding concrete tasks.
Our results have both practical and academic implications. On a practical level, the
platform on which we conduct our experiment, XuetangX, has adopted several initiatives
to encourage learning based on our findings. For instance, they plan to launch a certificate
discount for those students who exhibit good performance in their courses, and to develop a
scholarship program to motivate learning.26
On a broader level, our findings can also be used by public programs that promote
online learning in designing platforms that better utilize the resources invested by teachers,
universities, and the public sector in online courses. In designing online public courses,
it is useful to understand which groups may be more responsive to a monetary incentive.
Examining our results by gender as well as by access to offline education resources, we
find that females show a greater effect of incentive on learning behaviors and outcomes, as
do participants with limited geographic access to offline classrooms (see Tables 8 and 9,
respectively).27 For our geographic data, we use subjects’ IP addresses and control for the
GDP per capita of the region to ensure that our differences are not driven by local economic
conditions. These heterogeneous effects imply that offering a monetary incentive may help
reduce educational disparity.
In addition to suggesting how incentives may be used to broaden educational access, our
findings can also help course designers in determining the appropriate type of incentive for a
particular course. For example, we find that a medium-level incentive works for the Chinese
Culture course but not for the Data Structure course, possibly due to differences in difficulty
level and effort required. It is also possible that course designers may use complementary—
possibly non-financial—incentives to engage users.28 In fact, the Data Structure course
includes a multistage programming tournament throughout the course, in which winners
can access materials (programming projects) that are available exclusively for the Tsinghua
computer science department.
On the academic side, our findings can be used as the basis for future research. For
example, we timed our intervention to take place in the middle of the courses for both
26An interview with the CTO of XuetangX, Jian Guan was conducted on May 19, 2017.27For heterogeneity by gender and offline educational resources, we conduct the analysis with the Chinese
Culture sample because of its more diverse student composition. Data Structure, for instance, has too fewfemale students to test the gender difference.
28For example, Jalava et al. (2015) examine the effect of nonfinancial incentives on primary school studentsand find improved test performance when employing rank-based grading or offering students a symbolicreward.
18

empirical and logistical reasons. However, it would be interesting to see what effect would
occur if the intervention were instead provided at the beginning of each course. With big
data on user activity, we might even possibly predict the “hazard rates” for users at any given
moment, and design customized instruments, e.g., individualized social information (Shang
and Croson, 2009), to keep them engaged and improve learning outcomes. Another potential
behavioral mechanism which may promote students’ engagement is to create group identity
by forming study groups, or prime natural identity (Chen et al., 2014; Mobius et al., 2016)
for online learners, and to promote competition between groups (Akerlof and Kranton, 2000,
2005, 2008, 2013). Online education platforms are valuable testbeds for putting behavioral
economics principles into practice. The variety of course settings, scale, student backgrounds,
and available rich activity logs allow researchers to conduct a number of experiments and
test the generalizability of their results.
References
Acemoglu, Daron, David Laibson, and John A List, “Equalizing Superstars: The
Internet and the Democratization of Education,” American Economic Reviews Papers
and Proceedings, 2014, 104.
Akerlof, George A and Rachel E Kranton, “Economics and Identity,” Quarterly Jour-
nal of Economics, August 2000, 115 (3), 715–753.
and , “Identity and the Economics of Organizations,” Journal of Economic Perspec-
tives, 2005, 19 (1), 9–32.
and , “Identity, Supervision, and Work Groups,” American Economic Review, 2008,
98 (2), 212–217.
and , Identity Economics: How Our Identities Shape Our Work, Wages, and Well-
Being, Princeton University Press, 2013.
Andreoni, James, “Warm-Glow Versus Cold-Prickle: The Effects of Positive and Negative
Framing on Cooperation in Experiments,” The Quarterly Journal of Economics, 1995, 110
(1), 1–21.
Angrist, Joshua and Victor Lavy, “The Effects of High Stakes High School Achievement
Awards: Evidence from a Randomized Trial,” The American Economic Review, 2009, 99
(4), 1384–1414.
19

, Daniel Lang, and Philip Oreopoulos, “Incentives and Services for College Achieve-
ment: Evidence from a Randomized Trial,” American Economic Journal: Applied Eco-
nomics, 2009, 1 (1), 136–163.
, Eric Bettinger, and Michael Kremer, “Long-Term Educational Consequences of
Secondary School Vouchers: Evidence from Administrative Records in Colombia,” The
American Economic Review, 2006, 96 (3), 847–862.
, , Erik Bloom, Elizabeth King, and Michael Kremer, “Vouchers for Private
Schooling in Colombia: Evidence from a Randomized Natural Experiment,” The American
Economic Review, 2002, 92 (5), 1535–1558.
Ariely, Dan, Uri Gneezy, George Loewenstein, and Nina Mazar, “Large Stakes and
Big Mistakes,” The Review of Economic Studies, 2009, 76 (2), 451–469.
Banerjee, Abhijit V and Esther Duflo, “(Dis) Organization and Success in an Economics
Mooc,” The American Economic Review Papers and Proceedings, 2014, 104 (5), 514–518.
Belles-Obrero, Cristina, “Who is Learning? A Field Experiment Comparing Three Dif-
ferent Incentive Schemes in the Same Educational Setting,” 2020. Working Paper.
Benjamini, Yoav and Yosef Hochberg, “Controlling the false discovery rate: a practical
and powerful approach to multiple testing,” Journal of the Royal statistical society: series
B (Methodological), 1995, 57 (1), 289–300.
Bettinger, Eric P, “Paying to learn: The effect of financial incentives on elementary school
test scores,” Review of Economics and Statistics, 2012, 94 (3), 686–698.
Braun, Henry, Irwin Kirsch, and Kentaro Yamamoto, “An Experimental Study of
the Effects of Monetary Incentives on Performance on the 12th-Grade NAEP Reading
Assessment.,” Teachers College Record, 2011, 113 (11), 2309–2344.
Cacault, M Paula, Christian Hildebrand, Jeremy Laurent-Lucchetti, and Michele
Pellizzari, “Distance Learning in Higher Education: Evidence from a Randomized Ex-
periment,” 2019.
Campos-Mercade, Pol and Erik Wengstrom, “Threshold Incentives and Academic
Performance,” 2020. Working Paper.
Charness, Gary and Uri Gneezy, “Incentives to Exercise,” Econometrica, 2009, 77 (3),
909–931.
20
Chen, Jingnan, Miguel A. Fonseca, and Shaun B. Grimshaw, “Using Norms and
Monetary Incentives to Change Behavior: A Field Experiment,” 2018. Working Paper.
Chen, Yan and Joseph Konstan, “Online field experiments: a selective survey of meth-
ods,” Journal of the Economic Science Association, 2015, 1 (1), 29–42.
, Sherry Xin Li, Tracy Xiao Liu, and Margaret Shih, “Which hat to wear? Impact
of natural identities on coordination and cooperation,” Games and Economic Behavior,
2014, 84, 58–86.
Clark, Damon, David Gill, Victoria Prowse, and Mark Rush, “Using goals to mo-
tivate college students: Theory and evidence from field experiments,” Technical Report,
National Bureau of Economic Research 2017.
Deming, David J, Claudia Goldin, Lawrence F Katz, and Noam Yuchtman, “Can
Online Learning Bend the Higher Education Cost Curve?,” The American Economic Re-
view Papers and Proceedings, 2015, 105 (5), 496–501.
Edmonds, Eric and Caroline Theoharides, “The short term impact of a productive
asset transfer in families with child labor: Experimental evidence from the philippines,”
Journal of Development Economics, 2020, 146, 102486.
Feng, Wenzheng, Jie Tang, and Tracy Xiao Liu, “Dropout Analysis and Prediction
for Large Scale Users in Moocs,” 2018. Working Paper.
Fryer, Roland G, “Financial Incentives and Student Achievement: Evidence from Ran-
domized Trials,” The Quarterly Journal of Economics, 2011, 126 (4), 1755–1798.
, Steven D Levitt, John List, and Sally Sadoff, “Enhancing the Efficacy of Teacher
Incentives Through Loss Aversion: A Field Experiment,” 2012. Working Paper.
Gneezy, Uri and Aldo Rustichini, “Pay Enough Or Don’t Pay At All,” The Quarterly
Journal of Economics, 2000, 115 (3), 791–810.
and John A List, “Putting Behavioral Economics to Work: Testing for Gift Exchange
in Labor Markets Using Field Experiments,” Econometrica, 2006, 74 (5), 1365–1384.
, Stephan Meier, and Pedro Rey-Biel, “When and Why Incentives (Don’t) Work to
Modify Behavior,” The Journal of Economic Perspectives, 2011, 25 (4), 191–209.
21

Guo, Philip J. and Katharina Reinecke, “Demographic Differences in How Students
Navigate Through MOOCs,” in “Proceedings of the First ACM Conference on Learning
@ Scale Conference” L@S ’14 ACM New York, NY, USA 2014, pp. 21–30.
Hansen, John D and Justin Reich, “Democratizing Education? Examining Access and
Usage Patterns in Massive Open Online Courses,” Science, 2015, 350 (6265), 1245–1248.
Hong, Fuhai, Tanjim Hossain, and John A List, “Framing Manipulations in Contests:
A Natural Field Experiment,” Journal of Economic Behavior & Organization, 2015, 118,
372–382.
Hossain, Tanjim and John A List, “The Behavioralist Visits the Factory: Increasing
Productivity Using Simple Framing Manipulations,” Management Science, 2012, 58 (12),
2151–2167.
Hussam, Reshmaan, Atonu Rabbani, Giovanni Reggiani, and Natalia Rigol,
“Habit formation and rational addiction: A field experiment in handwashing,” 2017.
Jaggars, Shanna Smith and Di Xu, “How do online course design features influence
student performance?,” Computers & Education, 2016, 95, 270–284.
Jalava, Nina, Juanna Schrøter Joensen, and Elin Pellas, “Grades and rank: Im-
pacts of non-financial incentives on test performance,” Journal of Economic Behavior &
Organization, 2015, 115, 161–196.
Karlan, Dean, Margaret McConnell, Sendhil Mullainathan, and Jonathan Zin-
man, “Getting to the Top of Mind: How Reminders Increase Saving,” Management Sci-
ence, 2016, 62 (12), 3393–3411.
Kizilcec, Rene, Chris Piech, and Emily Schneider, “Deconstructing Disengagement:
Analyzing Learner Subpopulations in Massive Open Online Courses,” in “Proceedings of
the Third International Conference on Learning Analytics and Knowledge” ACM 2013,
pp. 170–179.
Kizilcec, Rene F and Christopher Brooks, “Diverse big data and randomized field
experiments in MOOCs,” Handbook of Learning Analytics, 2017, pp. 211–222.
Lee, David S, “Training, Wages, and Sample Selection: Estimating Sharp Bounds on
Treatment Effects,” The Review of Economic Studies, 2009, 76 (3), 1071–1102.
22

Leuven, Edwin, Hessel Oosterbeek, and Bas Van der Klaauw, “The effect of financial
rewards on students’ achievement: Evidence from a randomized experiment,” Journal of
the European Economic Association, 2010, 8 (6), 1243–1265.
Levitt, Steven D, John A List, and Sally Sadoff, “The effect of performance-based in-
centives on educational achievement: Evidence from a randomized experiment,” Technical
Report, National Bureau of Economic Research 2016.
, , Susanne Neckermann, and Sally Sadoff, “The Behavioralist Goes to School:
Leveraging Behavioral Economics to Improve Educational Performance,” American Eco-
nomic Journal: Economic Policy, 2016, 8 (4), 183–219.
Masset, Edoardo, Jorge Garcıa-Hombrados, and Arnab Acharya, “Aiming high
and falling low: The SADA-Northern Ghana Millennium Village Project,” Journal of
Development Economics, 2020, 143, 102427.
Meier, Stephan, “Do Subsidies Increase Charitable Giving in the Long Run? Matching
Donations in a Field Experiment,” Journal of the European Economic Association, 2007,
5 (6), 1203–1222.
Mobius, Markus, Tanya Rosenblat, and Qiqi Wang, “Ethnic discrimination: Evidence
from china,” European Economic Review, 2016, 90, 165–177.
Paola, Maria De, Vincenzo Scoppa, and Rosanna Nistico, “Monetary incentives and
student achievement in a depressed labor market: results from a randomized experiment,”
Journal of Human Capital, 2012, 6 (1), 56–85.
Patterson, Richard W, “Can behavioral tools improve online student outcomes? Exper-
imental evidence from a massive open online course,” Journal of Economic Behavior &
Organization, 2018, 153, 293–321.
Qiu, Jiezhong, Jie Tang, Tracy Xiao Liu, Jie Gong, Chenhui Zhang, Qian Zhang,
and Yufei Xue, “Modeling and Predicting Learning Behavior in Moocs,” in “Proceedings
of the Ninth ACM International Conference on Web Search and Data Mininge” 2016.
Royer, Heather, Mark Stehr, and Justin Sydnor, “Incentives, commitments, and
habit formation in exercise: evidence from a field experiment with workers at a fortune-
500 company,” American Economic Journal: Applied Economics, 2015, 7 (3), 51–84.
Seaton, Daniel, Isaach Chuang, Piotr Mitros, David Pritchard et al., “Who Does
What in a Massive Open Online Course?,” Communications of the ACM, 2014, 57 (4),
58–65.
23
Shang, Jen and Rachel Croson, “A Field Experiment in Charitable Contribution: The
Impact of Social Information on the Voluntary Provision of Public Goods,” The Economic
Journal, 2009, 119 (540), 1422–1439.
Zhang, Dennis J, Gad Allon, and Jan A Van Mieghem, “Does Social Interaction
Improve Learning Outcomes? Evidence From Field Experiments On Massive Open Online
Courses,” Manufacturing & Service Operations Management, 2017, 19 (3), 347–367.
24

Online Appendices
A Sample Experiment Email: Large Incentive Treat-
ments for Data Structure
Dear MOOCer:
Thanks for participating in our study. We will give you 5 rmb to collect your responses
in two more surveys, which will be distributed later this semester. Additionally, you will
have a chance to win a big 100 rmb reward.
Data structure has updated to the 6th assignment. If you want to get your certificate,
you should finish your homework on time and try your best to get high grades!
For the next 3 assignments, you will receive a 100 rmb reward if you answer 8 out of 10
questions correctly on an assignment (negative framing: You will receive a one-time bonus
of 300 rmb. However, for every assignment you fail to answer 8 out of 10 questions correctly,
we will deduct 100 rmb).
The reward is additive.
For example, if you answer correctly on one assignment, you gain 100 rmb. If you answer
correctly on two assignments, you gain 200 rmb. If you answer correctly on all assignments,
you gain 300 rmb (negative framing: If you fail one assignment, you lose 100 rmb. If you
fail two assignments, you lose 200 rmb. If you fail all three assignments, you lose 300 rmb.).
Additionally, to get the reward, you also need to submit all assignments within 2 weeks
after we post them.
This payment will be made at the end of the course in the format of a top-up card.
25

B Sample Recruitment Email
Dear fellow students in Data Structure:
MOOC is an educational innovation that has drawn attention around the globe, and
MOOCers’ learning behaviors are of great value for research.
Our research team at Tsinghua, along with XuetangX.com, is conducting a study on
MOOCers’ learning behaviors, which is the first in China. We want to invite you to join us,
making history with us! While participating in this study, you can earn money while taking
the MOOC course. Slots are limited. First come, first served!
About our study
This is a study on MOOCers’ learning habits, especially assignment completion. Partic-
ipants are required to complete a few questionnaires and follow some other instructions for
our study.
Rules for participants
Participants must:
a) finish assignments of MOOC courses independently;
b) not reveal any information related to this study to others.
Payment
Participants are expected to get 5 to 300 yuan. Each participant’s exact amount depends
on his/her behavior in the study. Participants will be paid the equivalent value of top-up
cards for mobile phones after the end of the course.
Research results
After the end of our project, we will send the written research results to all participants
via email.
Please read the Project Agreement and sign up.
26

C Pre-experiment Survey
We want you to join the most cutting-edge study on MOOCers’ learning behaviors!
To sign up for this study, you may need one or two minutes to finish this questionnaire.
Seats are limited. First come, first served! Applicants admitted to our study will be
informed via email or private message in MOOC in two weeks.
–XuetangX.com & MOOC Research Team of Tsinghua University
Introduce myself in 20 seconds:
I am a ( ) girl ( ) boy.
I was born in (which year).
I live in (which city) (which province), China.
My education level is (), and current employment status is ().
I am (description of me)
(Very curious/ a born genius/ Never focus on trivial things/ A plan maker/ Always in
the limelight/Always active)
About the Data Structure Course (Chinese Culture)
1. I take this course because:
(a) I am interested in the content of this course;
(b) It is helpful for my current work;
(c) My friend(s) recommended it;
(d) I want to get a MOOC certificate.
(e) Other
2. In terms of the content of this course:
(a) I have never learnt it before and have no idea at all;
(b) I am currently taking related courses offline;
(c) I have learnt a little bit before;
(d) I am an expert.
About XuetangX.com
1. I think learning MOOC in XuetangX is:
27
(a) Very unpleasant
(b) Rather unpleasant
(c) Rather pleasant
(d) Very pleasant
2. I am studying together with some other people. Of them, the three people I have
the most intimate relationships with are (you can leave this blank if you are learning
alone):
(His/her username in XuetangX) We are Classmates/Friends/Boyfriend & Girlfriend/-
Couple/Relatives
3. Sometimes I cannot persist in learning MOOC courses, because:
(a) It never happens to me! I am a persistent learner!
(b) I have a heavy load of schoolwork;
(c) I need to date very often;
(d) I don’t want to bother to turn on the computer;
(e) No one reminds me;
(f) Other
4. In XuetangX.com, I hope to:
(a) Spend more time learning in XuetangX.com;
(b) Maintain the status quo;
(c) Spend less time learning in XuetangX.com.
5. When I am pursuing my goals, I am:
(a) Very persistent;
(b) Rather persistent;
(c) Likely to quit;
(d) Very likely to quit.
6. In terms of competitiveness (my eagerness to win),
(a) I am highly competitive;
28

(b) I am rather competitive;
(c) I am not very competitive;
(d) I am not competitive at all.
29

D Post-experiment Survey I
1. Does the assignment grade for this class matter to you? 1-4 likert scale
2. Does getting the certificate for this class matter to you? 1-4 likert scale
3. In your opinion, to get the certificate, how much should you get for your assignment
grades? (0 to 100)
The next questions are for treatments only.
4. In the past three assignments with an additional reward, if there was a week you did
not receive the reward, what did you do next?
(a) This does not apply to me. I received rewards every time.
(b) Increase my effort on assignments and try to get the reward next time.
(c) Keep the current effort level.
(d) I do not care much about the reward.
(e) Not sure.
5. In the past three assignments with an additional reward, if there is a week you received
the reward, what did you do next?
(a) This does not apply to me. I never receive rewards.
(b) Increase my effort on assignments and try to get the reward next time.
(c) Keep the current effort level.
(d) I do not care much about the reward.
(e) Not sure.
6. How important is the assignment reward to you? 1-4 likert scale
7. When the goal is to get 80% of questions on assignment correct and an additional
incentive is provided for achieving this goal, how important is it to you? 1-4 likert
scale
8. When the goal is to get 80% of questions on assignment correct and no additional
incentive is provided for achieving this goal, how important is it to you?
(a) Very important. I always want to achieve the goal regardless of additional reward.
(b) Relatively important.
30

(c) Relatively not important.
(d) Not important at all. I do the assignments to get the additional reward.
E Post-experiment Survey II
1. After we stopped providing additional rewards for assignments (control: After we
stopped sending you reminder emails for assignments), did you think it was necessary
to work hard on assignments? (1-4 likert scale)
2. After we stopped providing additional rewards for assignments (control: After we
stopped sending you reminder emails for assignments), did you think it was necessary
to get 80% of questions correct? (1-4 likert scale)
3. Did you know that other people received different reward amounts (control: Did you
know that other people received additional rewards for doing assignments)?
4. If you knew that others received higher rewards than you (control: If you knew that
others received additional rewards for doing assignments), what did you do?
(a) Worked harder.
(b) Slacked off.
(c) I did not care.
(d) Other.
5. Do you think participating in this project helped you study in this class? 1-4 likert
scale
31

Figure 1: Historical Homework Records
Figure 2a: Average Homework Submission Rate before and during Intervention
Figure 2b: Share of Participants by Changes of Submission Activity
Figure 3a: Unconditional Means of Homework Grades before and during Intervention
Figure 3b: Homework Grades Conditional on Submission, before and during Intervention

Table 1A: Experiment Timeline and Data Collected
Date Task Data collected April 6 Recruit email
April 6-14 Sign up Pre-experiment survey
Demographics Baseline performance
April 20 Incentive announcement Homework submission, grades & video logs
June 16 Post-experiment survey 1 Feedback on intervention July 1 Post-experiment survey 2 Feedback on post-intervention August 13 Payment
Table 1B: Number of Subjects by Treatment and Course
Chinese Culture Data Structure Overall
Control 46 61 107
+ ¥1 48 62 110
+ ¥10 46 63 109
+ ¥100 46 63 109
- ¥1 46 62 108
- ¥10 48 62 110
- ¥100 48 59 107

Table 2: Summary Statistics
Sample Chinese Culture Data Structure Overall (1) (2) (3) Male 0.377 0.807 0.623 (0.485) (0.395) (0.485) Age 27.11 23.72 25.162 (8.060) (5.119) (6.743) Education Below College 0.140 0.0758 0.102 (0.347) (0.265) (0.303) College 0.648 0.697 0.676 (0.478) (0.460) (0.468) Master and PhD 0.213 0.227 0.221 (0.410) (0.420) (0.415) Employment Status Student 0.506 0.716 0.626 (0.501) (0.451) (0.484) Unemployed 0.0528 0.0512 0.0519 (0.224) (0.221) (0.222) Employed 0.438 0.230 0.319 (0.497) (0.421) (0.466) Retired 0.00311 0.00233 0.00266 (0.0557) (0.0482) (0.0515) Subject and MOOC background Experience with the subject 1.820 2.248 2.065 (0.938) (0.900) (0.940) Friends taking the same course 0.0926 0.0626 0.0755 (0.290) (0.243) (0.264) Time commitment 2.475 2.566 2.527 (0.564) (0.541) (0.553) Retake this course 0.194 0.367 0.293 (0.396) (0.482) (0.455) Number of courses taken 1.981 2.248 2.134 (3.345) (3.638) (3.516) Number of certificates obtained 0.395 0.146 0.253 (0.828) (0.523) (0.682) Activity before experiment Homework score 0.598 0.330 0.445 (0.431) (0.436) (0.453) Homework submission rate 0.470 0.176 0.302 (0.412) (0.286) (0.374) Weekly video hours 2.645 1.636 2.069 (3.390) (2.810) (3.110) Observations 324 431 755 Note. Columns (1) and (2) report the mean and standard deviations of the main variables for participants who enrolled in each of the respective courses and signed up for our experiment. Columns (3) pool participants from the two courses and report the overall mean of the variable values.

Table 3: Homework Submission Rate during Intervention
Outcome: Whether homework submitted on time (1) (2) (3) ¥1 0.007 0.008 -0.052 (0.032) (0.039) (0.033) ¥10 0.047 0.060* -0.045 (0.031) (0.035) (0.035) ¥100 0.128*** 0.133*** 0.013 (0.032) (0.035) (0.036) ¥1 x punish -0.001 (0.035) ¥100 x punish -0.027 (0.033) ¥100 x punish -0.010 (0.037) ¥1 x active 0.122* (0.065) ¥10 x active 0.203*** (0.064) ¥100 x active 0.267*** (0.066) User controls yes yes yes Course FE yes yes yes Observations 2,154 2,154 2,154 R-squared 0.52 0.52 0.54
Note. The sample includes homework submission records during the intervention period where participants in treatments are rewarded with a monetary incentive. The unit of observation is participant*homework. “Punish” is a dummy variable indicating whether the incentive is introduced as a loss for each assignment that fails to meet the threshold. “Active” is a dummy variable indicating whether a participant’s pre-intervention submission rate is above the sample mean. All specifications include course fixed effects and user controls (as reported in Table 2), including gender, age, education, employment status, course and MOOC background, and baseline activity before the experiment. Robust standard errors are clustered at the participant level and are shown in parentheses. *** significant at the 1%, **5%, and *10% level.

Table 4: Treatment Effects on Homework Grades
Unconditional grade
Grade conditional on submission
Upper bound Lower bound
(1) (2) (3) (4) ¥1 0.033 0.101** 0.110*** 0.101** (0.032) (0.039) (0.038) (0.039) ¥10 0.061* 0.089** 0.114*** 0.084** (0.031) (0.039) (0.037) (0.039) ¥100 0.139*** 0.092** 0.101*** 0.084** (0.031) (0.036) (0.035) (0.036) User controls yes yes yes yes Course FE yes yes yes yes Observations 2,085 461 445 432 R-squared 0.51 0.08 0.12 0.08 Note. The sample includes homework grades during the intervention period where participants in treatments are rewarded with a monetary incentive. The unit of observation is participant*homework. Column (1) uses the unconditional grade as the outcome variable, i.e., equals zero in the case of no submission. Columns (2) to (4) use the conditional grade, i.e., grade is missing in the case of no submission. Columns (3) and (4) report the upper and lower bounds of treatment effects using Lee bounds (Lee 2009). All specifications include course fixed effects and user controls (as reported in Table 2), including gender, age, education, employment status, course and MOOC background, and baseline activity before the experiment. Robust standard errors are clustered at the participant level and are shown in parentheses. *** significant at the 1%, **5%, and *10% level.

Table 5. Treatment Effects on Video Hours
Outcome: ln (weekly video hours) (1) (2) (3) ¥1 -0.009 -0.014 -0.047 (0.029) (0.034) (0.036) ¥10 -0.008 -0.015 -0.051 (0.028) (0.033) (0.036) ¥100 0.058** 0.074** -0.024 (0.030) (0.033) (0.039) ¥1 x punish 0.010 (0.030) ¥100 x punish 0.016 (0.027) ¥100 x punish -0.033 (0.033) ¥1 x active 0.081 (0.056) ¥10 x active 0.092* (0.056) ¥100 x active 0.193*** (0.060) User controls yes yes yes Course FE yes yes yes Observations 2,154 2,154 2,154 R-squared 0.31 0.31 0.32
Note. The sample includes video viewing records during the intervention period where participants in treatments are rewarded with a monetary incentive. The unit of observation is participant*week. “Punish” is a dummy variable indicating whether the incentive is introduced as a loss for each assignment that fails to meet the threshold. “Active” is a dummy variable indicating whether a participant’s pre-intervention submission rate is above the sample mean. All specifications include course fixed effects and user controls (as reported in Table 2), including gender, age, education, employment status, course and MOOC background, and baseline activity before the experiment. Robust standard errors are clustered at the participant level and are shown in parentheses. *** significant at the 1%, **5%, and *10% level
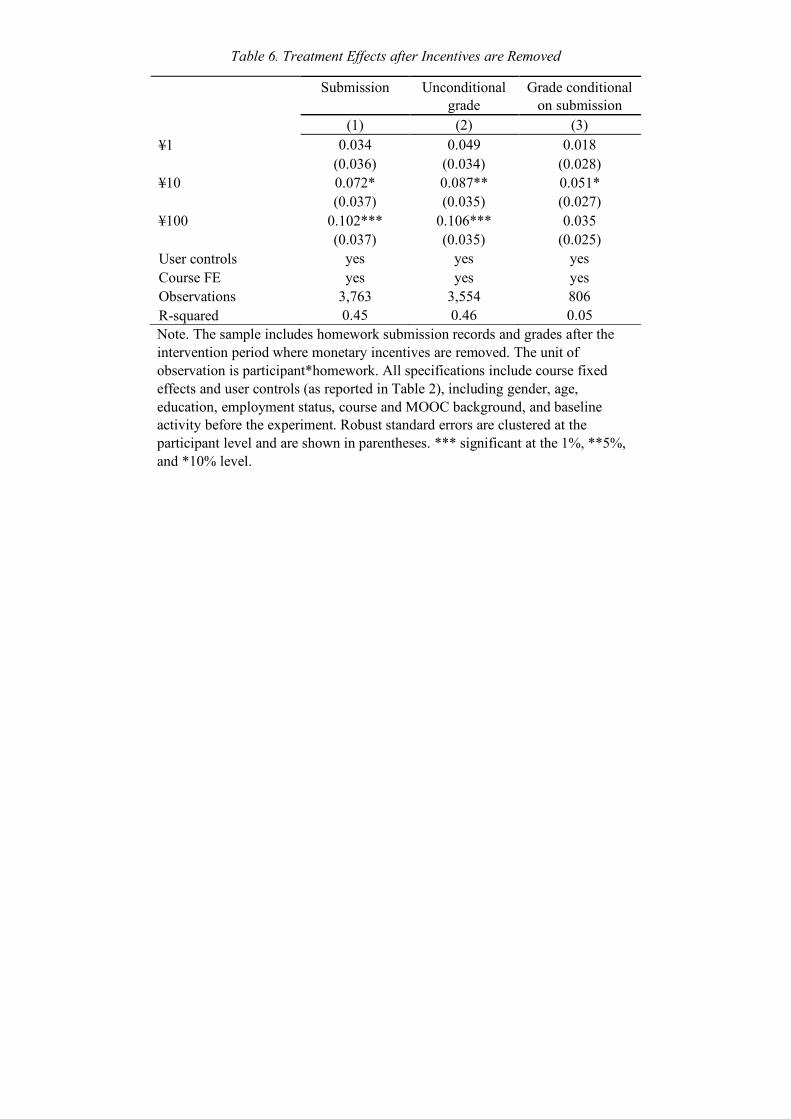
Table 6. Treatment Effects after Incentives are Removed
Submission Unconditional grade
Grade conditional on submission
(1) (2) (3) ¥1 0.034 0.049 0.018 (0.036) (0.034) (0.028) ¥10 0.072* 0.087** 0.051* (0.037) (0.035) (0.027) ¥100 0.102*** 0.106*** 0.035 (0.037) (0.035) (0.025) User controls yes yes yes Course FE yes yes yes Observations 3,763 3,554 806 R-squared 0.45 0.46 0.05 Note. The sample includes homework submission records and grades after the intervention period where monetary incentives are removed. The unit of observation is participant*homework. All specifications include course fixed effects and user controls (as reported in Table 2), including gender, age, education, employment status, course and MOOC background, and baseline activity before the experiment. Robust standard errors are clustered at the participant level and are shown in parentheses. *** significant at the 1%, **5%, and *10% level.

Table 7: Spillover Effects
Video hour on other courses
during intervention
Video hour on other courses
after intervention
Grade of other courses during
the same semester
# of enrolled courses in the
following semester
Certificate rate in the following
semester
(1) (2) (3) (4) (5)
¥1 0.045 0.022 -0.005 -0.220 0.035** (0.030) (0.027) (0.019) (0.266) (0.016) ¥10 0.033 0.017 -0.006 -0.408 0.030* (0.029) (0.030) (0.018) (0.255) (0.016) ¥100 0.080** 0.040 0.039* -0.101 0.039** (0.032) (0.029) (0.020) (0.253) (0.017) User controls yes yes yes yes yes Course FE yes yes yes yes yes Observations 2,154 3,763 639 718 507 R-squared 0.11 0.09 0.27 . 0.19
Note. The sample for columns (1) to (3) include participants’ video activity and performance in other courses they enrolled in during the same semester. The sample for columns (4) and (5) include participants’ enrolment and performance in the semester after our experiment. Columns (4) report Poisson estimates of the treatment effects on the number of courses enrolled in the following semester. Columns (5) report the OLS estimates of the effects on the likelihood of obtaining certificates from enrolled courses. All specifications include course fixed effects and user controls (as reported in Table 2), including gender, age, education, employment status, course and MOOC background, and baseline activity before the experiment. Robust standard errors are clustered at the participant level and are shown in parentheses. Columns (3) and (6) use average unconditional grades as the dependent variable and further control for the number of courses in which the participant enrolled. *** significant at the 1%, **5%, the *10% level.
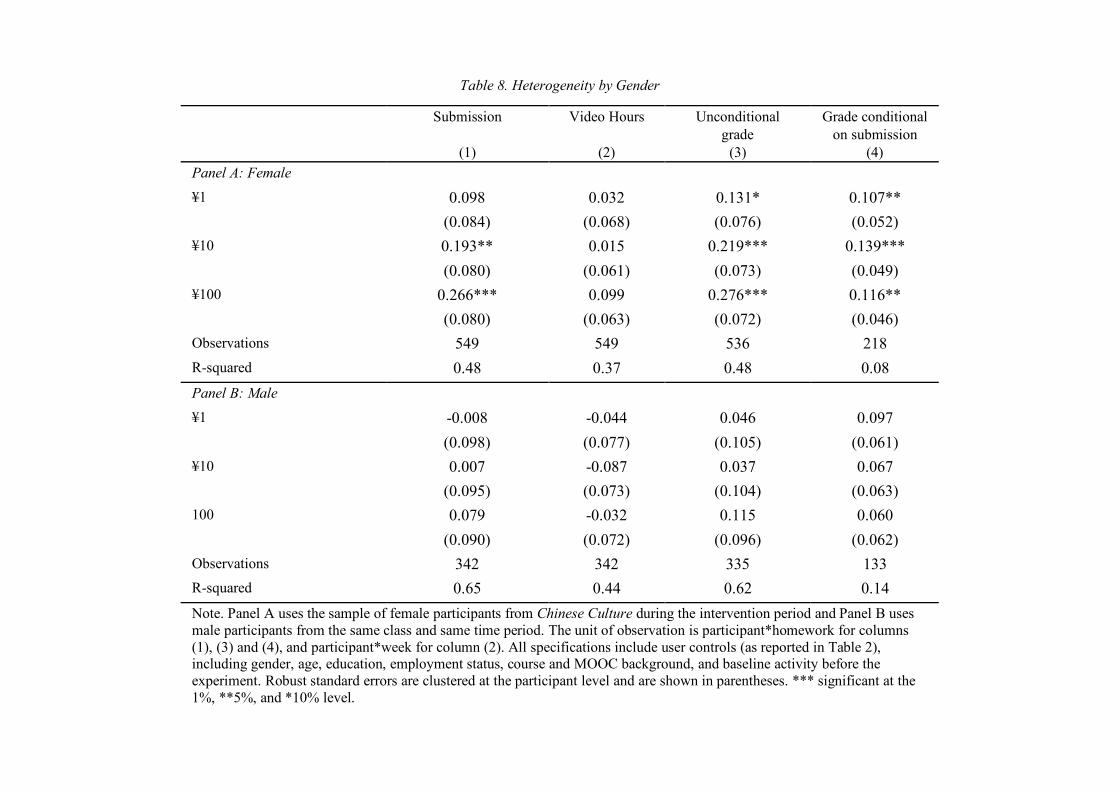
Table 8. Heterogeneity by Gender
Submission
(1)
Video Hours
(2)
Unconditional grade
(3)
Grade conditional on submission
(4) Panel A: Female
¥1 0.098 0.032 0.131* 0.107** (0.084) (0.068) (0.076) (0.052) ¥10 0.193** 0.015 0.219*** 0.139*** (0.080) (0.061) (0.073) (0.049) ¥100 0.266*** 0.099 0.276*** 0.116** (0.080) (0.063) (0.072) (0.046) Observations 549 549 536 218 R-squared 0.48 0.37 0.48 0.08 Panel B: Male
¥1 -0.008 -0.044 0.046 0.097 (0.098) (0.077) (0.105) (0.061) ¥10 0.007 -0.087 0.037 0.067 (0.095) (0.073) (0.104) (0.063) 100 0.079 -0.032 0.115 0.060 (0.090) (0.072) (0.096) (0.062) Observations 342 342 335 133 R-squared 0.65 0.44 0.62 0.14 Note. Panel A uses the sample of female participants from Chinese Culture during the intervention period and Panel B uses male participants from the same class and same time period. The unit of observation is participant*homework for columns (1), (3) and (4), and participant*week for column (2). All specifications include user controls (as reported in Table 2), including gender, age, education, employment status, course and MOOC background, and baseline activity before the experiment. Robust standard errors are clustered at the participant level and are shown in parentheses. *** significant at the 1%, **5%, and *10% level.

Table 9. Heterogeneity by Offline Educational Resources
Submission
(1)
Video Hours
(2)
Unconditional grade
(3)
Grade conditional on submission
(4) Panel A: Few offline Edu Institutions
¥1 0.286*** 0.156* 0.358*** 0.175 (0.109) (0.086) (0.108) (0.115) ¥10 0.305*** 0.053 0.331*** 0.141 (0.097) (0.075) (0.100) (0.110) ¥100 0.299*** 0.182** 0.321*** 0.135 (0.088) (0.074) (0.090) (0.109) Observations 372 372 366 166 R-squared 0.56 0.37 0.56 0.16 Panel B: More offline Edu Institutions
¥1 0.006 -0.072 0.028 0.055 (0.084) (0.069) (0.079) (0.042) ¥10 0.084 -0.012 0.109 0.070** (0.080) (0.071) (0.075) (0.031) 100 0.168** -0.048 0.192** 0.076** (0.083) (0.072) (0.077) (0.029) Observations 387 387 381 160 R-squared 0.61 0.43 0.59 0.14 Note. Participants’ offline education resources are measured by the number of higher education institutions in their location (traced by IP address). Participants are divided by the sample median into the subsample of fewer (Panel A) or more offline educational resources (Panel B). Both panels use the participants from Chinese Culture during the intervention period. The unit of observation is participant*homework for columns (1), (3) and (4), and participant*week for column (2). All specifications include user controls (as reported in Table 2), including gender, age, education, employment status, course and MOOC background, and baseline activity before the experiment. Robust standard errors are clustered at the participant level and are shown in parentheses. *** significant at the 1%, **5%, and *10% level.

Appendix Figure 1: Average Homework Submission Rate before and during Intervention by Course

Appendix Figure 2: Unconditional Means of Homework Grades before and during Intervention by Course

Appendix Table A1: Testing Sample Selection (Chinese Culture)
Male (1)
Age (2)
Education (3)
Employment (4)
Experience (5)
Network (6)
Time Commitment (7)
¥1 0.041 1.578 -0.123 0.235 0.057 -0.048 0.111
(0.103) (1.729) (0.138) (0.212) (0.206) (0.070) (0.121)
¥10 -0.081 0.755 -0.119 0.137 -0.074 -0.094 0.230**
(0.101) (1.606) (0.137) (0.214) (0.199) (0.066) (0.116)
¥100 -0.075 1.320 -0.004 0.142 0.059 -0.018 0.105
(0.101) (1.700) (0.131) (0.213) (0.200) (0.073) (0.116)
Observations 224 220 212 222 224 224 224
R2 0.01 0.00 0.01 0.01 0.00 0.01 0.02
Mean dep var, control 0.371 25.971 2.187 1.765 1.800 0.143 2.286
Retake
(8)
# of courses taken
(9)
# of certificates obtained
(10)
Mean HW score (before experiment)
(11)
Submission rate (before experiment)
(12)
Video hours (before experiment)
(13) ¥1 0.076 0.152 -0.073 -0.022 -0.034 -0.460
(0.074) (0.568) (0.200) (0.041) (0.064) (0.640)
¥10 -0.018 -0.590 -0.018 0.007 -0.024 -0.949
(0.066) (0.546) (0.202) (0.037) (0.064) (0.630)
¥100 0.058 -0.316 -0.079 0.036 0.020 0.049
(0.072) (0.567) (0.191) (0.035) (0.062) (0.642)
Observations 224 224 224 224 224 224
R2 0.01 0.01 0.00 0.01 0.00 0.02
Mean dep var, control 0.114 1.800 0.486 0.859 0.690 3.783
Note. The sample includes participants who made at least one homework submission during the intervention period. Each column reports the estimates of regressing treatment dummies on participant predetermined characteristics. Robust standard errors are clustered at the participant level and are shown in parentheses. *** significant at the 1%, **5%, and *10% level.
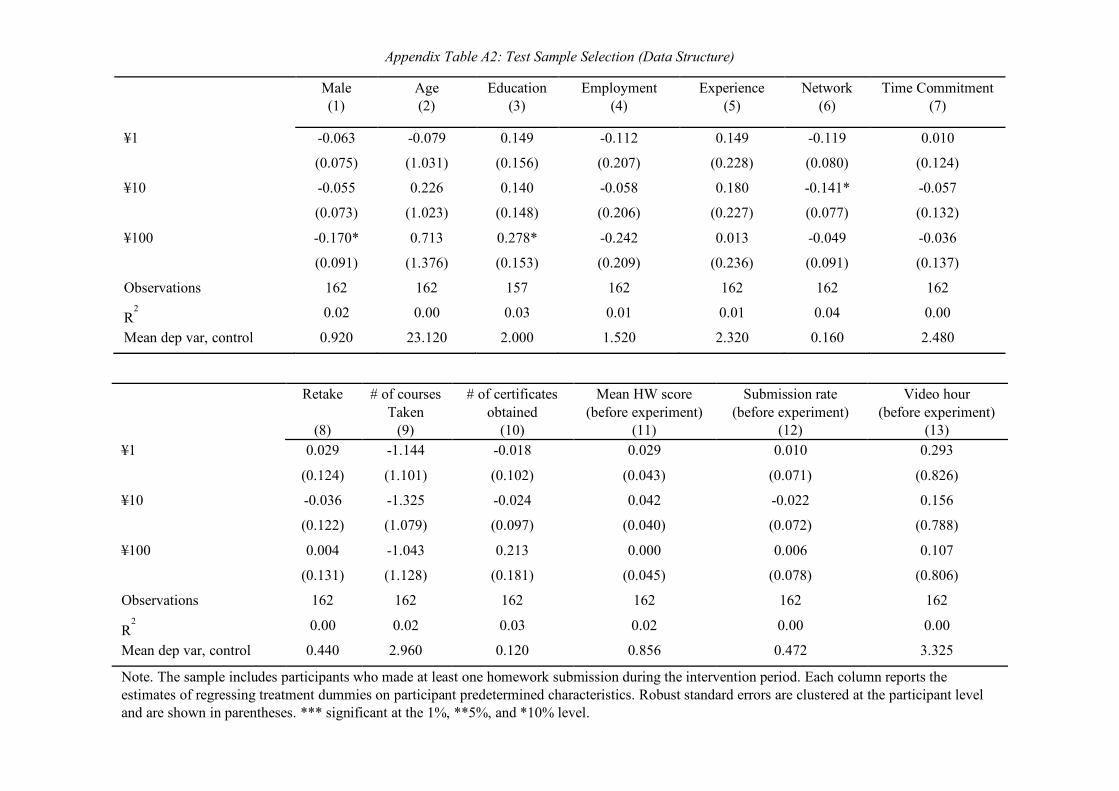
Appendix Table A2: Test Sample Selection (Data Structure)
Male (1)
Age (2)
Education (3)
Employment (4)
Experience (5)
Network (6)
Time Commitment (7)
¥1 -0.063 -0.079 0.149 -0.112 0.149 -0.119 0.010
(0.075) (1.031) (0.156) (0.207) (0.228) (0.080) (0.124)
¥10 -0.055 0.226 0.140 -0.058 0.180 -0.141* -0.057
(0.073) (1.023) (0.148) (0.206) (0.227) (0.077) (0.132)
¥100 -0.170* 0.713 0.278* -0.242 0.013 -0.049 -0.036
(0.091) (1.376) (0.153) (0.209) (0.236) (0.091) (0.137)
Observations 162 162 157 162 162 162 162
R2 0.02 0.00 0.03 0.01 0.01 0.04 0.00
Mean dep var, control 0.920 23.120 2.000 1.520 2.320 0.160 2.480
Retake
(8)
# of courses Taken
(9)
# of certificates obtained
(10)
Mean HW score (before experiment)
(11)
Submission rate (before experiment)
(12)
Video hour (before experiment)
(13) ¥1 0.029 -1.144 -0.018 0.029 0.010 0.293
(0.124) (1.101) (0.102) (0.043) (0.071) (0.826)
¥10 -0.036 -1.325 -0.024 0.042 -0.022 0.156
(0.122) (1.079) (0.097) (0.040) (0.072) (0.788)
¥100 0.004 -1.043 0.213 0.000 0.006 0.107
(0.131) (1.128) (0.181) (0.045) (0.078) (0.806)
Observations 162 162 162 162 162 162
R2 0.00 0.02 0.03 0.02 0.00 0.00
Mean dep var, control 0.440 2.960 0.120 0.856 0.472 3.325
Note. The sample includes participants who made at least one homework submission during the intervention period. Each column reports the estimates of regressing treatment dummies on participant predetermined characteristics. Robust standard errors are clustered at the participant level and are shown in parentheses. *** significant at the 1%, **5%, and *10% level.

Appendix Table B1: Balance Test (Chinese Culture)
Male Age Edu Employment status
Experience w/ subject
Friends in same
course
Time commitment Retake
# of courses taken
# of certificates obtained
homework score
homework submission
rate ¥1 vs. ¥10 0.98 0.98 0.98 0.98 0.98 0.98 0.98 0.98 0.98 0.98 0.98 0.98 ¥1 vs. ¥100 0.94 0.94 0.94 0.94 0.94 0.94 0.94 0.94 0.94 0.94 0.94 0.94 ¥1 vs. -¥1 0.96 0.92 0.73 0.80 0.96 0.73 0.96 0.96 0.73 0.92 0.73 0.73 ¥1 vs. -¥10 0.80 0.84 0.94 0.72 0.84 0.84 0.72 0.72 0.84 0.84 0.72 0.72 ¥1 vs. -¥100 0.91 0.91 0.95 0.91 0.91 0.91 0.91 0.91 0.91 0.91 0.91 0.91 ¥1 vs. control 0.94 0.89 0.89 0.89 0.94 0.89 0.89 0.89 0.94 0.94 0.94 0.94 ¥10 vs. ¥100 0.87 0.87 0.87 0.87 0.91 0.87 0.87 0.87 0.87 0.87 0.87 0.87 ¥10 vs. -¥1 1.00 1.00 1.00 1.00 1.00 1.00 1.00 1.00 1.00 1.00 1.00 1.00 ¥10 vs. -¥10 0.76 0.78 0.78 0.78 0.76 0.78 0.76 0.76 0.76 0.97 0.76 0.76 ¥10 vs. -¥100 0.98 0.98 0.98 0.98 0.98 0.98 0.98 0.98 0.98 0.98 0.98 0.98 ¥10 vs. control 0.92 0.92 0.92 0.92 0.92 0.92 0.92 0.92 0.92 0.92 0.92 0.92 ¥100 vs. -¥1 0.84 0.84 0.58 0.84 0.84 0.84 0.84 0.84 0.84 0.84 0.58 0.58 ¥100 vs. -¥10 0.78 0.87 0.78 0.78 0.78 0.78 0.78 0.78 0.78 0.78 0.78 0.78 ¥100 vs. -¥100 0.96 0.94 0.94 0.94 0.94 0.94 0.94 0.94 0.94 0.94 0.94 0.94 ¥100 vs. control 0.99 0.99 0.99 0.99 0.99 0.99 0.99 0.99 0.99 0.99 0.99 0.99 -¥1 vs. -¥10 0.71 0.71 0.71 0.83 0.78 0.73 0.71 0.71 0.71 0.73 0.78 0.78 -¥1 vs. -¥100 0.99 0.99 0.97 0.99 0.99 0.99 0.99 0.99 0.99 0.99 0.97 0.97 -¥1 vs. control 0.83 0.51 0.46 0.78 0.83 0.83 0.83 0.51 0.83 0.83 0.51 0.46 -¥10 vs. -¥100 0.71 0.71 0.99 0.71 0.99 0.71 0.71 0.71 0.71 0.71 0.71 0.71 -¥10 vs. control 0.78 0.80 0.78 0.78 0.78 0.80 0.66 0.80 0.78 0.80 0.78 0.78 -¥100 vs. control 0.95 0.93 0.94 0.93 0.94 0.94 0.93 0.94 0.95 0.94 0.94 0.94
Note. Each cell reports the p-value of two-sided t-tests for the corresponding user characteristic between the treatment and control groups. We employed the False Discovery Rate (FDR) of Benjamini and Hochberg (1995) to adjust the p-values.

Appendix Table B2: Balance Test (Data Structure)
Male Age Edu Employment status
Experience w/ subject
Friends in same course
Time commitment Retake
# of courses taken
# of certificates obtained
homework score
homework submission
rate ¥1 vs. ¥10 0.90 0.90 0.90 0.90 0.46 0.90 0.90 0.90 0.90 0.90 0.90 0.90 ¥1 vs. ¥100 0.96 0.96 0.56 0.77 0.52 0.93 0.77 0.52 0.73 0.77 0.52 0.52 ¥1 vs. -¥1 0.70 0.78 0.71 0.70 0.70 0.70 0.87 0.70 0.84 0.70 0.70 0.70 ¥1 vs. -¥10 0.96 0.96 0.80 0.96 0.50 0.96 0.96 0.96 0.96 0.96 0.96 0.96 ¥1 vs. -¥100 0.79 0.79 0.79 0.73 0.66 0.79 0.79 0.73 0.79 0.70 0.66 0.66 ¥1 vs. control 0.86 0.94 0.86 0.90 0.86 0.90 0.94 0.86 0.86 0.86 0.90 0.90 ¥10 vs. ¥100 0.46 0.73 0.46 0.46 0.73 0.46 0.46 0.46 0.46 0.95 0.46 0.46 ¥10 vs. -¥1 1.00 1.00 1.00 1.00 1.00 1.00 1.00 1.00 1.00 1.00 1.00 1.00 ¥10 vs. -¥10 0.95 0.95 0.95 0.95 0.95 0.95 0.95 0.95 0.95 0.95 0.95 0.95 ¥10 vs. -¥100 0.76 0.91 0.91 0.76 0.76 0.76 0.76 0.76 0.76 0.76 0.76 0.76 ¥10 vs. control 0.96 0.96 0.76 0.96 0.96 0.96 0.96 0.96 0.76 0.96 0.96 0.96 ¥100 vs. -¥1 0.90 0.90 0.90 0.95 0.94 0.90 0.90 0.90 0.90 0.96 0.90 0.90 ¥100 vs. -¥10 0.68 0.76 0.76 0.68 0.76 0.68 0.68 0.68 0.68 0.68 0.68 0.68 ¥100 vs. -¥100 0.99 0.99 0.77 0.77 0.99 0.99 0.99 0.99 0.99 0.99 0.99 0.99 ¥100 vs. control 0.96 0.96 0.96 0.96 0.96 0.96 0.96 0.96 0.96 0.96 0.96 0.96 -¥1 vs. -¥10 1.00 1.00 0.94 0.94 0.94 0.94 0.94 0.94 0.94 0.94 0.94 0.94 -¥1 vs. -¥100 0.90 0.90 0.90 0.90 0.90 0.90 0.90 0.98 0.90 0.90 0.90 0.90 -¥1 vs. control 0.98 0.98 0.98 0.98 0.98 0.98 0.98 0.98 0.98 0.98 0.98 0.98 -¥10 vs. -¥100 0.78 0.78 0.72 0.72 0.78 0.72 0.72 0.78 0.78 0.72 0.72 0.72 -¥10 vs. control 0.94 0.94 0.98 0.94 0.94 0.94 0.94 0.94 0.94 0.94 0.94 0.94 -¥100 vs. control 0.91 0.91 0.91 0.91 0.96 0.96 0.91 0.96 0.91 0.91 0.91 0.91
Note. Each cell reports the p-value of two-sided t-tests for the corresponding user characteristic between the treatment and control groups. We employed the False Discovery Rate (FDR) of Benjamini and Hochberg (1995) to adjust the p-values.

Appendix Table C: Summary Statistics for Participants and Nonparticipants
Sample Participants Nonparticipants Difference & p-value
(1) (2) (3) Male 0.623 0.814 -0.192*** (0.485) (0.389) (0.000) Age 25.162 24.385 0.777*** (6.743) (6.000) (0.001) Education Below College 0.102 0.215 -0.113*** (0.303) (0.411) (0.000) College 0.676 0.582 0.094*** (0.468) (0.493) (0.000) Master and PhD 0.221 0.203 0.0184 (0.415) (0.402) (0.236) MOOC background Number of courses taken 2.134 6.424 -4.290*** (3.516) (9.581) (0.000) Number of certificates obtained 0.253 0.053 0.200*** (0.682) (0.294) (0.000) Observations 755 12,062
Note: Non-participants did not fill in our survey and therefore had fewer variables on demographic and online learning characteristics. The summary statistics of non-participants are based on students who registered the respective courses and had provide at least one of the three variables: gender, age and education background.

Appendix Table D: Homework Submission Rate during Intervention by Course
Outcome: Whether homework assignment has been submitted on time Course 1: Chinese Culture Course 2: Data Structure (1) (2) (3) (4) (5) (6) ¥1 0.063 0.098 -0.055 -0.022 -0.045 -0.033 (0.066) (0.075) (0.085) (0wu.033) (0.040) (0.030) ¥10 0.134** 0.142** -0.028 -0.002 0.009 -0.034 (0.065) (0.069) (0.084) (0.030) (0.035) (0.032) ¥100 0.201*** 0.232*** 0.056 0.069** 0.062* -0.010 (0.063) (0.069) (0.089) (0.033) (0.036) (0.035) ¥1 x punish -0.074 0.047 (0.062) (0.039) ¥100 x punish -0.019 -0.021 (0.065) (0.030) ¥100 x punish -0.065 0.016 (0.060) (0.043) ¥1 x active 0.192 0.025 (0.128) (0.067) ¥10 x active 0.295** 0.075 (0.127) (0.062) ¥100 x active 0.273** 0.255*** (0.127) (0.072) Observations 891 891 891 1,263 1,263 1,263 R-squared 0.53 0.53 0.54 0.36 0.36 0.42 Note. The sample includes homework submission records during the intervention period where participants in treatments are rewarded with a monetary incentive. The unit of observation is participant*homework. “Punish” is a dummy variable indicating whether the incentive is introduced as a loss for each assignment that fails to meet the threshold. “Active” is a dummy variable indicating whether a participant’s pre-intervention submission rate is above the sample mean. All specifications include user controls (as reported in Table 2), including gender, age, education, employment status, course and MOOC background, and baseline activity before the experiment. Robust standard errors are clustered at the participant level and are shown in parentheses. *** significant at the 1%, **5%, and *10% level.