certified financial consultant project july 2018rpk revenue passenger kilometers usd united states...
TRANSCRIPT

Royal Jordanian Airlines
Certified Financial Consultant Project – July 2018
By:
Maath Shadid

2 | P a g e
Table of Contents Page
List of Acronyms 3
Investment Summary 4
Introduction 6
Macro-Economic Factors 8
Global Industrial Outlook 11
Regional Outlook 17
Local Outlook 19
Royal Jordanian Information and Company Analysis 20
SWOT Analysis 22
PESTLE Analysis 23
Financial Analysis 24
Company Valuation 29
Appendices 33

3 | P a g e
List of Acronyms:
APAC Asia Pacific
ASE Amman Stock Exchange
CAGR Compounded Annual Growth Rate
CAPM Capital Asset Pricing Model
COGS Cost of Goods Sold
EBIT Earnings Before Interest and Taxes
EBITDA Earnings Before Interest, Taxes, Depreciation & Amortization
FTK Freight Ton Kilometers
GDP Gross Domestic Product
GNP Gross National Product
GP Gross Profit
IATA International Air Transport Association
LCC Low-cost carriers
MENA Middle East and North Africa
RJ / RJAL Royal Jordanian Airlines
RPK Revenue Passenger Kilometers
USD United States Dollar
WACC Weighted Average Cost of Capital

4 | P a g e
Investment Summary:
The following report serves as a valuation of Royal Jordanian’s shares and
provides a “buy / hold” recommendation based on the accompanying analysis,
market data, and future outlook, in addition to speculation on the fact that a
significant restructure to turn the Company around is inevitable considering the
“national carrier” status of the airline, its importance to the image of the Hashemite
Kingdom of Jordan, and its position as one of the most important employers in the
Country.
The Company’s shares are traded on the Amman Stock Exchange under stock
symbol RJAL and Company Code 131213.
The valuation of RJAL’s shares yields a value of JOD 0.41 per share which, when
graphed along with the closing price for the Company’s shares over the last 19
months, shows an upside potential as shown in the graph below.
Figure 1: Source: RJAL Stock Price, ASE Website
A set of financial projections were developed for purposes of valuating the airline
and its shares. Based on the information we have on hand, and the high level
information available from the Company’s declared business plan, the revenues
were grown by the 2017 GDP growth rate of 2.2%. Also, with the cost saving
0.35
0.4
0.45
0.5
0.55
0.6
RJAL Closing Price (JOD)

5 | P a g e
plans set in motion by the airline, the Gross Profit was assumed to grow at the
inflation rate of 3.3%.
The Company is currently suffering from depressed asset utilization rates and its
plans are to improve these rates to turn the airline around through its trading
activities.
The 2015 – 2019 business plan highlighted on the Company’s website highlights
the approach going to be taken by the airline and they include reexamining the
current active routes and replacing dangerous or non-rewarding routes with more
viable ones, increasing transit traffic through the airline, tapping new revenue
streams, implementing various fuel saving initiatives, and improving aircraft
financing structures.
It is through these various initiatives that the airline hopes to turn its business
around and start generating profits for its shareholders in an effort to break the
vicious loss making cycle it has been going through in recent years.

6 | P a g e
Introduction
The aviation industry is one of the fastest growing transportation sectors due to the
ever-increasing global demand for fast and reliable transportation; one that is
necessary to fulfil the global interdependence on goods and services. Between
2009 and 2017, annual revenue in the global aviation industry grew at a compound
annual growth rate (CAGR) of around 5.9%, reaching USD 754 billion in 2017,
and is expected to reach a record USD 834 billion in 20181.
The USA, Brazil, China, and Europe are among the most critical air travel markets.
The world’s busiest airports are Hartsfield–Jackson Atlanta International Airport,
with over 104 million passengers passing through each year, and Hong Kong
International Airport, where about 4.9 million tons of freight are handled annually.
Where revenues are concerned, American, Delta, and United Continental Holdings
are the leading airlines worldwide.
The introduction of ancillary revenue streams, online self-service access to
services, and the continuing deregulation of the global civil aviation industry have
paved the way to a growing low-cost airlines sub-industry. Examples of this new
offshoot includes Ryanair (Ireland) and Southwest Airlines (USA) which cater to a
growing market demand that offers lower air fare prices to customers in return for
basic services, and can generate extra revenue by charging extras for even the
simplest of services that may include food, beverages, flight entertainment access,
and even earphones.
It is very difficult for someone to truly appreciate something until it is taken away,
and the world felt what it was like to have air traffic interrupted – albeit in a
specific region and not on a global scale. The 2010 Icelandic volcano was a
testament to just how much our lives and livelihoods are dependent on air
transportation, as the eruption caused a week-long interruption of air traffic in
Europe, and disrupted the lives of over 10 million passengers, and cost the global
economy an estimated USD 5 billion. The volcano erupted spewing debris, ash,
and heavy smoke to as high as 3 kilometers, which due to strong winds spread to
most of Europe.
In the wake of this natural disaster, the world saw industries across the board being
affected in a display of just how critical air travel was in our daily lives. Industries
reliant on just-in-time inventories were especially hard hit; everything from
1 Source: Air Transportation – Statistics & Facts, Statista, www.statista.com

7 | P a g e
perishables to electronic components were delayed and significant losses were
experienced along all the stages of the supply and manufacturing chains.
Air transportation is becoming the transportation method of choice especially in
light of increased carrier competition, more affordable pricing, and strengthening
of safety records.

8 | P a g e
Macro-Economic Factors
Consumers
Air travelers are expected see a significant increase in the value they get from air
transport this year and beyond, including price stability. New destinations are
forecast to rise further, alongside increased flight frequencies; both to the benefit of
the consumer. It is estimated that 1% of world GDP will be spent on air transport
in 2018. Revenue Passenger Kilometers (RPKs), which have been growing well
above historical trends, are forecast to remain strong going forward as global
economies improve and as the spending patterns of consumers increasingly favor
air travel. Reductions in overall travel costs have contributed positively to RPK
growth; on average, and after inflationary adjustments, it now costs 59% less than
it did 20 years ago to purchase a round trip plane ticket.
Global Economy
Global economic development is being supported by the growth in air transport,
which in turn contributes positively to other supporting industries like logistics,
hospitality, and manufacturing, to name a few. Additionally, and as demand for air
travel continues to rise, the number of destinations (or route pairings) also rises
with many airlines adding smaller cities in destination countries instead of
previously only focusing on capital, or major, cities.
The reduction in air transport cost and the increase in service coverage lead to
enhanced trade flows; which has a direct positive effect on jobs both directly and
indirectly related to the industry, where it is estimated to employ over 70 million
people in 2018.
Capital Providers
Financing aircrafts is critical to the industry, and the ability to secure financing to
expand fleets is considered a core competency in most cases. The airline industry
is capital intensive and requires a significant cost for maintaining these mobile
assets. As such, the majority of aircrafts are long term debt financed through
operating or finance leases, and as the borrowers become more profitable and cash

9 | P a g e
generative with an improved debt profile, their financing costs typically reduce
and, as a result, profitability increases which further fuels the investment cycle.
Until recently, returns on equity have not been commensurate with the risks
involved in the investment, save a few exceptions. Investors have been diligently
trying to reduce the cost of financing and other operating costs to yield higher
returns on their investment. Of late, under the growing global economy carried by
oil prices, and by the increasing cash in the economies, lending appetite has also
increased especially where the underlying assets were easily identifiable and
transferable – which is the typical definition of an aircraft – and the associated
financing structures more favorable.
Aircraft
In 2018, commercial airlines are expected to take delivery of over 1,900 new
aircrafts2, indicating heavy investments by the industry, driven by the gradual
increase in investment returns. Additionally, and under the pressure of
environmental consciousness coupled with rising and fluctuating fuel costs,
airlines are upgrading existing fleets, to enhance fuel efficiency from newer
engines and aircraft designs.
The global commercial airline fleet is expected to reach almost 30,000 aircraft by
the end of the year; availing travelers of over 4.4 million seats. Aircraft passenger
load factors are also on the rise, which will in turn increase financial yield.
The ultimate goal being to move more people and cargo in fewer trips and at lower
costs.
Fuel
This year, it is forecast that the airlines fuel bill will rise to $188 billion, which will
represent 24.2% of average operating costs3. It is common for airlines hedge their
fuel purchases which are directly related to crude oil prices. Fuel constitutes a large
portion of airline operating costs and as such, there is an ever-increasing effort to
reduce fuel procurement costs, improve fuel efficiency, and enhance airspace and
airport flight paths and procedures to further reduce unnecessary fuel burn. 2 Source: Airbus Global Market Forecast 2017-2036, 2017, Airbus, www.airbus.com 3 Source: Economic Performance of the Airline Industry, 2018, IATA, www.iata.org/economics

10 | P a g e
Labor
The airline industry is constantly creating job opportunities and are expecting to
accelerate hiring further in the short to medium term to fulfil the growing demand
for air travel and the growing aircraft fleet size.
In addition to job creation in related industries, there is a ripple effect whenever a
new job is created. Simple economic forces take hold and job creation starts to take
effect not only in the airline or supporting services industries but rather in most
economic activities.

11 | P a g e
Global Industrial Outlook
The changing landscape for global air travel
The airline industry is moving towards expansion. Not only are fleet sizes on the
rise, but passenger carrying abilities are also being increased as evidenced by
major airlines ordering larger aircrafts like the Airbus A380 and Boeing
Dreamliner, and airports around the world making the necessary adjustments to
their facilities to be able to handle the larger planes.
Airlines are also listening to their customers and trying to deliver a flying
experience that goes beyond the actual commute to increase market share. Some
airlines provide a range of luxurious offerings that include gourmet food, in-flight
entertainment, connectivity options, larger seats, and in some cases private cabins
fit for royalty.
Low-cost airlines are also changing their business model and through servicing
longer journeys and airports typically ignored by major airlines. While the main
business model for low-cost remains competition on price, the general flight
offering is being expanded to include some advantages to the traveler in addition to
the “cheap” ticket; an example of this is the growing “weekend warrior” flight plan
that caters to employees that travel home at the start of their weekend and return to
work after their weekend is over.
Air Passenger Growth
Perhaps the most important factor driving growth in any activity in the world is the
constantly increasing global population. Over the last 20 years, the annual
population growth rate has been around 1.2%. The graph below shows the
progression of world population and projected growth until 2022 where it is
expected to reach 8 billion people.
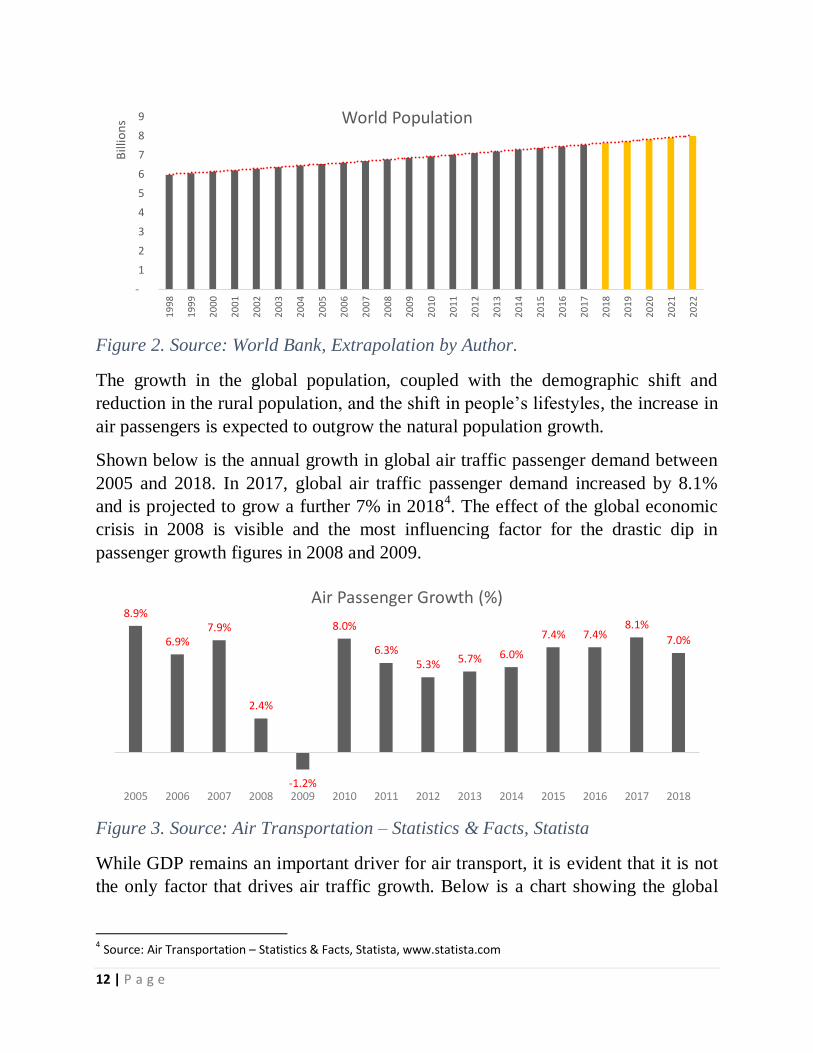
12 | P a g e
Figure 2. Source: World Bank, Extrapolation by Author.
The growth in the global population, coupled with the demographic shift and
reduction in the rural population, and the shift in people’s lifestyles, the increase in
air passengers is expected to outgrow the natural population growth.
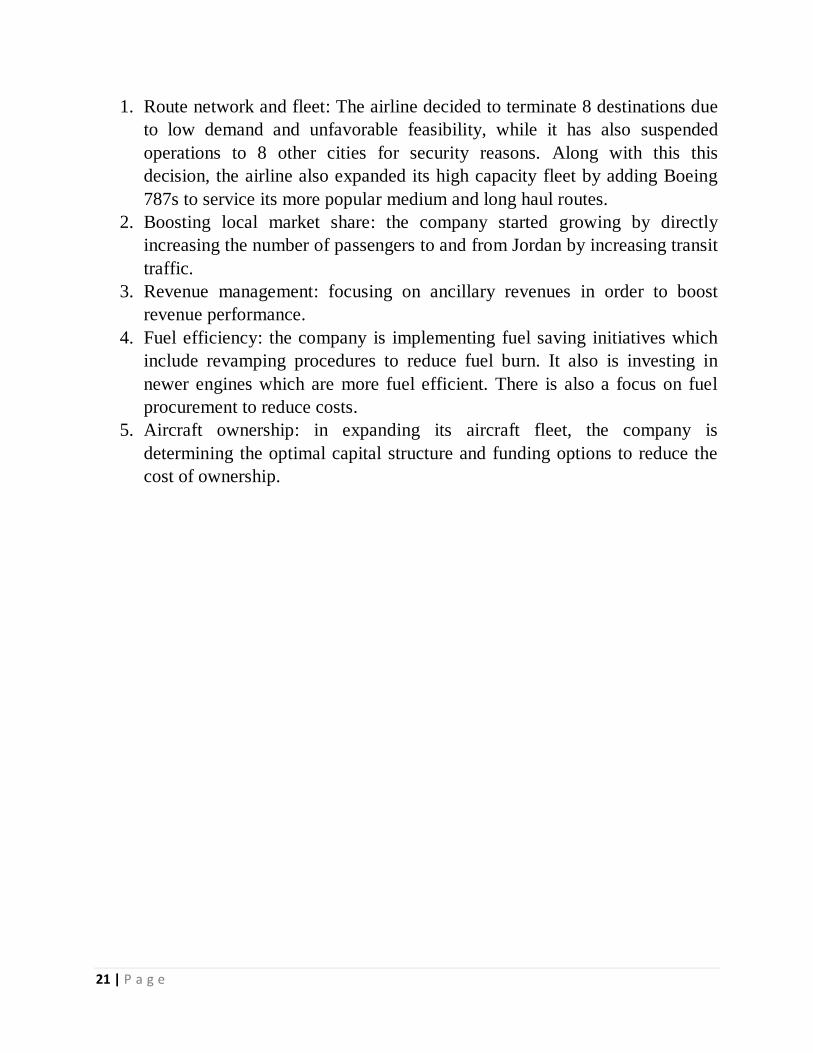
Shown below is the annual growth in global air traffic passenger demand between
2005 and 2018. In 2017, global air traffic passenger demand increased by 8.1%
and is projected to grow a further 7% in 20184. The effect of the global economic
crisis in 2008 is visible and the most influencing factor for the drastic dip in
passenger growth figures in 2008 and 2009.
Figure 3. Source: Air Transportation – Statistics & Facts, Statista
While GDP remains an important driver for air transport, it is evident that it is not
the only factor that drives air traffic growth. Below is a chart showing the global
4 Source: Air Transportation – Statistics & Facts, Statista, www.statista.com
-
1
2
3
4
5
6
7
8
9
19
98
19
99
20
00
20
01
20
02
20
03
20
04
20
05
20
06
20
07
20
08
20
09
20
10
20
11
20
12
20
13
20
14
20
15
20
16
20
17
20
18
20
19
20
20
20
21
20
22
Bill
ion
s World Population
8.9%
6.9% 7.9%
2.4%
-1.2%
8.0%
6.3% 5.3% 5.7% 6.0%
7.4% 7.4% 8.1%
7.0%
2005 2006 2007 2008 2009 2010 2011 2012 2013 2014 2015 2016 2017 2018
Air Passenger Growth (%)

13 | P a g e
GDP over the last 20 years overlapped with the number of global travelers for the
same period.
Figure 4. Source: Data Bank, World Bank.
Other drivers that define where and how air travel will develop include the
evolution of airline business models, liberalization, tourism development, shifts in
population age demographic, unemployment rates, urban expansion, and
population growth.
Middle classes in emerging economies are on the rise and help global air traffic
growth along other factors discussed earlier. The annual growth rate for world
travelers is expected to grow at a CAGR of 4% through to 2034, despite several
challenges faced by the industry, including high jet fuel prices and sluggish
economic growth. This effect can most clearly seen in Latin America and China,
for example, where Chinese tourists spend approximately USD 300 billion
annually on vacations outside China. Especially where seasonal events are taking
place, the entire region in which they are held usually experience a travel boom,
for example the FIFA World Cup, Olympics, and Expos.
As well as growth on existing routes, positive political activity between states can
also lead to growth, due to organic growth being constrained. This is evidenced by
the opening of previously closed destinations like Cuba, Iran, and possibly North
Korea.
-
1,000
2,000
3,000
4,000
5,000
6,000
-
10
20
30
40
50
60
70
80
90
1001
99
8
19
99
20
00
20
01
20
02
20
03
20
04
20
05
2006
2007
20
08
20
09
20
10
20
11
20
12
20
13
20
14
20
15
2016
20
17
20
18
20
19
20
20
Mill
ion
Pas
sen
gers
Car
ried
GLo
bal
GD
P U
SD T
rilli
on
s
World GDP World air travellers

14 | P a g e
Air traffic growth
Shown below, is a graph of the leading airlines in terms of Revenue Passenger
Kilometers (RPK). It is worth noting that four of the airlines on that list are
American, with three of which topping the list, and that two airlines, Emirates
Airlines and Qatar Airways, have made the list at fourth and twelfth place
respectively.
Figure 5. Source: Air Transportation – Statistics & Facts, Statista
Where freight air traffic is concerned, the two Middle Eastern giants named above
place an impressive second and fourth place in a list that is filled with seasoned
and dedicated freight carriers.
0 5 10 15 20 25 30 35
American
United
Delta
Emirates
Air France / KLM
China Southern
IAG
Lufthansa
Air China
Soutwhest
China Eastern
Qatar Airways
Singapore Airlines Group
Ryanair
Turkish Airlines
2017 RPK (billions)

15 | P a g e
Figure 6. Source: Statista.
The graph below shows the number of plane departures worldwide on an annual
basis for the last 20 years and an extrapolation through till 2022.
Figure 7. Source: World Bank, Extrapolation by Author.
Except for some anomalies, there has been a steady growth in air traffic throughout
this period to a point where almost 4 billion people were carried on just under 36
million flights in 2017. The trend is expected to continue throughout the projection
period to reach more than 41.5 million flight departures in 2022.
- 2.0 4.0 6.0 8.0 10.0 12.0 14.0 16.0 18.0
Federal Express
Emirates
United Parcel Service
Qatar Airways
Cathay Pacific Airways
Korean Air
Cargolux
Lufthansa
Air China
Singapore Airlines
2017 FTK (billions)
-
5
10
15
20
25
30
35
40
45
19
98
19
99
20
00
20
01
20
02
20
03
20
04
20
05
20
06
20
07
20
08
20
09
20
10
20
11
20
12
20
13
20
14
20
15
20
16
20
17
20
18
20
19
20
20
20
21
20
22
Mill
ion
Flig
ht
Dep
artu
res
Registered Carrier Departures Worldwide

16 | P a g e
Based on an Airbus study, the APAC region will lead world traffic by 2036, with a
three fold increase in the traffic serving this region by the end of the forecast
period, and China is expected to lead the domestic flights category, displacing the
United States. Although not home to the largest traffic flow, the Middle is expected
to host the largest annual growth at 6.7%, followed by the APAC and Africa at
5.6% and 5.3% respectively.
Contrary to road or rail transportation, and like maritime shipping, the aviation
industry is responsible for most of its own infrastructure and maintenance.
Figure 8. Source: Air Transportation – Statistics & Facts, Statista
The graph above compares a projection of the global aircraft fleet size in 2036 to
what it was in 2016, with a breakdown by region. It is noteworthy that the Middle
East region is expected to host the fastest growing aircraft fleet size followed
closely by APAC and Latin America, while APAC is expected to be home to the
largest aircraft fleet.
Financial Performance
The graph below shows the net profit of commercial airlines worldwide from 2005
to 2018. In 2018, the net profit of commercial airlines is projected to reach a record
USD 33.8 billion5. While there have been some fluctuations during the years
attributed to somewhat turbulent global economic conditions and heavily
fluctuating fuel prices, there definitely seems to be a positive overall movement in
5 Source: Economic Performance of the Airline Industry, 2018, IATA, www.iata.org/economics
- 2,000 4,000 6,000 8,000 10,000 12,000 14,000 16,000 18,000
Asia Pacific
North America
Europe
Latin America
Middle East
CIS
AfricaSize of Aircraft Fleets Worldwide (number of aircraft)
2036
2016

17 | P a g e
the industry as a whole. The return on investment for the industry is projected to be
around 8.5% for 2018, which is a record high.
Figure 9. Source: Air Transportation – Statistics & Facts, Statista
Regional Outlook
Lower crude oil prices and reduced government spending are currently restraining
economic growth in the Middle East and North Africa. With oil prices showing
signs of recovery, and with the numerous conflicts in the region being actively
resolved, the region’s real GDP is forecast to grow at 3.4% per year over the next
20 years.
The table below shows the breakdown of the growth forecasts in air traffic flow
between the Middle East and other world countries and regions:
Traffic flow to/from Middle
East
2016-2026
CAGR
2026-2036
CAGR
2016-2036
CAGR
Advanced Asia 5.5% 4.3% 4.9%
Australia/NZ 5.7% 4.0% 4.8%
Canada 9.5% 6.2% 7.8%
Central America 11.0% 6.1% 8.5%
Central Europe 9.4% 3.5% 6.4%
CIS 6.5% 2.5% 4.5%
Domestic Middle East 3.7% 3.4% 3.5%
Emerging Asia 7.7% 4.9% 6.3%
Indian Sub-Continent 7.1% 5.5% 6.3%
Intra Middle East 7.4% 4.2% 5.8%
(4.10)
5.00
14.70
(26.10)
(4.60)
17.30
8.30 9.20 10.70 13.80
36.00 34.20 38.00
33.80
2005 2006 2007 2008 2009 2010 2011 2012 2013 2014 2015 2016 2017 2018
Net Profit of Commercial Airlines Worldwide USD billion

18 | P a g e
Traffic flow to/from Middle
East
2016-2026
CAGR
2026-2036
CAGR
2016-2036
CAGR
Japan 5.5% 4.3% 4.9%
North Africa 7.1% 4.1% 5.6%
PRC 7.5% 5.7% 6.6%
Russia 6.5% 5.3% 5.9%
South Africa 8.4% 6.0% 7.2%
South America 11.0% 6.1% 8.5%
Sub Saharan Africa 7.5% 5.7% 6.6%
USA 9.5% 6.2% 7.8%
Western Europe 4.9% 4.3% 4.6%
Figure 10. Source: Airbus Global Market Forecast 2017-2036, 2017, Airbus
The largest growth with the Middle East is projected to be with the American
continent from Canada to South America. In general, the growth is expected to be
driven by the expansion of new longer routes as apposed to the more traditional
regional air traffic.
The MENA enjoys a strategic geographical presence that is central to major
economic and tourism hubs, and a true link between east and west. This has been
the main reason behind the robust activity in the region that enabled it to weather
the somewhat turbulent global political and economic times. While countries in the
region exhibited varying rates of growth and prosperity, a spillover effect is
expected to ripple through. The region and its airlines have been growing. As well
as its large world class airports by offering connections to destinations around the
globe.
According to IATA, the Middle East’s aviation market is expected to grow by an
annual rate of 5% in the next two decades to reach 517 million passengers. The
region’s high forecast growth rate is part of a wider trend towards eastern markets
driving future air passenger growth.
To meet this expected demand, airlines in the region benefit from new state of the
art airports and advanced fleets as well. Regional airlines are steadily increasing
flight frequency, geographical coverage, and offered seats on their more popular
routes.

19 | P a g e
Figure 11. Source: Airbus Global Market Forecast 2017-2036, 2017, Airbus
Shown above, is a projection of the size of the commercial aircraft fleet in the
Middle East which represents 6.1% and 7.8% of the global aircraft fleet size in
2017 and 2036 respectively, yet another testament to the “above-the-curve” growth
in the region.
Local Outlook
In Jordan, there is one dominant player in the airline industry. The reason for the
dominance of Royal Jordanian is the fact that the other, smaller, airlines mostly fly
short routes and local flights between Queen Alia International Airport in Amman
and King Hussein International Airport in Aqaba. Further, the airline was
established, and remains, the national airline of the Hashemite Kingdom of Jordan.
1,176
3,186 73
136
-
500
1,000
1,500
2,000
2,500
3,000
3,500
2017 2036
Middle East Commercial Aircraft Fleet (number of aircraft)
Passenger aircraft Freighter aircraft

20 | P a g e
Royal Jordanian Airlines Corporate Information6
RJ was established by a Royal Decree issued by His Majesty King Hussein at the
end of 1963, as the national air carrier of the Hashemite Kingdom of Jordan. The
airline currently owns and operates 25 aircrafts of different sizes.
Royal Jordanian shares were listed on the Amman Stock Exchange in December
2007, and has maintained its national carrier status. Throughout its history, RJ has
constantly developed by upgrading its aircrafts, expanding its routes, enhancing
operating procedures and systems.
The airline contributes a great deal to Jordan’s economy, as it constitutes about 3%
of the national GDP and helps bring in a significant amount of foreign currency
into the country. As is the case with this industry in other parts of the world, the
company employs thousands of people directly, and due to its size, is a significant
customer to suppliers and service providers all over Jordan.
The company is headquartered in Amman, and it flies out of Queen Alia
International Airport, one of the newest airports in the region. RJ also operates a
charter business through its subsidiary, Royal Wings.
In 2014, the airline introduced the first 5 Boeing 787s dedicated to long and
medium-haul routes. Two more 787s joined the fleet by the end of 2016 and a last
one is due to arrive in 2018.
RJ joined the oneworld airline alliance in 2007. Membership of this prestigious
alliance of 13 international carriers avail passengers the ability to fly between
Amman and more than 1,000 cities in 150 countries. In addition to having access
to a large number of destinations, this membership keeps the airlines motivated to
maintain a high standard of quality in line with those of its peers.
The human resources are the airline's biggest asset; they have the highest level of
qualifications and expertise in their different areas.
Business plan 2015-2019
Royal Jordanian is in the process of acting out its business plan for 2015-2019,
which was based on five pillars.
6 Source: RJ History, Royal Jordanian website, www.rj.com
21 | P a g e
1. Route network and fleet: The airline decided to terminate 8 destinations due
to low demand and unfavorable feasibility, while it has also suspended
operations to 8 other cities for security reasons. Along with this this
decision, the airline also expanded its high capacity fleet by adding Boeing
787s to service its more popular medium and long haul routes.
2. Boosting local market share: the company started growing by directly
increasing the number of passengers to and from Jordan by increasing transit
traffic.
3. Revenue management: focusing on ancillary revenues in order to boost
revenue performance.
4. Fuel efficiency: the company is implementing fuel saving initiatives which
include revamping procedures to reduce fuel burn. It also is investing in
newer engines which are more fuel efficient. There is also a focus on fuel
procurement to reduce costs.
5. Aircraft ownership: in expanding its aircraft fleet, the company is
determining the optimal capital structure and funding options to reduce the
cost of ownership.
22 | P a g e
SWOT Analysis
Strengths Weaknesses
Dominant market position in
Jordan
Member of oneworld airline
alliance
Operating out of one of the
newest and most advance
airports in the region
Large aircraft fleet compared to
other carriers in the region
Seasoned professionals with vast
industry experience
Large geographical coverage
Does not offer most updated
entertainment and connectivity
options
Aircraft fleet needs upgrading
Cabin below traveler
expectations
Unavailability of luxury class
especially for long haul flights
Behave like a low cost carrier on
short haul flights
Opportunities Threats
Improving returns as financing
options and cost reduction /
revenue diversification plans are
implemented
The growth in individual
incomes, thus increasing the
amount of disposable income on
a global level
Growth in global tourism
Jordanian government is actively
promoting the country as a world
destination for historical
artifacts, nature, culture, and
medical treatment
Ever increasing population
Air travel is considered a safe
and fast way to travel
Technological advancements in
aircraft design
Low cost airlines gaining market
share through enhanced business
models, services, and routes
Fluctuating fuel prices
Political instability
Competing airlines gaining
regional and international
dominance

23 | P a g e
PESTLE Analysis
This analysis is conducted on the airline industry as a whole, and not limited to
Royal Jordanian Airlines or the general business environment in Jordan. The
reason for this is the fact that a great deal of international regulations dictate the
way in which airlines operate, in addition to the fact that airlines have to also abide
by the regulations of the destinations they visit outside their home country. As
such, the environmental restrictions in Europe, for example, will have to apply to
any airline flying to Europe regardless of the airlines’ nationality or the flights
origin.
Political The political arena shifts travel from unstable regions to
flourishing, safe, and stable areas.
International sanctions restrict travel to certain countries.
Opportunity for new routes developing to pick up the slack of
currently less travelled destinations.
Economic Fuel prices are a large factor affecting the feasibility of flight
routes.
Interest rates which eat into profits and are directly linked to
investments in the industry.
Social The increasing population size is an opportunity.
Demographic shifts in the population are advantageous to the
airline industry.
Naturally growing target market ahead of other indicators.
Technological Continuous technological advancements in the industry is a
great opportunity.
May be burdensome and expensive to keep up with the
technological changes.
Legal Increased regulations governing all aspects of the airline
business serving as both opportunity and threat.
Environmental Pressure being placed on airplane manufacturers and operators
to minimize the negative impact on the environment through
reducing fuel consumption.
Can be financially difficult to manage the requisite upgrades.

24 | P a g e
Financial Projections
A set of financial projections were prepared for the airline to arrive at proforma
financial statements for the 2017-2019 period as shown in Appendix A. A simple
projection method was followed (not statistical or regression based) because of the
non-constant nature of the historical financials in addition to the information
available on the Company’s business plan. The projections were made based on
simple historical averages, growth rates, and other financial indicators, which were
later subject to a sanity check.
Ratio Analysis
Put simply, financial ratio analysis is a quantitative method by which financial
indicators are mathematically manipulated to yield percentages or multiples to
enable the analyst to compare companies in the same or different industries. This
analysis method does not deal with absolutes, rather takes size out of the equation
and compares the effectiveness of a company in doing it business by putting them
against an industry or market standard.
There are dozens of ratios in common use today, and each industry has developed
some more of its own over time. For our purposes, we will consider a few that we
believe are strong indicators of the company’s state.
As the Company is historically fluctuating between profit and loss (with more
loss), it would not be of great use to measure profitability or performance ratios.
Instead, we will focus on working capital and asset management indicators.
Unless otherwise stated, the ratios have been calculated from the company’s 2016
audited financials.
Liquidity Ratios
The following Current and Quick ratios belong to a class of financial metrics used
to determine the Company’s ability to settle its liabilities without resorting to
external funding or financing sources.
Current Ratio
The Current Ratio serves as a measure of a company’s liquidity. It measures the
ability of a company to meet or fund its short term obligations through its short
term assets.

25 | P a g e
The Current ratio for RJAL was 1.01 which is significantly less than the ideal
value of 2.0 as shown graphically below. In the absence of any major change in
policies or business plan, to which there is no indication, the ratio is expected to
remain the same for the projection period at the level of 1.01.
Figure 12: Source: RJAL Financial Information, Amman Stock Exchange, Author
projections
Quick Ratio
The Quick or Acid-Test Ratio is a measure of how effectively a company can meet
its short term obligations as financed through its short term assets. The difference
between this ratio and the Current Ratio is that only the Current Assets that can be
converted easily to cash are considered; in accordance to the following formula:
RJAL’s Quick Ratio was 0.81, which is less than the ideal value of 1. However, the
industry average is around 0.4 as shown below and as such, RJAL is outperforming
the industry in this metric. As indicated above, the ratio is expected to be
maintained at the 0.81 level throughout the projection period.
-
0.50
1.00
1.50
2.00
2.50
2013 2014 2015 2016 2017 2018 2019
Current Ratio
RJAL Current ratio Ideal value

26 | P a g e
Figure 13: Source: RJAL Financial Information, Amman Stock Exchange,
CSIMarket.com, Author projections
Asset Management Ratios
The metrics in this financial analysis category attempt to determine the
effectiveness of a company to utilize its assets to generate revenue.
Asset Turnover Ratio
This ratio is a measure of the utilization of a company’s assets in producing
turnover, and is calculated as follows:
Figure 14: Source: RJAL Financial Information, Amman Stock Exchange, Author
projections
-
0.20
0.40
0.60
0.80
1.00
1.20
2013 2014 2015 2016 2017 2018 2019
Quick Ratio
Quick ratio Ideal value Industry average
-
0.50
1.00
1.50
2.00
2.50
2013 2014 2015 2016 2017 2018 2019
Asset Turnover Ratio
Asset turnover Ideal value
27 | P a g e
As seen in the graph above, the company is significantly under utilizing its assets,
and based on its revenue growth assumptions, is expected to stay well below the
ideal ratio throughout the forecast period, at 0.99, 1.02, 1.05 for 2017, 2018, and
2019 repectively. The carrier is should pay special attention to this metric as it is
key in turning the business around.
Tabulated Select Ratios
The table below shows some common ratios calculated for historical as well as
forecast data:
Figure 15: Source: RJAL Financial Information, Amman Stock Exchange, Author
projections
Conclusion: Beyond the Numbers
It is clear from the financial results of the Company that there are significant issues
with the profitability of the operation. However, there are a few things that we can
see from the above ratio analysis that sheds some light on what could be driving
the situation and what things the airline is doing right.
For example, the Quick Ratio indicates better than industry cash management of
the company even though the ratio is low. As shown in the table above, all ratios
that deal with returns are negative and that is because the Net Income is almost
always negative.
The Company’s fleet is underutilized and requires a further study of the outcome
of the business plan set into motion by the management team a few years ago.
Asset utilization is key indicator of the carrier’s performance and management
2013 2014 2015 2016 2017F 2018F 2019F
Liquidity Ratios
Current ratio 0.67 0.50 0.58 1.01 1.01 1.01 1.01
Quick ratio 0.52 0.37 0.29 0.81 0.81 0.81 0.81
Profitability Ratios
Gross profit margin 0.04 0.06 0.15 0.12 0.12 0.12 0.12
Profit margin on sales (0.05) (0.05) 0.02 (0.04) (0.01) (0.02) (0.02)
Return on assets (0.09) (0.11) 0.04 (0.04) (0.01) (0.02) (0.02)
Return on equity (2.00) 2.48 0.32 (0.33) (0.10) (0.16) (0.26)
Asset Management Ratios
Days sales outstanding 19.36 22.75 20.31 20.28 20.28 20.28 20.28
Accounts receivable turnover 18.85 16.05 17.97 18.00 18.00 18.00 18.00
Inventory turnover 54.95 55.85 48.73 47.93 12.35 18.83 47.33
Days inventory 6.64 6.54 7.49 7.61 29.56 19.38 7.71
Asset turnover 1.81 2.03 1.47 1.05 0.99 1.02 1.05
Leverage Ratios
Debt ratio 0.95 1.04 0.89 0.87 0.89 0.90 0.92
Times interest earned (4.80) (4.52) 3.35 (0.68) 0.45 0.31 0.17

28 | P a g e
decisions. Before examining the rest of the business, profitably increasing the
utilization of the aircraft fleet is, in my opinion, the first priority.
Beyond that, it is also clear that operating expenses are also high and the cost of
financing the Company’s debt is adding to the losses. As the carrier improves its
financial performance, it may be in a better position to further improve its bottom
line by improving its bargaining power.
The figures shown in the table above show a problem in the Company’s capital
structure and operating effectiveness. This especially apparent when considering
that the airline is over 50 years old. This is a further indication of the immediate
need to revamp the business to be able to utilize assets effectively, reduce the
overall debt level to more manageable levels, and create a situation where the
Company is paying money out to its shareholders as opposed to its debtors.

29 | P a g e
Company Valuation
There are numerous methods to value a company. Some valuation methods use
expected cash flows to the firm, dividend growth models, profitability multiples, or
market comparables.
To evaluate the Company, a cash flow valuation was used because the Company
does not have a dividend history, nor is it profitable, and companies in this industry
and region are typically state owned which makes access to data that much more
difficult, and even if available, it would be compromised with government
subsidies on all operating levels.
WACC
In starting the valuation process, the Weighted Average Cost of Capital must be
determined, this is essentially an indication of the Company’s cost of funds in
accordance to their proportion and cost of funding:
The Cost of Equity is determined using the Capital Asset Pricing Model:
Where:
Term Definition Value
Risk Free Rate The rate of the 6-month treasury bill in Jordan 2.08%
β The Beta Coefficient is the measure of a stock’s
return when compared to the overall market
return over the same time period while
considering the same frequency of data
-0.84
Market Return The average return on periodic market
performance
0.046

30 | P a g e
By applying the above equation, the Cost of Equity is 3.78%. While this is
considered low, it will be used a base value and its effects will be taken into
consideration in further analysis.
The cost of debt is calculated from the financial statements and works out to 8.2%
in accordance to this formula:
To arrive at the weights of debt and equity, we assume that the book value and
market value of equity are the same, and we use the interest-bearing liabilities
described in the formula above to determine the proportion of each to total funding
for the company. We calculate equity and debt weights of 30% and 70%
respectively.
The corporate tax rate used for the projection period is 20%7, while the other tax
items are based on actuals from the Company’s financial statements.
Now, and by plugging in all the numbers in the WACC formula, we end up with
5.7% as the Weighted Average Cost of Capital. Again, while this number appears
low, we will use it as a base and subject it to sensitivity analysis.
The derived numbers above were not what we typically expected from the
Company’s shares, however, the Jordanian stock market (Amman Stock Exchange)
is not a particularly large market nor is it the most efficient. Also, the fact that the
global economy has been less than stable in recent years, we expect to see some
anomalies in stock market and rate behavior.
Free Cash Flow Forecast
7 Source: Income Tax Rules and Regulations Article 34, 2014, Jordan Ministry of Finance – Income and Sales Tax Department, www.istd.gov.jo

31 | P a g e
The figure above shows the buildup of the Free Cash Flow model in order to arrive
at the Company valuation as shown below:
WACC 5.74%
Cash Flow Constant Growth Rate 7.42%
Value of operations at the end of 2016 238,302
Add: Value of Non Operating Assets 0
Total Corporate Value 238,302
Less: Interest Bearing Debt 178,375
Intrinsic Value of Firm's Equity 59,927
Number of Shares Outstanding 146,405
Intrinsic Value Per Share 0.41
From a pure fundamental financial analysis point of view, an investment decision
would indicate a “hold” on the share of the company since it is relatively close to
its spot market price. Since there is an element of inherent risk in any investment
decision making process and based on speculations that the Company’s
management will make the necessary restructuring required to turn the airline
around.
Potential Value Upside
JOD 000s 2013 2014 2015 2016 2017F 2018F 2019F
EBIT (40,175) (40,528) 29,976 (9,870) 7,156 5,270 3,166
Tax rate 20% 20% 24% 0% 20% 20% 20%
Net Operating Profit After Tax (32,164) (32,459) 22,857 (9,902) 5,725 4,216 2,533
Accrued Expenses 68,799 80,567 68,418 70,232 63,935 65,342 66,779
Change in Net Working Capital 49,834 4,548 (86,628) 116,625 119,277 121,990 124,766
Total change in NWC (18,965) (76,019) (155,046) 46,393 55,342 56,648 57,987
Net Fixed Assets 173,166 141,425 122,689 226,520 231,503 236,597 241,802
Total Operating Capital 154,201 65,406 (32,357) 272,913 286,845 293,245 299,788
NOPAT (32,459) 22,857 (9,902) 5,725 4,216 2,533
Net Operating Capital (88,795) (97,763) 305,270 13,932 6,400 6,543
FCF 56,336 120,620 (315,172) (8,207) (2,183) (4,011)

32 | P a g e
The valuation of the Company, which is directly linked to its ability to turn itself
around and sustain stable growth, has a speculation portion attached to it. As the
national carrier of the Hashemite Kingdom of Jordan, and one of the major
employers in the country, there is an element of comfort in the continuing support
the Company will receive to maintain running operations.
As such, and based on the above, we would upgrade my valuation of the share of
RJAL to “buy” because of the large upside potential, the fruition of which is
inevitable.

33 | P a g e
Appendix A: Historical and Proforma Financial Statements
Income Statement
Balance Sheet
Income Statement (JD 000s) 2013 2014 2015 2016 2017F 2018F 2019F
Operating Revenues 759,940 757,415 658,055 598,271 611,433 624,884 638,632
Operating Expenses 726,732 715,282 559,146 527,668 538,500 549,545 560,806
Gross Profit 33,208 42,133 98,909 70,603 72,933 75,340 77,826
General and Administrative Expenses 20,756 21,852 21,119 20,590 21,299 22,032 22,790
Selling and Distribution Expenses 47,060 49,584 46,881 45,045 48,437 52,083 56,005
Depreciation (period) 29,982 34,843 28,375 25,975 28,945 32,254 35,942
Net Operating Income (34,608) (29,303) 30,909 4,968 3,198 1,225 (969)
Other Revenues 4,441 9,081 5,444 9,671 9,884 10,101 10,323
Other Expenses 10,008 20,306 6,377 24,509 5,925 6,056 6,189
Income Before Interest & Tax (40,175) (40,528) 29,976 (9,870) 7,156 5,270 3,166
Interest Expenses 8,362 8,964 8,949 14,621 15,793 17,058 18,425
Net Income before Tax (48,537) (49,492) 21,027 (24,491) (8,636) (11,788) (15,260)
Income Tax (Period) (9,679) (9,854) 4,994 80 (1,727) (2,358) (3,052)
Net Income (38,858) (39,638) 16,033 (24,571) (6,909) (9,430) (12,208)
Balance Sheet (JD 000s) 2013 2014 2015 2016 2017F 2018F 2019F
Assets
Cash on Hand & at Banks 97,338 67,826 71,985 141,974 145,097 148,290 151,552
Account Receivables, Net 40,316 47,203 36,620 33,233 33,964 34,711 35,475
Short Term Investments 2,636 6 0 0 0 0 0
Adjustment Account 0 0 0 0 32,379 17,716 150
Spare Parts 13,226 12,808 11,474 11,008 11,234 11,464 11,699
Total Current Assets 179,963 156,864 216,983 219,030 223,849 228,773 233,806
Long Term Investments 17,881 22,509 22,869 23,474 23,990 24,518 25,058
Fixed Assets, Net 173,166 141,425 122,689 226,520 231,503 236,597 241,802
Projects in Progress 333 200 256 674 0 0 0
Total Fixed Assets 173,499 141,625 122,945 227,194 231,503 236,597 241,802
Other Assets 48,228 52,897 85,349 101,118 103,343 105,616 107,940
Total Assets 419,571 373,895 448,146 570,816 615,064 613,221 608,755
Liabilities & Owners Equity
Liabilities
Accounts and Notes Payable 101,046 123,289 206,707 69,590 71,019 72,475 73,960
Credit Banks 13,854 17,799 17,896 0 0 0 0
Accrued Part of Long Term Loans 48,156 47,425 46,233 35,067 32,401 29,937 27,661
Total Current Liabilities 269,002 312,588 375,298 216,897 221,350 225,889 230,518
Long Term Loans & Notes Payable 105,671 58,931 12,672 143,308 187,261 187,261 187,261
Corporate Bonds 0 0 0 0 0 0 0
Other Liabilities 25,332 18,211 10,468 135,500 138,481 141,528 144,641
Total Liabilities 400,005 389,730 398,438 495,705 547,092 554,678 562,421
Shareholders Equity
Authorized Capital 84,373 84,373 46,405 146,405 146,405 146,405 146,405
Subscribed Capital 84,373 84,373 46,405 146,405 146,405 146,405 146,405
Paid-in Capital 84,373 84,373 46,405 146,405 146,405 146,405 146,405
Compulsory Reserves 11,380 11,380 13,455 13,455 13,455 13,455 13,455
Other Reserves (1,000) (534) 50,154 0 0 0 0
Accumulated Change in Fair Value 0 3,771 3,593 3,771 3,771 3,771 3,771
Retained Earnings (75,294) (114,995) (64,094) (88,749) (95,658) (105,089) (117,296)
Total Shareholders Equity 19,459 (16,005) 49,513 74,882 67,973 58,542 46,335
Non-controlling Interest 107 170 195 229 208 179 142
Total Liabilities & Shareholders Equity 419,571 373,895 448,146 570,816 615,064 613,221 608,755

34 | P a g e
Appendix B: Share Value Sensitivity Analysis
By subjecting the price per share valuation to a series of sensitivities, we get the
following values:
As can be seen from the table above, the valuation of the share price of the airline
varies significantly with even the slightest change in WACC or growth rate
assumptions. The fact of the matter is that valuing a company with negative
earnings can be very tricky. There are the fundamental financial forces at play,
which include the expected progression of financial indicators and the relative
change of these indicators with respect to each other.
Cash Flow Growth Rate
0.41 6.62% 7.02% 7.42% 7.82% 8.22%
4.24% -0.07 -0.23 -0.36 -0.45 -0.53
4.99% 0.46 0.13 -0.09 -0.25 -0.37
5.74% 1.89 0.92 0.41 0.10 -0.11
6.49% 19.85 3.95 1.73 0.84 0.37
7.24% -5.64 -13.67 14.00 3.50 1.58
WA
CC

35 | P a g e
Appendix C: Company Information
Code: 131213
Symbol: RJAL
Address: 125 Amman - Shmesani
Telephone: 5202000
P.O. Box: 302 Amman 11118
Email: [email protected]
Fax: 5686210
Established Date : 05-02-01
Listing Date: 17-12-07
No. of Branches: Local 0 - Abroad 0
Main Objectives: Opreating secheduled, unscheduled
and chartered flights for passengers
mail and cargo inside Jordan and
abroad in addition to providing
handling services for aircraft
General Manager: Stefan Pichler
No. of Employees
Male Female Total
Jordanian 3133 786 3919
Non
Jordanian 150 250 400
Total 3283 1036 4319
Figure 16: Source: RJAL Company Information, Amman Stock Exchange

36 | P a g e
Appendix D: References
1. Air Transportation – Statistics & Facts, Statista,
https://www.statista.com/topics/1707/air-transportation/
2. Airbus Global Market Forecast 2017-2036, 2017, Airbus,
https://www.airbus.com/aircraft/market/global-market-forecast.html
3. Company Information, Amman Stock Exchange,
https://www.ase.com.jo/ar/company_guide/information/RJAL
4. Economic Performance of the Airline Industry, 2018, IATA,
http://www.iata.org/economics
5. Income Tax Rules and Regulations Article 34, 2014, Jordan Ministry of
Finance – Income and Sales Tax Department,
http://www.istd.gov.jo/Arabic/Legislations/Laws.aspx
6. RJ History, Royal Jordanian, https://www.rj.com/en/meet-rj/our-
standards/profile
7. RJAL Financial Information, Amman Stock Exchange,
https://www.ase.com.jo/ar/company_historical/RJAL