fleets first
TRANSCRIPT
Fleets firstHow accelerating fleet electrification can unlock the shift to clean road transportJuly 2021

About EV100:EV100 is a global initiative, led by the Climate Group, bringing together forward-looking companies committed to making EVs the new normal by 2030. Members publicly commit to at least one of the following by 2030:
• Electrifying owned/leased fleets (100% < 3.5t / 50% 3.5 – 7.5t)
• Installing charging at all relevant sites for staff and/or customers
• Requiring EVs in service contracts
Thankfully, despite the uncertainty and turmoil of the past year and half, the shift to zero emission vehicles (ZEVs) is certainly under way – it’s no longer a question of if, but when?
In just four years, our EV100 initiative has grown to include over 100 multinational companies committed to switch more than five million vehicles to electric by the end of the decade. We’re also seeing promising signs of movement from policymakers and industry, with increasing numbers of governments and automotive manufacturers announcing commitments to a 100% ZEV future.
Foreword
But while this progress is good, we’re now firmly in the Climate Decade and pockets of leadership are simply not enough. We need to do more, faster.
With this report, we’re reassured to see a way forward.
Our analysis finds that fleet vehicles could be instrumental in bringing about a wider shift to clean road transport and it’s possible for their electrification to happen on an accelerated timeframe. Perhaps even more encouraging is the extensive impact this would have on our climate, health and infrastructure, as well as reducing the costs of clean technology.
So, no more excuses. Businesses, governments, and public sector organisations have the responsibility and the ability to drive us to a better future by flipping their fleets to electric; industry has a serious business opportunity to meet this inevitable demand; investors have the capital and policymakers have the enabling power to make this all happen.
With the upcoming UN climate change negotiations, COP26 in November, we have a chance to build momentum and deliver a real breakthrough in clean road transport. It’s time to step on it.
Helen Clarkson, Chief Executive Officer, Climate Group
The science is clear, we need to halve emissions by 2030. So for road transport, it’s surely simple: get rid of the internal combustion engine.
Reaching net zero by the middle of the century requires a step change across all sectors. And switching to electric vehicles is a crucial part ‑of the action we need to take to hit this goal and keep the target of limiting global temperature rise by 1.5C alive.
I am encouraged by research such as this which shows that change is within reach. We must all work together ahead of COP26, and beyond, if we are to secure a greener future.
Alok Sharma, COP26 President-Designate
Foreword 3Fleets first: How accelerating fleet electrification can unlock the shift to clean road transport2
24 Constraining factors
28 The impact of faster fleet electrification
31 Direct impacts
33 System benefits
42 Making it happen
46 Glossary
48 Acknowledgments
06 Executive summary
10 Methodology
14 The EV landscape
16 Our accelerated scenario
Contents
Fleets first: How accelerating fleet electrification can unlock the shift to clean road transport Contents4 5
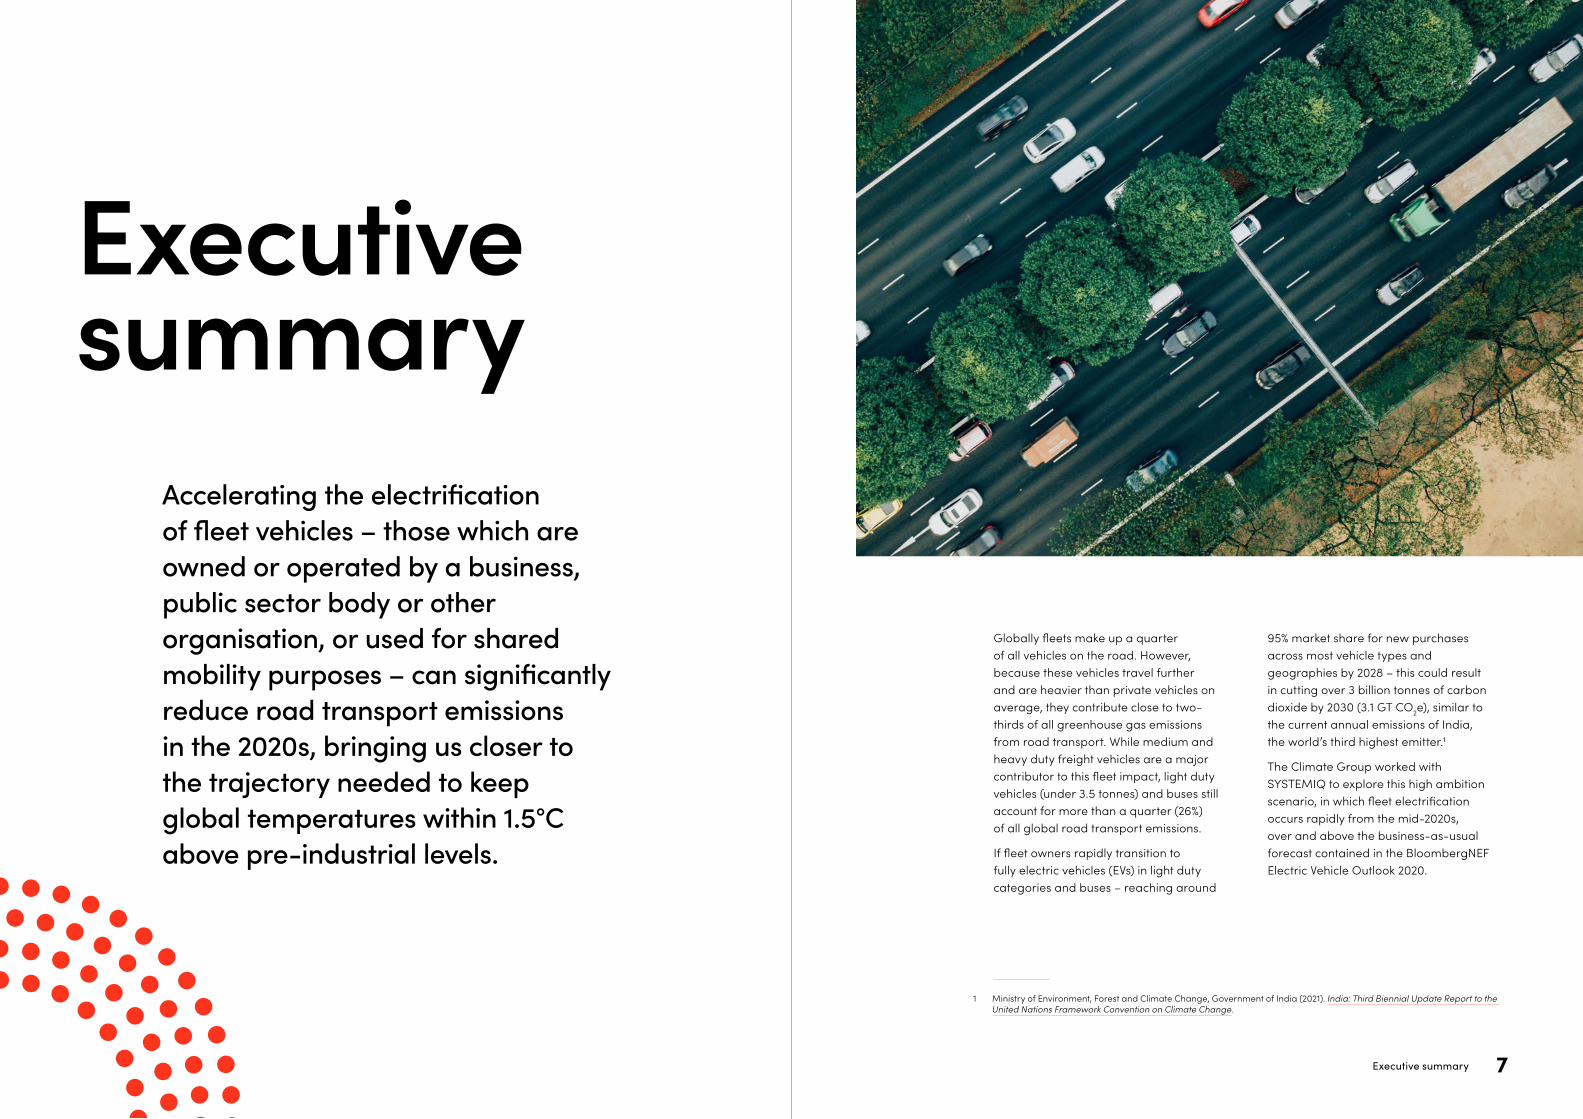
Globally fleets make up a quarter of all vehicles on the road. However, because these vehicles travel further and are heavier than private vehicles on average, they contribute close to two-thirds of all greenhouse gas emissions from road transport. While medium and heavy duty freight vehicles are a major contributor to this fleet impact, light duty vehicles (under 3.5 tonnes) and buses still account for more than a quarter (26%) of all global road transport emissions.
If fleet owners rapidly transition to fully electric vehicles (EVs) in light duty categories and buses – reaching around
1 Ministry of Environment, Forest and Climate Change, Government of India (2021). India: Third Biennial Update Report to the United Nations Framework Convention on Climate Change.
95% market share for new purchases across most vehicle types and geographies by 2028 – this could result in cutting over 3 billion tonnes of carbon dioxide by 2030 (3.1 GT CO2e), similar to the current annual emissions of India, the world’s third highest emitter.1
The Climate Group worked with SYSTEMIQ to explore this high ambition scenario, in which fleet electrification occurs rapidly from the mid-2020s, over and above the business-as-usual forecast contained in the BloombergNEF Electric Vehicle Outlook 2020.
Accelerating the electrification of fleet vehicles – those which are owned or operated by a business, public sector body or other organisation, or used for shared mobility purposes – can significantly reduce road transport emissions in the 2020s, bringing us closer to the trajectory needed to keep global temperatures within 1.5°C above pre‑industrial levels.
Executivesummary
Executive summary 76
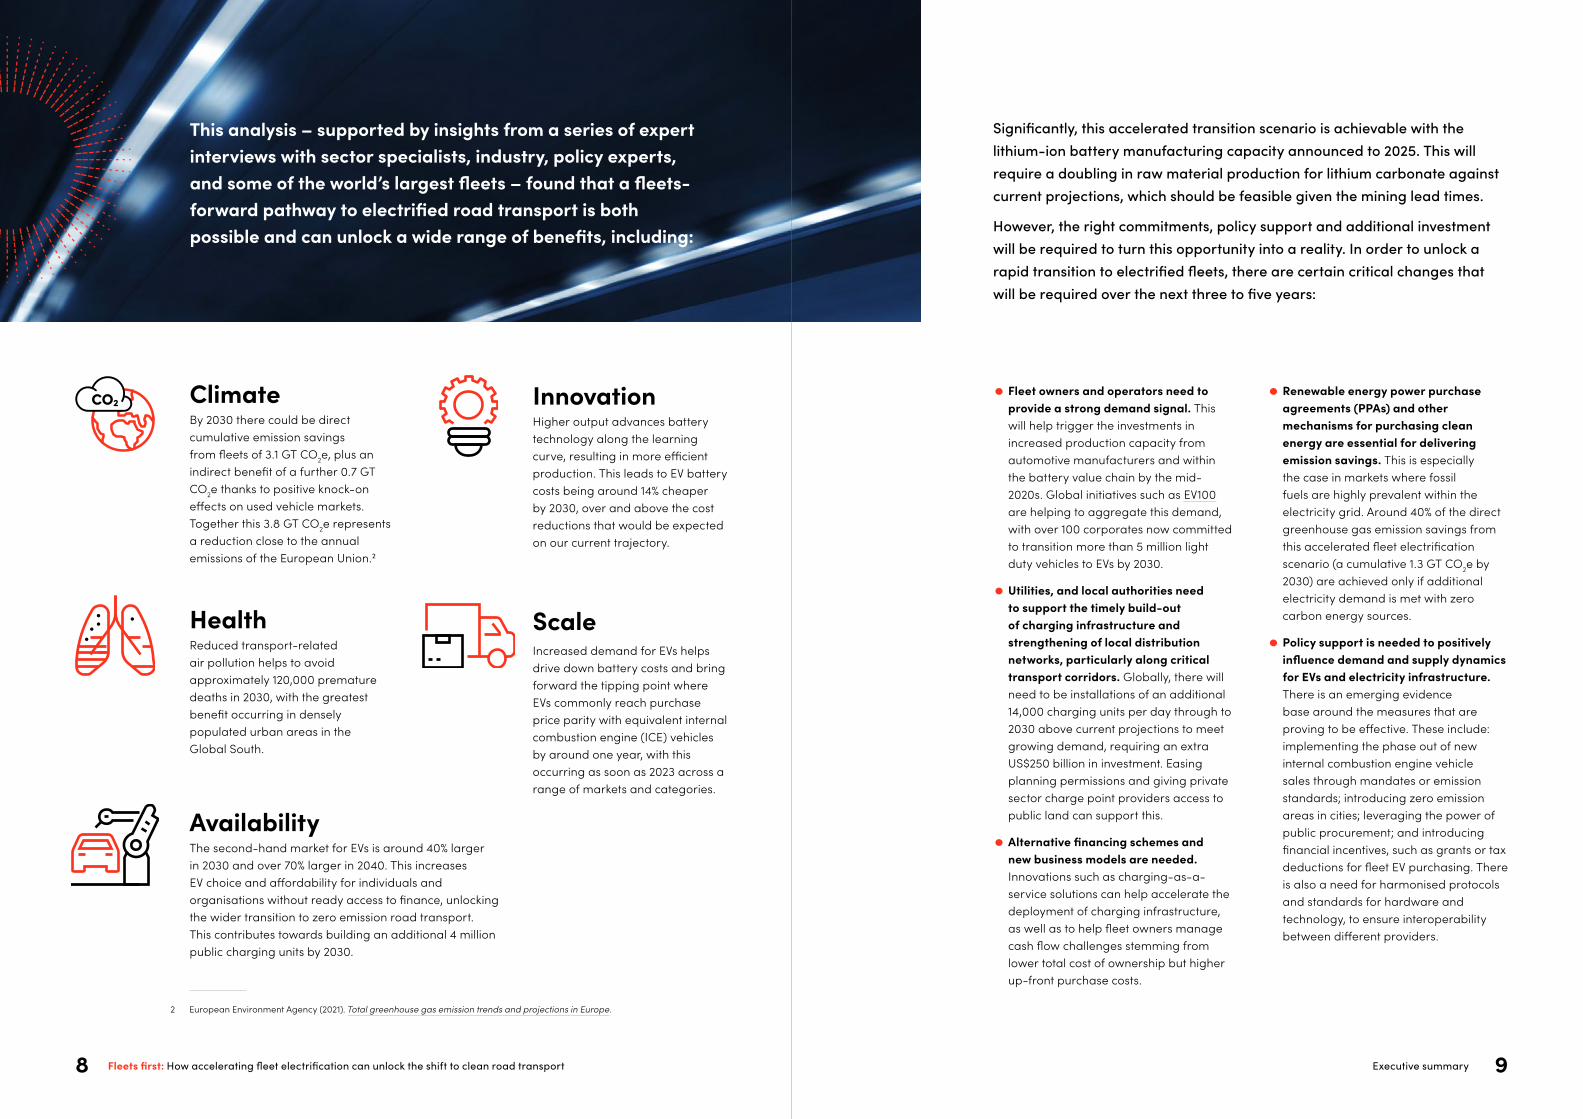
Significantly, this accelerated transition scenario is achievable with the lithium‑ion battery manufacturing capacity announced to 2025. This will require a doubling in raw material production for lithium carbonate against current projections, which should be feasible given the mining lead times.
However, the right commitments, policy support and additional investment will be required to turn this opportunity into a reality. In order to unlock a rapid transition to electrified fleets, there are certain critical changes that will be required over the next three to five years:
• Fleet owners and operators need to provide a strong demand signal. This will help trigger the investments in increased production capacity from automotive manufacturers and within the battery value chain by the mid-2020s. Global initiatives such as EV100 are helping to aggregate this demand, with over 100 corporates now committed to transition more than 5 million light duty vehicles to EVs by 2030.
• Utilities, and local authorities need to support the timely build-out of charging infrastructure and strengthening of local distribution networks, particularly along critical transport corridors. Globally, there will need to be installations of an additional 14,000 charging units per day through to 2030 above current projections to meet growing demand, requiring an extra US$250 billion in investment. Easing planning permissions and giving private sector charge point providers access to public land can support this.
• Alternative financing schemes and new business models are needed. Innovations such as charging-as-a-service solutions can help accelerate the deployment of charging infrastructure, as well as to help fleet owners manage cash flow challenges stemming from lower total cost of ownership but higher up-front purchase costs.
• Renewable energy power purchase agreements (PPAs) and other mechanisms for purchasing clean energy are essential for delivering emission savings. This is especially the case in markets where fossil fuels are highly prevalent within the electricity grid. Around 40% of the direct greenhouse gas emission savings from this accelerated fleet electrification scenario (a cumulative 1.3 GT CO2e by 2030) are achieved only if additional electricity demand is met with zero carbon energy sources.
• Policy support is needed to positively influence demand and supply dynamics for EVs and electricity infrastructure. There is an emerging evidence base around the measures that are proving to be effective. These include: implementing the phase out of new internal combustion engine vehicle sales through mandates or emission standards; introducing zero emission areas in cities; leveraging the power of public procurement; and introducing financial incentives, such as grants or tax deductions for fleet EV purchasing. There is also a need for harmonised protocols and standards for hardware and technology, to ensure interoperability between different providers.
2 European Environment Agency (2021). Total greenhouse gas emission trends and projections in Europe.
This analysis – supported by insights from a series of expert interviews with sector specialists, industry, policy experts, and some of the world’s largest fleets – found that a fleets-forward pathway to electrified road transport is both possible and can unlock a wide range of benefits, including:
Innovation Higher output advances battery technology along the learning curve, resulting in more efficient production. This leads to EV battery costs being around 14% cheaper by 2030, over and above the cost reductions that would be expected on our current trajectory.
ScaleIncreased demand for EVs helps drive down battery costs and bring forward the tipping point where EVs commonly reach purchase price parity with equivalent internal combustion engine (ICE) vehicles by around one year, with this occurring as soon as 2023 across a range of markets and categories.
AvailabilityThe second-hand market for EVs is around 40% larger in 2030 and over 70% larger in 2040. This increases EV choice and affordability for individuals and organisations without ready access to finance, unlocking the wider transition to zero emission road transport. This contributes towards building an additional 4 million public charging units by 2030.
HealthReduced transport-related air pollution helps to avoid approximately 120,000 premature deaths in 2030, with the greatest benefit occurring in densely populated urban areas in the Global South.
ClimateBy 2030 there could be direct cumulative emission savings from fleets of 3.1 GT CO2e, plus an indirect benefit of a further 0.7 GT CO2e thanks to positive knock-on effects on used vehicle markets. Together this 3.8 GT CO2e represents a reduction close to the annual emissions of the European Union.2
Fleets first: How accelerating fleet electrification can unlock the shift to clean road transport Executive summary8 9
To reach net zero emissions in road transport, we need vehicles that do not produce any tailpipe CO2 emissions.
The underlying model is built on top of the more ambitious of the two scenarios in the BloombergNEF Electric Vehicle Outlook 2020, referred to as the EVO 2020 Trajectory Scenario, which also provides the reference point as a baseline scenario. This contains existing and projected data on vehicle stock, new vehicle sales (EV and ICE), emissions calculation, EV value chain analysis, energy demand and supply, as well as charging infrastructure.
We have compared this baseline with our accelerated scenario to identify the benefits of a concerted push on EV manufacturing, fleet purchasing, innovation, and infrastructure build out. Our scenario was built around an S-curve model to illustrate what a plausible high ambition fleet transition to EVs could look like.
To refine this model and test assumptions, a range of sources were consulted and SYSTEMIQ conducted a series of in-depth interviews with subject matter experts from industry and academia, as well as major fleet owners and operators from around the world.
The analysis splits fleet vehicles into the following vehicle types: light commercial vehicles (<3.5 tonnes); buses; shared two-wheelers; shared passenger cars; and
This report sets out a scenario to understand the impact of accelerating the electrification of light duty fleet vehicles (under 3.5 tonnes) and buses. These are defined as vehicles that are either registered under or managed by an organisation, or both. The analysis was conducted by SYSTEMIQ between March and May 2021.
corporate-owned passenger vehicles. The classification of shared two-wheelers and passenger cars includes digital ride-hailing, taxis, autonomous vehicles, on-demand delivery vehicles, and other similar shared mobility models.
Medium and heavy duty commercial vehicles were excluded from this analysis, as they face different challenges to electrify within the time frames explored and have different use cases. While there is significant potential for a similar accelerated transition of fleets to zero emission vehicles in these categories, over a different timeframe, exploring this was outside the scope of this study.
The scenario divides the world into eight separate geographies: China, Europe, US, India, South Korea, Japan, Australia, and Rest of World. Depending on their current market conditions, these were then divided into Leader and Follower classifications in different vehicle categories, which impacted the date of their acceleration starting point and speed of acceleration, influencing the shape S-Curve.
Our accelerated scenario assumes exponential growth of EV purchases, based on existing trends that point towards a tipping point in vehicle electrification in the
Methodology
mid-2020s. This includes: the approach of price parity with ICE vehicles due to battery price declines; an increasing range of EV models becoming available; the development of retrofit technology; and central and local government ICE
vehicle phase out policies, such as EV sales mandates, emission standards, or zero emission areas.
While the shape of the S-curve shows a more rapid transition than other studies, experience shows that experts have found it notoriously difficult to predict the non-linear change of technology adoption curves and forecast tipping points. Examples of this include the scale up of renewable energy capacity, through to adoption of the internet or mobile phones, which all far outstripped early expectations.
To put in place guardrails of plausibility, we have also stress-tested against potential constraining factors that could limit growth. These include the availability of raw materials for batteries, notably lithium carbonate, as well as installed battery manufacturing capacity.
Our accelerated scenario assumes exponential growth of EVs, based on existing trends that point towards a tipping point in fleet vehicle electrification in the mid-2020s.
Fleets first: How accelerating fleet electrification can unlock the shift to clean road transport Methodology10 11
3 Climate Group (2021). EV100: Progress and Insights Report 2021.
At present, the majority of EVs on the road are privately owned passenger vehicles, while just 11% are fleet vehicles. According to BNEF by 2040 the proportion of EVs that are fleet vehicles will rise, but only to 23% of the total.
The top barrier for businesses progressing with fleet electrification is a lack of charging infrastructure.3 Insufficient choice in fleet EVs is the next biggest issue, with many EV100 members identifying commercial vans (61%) as the most challenging EV vehicle type to procure.
The upfront cost of EVs, which are on average still more expensive than ICE vehicle alternatives for many vehicle types, can also be off-putting, though a range of new finance products are now helping
organisations to take advantage of the total cost of ownership benefits that can be achieved.
Buses and two and three-wheeled vehicles, however, seem to be making better progress with global electrification rates, at 16% and 20% respectively. Although much of this is due to government-led efforts in China, resulting in a near 65% electrification rate for these vehicle types in 2020 within the country.
Consequently, under the BNEF baseline prediction, only a a subset of fleet vehicle categories in certain more advanced geographies will have a greater than 50% share of EV sales by 2030.
We believe fleets can do a lot better than this.
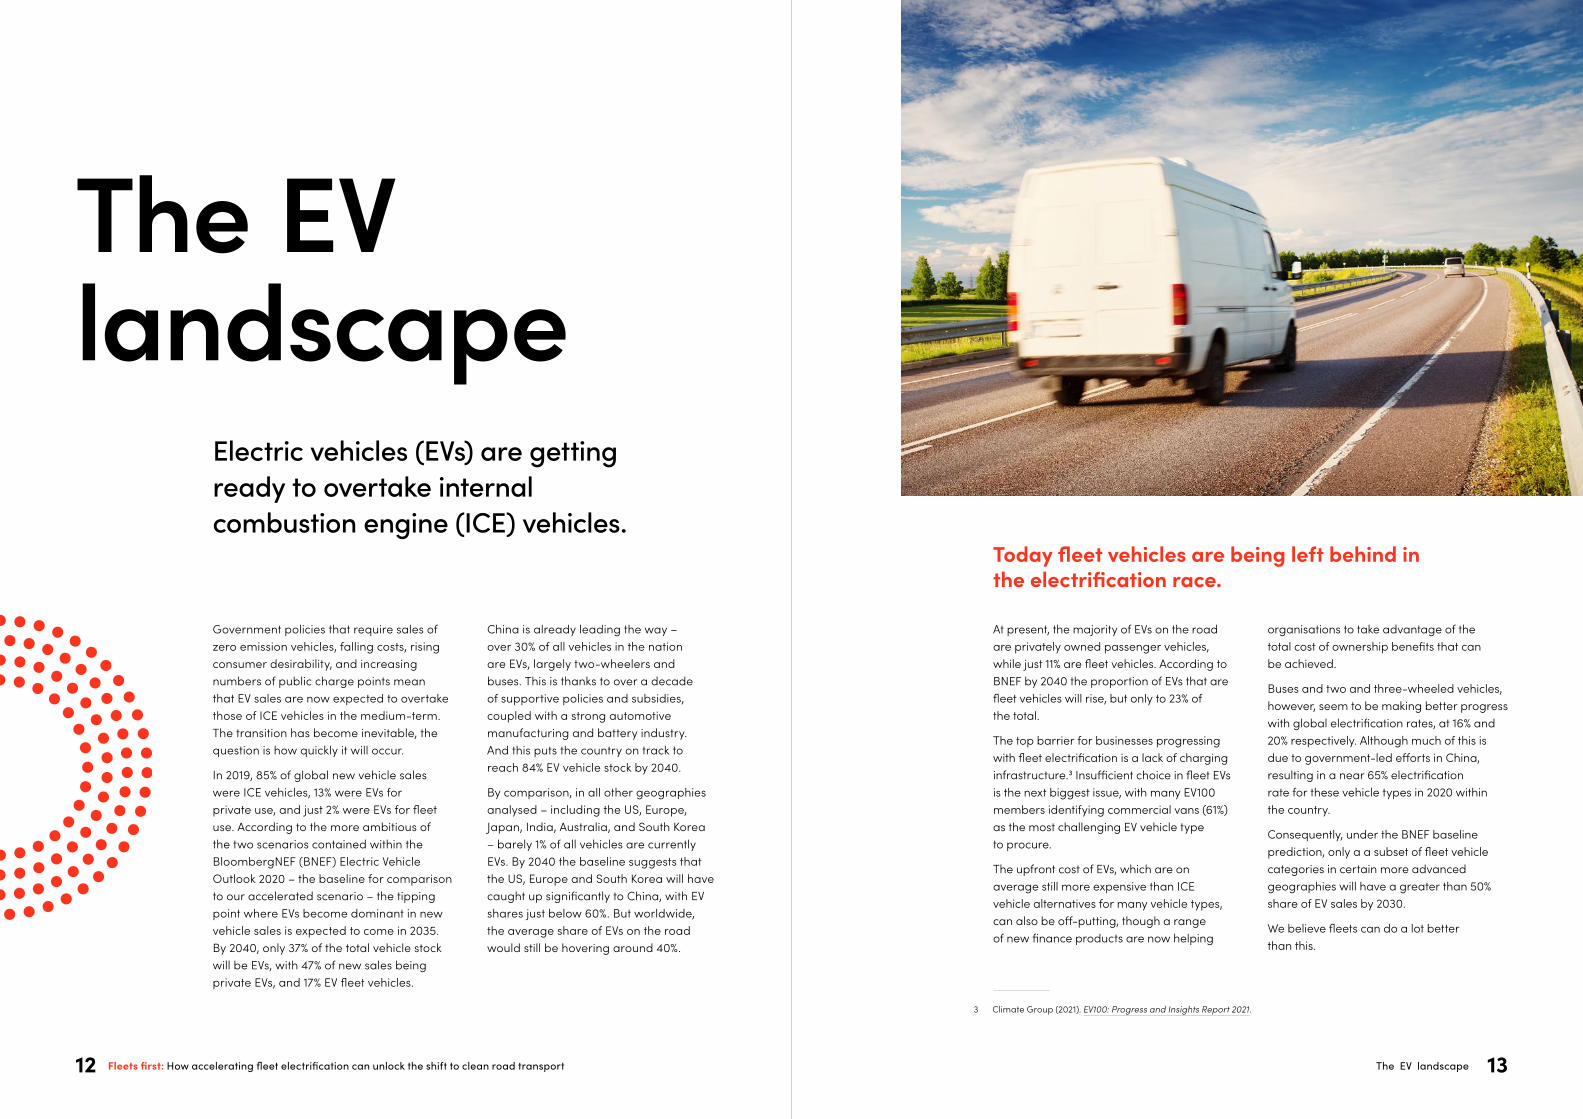
Today fleet vehicles are being left behind in the electrification race.
Government policies that require sales of zero emission vehicles, falling costs, rising consumer desirability, and increasing numbers of public charge points mean that EV sales are now expected to overtake those of ICE vehicles in the medium-term. The transition has become inevitable, the question is how quickly it will occur.
In 2019, 85% of global new vehicle sales were ICE vehicles, 13% were EVs for private use, and just 2% were EVs for fleet use. According to the more ambitious of the two scenarios contained within the BloombergNEF (BNEF) Electric Vehicle Outlook 2020 – the baseline for comparison to our accelerated scenario – the tipping point where EVs become dominant in new vehicle sales is expected to come in 2035. By 2040, only 37% of the total vehicle stock will be EVs, with 47% of new sales being private EVs, and 17% EV fleet vehicles.
The EV
Electric vehicles (EVs) are getting ready to overtake internal combustion engine (ICE) vehicles.
landscape
China is already leading the way – over 30% of all vehicles in the nation are EVs, largely two-wheelers and buses. This is thanks to over a decade of supportive policies and subsidies, coupled with a strong automotive manufacturing and battery industry. And this puts the country on track to reach 84% EV vehicle stock by 2040.
By comparison, in all other geographies analysed – including the US, Europe, Japan, India, Australia, and South Korea – barely 1% of all vehicles are currently EVs. By 2040 the baseline suggests that the US, Europe and South Korea will have caught up significantly to China, with EV shares just below 60%. But worldwide, the average share of EVs on the road would still be hovering around 40%.
Fleets first: How accelerating fleet electrification can unlock the shift to clean road transport The EV landscape12 13
Fuel cell electric vehicles (FCEVs) do offer a potential pathway to net zero emissions in road transport. But the technology cost reductions, infrastructure development, and industry support for this option lag significantly behind what is currently seen with battery electric vehicles. As such, FCEVs have not been incorporated into analysis in this report, as it is considered that they are unlikely to form a meaningful contribution within the light duty vehicle categories included within this accelerated scenario for fleet electrification. While it is possible that fuel cells may yet prove to be important in electrifying medium and heavy duty vehicles, that consideration is outside the scope of this report.
What about hydrogen? The role of fuel cell electric vehicles
To reach net zero emissions in road transport, we need vehicles that do not produce any tailpipe CO2 emissions. While there is a limited role for plug-in hybrid electric vehicles (PHEVs) in the transition to electric mobility, within the context of our accelerated scenario any references to “EVs” refer to vehicles solely powered by a battery electric powertrain. Hybrid vehicles that contain a battery electric powertrain alongside an internal combustion engine (ICE), and therefore produce tailpipe CO2 emissions, are categorised as “ICE vehicles”.
What about hybrids? Defining EVs and ICE vehicles
Fleets first: How accelerating fleet electrification can unlock the shift to clean road transport The EV landscape14 15
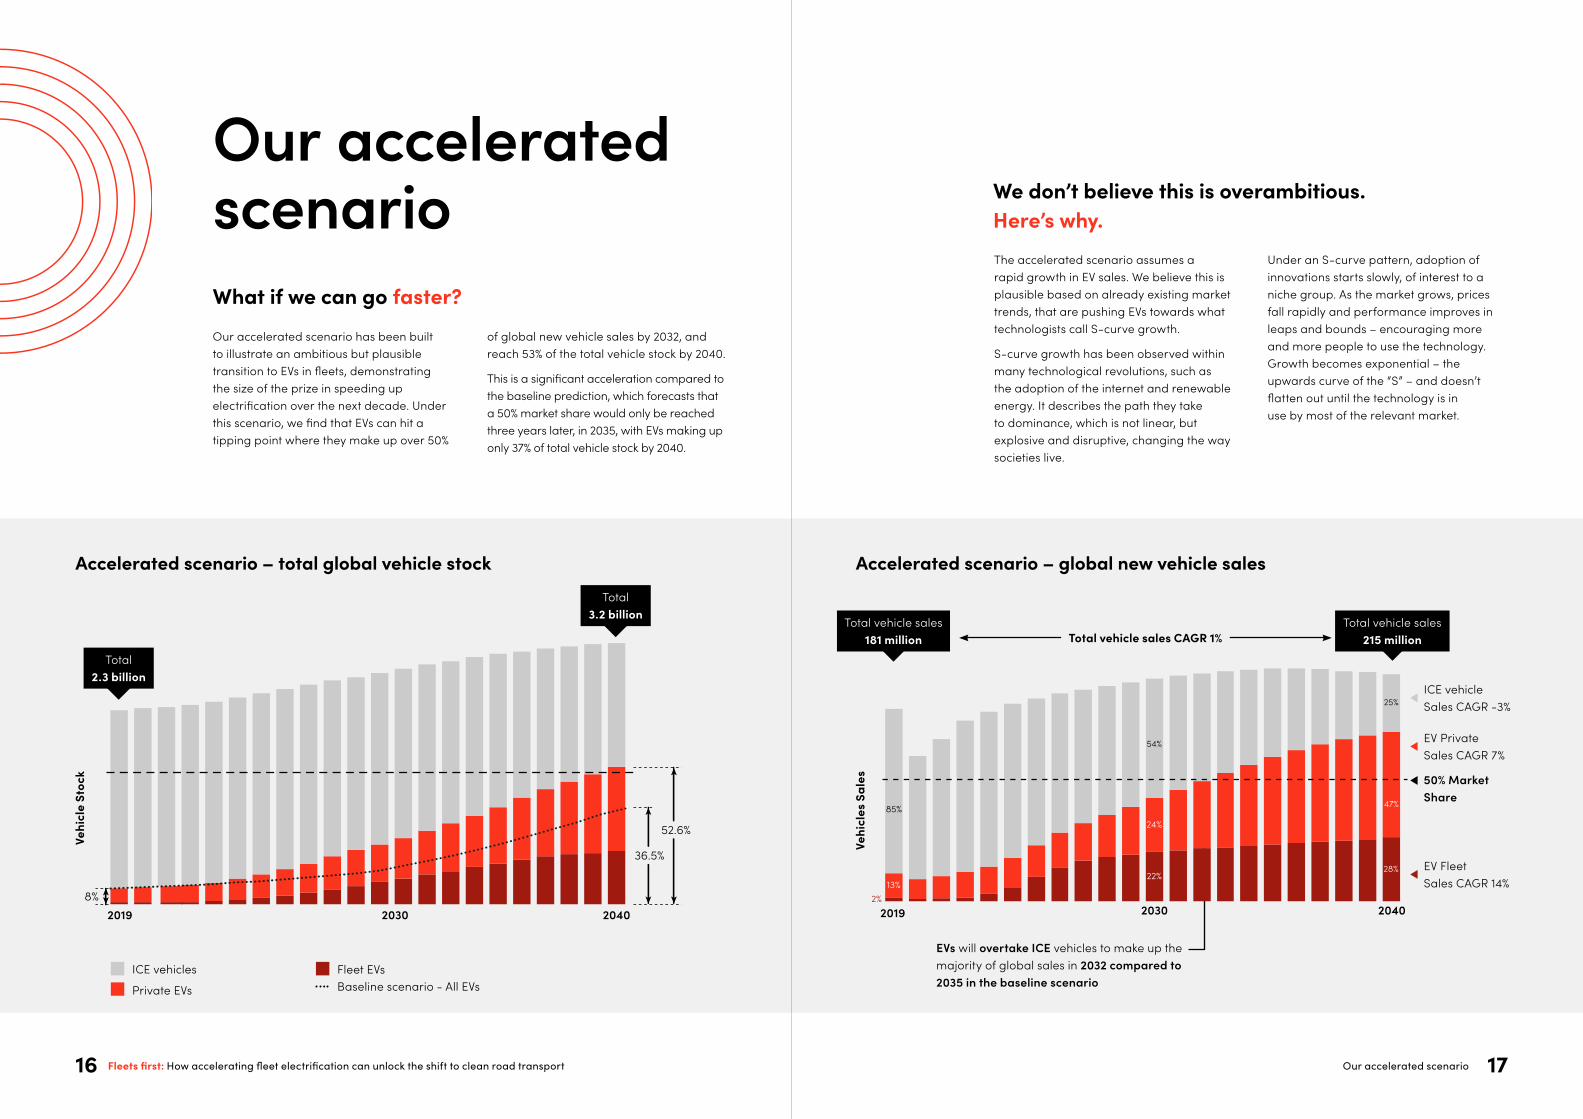
Accelerated scenario – global new vehicle sales
EVs will overtake ICE vehicles to make up the majority of global sales in 2032 compared to 2035 in the baseline scenario
50% Market Share
EV Fleet Sales CAGR 14%
EV Private Sales CAGR 7%
ICE vehicle Sales CAGR -3%
Accelerated scenario – total global vehicle stock
ICE vehicles
Private EVs
Fleet EVs Baseline scenario - All EVs
2%13%
85%
2019 2030 2040
22%
24%
54%
28%
47%
25%
20302019 2040
52.6%
8%
36.5%Ve
hicl
es S
ales
Total vehicle sales 215 million
Total vehicle sales 181 million Total vehicle sales CAGR 1%
Vehi
cle
Stoc
k
Total 2.3 billion
Total 3.2 billion
The accelerated scenario assumes a rapid growth in EV sales. We believe this is plausible based on already existing market trends, that are pushing EVs towards what technologists call S-curve growth.
S-curve growth has been observed within many technological revolutions, such as the adoption of the internet and renewable energy. It describes the path they take to dominance, which is not linear, but explosive and disruptive, changing the way societies live.
We don’t believe this is overambitious. Here’s why.
Under an S-curve pattern, adoption of innovations starts slowly, of interest to a niche group. As the market grows, prices fall rapidly and performance improves in leaps and bounds – encouraging more and more people to use the technology. Growth becomes exponential – the upwards curve of the “S” – and doesn’t flatten out until the technology is in use by most of the relevant market.
Our accelerated scenario
Our accelerated scenario has been built to illustrate an ambitious but plausible transition to EVs in fleets, demonstrating the size of the prize in speeding up electrification over the next decade. Under this scenario, we find that EVs can hit a tipping point where they make up over 50%
of global new vehicle sales by 2032, and reach 53% of the total vehicle stock by 2040.
This is a significant acceleration compared to the baseline prediction, which forecasts that a 50% market share would only be reached three years later, in 2035, with EVs making up only 37% of total vehicle stock by 2040.
What if we can go faster?
Fleets first: How accelerating fleet electrification can unlock the shift to clean road transport Our accelerated scenario16 17
2019 20252020 2021 20242022 20262023 2027 2028
20%
2029 20352031 20342032 20362033 2037 2038 20392030 2040
60%
40%
80%
100%
10%
0%
50%
30%
70%
90%
B
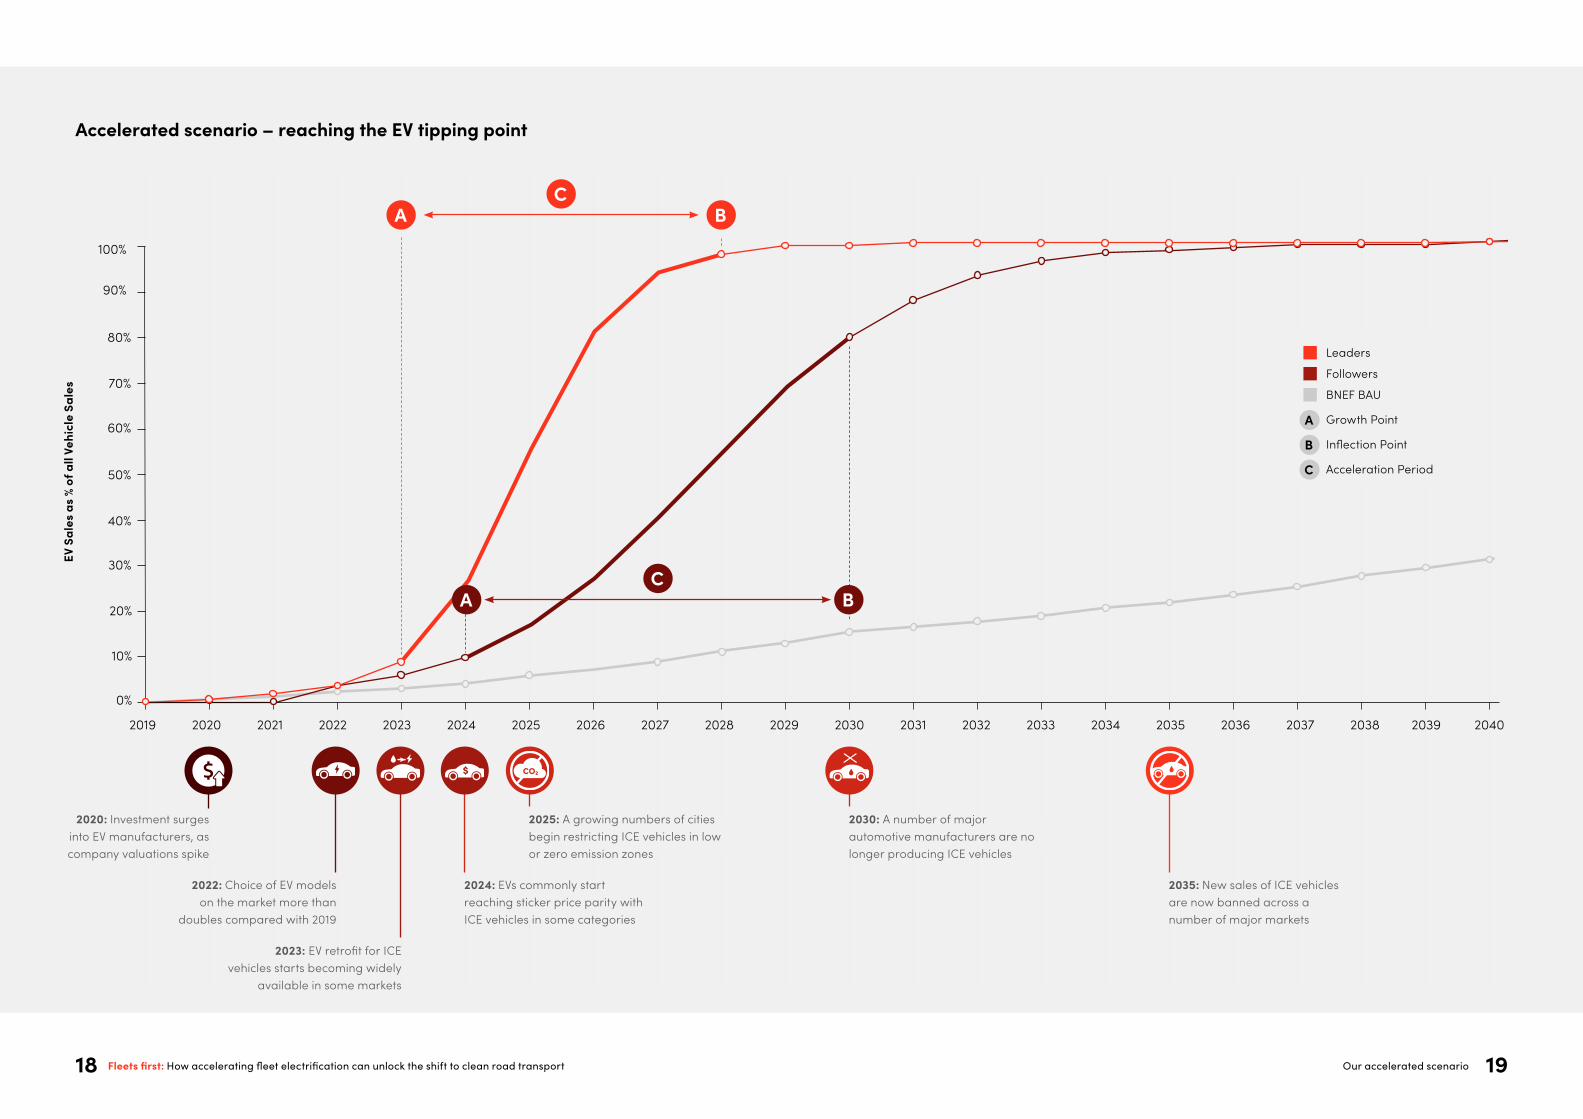
Leaders
Followers
BNEF BAU
A Growth Point
B Inflection Point
C Acceleration Period
2035: New sales of ICE vehicles are now banned across a number of major markets
2030: A number of major automotive manufacturers are no longer producing ICE vehicles
Accelerated scenario – reaching the EV tipping point
EV S
ales
as
% of
all
Vehi
cle
Sale
s
A
AC
CB
2025: A growing numbers of cities begin restricting ICE vehicles in low or zero emission zones
2022: Choice of EV models on the market more than
doubles compared with 2019
2023: EV retrofit for ICE vehicles starts becoming widely
available in some markets
2024: EVs commonly start reaching sticker price parity with ICE vehicles in some categories
2020: Investment surges into EV manufacturers, as company valuations spike
Fleets first: How accelerating fleet electrification can unlock the shift to clean road transport Our accelerated scenario18 19
Fleet EVs in particular are ready for S-curve growth.Fleet owners upgrade vehicles more frequently than private car owners, since they typically have better access to finance and put a greater focus on total cost of ownership. Fleet vehicles are typically renewed on average every three to four years for light commercial vehicles, shared passenger cars and corporate-owned passenger cars, compared with seven years for private passenger vehicles.
The economic advantages of EVs are also greater for fleets when compared with private vehicles, since the higher average frequency and length of journeys means they have a greater upside from electricity costing less than petrol or diesel. Today, the total cost of ownership of EVs is lower than for ICE vehicles in a majority of cases across many markets, thanks to lower maintenance, tax and energy costs, which offset higher up front prices.15
Scenarios have boundaries, but so does our planetThis report sets out a scenario exploring the role of fleets in accelerating the shift towards zero emission vehicles. However, this is just one part of a complex global transport system. We need to transform the entire economy at scale and speed if we are to achieve net zero by 2050, giving ourselves a realistic chance of avoiding the worst impacts from climate change.
While this scenario explores some of the opportunities for change, as well as the benefits fleet electrification can bring, doing this in isolation will not be sufficient. We will only achieve our goals with high ambition and bold action across multiple sectors.
15 LeasePlan (2019). The Total Cost of Ownership of electric vehicles compared to traditional vehicles.
Building the model for our fleets-led approach, regions are divided into two groups – leaders and followers.Under our scenario, leaders are able to begin the rapid acceleration of EV sales in 2023, reaching 100% EV market share in fleet purchases by 2030.
These leading regions include:
• China, where continued regulatory and manufacturing support will strengthen the country’s dominance in EVs. However charging infrastructure availability may slow down China’s growth, bringing it closer in line with other leading regions.
• Europe, where electrified shared passenger vehicles and corporate fleets will increase thanks to EV car ownership schemes from companies, while policies such as low and zero emission areas in urban areas will push light commercial vehicles (LCVs) and buses to make the switch.
• The US, where growth will be driven by the pro-EV stance and significant industry support seen to date from President Biden’s administration, combined with emerging disruptive business models and fast-growth start-ups.
• South Korea, where a combination of subsidies for fleet transition and stringent policy measures will drive forward battery manufacturing and the EV industry, strengthened by the presence of Hyundai and its introduction of new EV models.
S-curve growth is hard to predict, precisely because the tipping points for acceleration can depend on a number of factors. But a number of trends point to EVs being at the beginning of the upward slope of the “S” and ready to experience a similar trajectory to renewable energy.
As a comparison, renewable energy is a technology where time after time, industry and expert forecasts have been outstripped by the market, frequently by a significant amount. For example, in 2014, the International Energy Agency forecast that average solar prices would only reach $0.05/kWh by 2050.4 But this milestone was already reached in some markets by 2020. In fact, energy produced by solar and wind in countries spanning two-thirds of the world’s population was cheaper in terms of levelised cost of energy (LCOE) than fossil fuel sources by 2020, having consistently exceeded industry forecasts.5
In 2016, it was forecast by the International Energy Agency that ICE vehicles would still account for the majority of cars on the road in the early 2050s, with EVs making up only around 40% of the light duty vehicle stock (and just 10% by 2030).6 Just five years later, it’s hard to imagine them capturing anything but a shrinking minority of new vehicle sales by the middle of the century, thanks to government phase outs and manufacturer commitments.
Many existing trends point to a tipping point in vehicle electrification in the mid-2020s in most geographies, and for most vehicle types.
These include the fact that:
• Automotive manufacturers are significantly increasing investment into EV production and setting bolder targets for future sales.7
• EVs are expected to reach upfront (sticker) price parity with ICE vehicles by 2024 due to battery price declines.8
• The choice of EV models on the market will more than double between 2019 and 2022, from around 230 to in excess of 520.9
• Retrofitting ICE vehicles with EV technology is expected to become widely available by 2023.10
• A large number of cities around the world are announcing plans to restrict ICE vehicles in zero emission zones across a major area of their city by 2030.11
• An expanding number of countries are introducing legislation that will require the phase out petrol and diesel engines in new vehicles between 2025 and 2040.12
• There are also a growing number of states and regions moving ahead of their national governments to introduce local ICE phase outs,13 or EV market share targets.14
4 International Energy Agency (2014). Energy Technology Perspectives 2014.5 BloombergNEF (2020). New Energy Outlook 2020.6 International Energy Agency (2016). Global EV Outlook 2016.7 Companies or brands with announced ICE phase out dates include Jaguar (2025), BAIC (2025), Volvo Cars (2030), Fiat (2030),
Ford (Europe only, 2030), Volkswagen (Europe 2035), General Motors (2035), Daimler (2039), Honda (2040).8 UBS (2020). Q-Series: Tearing Down the Heart of an Electric Car Lap 2: Cost Parity a Closer Reality?.9 McKinsey (2020). McKinsey Electric Vehicle Index Q1 2020.10 Expert interviews conducted by SYSTEMIQ.11 There are 36 global cities committed to this through the C40 Green & Health Streets Declaration, including London, Paris,
Rome, Amsterdam, Madrid, Moscow, Jakarta, Tokyo, Santiago, Rio de Janeiro, Mexico City, Bogota, and Los Angeles.12 Examples include: Norway (2025); the Netherlands, Sweden, Denmark, Ireland, Iceland, Slovenia (2030); the UK, Canada,
Cape Verde (2035); France, Spain (2040). In addition, both Japan and China intend to have a limited phase out by 2035, that still allows for hybrid vehicles.
13 Examples include: Hainan in China (2030); Scotland in the UK (2032); California and Massachusetts in the US, Quebec in Canada, Sakhalin in Russia (2035).
14 The government of Delhi in India has set a target that 25% of new vehicle sales should be EVs by 2024.
Fleets first: How accelerating fleet electrification can unlock the shift to clean road transport Our accelerated scenario20 21
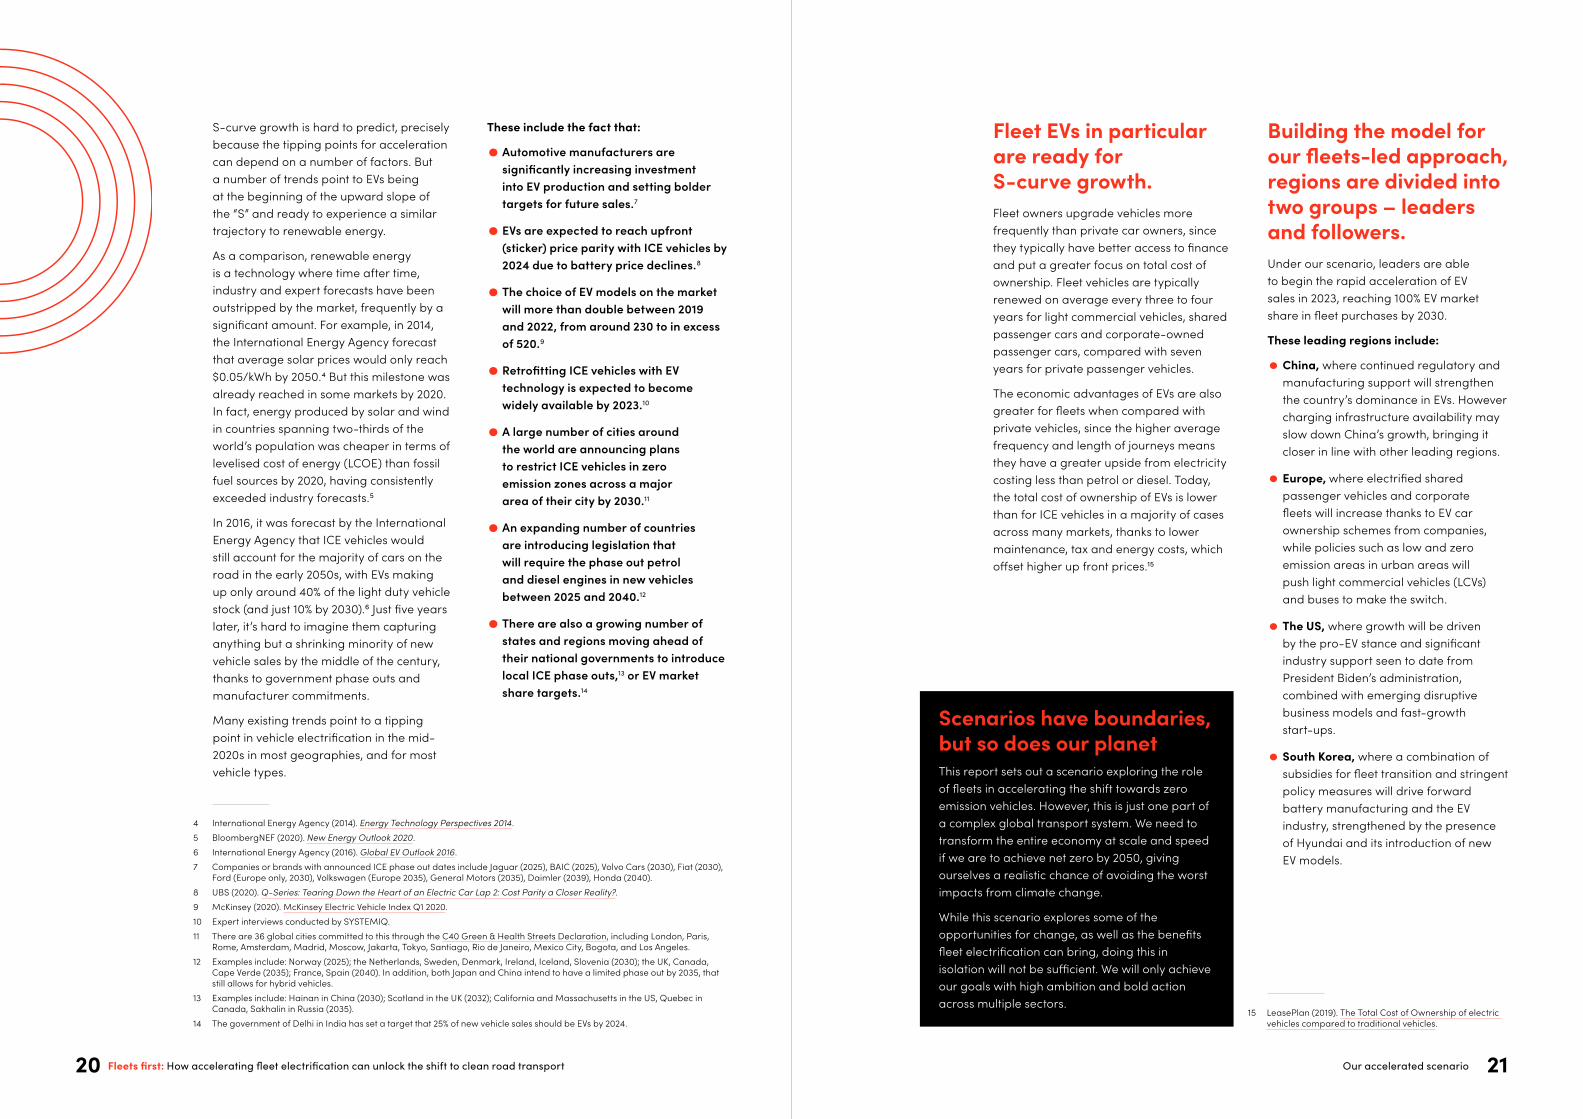
Global Electrification 52.6%
Australia16 24m
68%32%
Japan 93m
61%39%
Korea 24m
68%32%China 768m
16%84%
Accelerated scenario – EV vs ICE in total vehicle stock by 2040
Non-EV
EV
U.S. 225m
42%58%
Rest-of-World 1174m
66%34% India 455m
56%44%Europe399m
41%59%
particularly Toyota, as they continue to focus on low cost cars, hybrids and fuel cell vehicles. Local municipalities may only set loose targets on zero emission vehicles, and a national priority on scaling up green hydrogen reduces the adoption of EVs in LCVs.
• Australia, where a current lack of government regulation to incentivise the switch to EVs could delay progress. Limited local manufacturing and logistical challenges means that many
automotive manufacturers will not see the region as a priority opportunity, especially given the need to provide right-hand drive models.
• In the rest of the world, a lack of price parity for the upfront cost of EVs will slow down their adoption in fleets, especially in developing countries. The transition is also held back due to a lack of regulations or supportive policy, as well as insufficient levels of charging infrastructure.
16 Australia’s commercial vehicle data is under Rest-of-World
Follower regions are not too far behind in many vehicle categories, given the global nature of automotive production and increasing market availability of new models. This sees the starting point for rapid acceleration beginning in 2024, with EVs reaching an 80% market share of new fleet vehicle sales by 2030.
In these countries, many fleet vehicle categories will still reach 100% EV sales by 2030, although some – mostly buses and LCVs – will only get up to 80% by the end of the decade.
These follower regions include:
• India, where EV adoption will be boosted by local government policies, government subsidies, and the growth of ride hailing and delivery service start-ups, alongside the an expansion in e-commerce, but a lack of price parity with low cost domestically-produced ICE vehicles will slow adoption rates.
• Japan, where there is not sufficient support from important local automotive manufacturers for EVs,
Fleets first: How accelerating fleet electrification can unlock the shift to clean road transport Our accelerated scenario22 23

Constrainingfactors
Our accelerated scenario does not break the laws of physics or the market.
We want our accelerated scenario to be ambitious – high levels of ambition are necessary to tackle climate change – but also realistic. It is based on analysis of trends that are already well under way, that could reach tipping points sooner than expected.
While we predict a rapid expansion in EV sales, this does not result in a consequent acceleration in the early retirement or scrapping of ICE vehicle stocks, so impact on overall market transformation is actually slower than it would be otherwise.
Similarly, lead times for manufacturing scale up and infrastructure build out have been taken into account through a stress-testing process.
Constraining factors 25Fleets first: How accelerating fleet electrification can unlock the shift to clean road transport24
432194
806
194
2020 2025 2030
1.769 1.7522.045
4.119
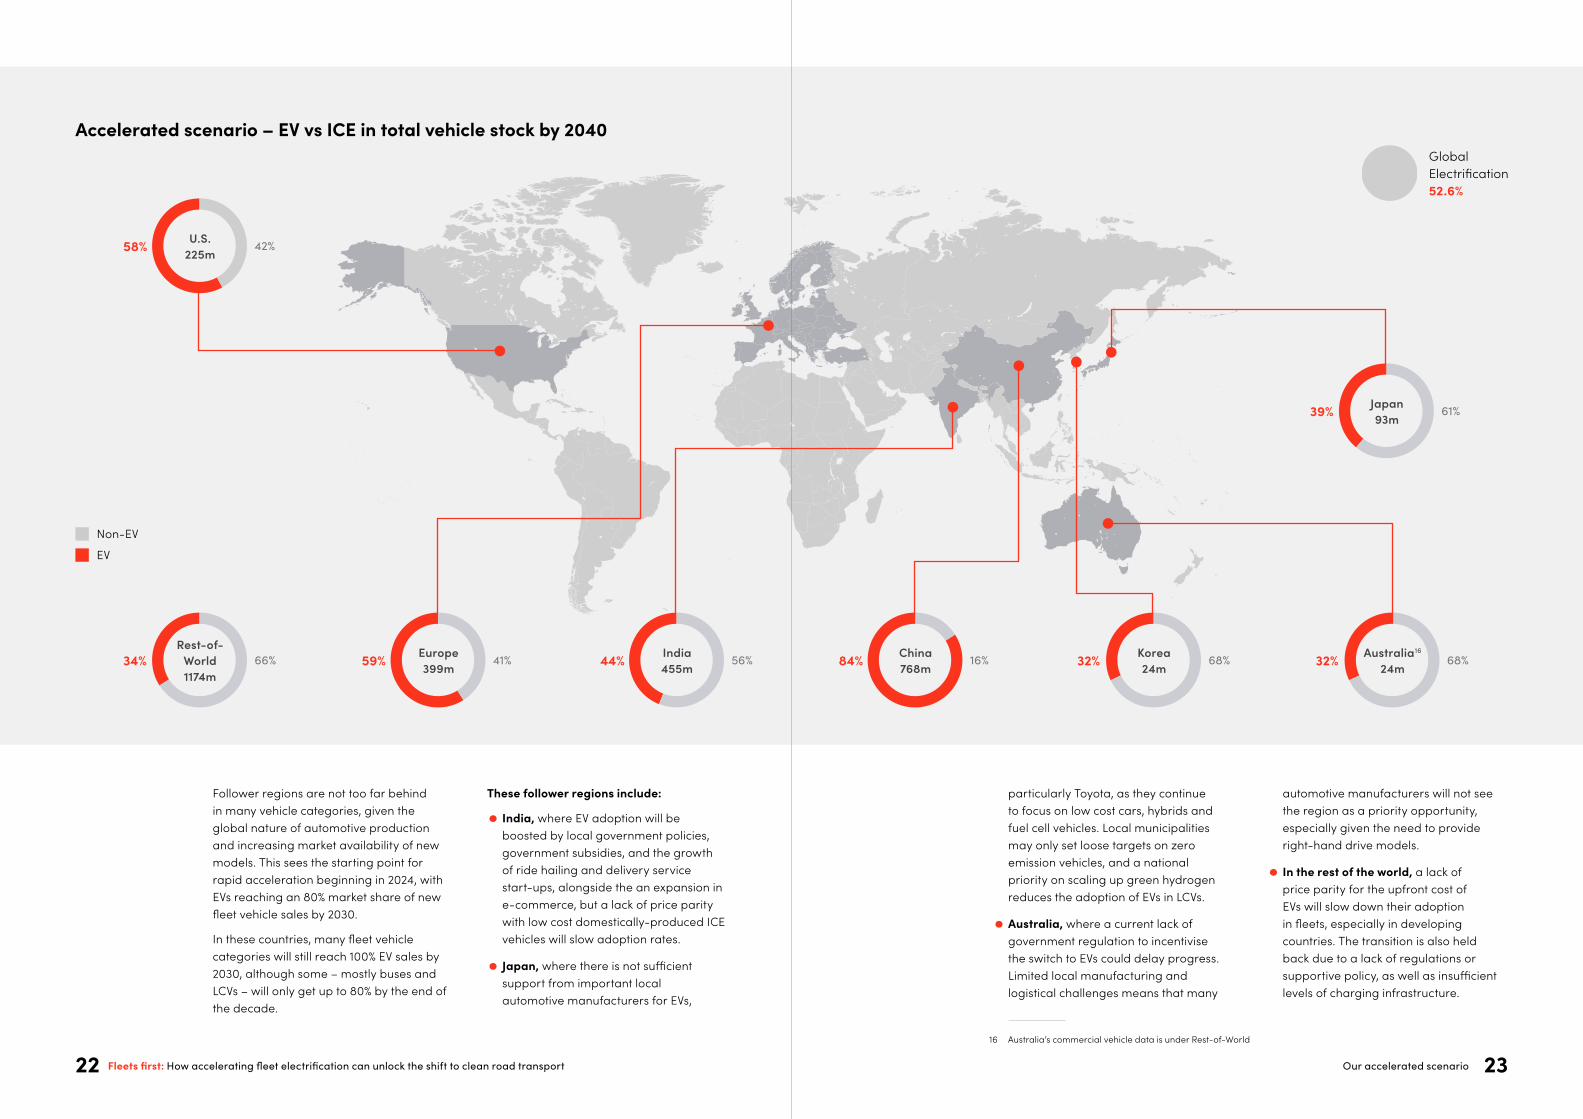
Accelerated scenario – growth in lithium-ion battery demand vs production
Announced production capacity (GWh)
Baseline scenario – demand (GWh)
Accelerated scenario – demand (GWh)
2020
223 323
2021 20262022
402579
2023
883
20292024
1.381
627
2.761
2.135
2025
2.687
1.838
2.946
2027
2.395
2028
2.646
2030
426 534816
1.133
1.643
2.110
2.417
3.083
Accelerated scenario – lithium carbonate equivalent (LCE) demand vs production forecast
Total battery demand
Other demand
Mining production
Baseline scenario demand
Lith
ium
Pro
duct
ion
/ D
eman
d (k
t)
to manufacturing. However, realistically this will only meet a small share of demand before 2030.
What is needed is a clear demand signal today from industry and governments, as the lead time for expanding production capacity of mining operations ranges between three and seven years. But with swift and decisive investment and action in the near-term, lithium availability will not prevent a more rapid transition to EVs as demand accelerates later in the 2020s.
We also stress-tested our scenario against battery manufacturing capacity, comparing the announced lithium-cell manufacturing capacity in 2025 with total lithium-ion battery demand resulting from our accelerated scenario. Here it is apparent that even with the significant increases in demand seen by 2025, this
should be met by battery manufacturing capacity already announced to date.
While around three-quarters of current capacity is in China today, a number of planned gigafactories in other regions will ensure that production and availability is more prevalent across most other major automotive manufacturing regions. In particular, Europe had more than 600 gigawatt hours (GWh) of annual production capacity announced as of Q1 in 2021.18
Then looking out to 2030, there will need to be an even greater increase in production capacity for EV batteries. Although with significant lead time, continued cost reductions, and the potential for exciting breakthroughs in battery technologies, this is not expected to be a constraint on continued rapid growth.
18 Zenn, R. (2021). Li-on Battery Gigafactories in Europe (January 2021).
Lithium is a key raw material needed for EV batteries , accounting for a large and growing share of total lithium demand. Under our accelerated scenario, total demand for battery-grade lithium carbonate would be around two times greater than current projections for global mining in 2026.17
In 2015, economically viable lithium reserves were estimated at around 13.5 million tonnes, although actual resources are likely to be much higher. This means
With clear demand signals to drive forward investment and preemptive strengthening of distribution & charging networks, there will be enough raw materials and manufacturing capacity for making batteries.
that availability of proven reserves is not a constraint in itself, the infrastructure just needs to be put in place for extraction supported by adequate investment. It is also essential that this is done following stringent environmental and social standards, to limit negative potential impacts.
Beyond this, there are considerable opportunities to scale up battery recycling as an additional source of raw materials, in the shift towards a more circular approach
17 SYSTEMIQ analysis based on data from Office of the Chief Economist, Australian Government, BloombergNEF, US Geological Survey, and Global Battery Alliance.
Fleets first: How accelerating fleet electrification can unlock the shift to clean road transport Constraining factors26 27
19 International Energy Agency (2020). Tracking Transport 2020.; UN Environment Programme (2020). Emission Gap Report 2020.
20 Wang, S., and Ge, M. (2019). Everything You Need to Know About the Fastest-Growing Source of Global Emissions: Transport. World Resources Institute.
21 United States Environmental Protection Agency (2020). Sources of Greenhouse Gas Emissions.
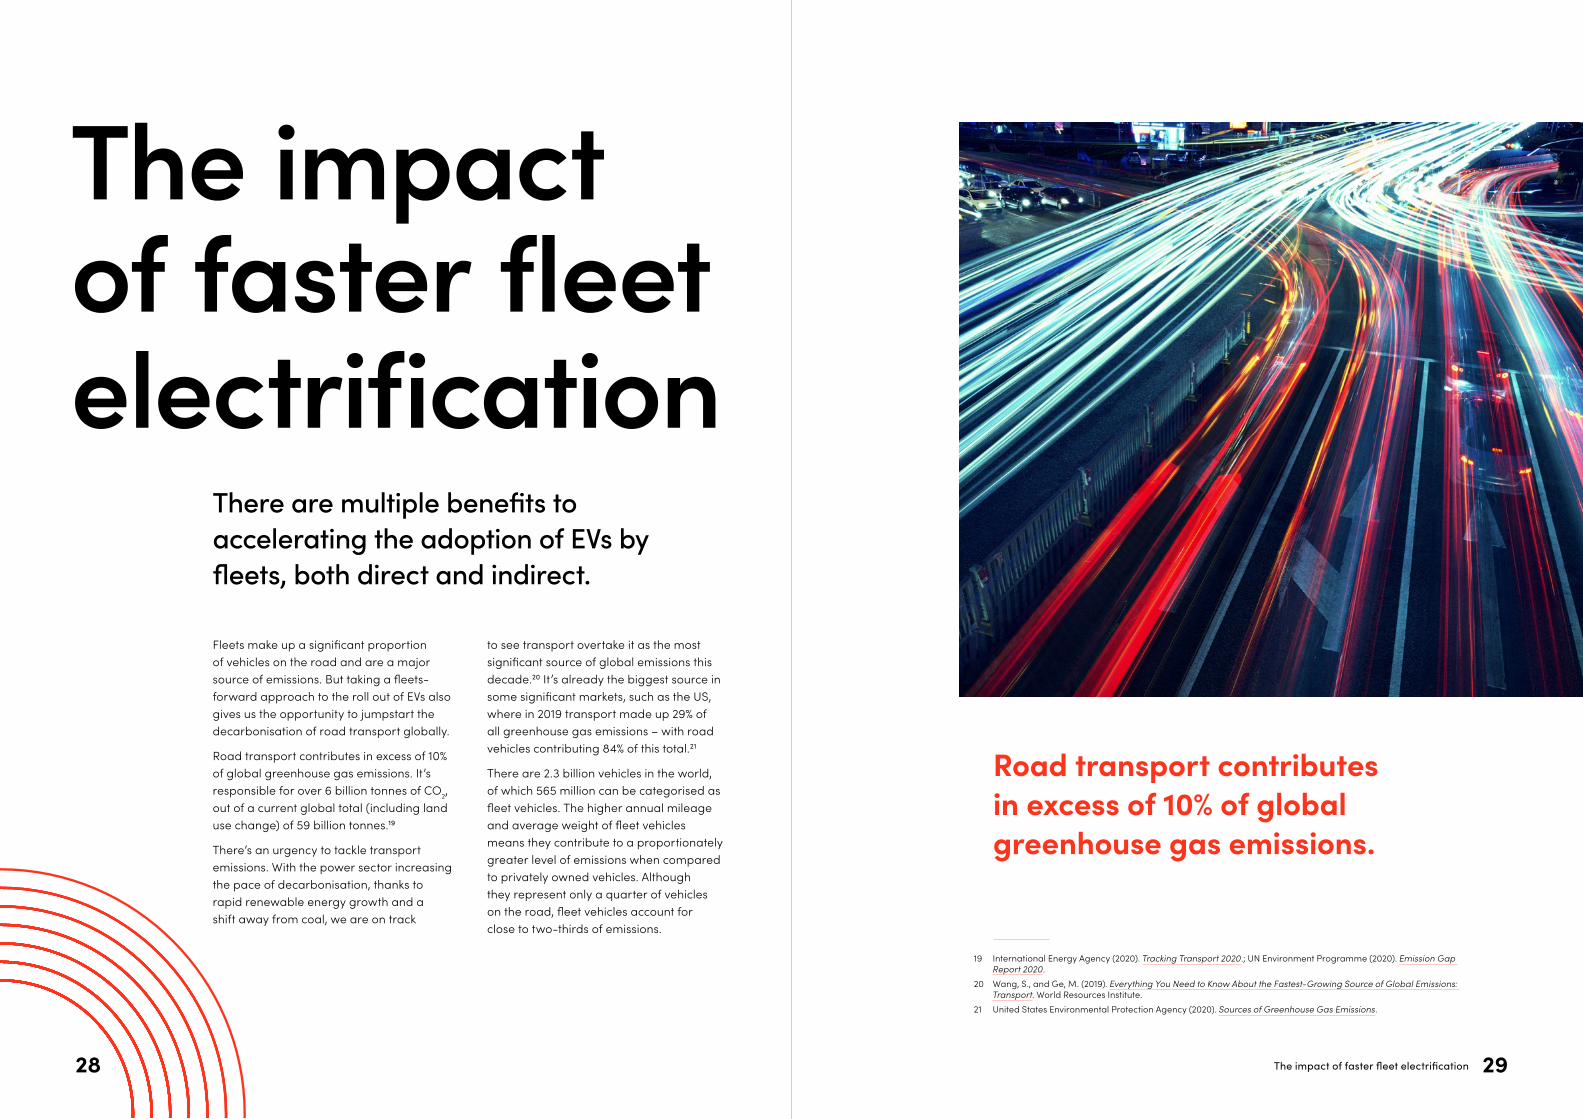
Road transport contributes in excess of 10% of global greenhouse gas emissions.
Fleets make up a significant proportion of vehicles on the road and are a major source of emissions. But taking a fleets-forward approach to the roll out of EVs also gives us the opportunity to jumpstart the decarbonisation of road transport globally.
Road transport contributes in excess of 10% of global greenhouse gas emissions. It’s responsible for over 6 billion tonnes of CO2, out of a current global total (including land use change) of 59 billion tonnes.19
There’s an urgency to tackle transport emissions. With the power sector increasing the pace of decarbonisation, thanks to rapid renewable energy growth and a shift away from coal, we are on track
There are multiple benefits to accelerating the adoption of EVs by fleets, both direct and indirect.
The impact of faster fleetelectrification
to see transport overtake it as the most significant source of global emissions this decade.20 It’s already the biggest source in some significant markets, such as the US, where in 2019 transport made up 29% of all greenhouse gas emissions – with road vehicles contributing 84% of this total.21
There are 2.3 billion vehicles in the world, of which 565 million can be categorised as fleet vehicles. The higher annual mileage and average weight of fleet vehicles means they contribute to a proportionately greater level of emissions when compared to privately owned vehicles. Although they represent only a quarter of vehicles on the road, fleet vehicles account for close to two-thirds of emissions.
The impact of faster fleet electrification 28 29
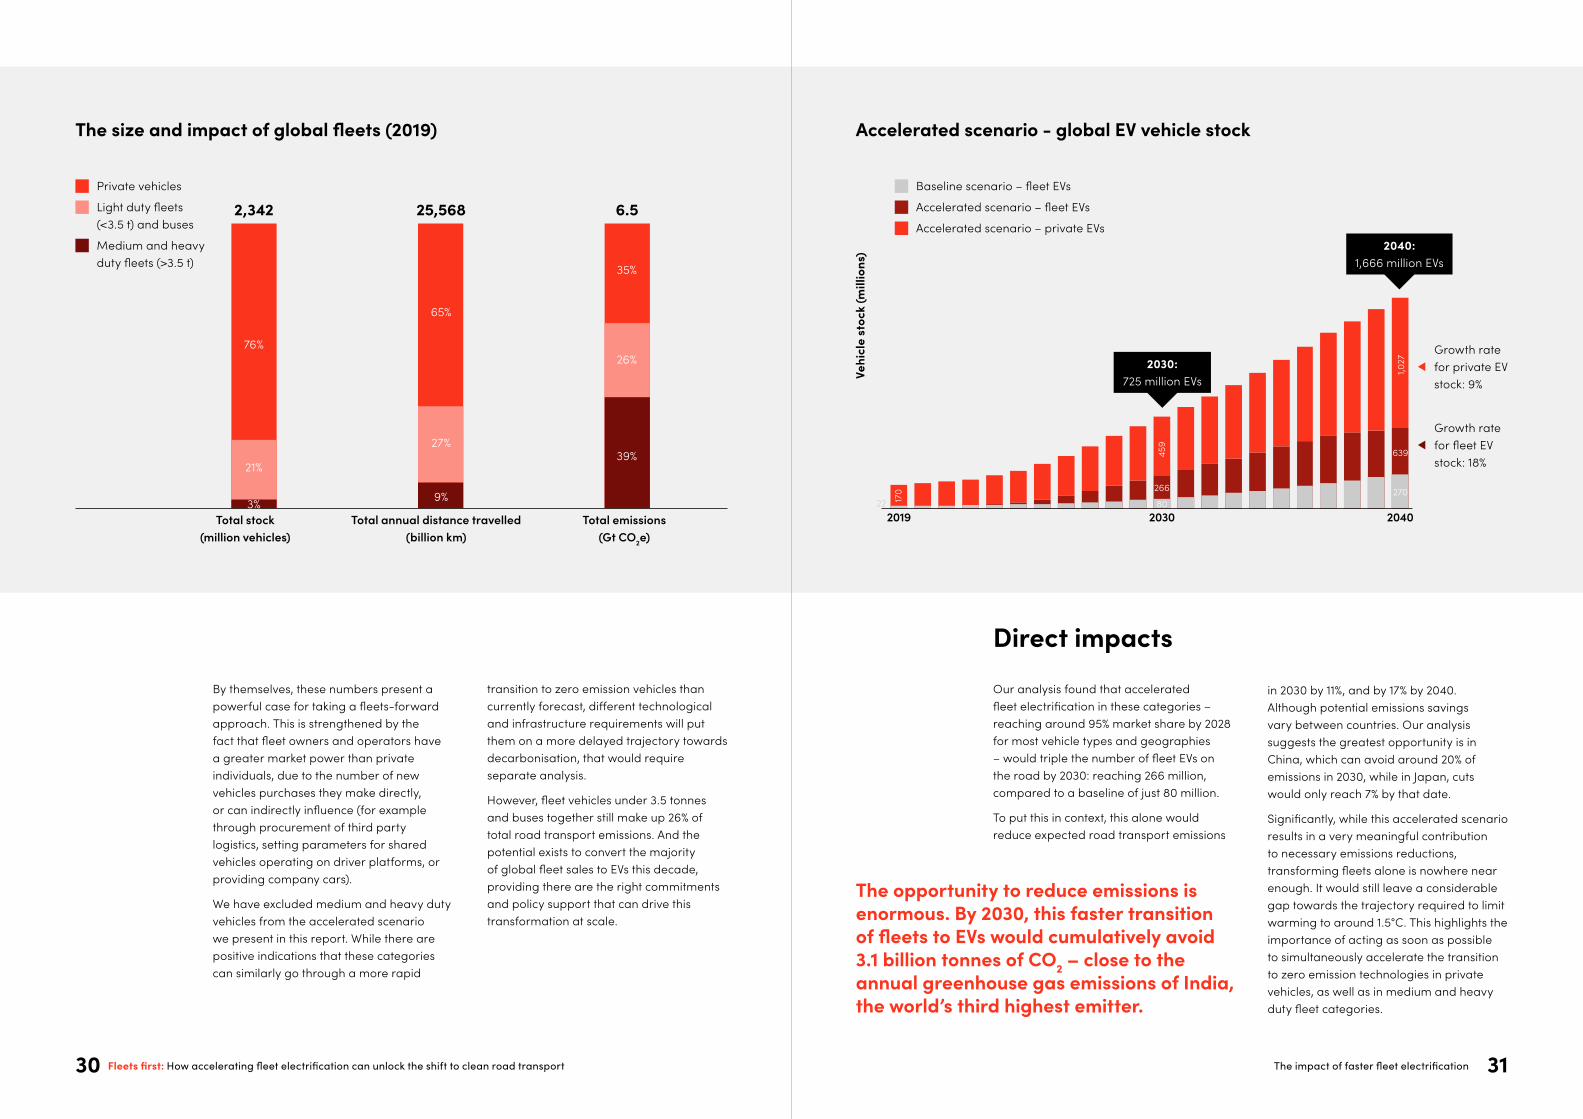
Accelerated scenario - global EV vehicle stock
22 170
459
80
266
1,027
270
639
2019 2030 2040
Baseline scenario – fleet EVs
Accelerated scenario – fleet EVs
Accelerated scenario – private EVs2040:
1,666 million EVs
2030: 725 million EVs
Growth rate for fleet EV stock: 18%
Vehi
cle
stoc
k (m
illio
ns)
The size and impact of global fleets (2019)
Total stock (million vehicles)
Total annual distance travelled (billion km)
Total emissions (Gt CO2e)
25,5682,342 6.5 Private vehicles
Light duty fleets (<3.5 t) and buses
Medium and heavy duty fleets (>3.5 t)
Growth rate for private EV stock: 9%
76%
65%
35%
21%
27%
3% 9%
39%
26%
Our analysis found that accelerated fleet electrification in these categories – reaching around 95% market share by 2028 for most vehicle types and geographies – would triple the number of fleet EVs on the road by 2030: reaching 266 million, compared to a baseline of just 80 million.
To put this in context, this alone would reduce expected road transport emissions
Direct impacts
The opportunity to reduce emissions is enormous. By 2030, this faster transition of fleets to EVs would cumulatively avoid 3.1 billion tonnes of CO2 – close to the annual greenhouse gas emissions of India, the world’s third highest emitter.
in 2030 by 11%, and by 17% by 2040. Although potential emissions savings vary between countries. Our analysis suggests the greatest opportunity is in China, which can avoid around 20% of emissions in 2030, while in Japan, cuts would only reach 7% by that date.
Significantly, while this accelerated scenario results in a very meaningful contribution to necessary emissions reductions, transforming fleets alone is nowhere near enough. It would still leave a considerable gap towards the trajectory required to limit warming to around 1.5°C. This highlights the importance of acting as soon as possible to simultaneously accelerate the transition to zero emission technologies in private vehicles, as well as in medium and heavy duty fleet categories.
By themselves, these numbers present a powerful case for taking a fleets-forward approach. This is strengthened by the fact that fleet owners and operators have a greater market power than private individuals, due to the number of new vehicles purchases they make directly, or can indirectly influence (for example through procurement of third party logistics, setting parameters for shared vehicles operating on driver platforms, or providing company cars).
We have excluded medium and heavy duty vehicles from the accelerated scenario we present in this report. While there are positive indications that these categories can similarly go through a more rapid
transition to zero emission vehicles than currently forecast, different technological and infrastructure requirements will put them on a more delayed trajectory towards decarbonisation, that would require separate analysis.
However, fleet vehicles under 3.5 tonnes and buses together still make up 26% of total road transport emissions. And the potential exists to convert the majority of global fleet sales to EVs this decade, providing there are the right commitments and policy support that can drive this transformation at scale.
Fleets first: How accelerating fleet electrification can unlock the shift to clean road transport The impact of faster fleet electrification 30 31
633
441
224
397
219178
238
8954
745
524
279
512482
389
782
587
430
20302019 2040
700
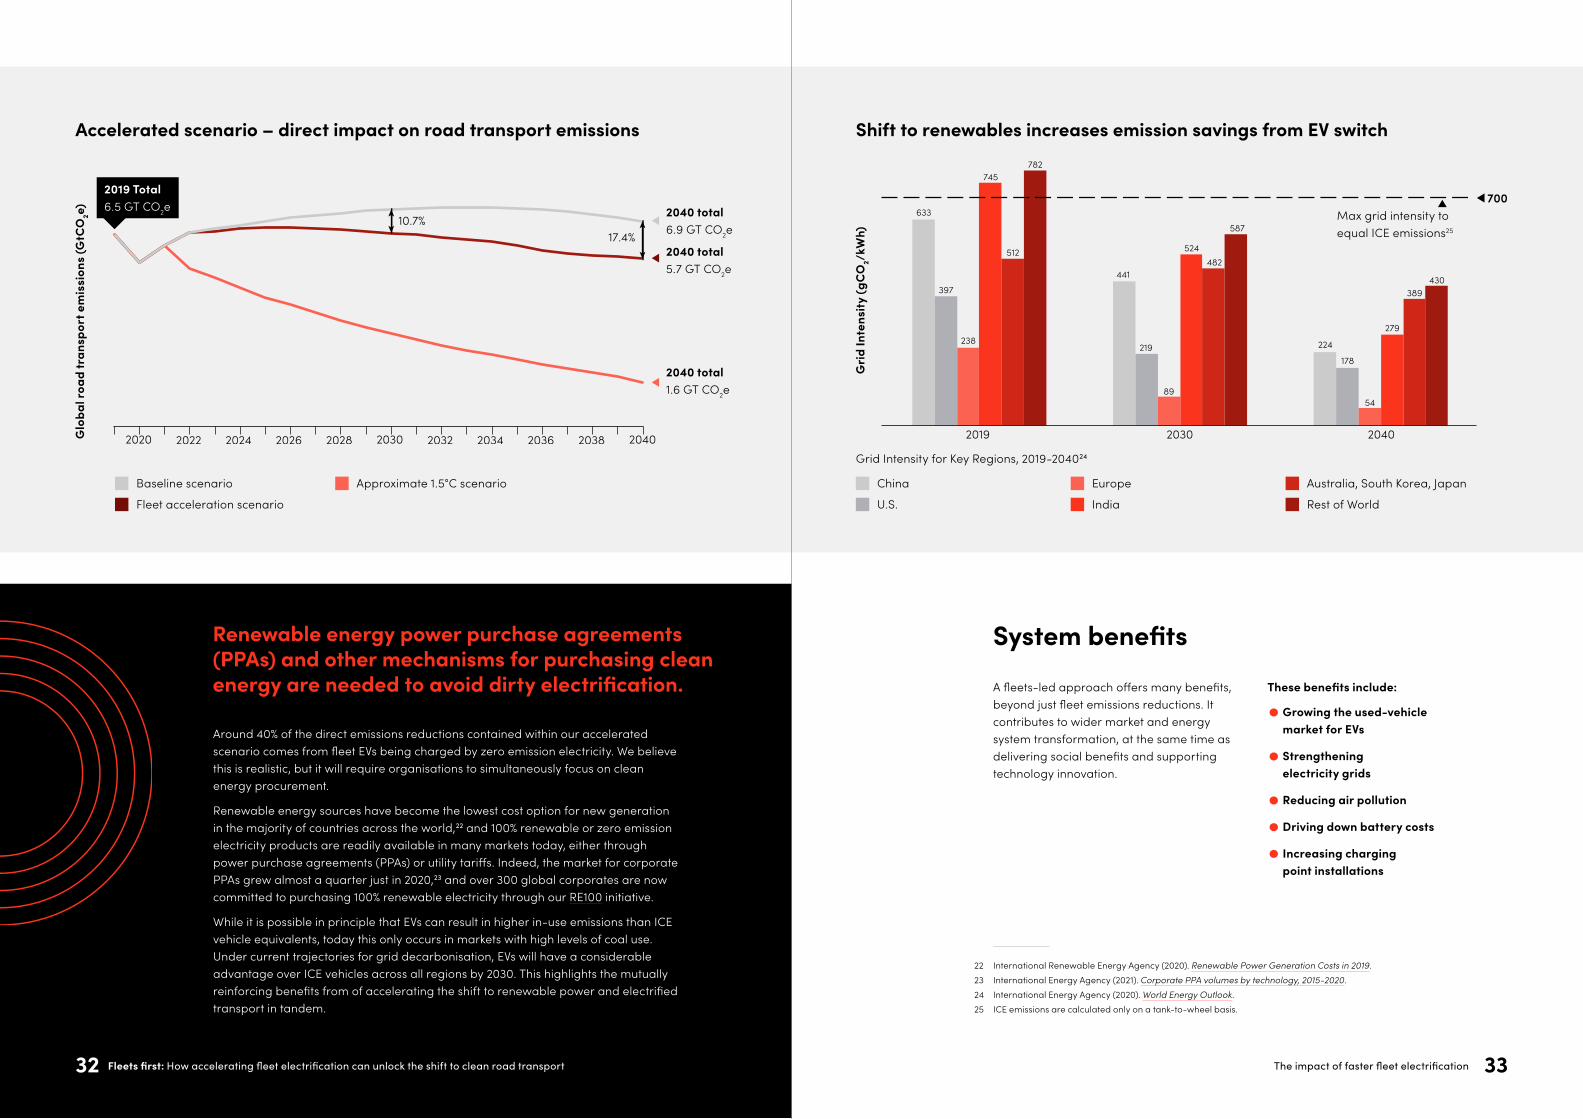
Shift to renewables increases emission savings from EV switch
China
U.S.
Europe
India
Australia, South Korea, Japan
Rest of World
Gri
d In
tens
ity (g
CO
2/kW
h)
Grid Intensity for Key Regions, 2019-204024
Max grid intensity to equal ICE emissions25
Accelerated scenario – direct impact on road transport emissions
2020 2030 20402022 2024 2026 2028 2032
10.7%17.4%
2034 2036 2038Glo
bal r
oad
tran
spor
t em
issi
ons
(GtC
O2e) 2040 total
6.9 GT CO2e
2040 total 5.7 GT CO2e
2040 total 1.6 GT CO2e
2019 Total 6.5 GT CO2e
Baseline scenario
Fleet acceleration scenario
Approximate 1.5°C scenario
22 International Renewable Energy Agency (2020). Renewable Power Generation Costs in 2019.23 International Energy Agency (2021). Corporate PPA volumes by technology, 2015-2020.24 International Energy Agency (2020). World Energy Outlook.25 ICE emissions are calculated only on a tank-to-wheel basis.
A fleets-led approach offers many benefits, beyond just fleet emissions reductions. It contributes to wider market and energy system transformation, at the same time as delivering social benefits and supporting technology innovation.
These benefits include:
• Growing the used-vehicle market for EVs
• Strengthening electricity grids
• Reducing air pollution
• Driving down battery costs
• Increasing charging point installations
System benefits
Around 40% of the direct emissions reductions contained within our accelerated scenario comes from fleet EVs being charged by zero emission electricity. We believe this is realistic, but it will require organisations to simultaneously focus on clean energy procurement.
Renewable energy sources have become the lowest cost option for new generation in the majority of countries across the world,22 and 100% renewable or zero emission electricity products are readily available in many markets today, either through power purchase agreements (PPAs) or utility tariffs. Indeed, the market for corporate PPAs grew almost a quarter just in 2020,23 and over 300 global corporates are now committed to purchasing 100% renewable electricity through our RE100 initiative.
While it is possible in principle that EVs can result in higher in-use emissions than ICE vehicle equivalents, today this only occurs in markets with high levels of coal use. Under current trajectories for grid decarbonisation, EVs will have a considerable advantage over ICE vehicles across all regions by 2030. This highlights the mutually reinforcing benefits from of accelerating the shift to renewable power and electrified transport in tandem.
Renewable energy power purchase agreements (PPAs) and other mechanisms for purchasing clean energy are needed to avoid dirty electrification.
The impact of faster fleet electrification 33Fleets first: How accelerating fleet electrification can unlock the shift to clean road transport32
20402020
5.5
6.0
6.5
7.0
7.5
8.0
2030
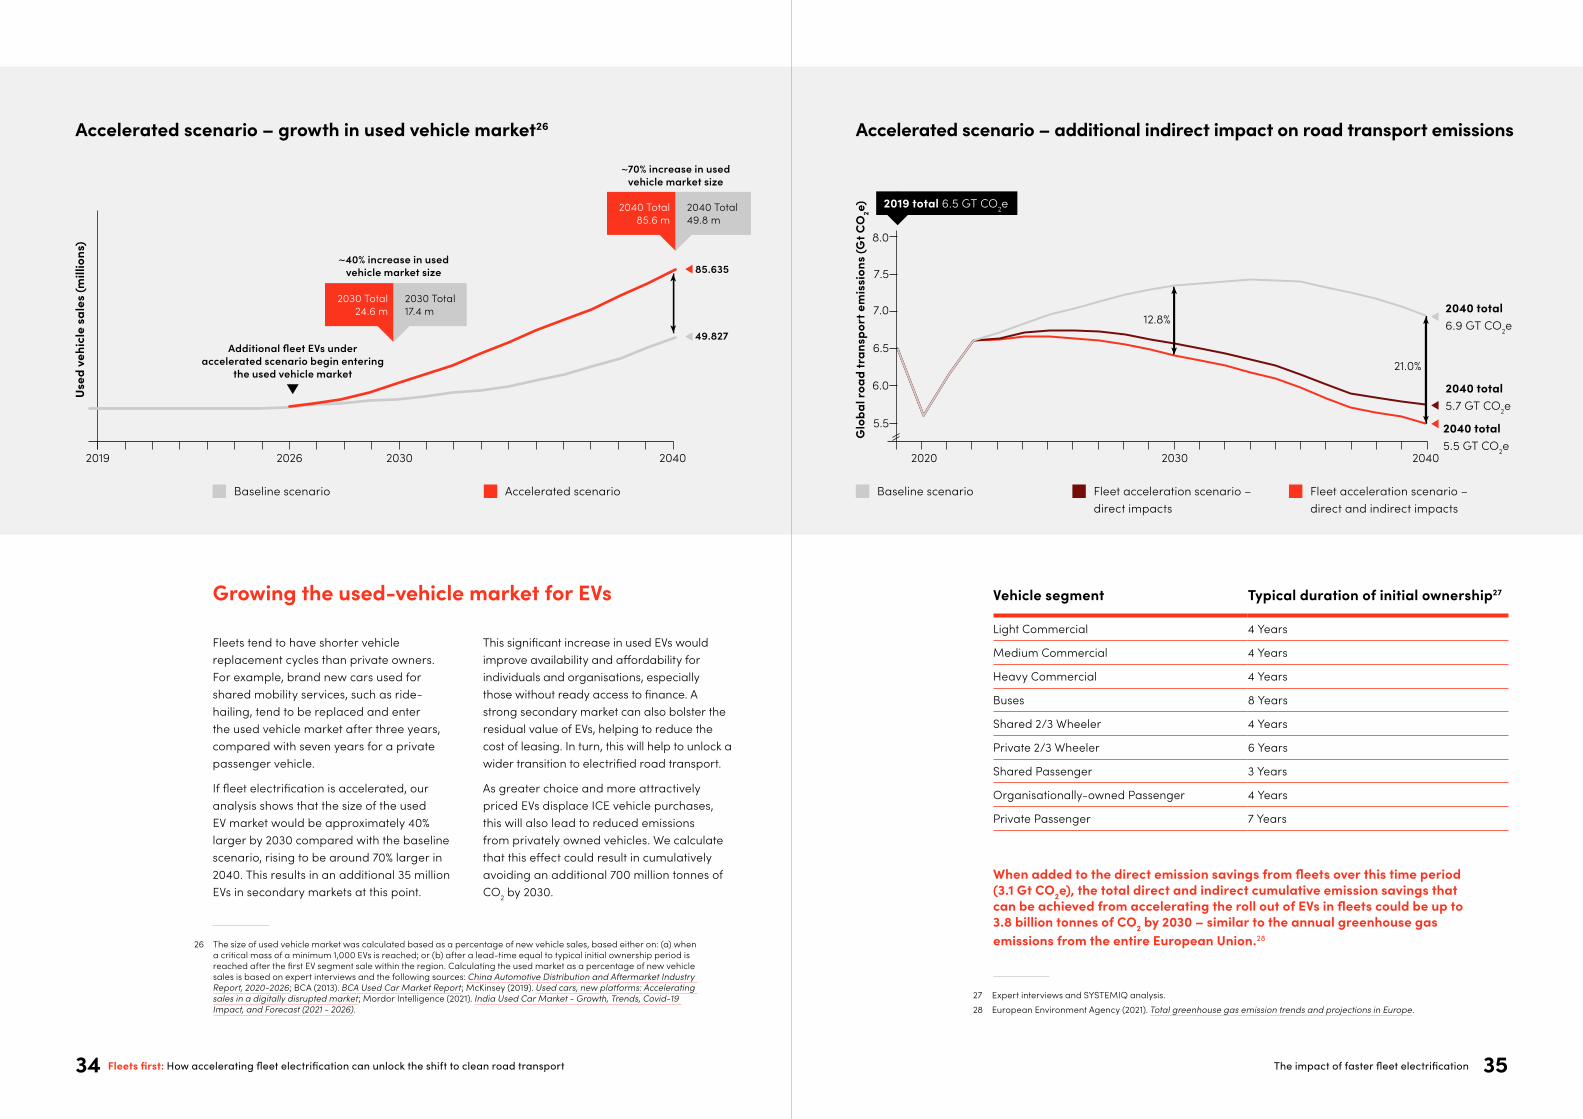
12.8%
21.0%
Accelerated scenario – additional indirect impact on road transport emissions
Glo
bal r
oad
tran
spor
t em
issi
ons
(Gt C
O2e)
Baseline scenario Fleet acceleration scenario – direct impacts
Fleet acceleration scenario – direct and indirect impacts
2040 total 6.9 GT CO2e
2040 total 5.7 GT CO2e
2040 total 5.5 GT CO2e
2019 total 6.5 GT CO2e
~40% increase in used vehicle market size
2030 Total 24.6 m
2030 Total 17.4 m
20402019 2026 2030
Accelerated scenario – growth in used vehicle market26
Baseline scenario Accelerated scenario
~70% increase in used vehicle market size
2040 Total 85.6 m
2040 Total 49.8 m
Additional fleet EVs under accelerated scenario begin entering
the used vehicle market
85.635
49.827
Used
veh
icle
sal
es (m
illio
ns)
Vehicle segment Typical duration of initial ownership27
Light Commercial 4 Years
Medium Commercial 4 Years
Heavy Commercial 4 Years
Buses 8 Years
Shared 2/3 Wheeler 4 Years
Private 2/3 Wheeler 6 Years
Shared Passenger 3 Years
Organisationally-owned Passenger 4 Years
Private Passenger 7 Years
When added to the direct emission savings from fleets over this time period (3.1 Gt CO2e), the total direct and indirect cumulative emission savings that can be achieved from accelerating the roll out of EVs in fleets could be up to 3.8 billion tonnes of CO2 by 2030 – similar to the annual greenhouse gas emissions from the entire European Union.28
27 Expert interviews and SYSTEMIQ analysis.28 European Environment Agency (2021). Total greenhouse gas emission trends and projections in Europe.
26 The size of used vehicle market was calculated based as a percentage of new vehicle sales, based either on: (a) when a critical mass of a minimum 1,000 EVs is reached; or (b) after a lead-time equal to typical initial ownership period is reached after the first EV segment sale within the region. Calculating the used market as a percentage of new vehicle sales is based on expert interviews and the following sources: China Automotive Distribution and Aftermarket Industry Report, 2020-2026; BCA (2013). BCA Used Car Market Report; McKinsey (2019). Used cars, new platforms: Accelerating sales in a digitally disrupted market; Mordor Intelligence (2021). India Used Car Market - Growth, Trends, Covid-19 Impact, and Forecast (2021 - 2026).
Fleets tend to have shorter vehicle replacement cycles than private owners. For example, brand new cars used for shared mobility services, such as ride-hailing, tend to be replaced and enter the used vehicle market after three years, compared with seven years for a private passenger vehicle.
If fleet electrification is accelerated, our analysis shows that the size of the used EV market would be approximately 40% larger by 2030 compared with the baseline scenario, rising to be around 70% larger in 2040. This results in an additional 35 million EVs in secondary markets at this point.
Growing the used-vehicle market for EVs
This significant increase in used EVs would improve availability and affordability for individuals and organisations, especially those without ready access to finance. A strong secondary market can also bolster the residual value of EVs, helping to reduce the cost of leasing. In turn, this will help to unlock a wider transition to electrified road transport.
As greater choice and more attractively priced EVs displace ICE vehicle purchases, this will also lead to reduced emissions from privately owned vehicles. We calculate that this effect could result in cumulatively avoiding an additional 700 million tonnes of CO2 by 2030.
Fleets first: How accelerating fleet electrification can unlock the shift to clean road transport The impact of faster fleet electrification 34 35
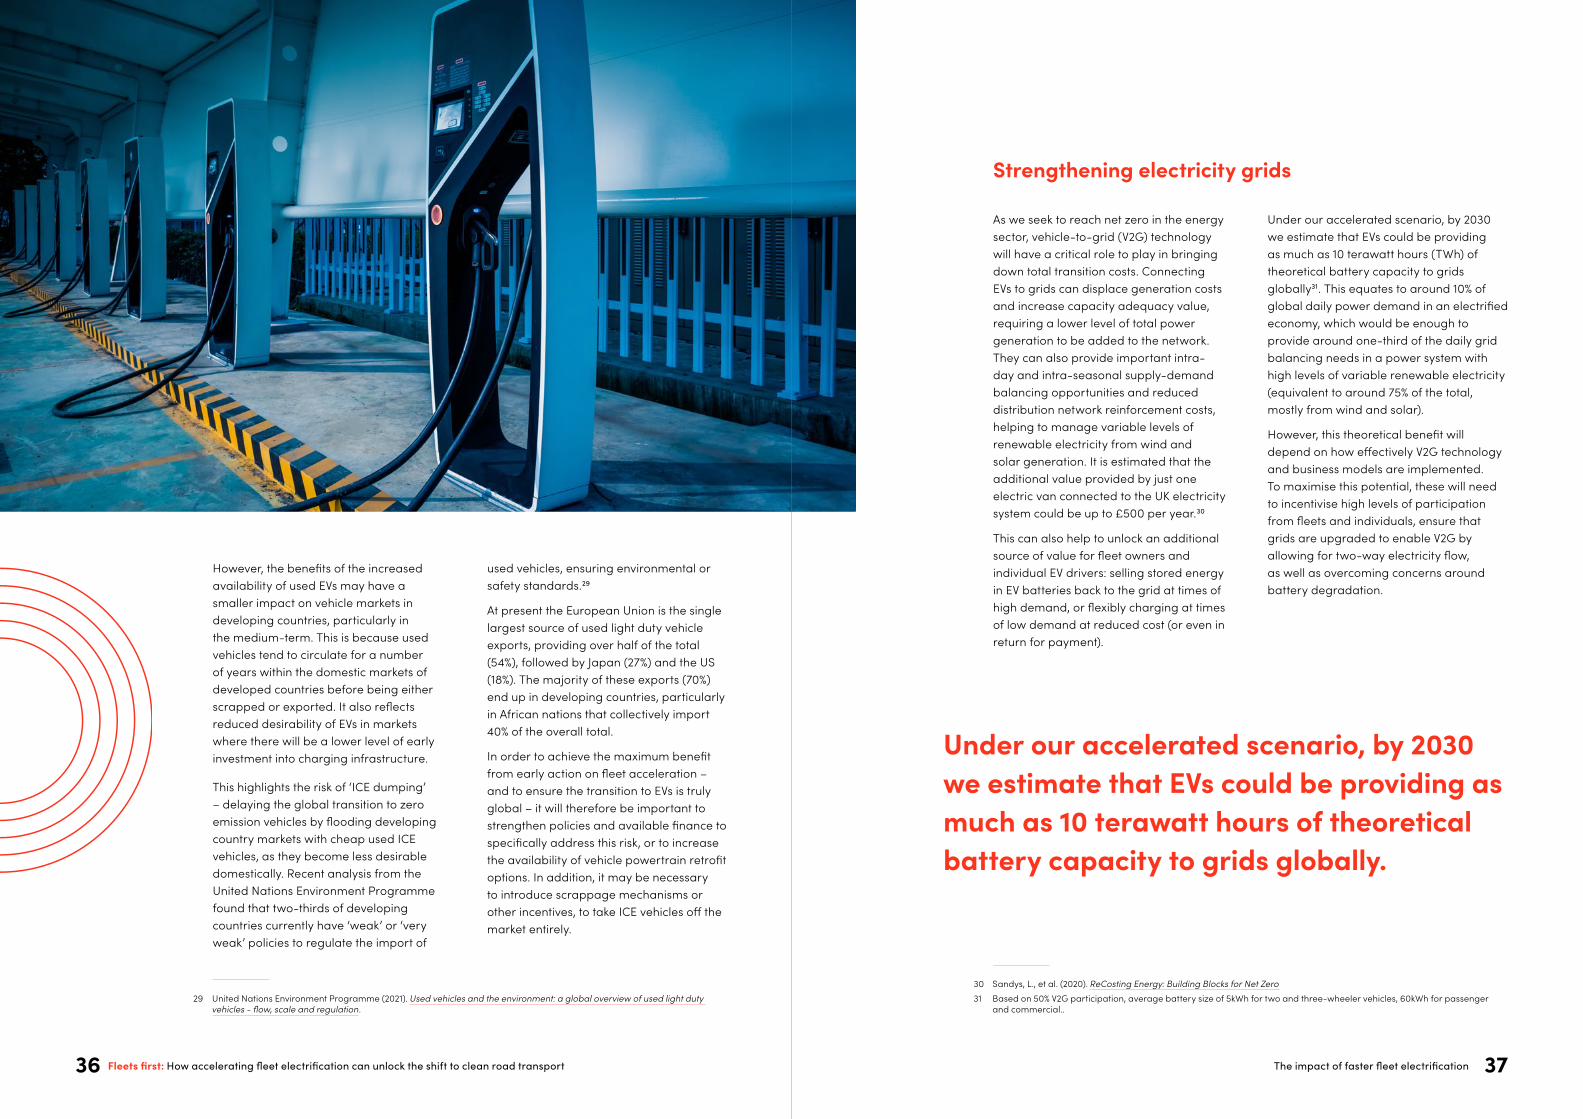
As we seek to reach net zero in the energy sector, vehicle-to-grid (V2G) technology will have a critical role to play in bringing down total transition costs. Connecting EVs to grids can displace generation costs and increase capacity adequacy value, requiring a lower level of total power generation to be added to the network. They can also provide important intra-day and intra-seasonal supply-demand balancing opportunities and reduced distribution network reinforcement costs, helping to manage variable levels of renewable electricity from wind and solar generation. It is estimated that the additional value provided by just one electric van connected to the UK electricity system could be up to £500 per year.30
This can also help to unlock an additional source of value for fleet owners and individual EV drivers: selling stored energy in EV batteries back to the grid at times of high demand, or flexibly charging at times of low demand at reduced cost (or even in return for payment).
30 Sandys, L., et al. (2020). ReCosting Energy: Building Blocks for Net Zero31 Based on 50% V2G participation, average battery size of 5kWh for two and three-wheeler vehicles, 60kWh for passenger
and commercial..
Under our accelerated scenario, by 2030 we estimate that EVs could be providing as much as 10 terawatt hours of theoretical battery capacity to grids globally.
Under our accelerated scenario, by 2030 we estimate that EVs could be providing as much as 10 terawatt hours (TWh) of theoretical battery capacity to grids globally31. This equates to around 10% of global daily power demand in an electrified economy, which would be enough to provide around one-third of the daily grid balancing needs in a power system with high levels of variable renewable electricity (equivalent to around 75% of the total, mostly from wind and solar).
However, this theoretical benefit will depend on how effectively V2G technology and business models are implemented. To maximise this potential, these will need to incentivise high levels of participation from fleets and individuals, ensure that grids are upgraded to enable V2G by allowing for two-way electricity flow, as well as overcoming concerns around battery degradation.
Strengthening electricity grids
However, the benefits of the increased availability of used EVs may have a smaller impact on vehicle markets in developing countries, particularly in the medium-term. This is because used vehicles tend to circulate for a number of years within the domestic markets of developed countries before being either scrapped or exported. It also reflects reduced desirability of EVs in markets where there will be a lower level of early investment into charging infrastructure.
This highlights the risk of ‘ICE dumping’ – delaying the global transition to zero emission vehicles by flooding developing country markets with cheap used ICE vehicles, as they become less desirable domestically. Recent analysis from the United Nations Environment Programme found that two-thirds of developing countries currently have ‘weak’ or ‘very weak’ policies to regulate the import of
used vehicles, ensuring environmental or safety standards.29
At present the European Union is the single largest source of used light duty vehicle exports, providing over half of the total (54%), followed by Japan (27%) and the US (18%). The majority of these exports (70%) end up in developing countries, particularly in African nations that collectively import 40% of the overall total.
In order to achieve the maximum benefit from early action on fleet acceleration – and to ensure the transition to EVs is truly global – it will therefore be important to strengthen policies and available finance to specifically address this risk, or to increase the availability of vehicle powertrain retrofit options. In addition, it may be necessary to introduce scrappage mechanisms or other incentives, to take ICE vehicles off the market entirely.
29 United Nations Environment Programme (2021). Used vehicles and the environment: a global overview of used light duty vehicles - flow, scale and regulation.
Fleets first: How accelerating fleet electrification can unlock the shift to clean road transport The impact of faster fleet electrification 36 37
Accelerated scenario – battery price learning curve
2023
61
52
20202015 20302024
-14%
Historic learning curve
Baseline scenario – learning curve
Accelerated scenario – learning curve
Batt
ery
Pric
e pr
ice
(US$
/kW
h)
1200
1000
800
600
400
200
020202019 2021 2022 2023 2024 2026 2027 2028 20292025 2030
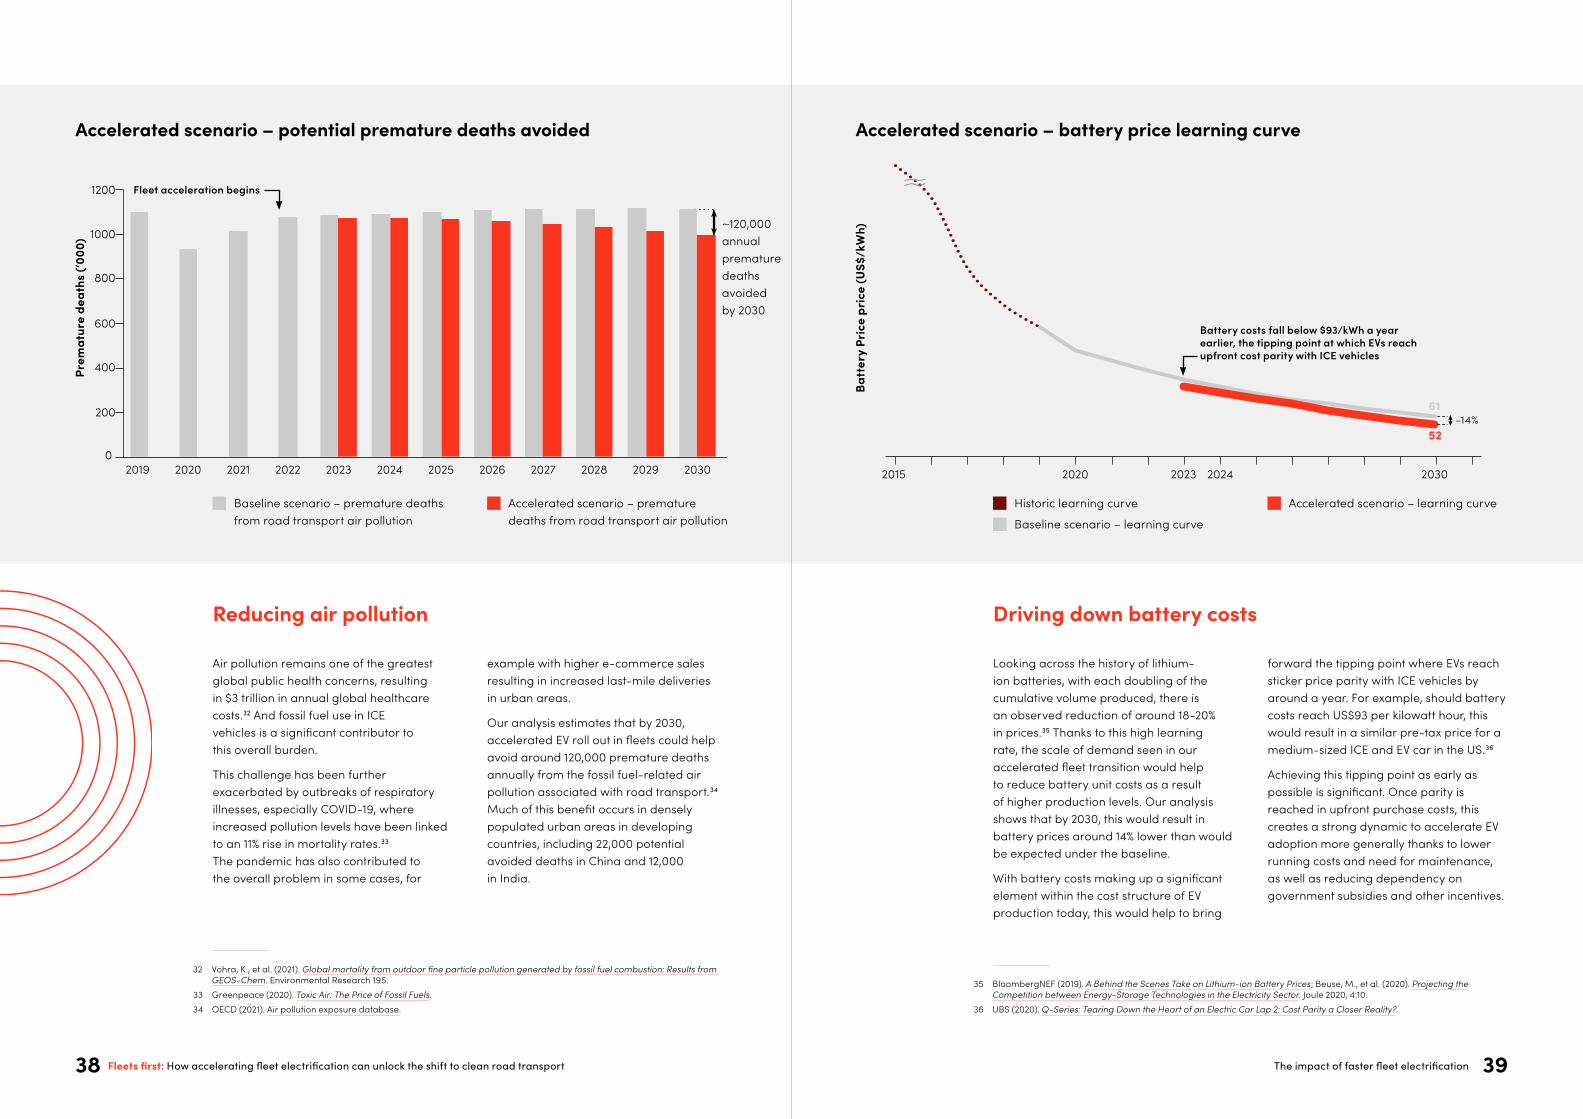
Accelerated scenario – potential premature deaths avoided
Baseline scenario – premature deaths from road transport air pollution
Accelerated scenario – premature deaths from road transport air pollution
Fleet acceleration begins
Battery costs fall below $93/kWh a year earlier, the tipping point at which EVs reach upfront cost parity with ICE vehicles
Prem
atur
e de
aths
(‘00
0)
~120,000 annual premature deaths avoided by 2030
Looking across the history of lithium-ion batteries, with each doubling of the cumulative volume produced, there is an observed reduction of around 18-20% in prices.35 Thanks to this high learning rate, the scale of demand seen in our accelerated fleet transition would help to reduce battery unit costs as a result of higher production levels. Our analysis shows that by 2030, this would result in battery prices around 14% lower than would be expected under the baseline.
With battery costs making up a significant element within the cost structure of EV production today, this would help to bring
forward the tipping point where EVs reach sticker price parity with ICE vehicles by around a year. For example, should battery costs reach US$93 per kilowatt hour, this would result in a similar pre-tax price for a medium-sized ICE and EV car in the US.36
Achieving this tipping point as early as possible is significant. Once parity is reached in upfront purchase costs, this creates a strong dynamic to accelerate EV adoption more generally thanks to lower running costs and need for maintenance, as well as reducing dependency on government subsidies and other incentives.
Driving down battery costs
35 BloombergNEF (2019). A Behind the Scenes Take on Lithium-ion Battery Prices; Beuse, M., et al. (2020). Projecting the Competition between Energy-Storage Technologies in the Electricity Sector. Joule 2020, 4:10.
36 UBS (2020). Q-Series: Tearing Down the Heart of an Electric Car Lap 2: Cost Parity a Closer Reality?.
Air pollution remains one of the greatest global public health concerns, resulting in $3 trillion in annual global healthcare costs.32 And fossil fuel use in ICE vehicles is a significant contributor to this overall burden.
This challenge has been further exacerbated by outbreaks of respiratory illnesses, especially COVID-19, where increased pollution levels have been linked to an 11% rise in mortality rates.33 The pandemic has also contributed to the overall problem in some cases, for
example with higher e-commerce sales resulting in increased last-mile deliveries in urban areas.
Our analysis estimates that by 2030, accelerated EV roll out in fleets could help avoid around 120,000 premature deaths annually from the fossil fuel-related air pollution associated with road transport.34 Much of this benefit occurs in densely populated urban areas in developing countries, including 22,000 potential avoided deaths in China and 12,000 in India.
Reducing air pollution
32 Vohra, K., et al. (2021). Global mortality from outdoor fine particle pollution generated by fossil fuel combustion: Results from GEOS-Chem. Environmental Research 195.
33 Greenpeace (2020). Toxic Air: The Price of Fossil Fuels.34 OECD (2021). Air pollution exposure database.
Fleets first: How accelerating fleet electrification can unlock the shift to clean road transport The impact of faster fleet electrification 38 39
10
0
30
20
40
60
70
50
80
100
90
110
202920272019 2020 2021 2022 2023 2024 2025 2026 2028 2030
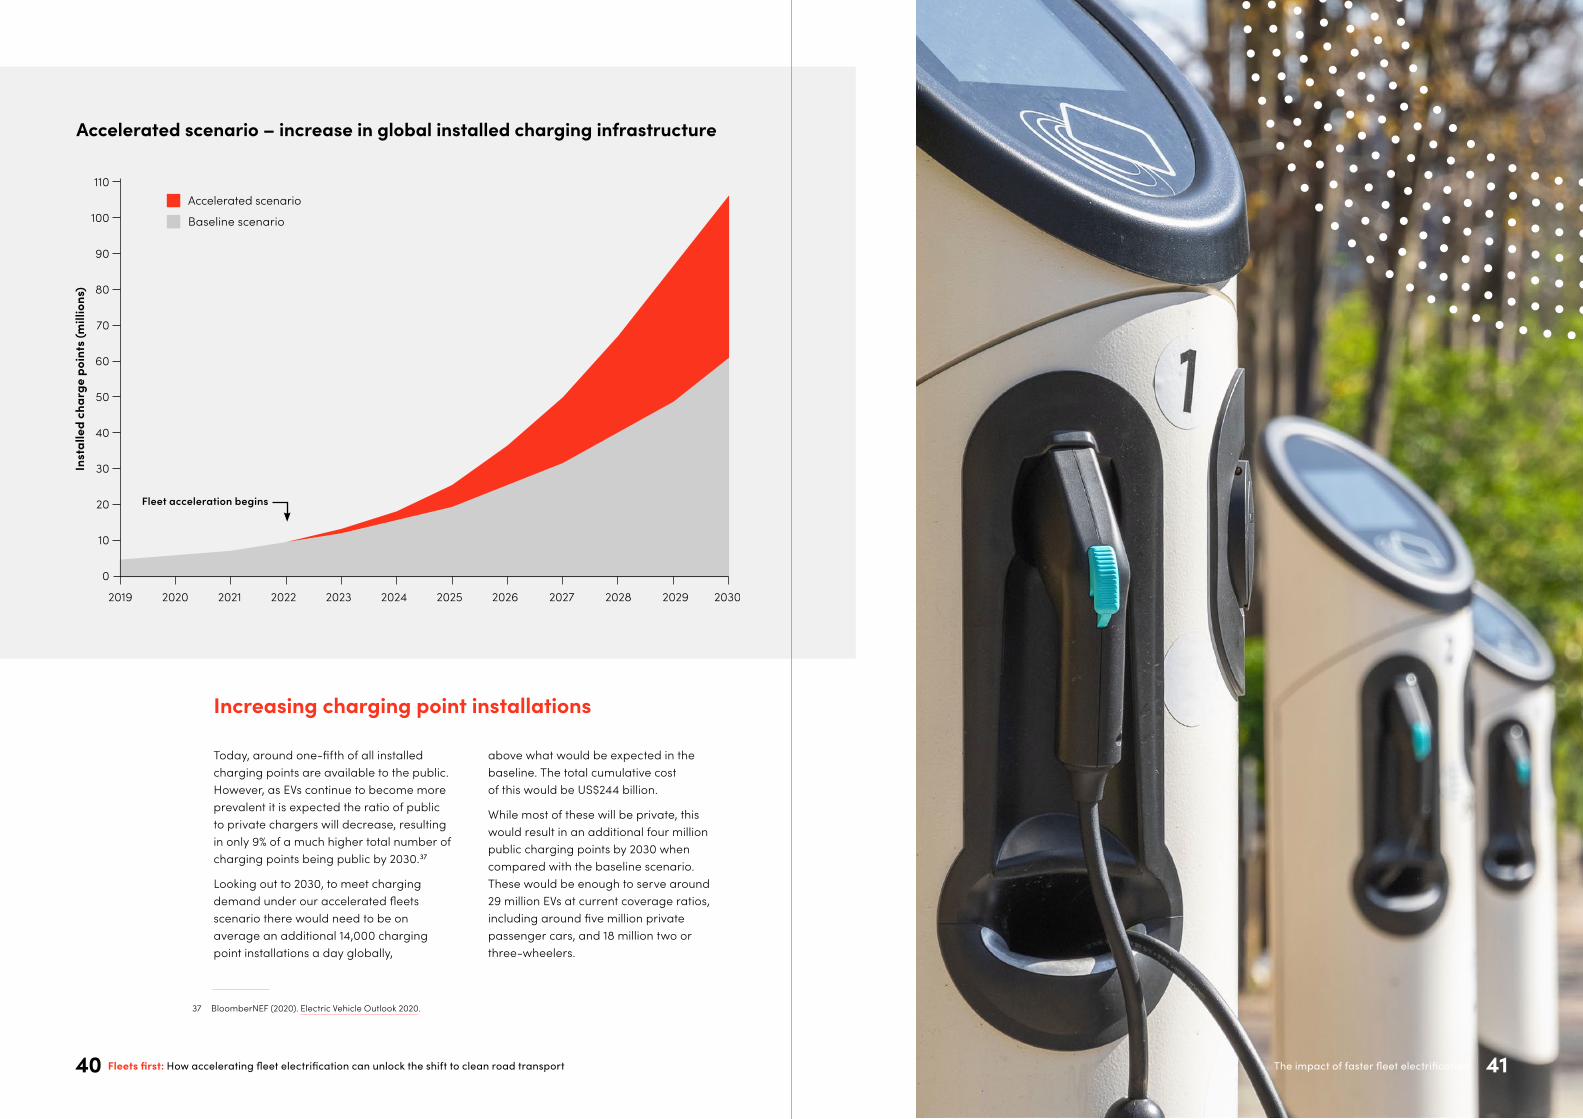
Accelerated scenario – increase in global installed charging infrastructure
Accelerated scenario
Baseline scenario
Inst
alle
d ch
arge
poi
nts
(mill
ions
)
Fleet acceleration begins
Today, around one-fifth of all installed charging points are available to the public. However, as EVs continue to become more prevalent it is expected the ratio of public to private chargers will decrease, resulting in only 9% of a much higher total number of charging points being public by 2030.37
Looking out to 2030, to meet charging demand under our accelerated fleets scenario there would need to be on average an additional 14,000 charging point installations a day globally,
above what would be expected in the baseline. The total cumulative cost of this would be US$244 billion.
While most of these will be private, this would result in an additional four million public charging points by 2030 when compared with the baseline scenario. These would be enough to serve around 29 million EVs at current coverage ratios, including around five million private passenger cars, and 18 million two or three-wheelers.
Increasing charging point installations
37 BloomberNEF (2020). Electric Vehicle Outlook 2020.
The impact of faster fleet electrification 41Fleets first: How accelerating fleet electrification can unlock the shift to clean road transport40
38 Fridstrøm, L. (2021). The Norwegian Vehicle Electrification Policy and Its Implicit Price of Carbon. Sustainability 2021, 13:1346.
vehicle stock with zero emission electricity, through corporate PPAs, green tariffs, or certificates for renewable energy. In turn, this will help strengthen the business case for accelerating the build out of clean energy infrastructure.
In March 2021, Uber signed an agreement with Italy’s Enel Green Power for a share in a PPA for the energy generated by the Azure Sky wind-and-storage project in Texas. Governments can also support this, by making it a condition for qualifying for financial incentives, a policy already in existence in Austria.
Putting in place supportive EV policy frameworkPolicy support is essential to positively influence demand and supply dynamics for EVs. And this can happen at all levels of government – national, subnational, and supranational – depending on jurisdictional powers.
There is an increasing evidence base around which policy levers are proving to be effective. These include regulation requiring the phase out of ICE vehicles, either through outright bans, or introducing escalating emission standards, taxes, or road tolls. Examples include California’s executive order requiring zero emission light duty vehicle sales by 2035; the European Union’s CO2 standards for cars and vans; China requiring manufacturers to reach a certain percentage of zero emission vehicle sales; and Norway’s high tax on ICE vehicles.38 These instruments send very clear signals to vehicle manufacturers about the required pace of transition, and what will be required in order to remain competitive.
These measures need to be coupled with supportive policy to boost EV sales and ensure capital flows into new vehicle and battery production, especially until upfront price parity is reached. These could include grants or subsidies for purchases of new or used EVs, offering guarantees or tax advantages for investment into battery manufacturing, or reviewing tax codes to change the benefit-in-kind rate for EVs.
Fleet owners and operators need to provide a strong demand signal for EVs through joining collective commitments such as EV100, or making clear public statements of intent.
This will help trigger the necessary investments in increased production from automotive manufacturers, in charging infrastructure, and within the battery value chain. Both the overall number of EVs available, and the variety of models, will need to be boosted significantly to meet the needs of fleets and encourage take-up.
Major fleet owners have the additional opportunity to stimulate this investment by providing bankable long-term offtake agreements with automotive manufacturers and suppliers in the battery
value chain. This is particularly important in the LCV sector, where the availability of EV models and investments by automotive manufacturers are both still trailing behind passenger cars.
For example, the UK-headquartered EV manufacturing start-up, Arrival, received a preorder for 10,000 purpose built delivery vehicles from UPS as part of a contract worth up to US$1.2 billion. In part thanks to this, the company was able to list on the Nasdaq at a valuation of US$13 billion, raising US$660 million through the IPO to invest into vehicle manufacturing scale up.
To ensure emission savings are maximised, fleets should also aim to match the energy demand of EVs in their
Making ithappen
A fleets‑forward approach to electrification is possible and will bring many benefits. But businesses and policy makers need to act today make this accelerated scenario a reality.
Unleashing the power of demand
Fleets first: How accelerating fleet electrification can unlock the shift to clean road transport Making it happen42 43

At the same time, advanced countries should support research and development to spur technology innovation and cost reduction.
At a more local level, the implementation of low or zero emission areas in cities,39 or emission-related tolls, has become a strong driver to stimulate EV demand. In particular, this has increased the utility and value of EVs in urban environments, leading to an earlier tipping point in the economics of EV ownership by providing a significant total cost of ownership advantage for vehicles such as taxis and last-mile delivery fleets. It can also help solve a number of serious issues faced by cities, such as air quality challenges and noise levels.
Governments can also show leadership by using their own procurement power to shift markets and increase visibility of EV purchases within their own fleets. For example, in the US there are more than one million vehicles in federal and municipal fleets. Our analysis shows that if all these were switched to electric by 2030, it would set an important example of leadership and result in avoiding around 22.5 million tonnes of CO2 a year by 2030.
Getting charging infrastructure built ahead of demandInsufficient availability of charging is a serious constraining factor for an accelerated shift to electric mobility. If you can’t charge easily, you’re far less likely to switch.
Utilities, charging businesses, and local authorities need to collaborate for the timely build-out of charging infrastructure and strengthening of local distribution
39 McKinsey and the World Economic Forum recently produced a Zero Emission Area Handbook for The Global New Mobility Coalition that provides best practice guidance on policy design and implementation.
networks, particularly along major transport corridors. And this is an area where effective private sector and public-private collaboration will be important.
Utilities have a critical role and need to act early. Before installing charging points, there is often a requirement to strengthen local distribution networks, including sub-station upgrades, cable reinforcement, and introducing additional operational capabilities. The lead time for such network upgrades typically ranges from two to five years, making pre-emptive investments in power distribution networks a vital first step, particularly where fast or rapid charging will be required. Mechanisms are also needed to allocate costs fairly between all likely beneficiaries, to prevent a first-mover disadvantage.
There is a powerful business case for action. EV charging represents an important future demand source and revenue stream for utilities, as well as unlocking V2G opportunities for flexibility and balancing, which reduce system costs for utilities. The Spain-headquartered electric utility company, Iberdrola, has already formed agreements with several automotive manufacturers and fleet owners to supply and install charging stations, and continues to grow this area of its business.
Governments also have several levers they can pull in order to boost the installation of charging points. This includes direct investment, such as in London where the city is funding rapid chargers to serve users such as taxis and commercial delivery vans. Although more commonly this will be done through incentives, such as tax breaks and grants. For example, in Canada the Electric Vehicle and Alternative Fuel Infrastructure Deployment Initiative provides partial rebates in strategic locations and for multi-user charging infrastructure deployment.
Beyond this, there needs to be an efficient structure put in place to ensure planning permission for building charging points. One option here is that local authorities can provide utilities with regulatory pre-approval to build ‘charger-ready’ sites or put in place mechanisms that give charging businesses the ability to build on city property. They can also put in place EV-readiness provisions within building codes and new development regulations, or make it easier for companies to invest in their own onsite charging for employees and customers by removing red tape.
In San Francisco, a green building code regulation requires 100% of parking spaces in all new commercial and residential buildings to be EV-ready. While Stockholm in Sweden has created a Master Charging Plan that guides private investment into priority areas for public charging investment.
Finally, it is essential that there is consensus on standards, including harmonised protocols for hardware and technology that can ensure interoperability. The value of networks is significantly enhanced if all charging points can be effectively used by all EVs. Although it seems that there is an emerging consensus on these standards within leading regions, such as the European Union, which are expected to be put into regulations in the near future.
Scaling up alternative financing schemes and new business models The accelerated transition of fleets to EVs could herald the beginning of a rapid shift to clean road transport. In this transition, there are a range of exciting emerging opportunities for financial institutions, charging companies, vehicle leasing firms, and automotive manufacturers. These include new financing products designed specifically
for EVs, aggregating revenues from V2G services, and the retrofit of ICE vehicles.
Innovations such as charging-as-a-service, and battery leasing or swapping are already helping to alleviate issues and concerns for fleet owners. This can help them to overcome critical barriers that may prevent them from taking advantage of total cost of ownership advantages offered by EVs today. Fleets are also well suited to be early adopters of these disruptive business models since they have journey times and routes that are often both longer and more predictable than those of private vehicle owners.
For example, the EV charging and energy management provider, AMPLY Power, offers a charging-as-a-service solution to fleet operators that includes fixed prices, guaranteed performance, and full fleet management from design to maintenance. And fleet leasing company Athlon worked with Spanish electric utility company Endesa to create OneElectric, a new leasing product that includes an EV, insurance, maintenance and tyres, as well as the installation of charging points both in the workplace and at the homes of employees using a company car.
With COP26 rapidly approaching, the time to act is now. In November 2021, the world will be watching to see if governments and businesses will live up to their pledges to reach net zero as the COP26 climate talks take place in Glasgow. The UK COP26 Presidency has made clean road transport and the shift to zero emission vehicles one of the major campaign themes for the conference. Supporting an accelerated roll out of EVs through a fleets-first approach offers a realistic, highly-visible way of speeding up the low carbon transition in the next decade.
Fleets first: How accelerating fleet electrification can unlock the shift to clean road transport Making it happen44 45

CAGRCompound annual growth rate
CO2eCarbon dioxide equivalent
Fleet/fleet vehicleIn the context of this report this refers to any motorised vehicle controlled – either wholly or partially – by a business, government agency or other organisation, including through shared mobility platforms
EVElectric vehicle – in the context of the accelerated scenario in this term is used solely to refer to vehicles powered by a battery electric powertrain, and excludes plug-in hybrids
FCEVFuel cell electric vehicle, producing electricity from compressed hydrogen
GHGGreenhouse gas
GigafactoryA battery manufacturing facility with very high production capacity
HybridA vehicle that uses both a battery electric powertrain and an internal combustion engine
ICEInternal combustion engine
GlossaryLCELithium carbonate equivalent
LCV Light commercial vehicle, such as vans
Light duty vehiclesMotorised vehicles under 3.5 tonnes, including two and three-wheelers, passenger cars, and vans
MHDVMedium and heavy duty vehicles, such as trucks
PHEVPlug-in hybrid electric vehicle, a hybrid that can be charged from the mains
TCOTotal cost of ownership
S-CurveThe description of an “S” shaped curve following a sigmoid function, that shows slow initial growth that rapidly accelerates, before slowing again
V2GVehicle to grid – a smart technology allowing electric vehicles to selectively charge from the electricity grid when there is lower demand, or return stored electricity to the grid when there is higher demand
Glossary 4746 Fleets first
EV100 is a global initiative led by the Climate Group, which brings together companies committed to making electric transport the new normal by 2030. A large part of the new global vehicle (EV) fleet are purchased by companies, so it’s crucial that businesses lead the shift to electric vehicles through their investment decisions and influence on millions of staff and customers worldwide. Members are increasing demand, influencing policy, and driving mass roll out, helping to make electric cars more rapidly affordable for everyone.
#EV100
The Climate Group drives climate action. Fast. Our goal is a world of net zero carbon emissions by 2050, with greater prosperity for all. We focus on systems with the highest emissions and where our networks have the greatest opportunity to drive change. We do this by building large and influential networks and holding organisations accountable, turning their commitments into action. We share what we achieve together to show more organisations what they could do. We are an international non-profit organisation, founded in 2004, with offices in London, New Delhi and New York. We are proud to be part of the We Mean Business coalition.
Follow us on @ClimateGroup
The Climate Change Organisation (The Climate Group) with Company Registration Number: 4964424 and Charity Registration Number: 1102909The Climate Group, Inc. is a U.S. registered 501(c)3 with EIN 43-2073566M/s TCCO India Projects Private Limited with Corporate Identity Number U74999DL2018PTC334187
AcknowledgementsWe would like to thank to the team at SYSTEMIQ for their efforts in helping to scope and then delivering this project – particularly Clara Luckner, Abindra Soemali, Faustine Delasalle, Mark Meldrum, and Laëtitia de Villepin.
We’d also like to express our gratitude to Colin McKerracher and his team at BloombergNEF for generously providing access to the underlying data that formed the bedrock of our analysis, as well as offering additional guidance in refining our assumptions.
We are hugely appreciative of everyone that participated in our expert interview series, providing the insights that allowed us to build and improve our scenario model, as well helping to develop impactful policy recommendations.
The Climate Group is grateful to the organisations that support our work with fleets and on the wider transport system, including: Quadrature Climate Foundation, ClimateWorks Foundation, the We Mean Business coalition, New York Community Trust, European Climate Foundation, Tara, William and Flora Hewlett Foundation, the Urban Mobility Innovation Fund, Scottish Government, Gouvernement du Québec, BT Group, LeasePlan, Royal Mail, and Lloyds Banking Group.
Analysis: SYSTEMIQ, Climate Group
Words: Jamie Plotnek, Katie Rogers, Catherine Early
Design: Alchemy Mill
SYSTEMIQ is a B Corp created in 2016 to drive achievement of the UN Sustainable Development Goals and the Paris Agreement by transforming markets and business models across three areas: land use, materials and energy. Working with partners across sectors, SYSTEMIQ aims to unlock economic opportunities that benefit business, society and the environment.
To learn more, visit www.systemiq.earth
RouteZero is a COP26 ambition platform for zero emission vehicles led by the Climate Group and UN High Level Climate Champions. It brings together organisations and initiatives from around the world to call for increased ambition and action on zero emission vehicles and showcase what’s possible. By adding visibility to growing demand, transformational technologies, bold policymaking, and exciting new business opportunities, RouteZero sends a clear signal to governments, investors and automotive manufacturers that the race to zero emission vehicles is on and can go even faster.
#RouteZero
The ZEV Community brings together all levels of governments to share and learn about exciting zero emission vehicle initiatives taking place around the world. It’s co-hosted by the Under2 Coalition and the ZEV Alliance, in partnership with C40 Cities and the U.S. Climate Alliance, and is supported by the Scottish Government and the ClimateWorks Foundation.