cez group: the leader in power markets of … leader in power markets of central and southeastern...
TRANSCRIPT
CEZ GROUP: THE LEADER IN POWER MARKETS
OF CENTRAL AND SOUTHEASTERN EUROPE
Investment story, November 2017

AGENDA
1
Introduction, strategic priorities
Traditional Generation
Regulated and New Energy
Financial performance
Summary
Backup
Electricity market fundamentals
Project of new nuclear in the Czech Republic
EU ETS, derogation scheme in the CR
Regulation of distribution
Renewables support schemes
2017 generation outlook, weld checks
Latest and historical financial results
1
7
16
23
29
31
32
35
36
38
41
43
46
5.3
5.5
8.2
11.5
22.0
23.0
21.4
34.5
37.6
60.0
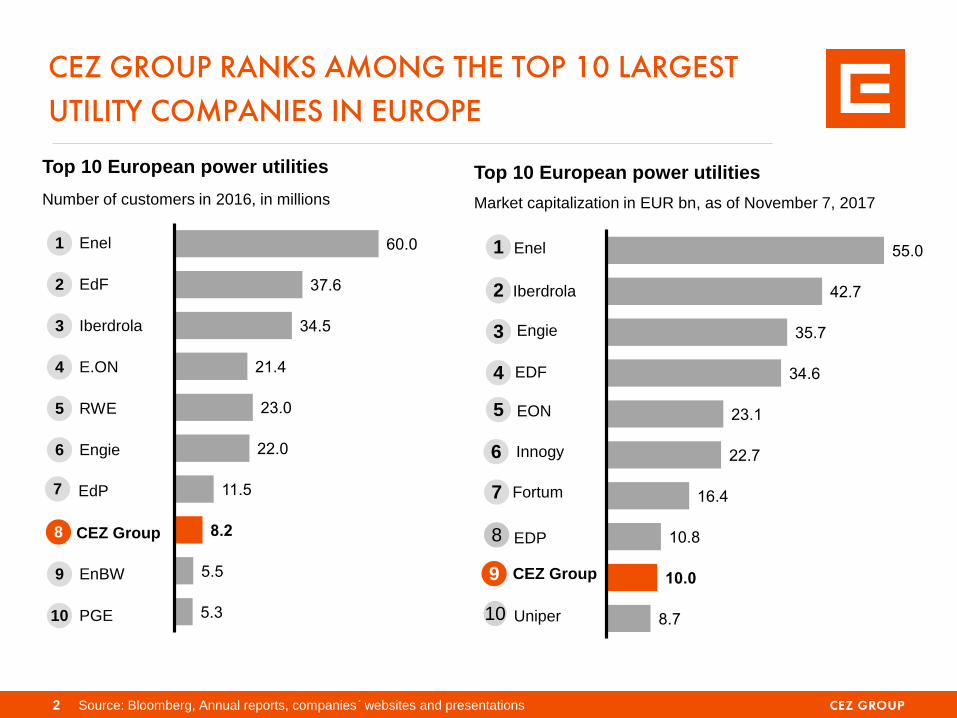
CEZ GROUP RANKS AMONG THE TOP 10 LARGEST
UTILITY COMPANIES IN EUROPE
Source: Bloomberg, Annual reports, companies´ websites and presentations
Top 10 European power utilities
Number of customers in 2016, in millions
PGE 10
Enel 1
EdF 2
Iberdrola 3
E.ON 4
RWE 5
Engie 6
CEZ Group 8
EnBW 9
EdP 7
2
Top 10 European power utilities
Market capitalization in EUR bn, as of November 7, 2017
9
1
2
3
4
5
6
10
8
7
EDF
Enel
Iberdrola
EON
Engie
EDP
Innogy
Fortum
Uniper
CEZ Group
8.7
10.0
10.8
16.4
22.7
23.1
34.6
35.7
42.7
55.0

CEZ GROUP IS AN INTERNATIONAL UTILITY
WITH A STRONG POSITION IN CEE AND GROWING
PRESENCE IN WESTERN EUROPE
3
CEZ Group in France
Renewables
CEZ Group in Bulgaria
Renewables
Distribution
Sales
CEZ Group in Turkey*
Traditional Generation
Renewables
Distribution
Sales
*(50% stake in SEDAS through AkCez, 37.36% stake in Akenerji)
CEZ Group in Poland
Traditional Generation
Renewables
ESCO, Sales
CEZ Group in Romania
Renewables
Distribution
Sales
CEZ Group in the Czech
Republic
Mining
Traditional Generation
Renewables
Distribution
ESCO, Sales
CEZ Group in Germany
Renewables
ESCO, Sales

CZECH REPUBLIC IS THE MOST IMPORTANT MARKET
FOR CEZ GROUP, IT IS VERTICALLY INTEGRATED THERE
Source: CEZ, ERU, MPO, data for 2016 4
CEZ fully owns the
largest Czech
mining company
(SD) covering 68%
of CEZ’ s lignite
needs
Remaining 3 coal
mining companies
are privately owned
The Czech
transmission grid is
owned and
operated by CEPS,
100% owned by
the Czech state
Lignite mining Generation Transmission Distribution Supply
CEZ
Others
65%
35.0 TWh
55%
21.4 million tons
45%
17.1 million tons
68%
56.9 TWh
32%
26.4 TWh
100%
63.9 TWh 68%
41.3 TWh 35%
19.2 TWh
Other competitors –
individual IPPs Other competitors –
E.ON, PRE (58%
held by EnBW),
Bohemia Energy,
Innogy, Centropol
Energy
32%
19.6 TWh
3.4
20.4
5.5
Segmentalsplit (CZK bn)
Geographicalsplit (%)
81%
19%
4.4
22.0
2.4
Segmentalsplit (CZK bn)
Geographicalsplit (%)
96%
4%
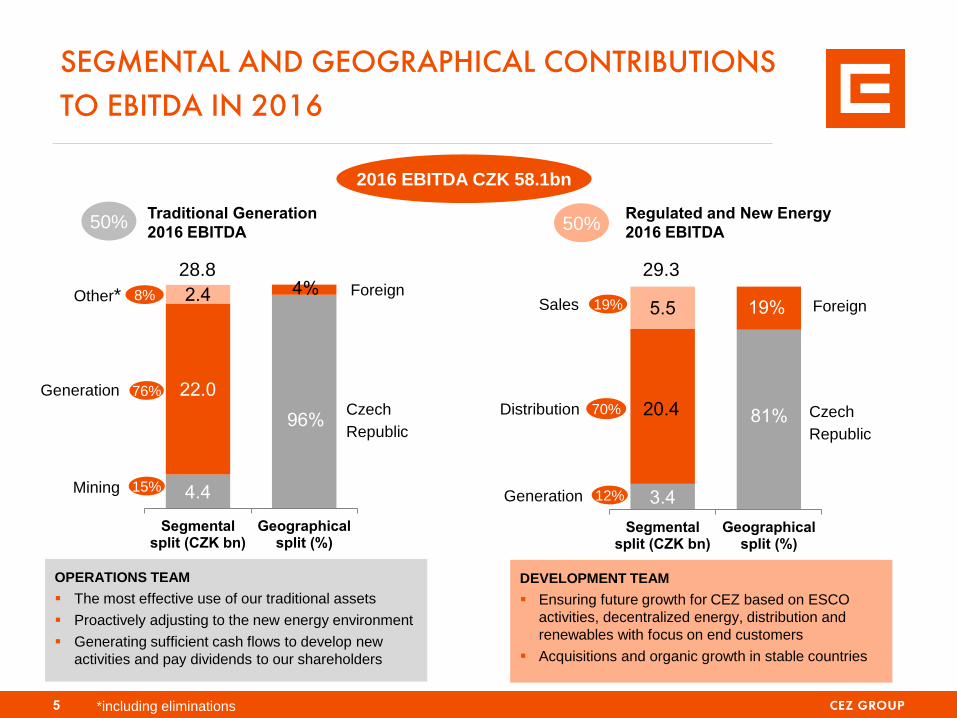
SEGMENTAL AND GEOGRAPHICAL CONTRIBUTIONS
TO EBITDA IN 2016
5 *including eliminations
Mining
Generation
Other*
Generation
Distribution
Sales
OPERATIONS TEAM
The most effective use of our traditional assets
Proactively adjusting to the new energy environment
Generating sufficient cash flows to develop new
activities and pay dividends to our shareholders
DEVELOPMENT TEAM
Ensuring future growth for CEZ based on ESCO
activities, decentralized energy, distribution and
renewables with focus on end customers
Acquisitions and organic growth in stable countries
Czech
Republic
Foreign
2016 EBITDA CZK 58.1bn
Foreign
Czech
Republic
15%
76%
8%
12%
70%
19%
Traditional Generation
2016 EBITDA 50%
Regulated and New Energy
2016 EBITDA 50%
28.8 29.3

CEZ GROUP’S STRATEGY AIMS AT MAXIMISING CASH FLOW FROM ITS TRADITIONAL BUSINESS AND INCREASING PRESENCE IN RENEWABLES, ESCO AND DISTRIBUTED ENERGY
THREE PILLARS OF CEZ GROUP’S STRATEGY
Be among the best in the operation
of conventional electricity
generation
and proactively respond to the
challenges of the 21st century
I
6
Strategy execution split between Operations and Development
Teams (including setting of Quantitative goals until 2020)
Operations Team – additional CZK 3 bn EBITDA by 2020*
Cost reductions and efficiency increase in support services
Power Generation and Mining optimization
Strengthening position in the Heat market
Development Team - additional CZK 6 bn EBITDA by
2020*
Acquisitions and Development in Renewable Generation,
ESCO and distribution in Western and Central Europe
Acquisition potential up to CEZ Group´s leverage of 3x Net
Debt / EBITDA
Optimization of Distribution operations and Sales to retail
Venture-type investments in Energy related areas in Europe
* EBITDA improvement upon the Business plan (from Sept 2015) for 2020
Offer a wide range of products and
services to customers, which
address their energy needs
II
Strengthen and consolidate our
position in the region of Central and
Western Europe, especially in
Renewables
III

AGENDA
7
Introduction, strategic priorities
Traditional Generation
Regulated and New Energy
Financial performance
Summary
Backup
Electricity market fundamentals
Project of new nuclear in the Czech Republic
EU ETS, derogation scheme in the CR
Regulation of distribution
Renewables support schemes
2017 generation outlook, weld checks
Latest and historical financial results
1
7
16
23
29
31
32
35
36
38
41
43
46

8
CEZ GROUP OPERATES LOW COST GENERATION
FLEET
Installed capacity and generation (2016)
CEZ has a long-term competitive
advantage of low and relatively stable
generation costs
2,829 3.7
4,290 24.1
4,937
26.2
2,817 5.3
845 1.8
Installedcapacity
Generation,gross
Hydro* and
renewables
Lignite /
Brown coal
Nuclear
15,718 MW 61.1 TWh
Share on
generation
39%
6%
43%
Hard coal 9%
Coal power plants are using mostly
lignite from CEZ’s own mine
(68% of lignite needs sourced internally,
remaining volume through long-term
supply contracts)
Nuclear plants have very low
operational costs
CCGT 3%
* Hydro 1,985 MW, out of which 1,170 MW in pumped-storage hydro

0.0
0.4
0.7
1.1
1.5
1.9
2.2
2.6
3.0
3.3
0
10
20
30
40
50
60
70
80
90
200
6
200
7
200
8
200
9
201
0
201
1
201
2
201
3
201
4
201
5
201
6
201
7F
201
8F
201
9F
202
0F
202
1F
Other
Mining
Distribution
Generation
Net Operating CF
CEZ GROUP COMPLETED UPGRADE OF ITS LIGNITE FLEET, GOING FORWARD MAINTENANCE CAPEX ONLY
CAPEX vs Net Operating Cash Flow
Exchange rate EUR/CZK = 27.025 Net Operating CF is based on the business plan (using prices in Aug/Sep 2016, i.e. around 25 EUR/MWh).
CZK bn EUR bn
9
* Primarily Polish wind farms, whose
execution is dependent on regulatory
developments
** of which CZK 13 bn outside Czech Rep.
Total CAPEX during 2017-2021
(in CZK bn)
Generation - traditional 57
Generation – new*
energy
4
Distribution ** 66
Mining 13
Other (including sales) 21
CAPEX Upgrade of
the lignite fleet
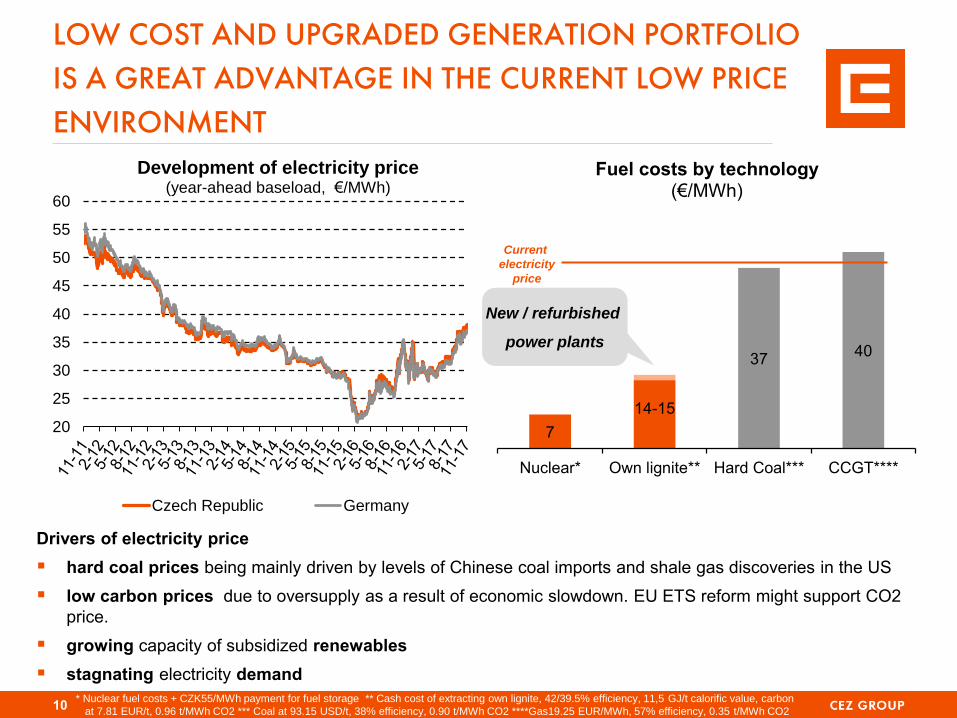
LOW COST AND UPGRADED GENERATION PORTFOLIO
IS A GREAT ADVANTAGE IN THE CURRENT LOW PRICE
ENVIRONMENT
10
20
25
30
35
40
45
50
55
60
Development of electricity price (year-ahead baseload, €/MWh)
Czech Republic Germany
Drivers of electricity price
hard coal prices being mainly driven by levels of Chinese coal imports and shale gas discoveries in the US
low carbon prices due to oversupply as a result of economic slowdown. EU ETS reform might support CO2
price.
growing capacity of subsidized renewables
stagnating electricity demand
7
14-15
37 40
Nuclear* Own lignite** Hard Coal*** CCGT****
Fuel costs by technology (€/MWh)
Current
electricity
price
New / refurbished
power plants
* Nuclear fuel costs + CZK55/MWh payment for fuel storage ** Cash cost of extracting own lignite, 42/39.5% efficiency, 11,5 GJ/t calorific value, carbon
at 7.81 EUR/t, 0.96 t/MWh CO2 *** Coal at 93.15 USD/t, 38% efficiency, 0.90 t/MWh CO2 ****Gas19.25 EUR/MWh, 57% efficiency, 0.35 t/MWh CO2
11
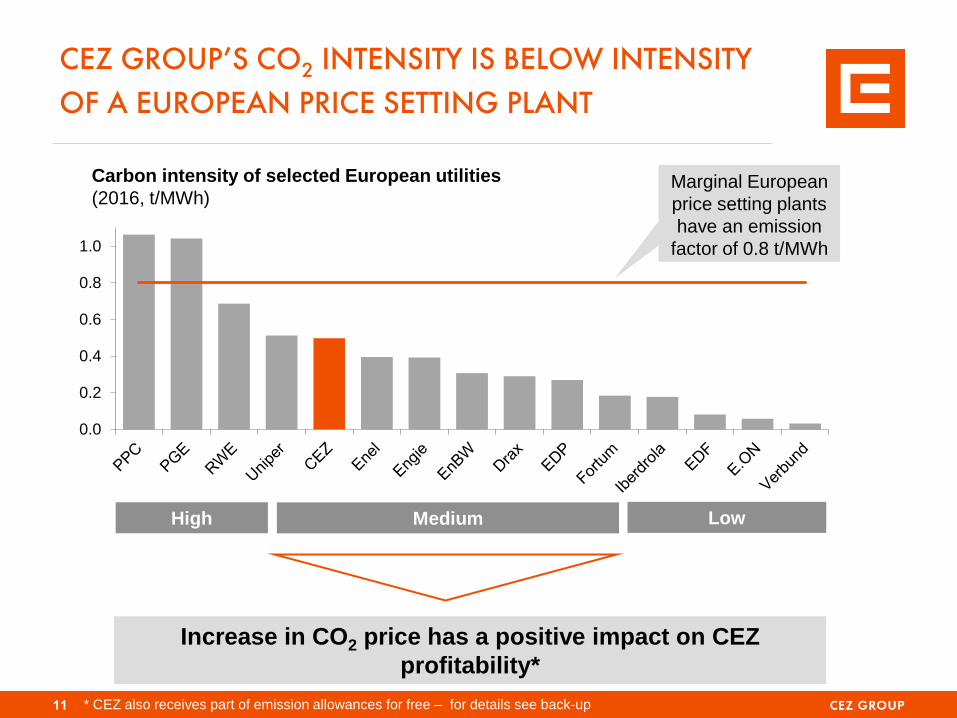
CEZ GROUP’S CO2 INTENSITY IS BELOW INTENSITY
OF A EUROPEAN PRICE SETTING PLANT
Carbon intensity of selected European utilities
(2016, t/MWh)
0.0
0.2
0.4
0.6
0.8
1.0
High Medium Low
Increase in CO2 price has a positive impact on CEZ
profitability*
Marginal European
price setting plants
have an emission
factor of 0.8 t/MWh
* CEZ also receives part of emission allowances for free – for details see back-up

OVER THE LAST YEAR THE ELECTRICITY PRICES HAVE
RISEN MAINLY DUE TO HIGHER COAL PRICES AND
UNCERTAINTY IN FRENCH NUCLEAR POWER
27,6
+3,4
+1,7
36,7
Rising Coal
Price (from
61 to 85
USD/t)
Uncertainty
in French
Nuclear
Power
+0,7
12
+3,3
Gas Price
Growth
(from 16,5
to 17,7
EUR/MWh)
Carbon Price
Growth (from
5,7 to 7,9
EUR/t)
Breakdown of factors influencing change in price of electricity since 10/2016
EUR/MWh (EEX, baseload Cal 2018)
Electricity
Price EEX
October
2016
Electricity
Price EEX
November
2017

81%
57%
26%
5% 3% 2% 0%
25%
50%
75%
100%
2018 2019 2020 2021 2022 2023
CEZ HEDGES ITS PRODUCTION GRADUALLY WITHIN
THE 3-YEAR HORIZON
Share of hedged production of CEZ* power plants (100% of electricity supplied corresponds to 55 – 56 TWh in 2018-2020)
Source: ČEZ ČEZ*—ČEZ, a. s., Energotrans, Počerady, Dětmarovice, Vítkovice 13
Hedged price (EUR/MWh, BL
equivalent)
29.5 33.0 31.0 33.0 35.5
Hedged volume as of Oct 31, 2017
Transaction currency hedging
Natural currency hedging—debts
in EUR, capital and other
expenditure and costs in EUR
Hedging of electricity price
exposure
Hedging of FX exposure to EUR
30

4.3 4.3 4.3
3.41.5 0.6
2.22.2
2.8
2.31.9
0.8
1.2
1.21.2
1.7
1.6
0.8
0.8
1.8
1.8
CEZ GROUP’S CO2 EMISSIONS INTENSITY TO
FURTHER DECLINE AS A RESULT OF CLOSURES OF
OLD LOW-PROFIT COAL UNITS
Source: CEZ
Expected development of installed capacity (GW)*
2016 2020 2025
0.50 0.40 Emission intensity
(t CO2/MWh generated) 0.35
15.7 14.2 12.9
Renewables – wind, hydro,
solar, biomass
Nuclear
Gas
Hydro – pumped storage
Lignite
New/upgraded lignite
Hard coal
Closures of old lignite and hard coal units not supplied by our own coal , i.e. units with low profit will result in decrease of the total installed capacity.
CO2 emission intensity to decrease approximately by 30%.
Varna power plant (1.26GW) sell is subject to approval of the Bulgarian antimonopoly authority (CPC). For the moment part of hard coal installed capacity.
* Includes contracted acquisitions till 2020. Growth ambition in renewables is not included.
Further development of renewables will (partly) offset the decline in the installed capacity and further decrease CO2 intensity.
14
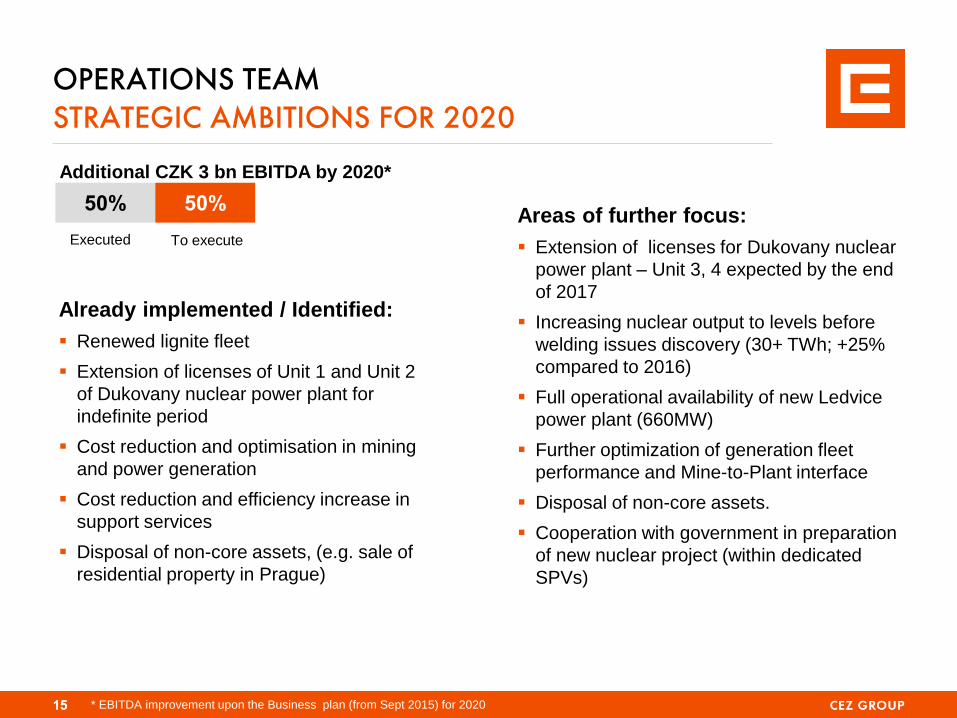
OPERATIONS TEAM STRATEGIC AMBITIONS FOR 2020
15 15
50% 50%
Executed To execute
Already implemented / Identified:
Renewed lignite fleet
Extension of licenses of Unit 1 and Unit 2
of Dukovany nuclear power plant for
indefinite period
Cost reduction and optimisation in mining
and power generation
Cost reduction and efficiency increase in
support services
Disposal of non-core assets, (e.g. sale of
residential property in Prague)
Areas of further focus:
Extension of licenses for Dukovany nuclear
power plant – Unit 3, 4 expected by the end
of 2017
Increasing nuclear output to levels before
welding issues discovery (30+ TWh; +25%
compared to 2016)
Full operational availability of new Ledvice
power plant (660MW)
Further optimization of generation fleet
performance and Mine-to-Plant interface
Disposal of non-core assets.
Cooperation with government in preparation
of new nuclear project (within dedicated
SPVs)
Additional CZK 3 bn EBITDA by 2020*
* EBITDA improvement upon the Business plan (from Sept 2015) for 2020

AGENDA
16
Introduction, strategic priorities
Traditional Generation
Regulated and New Energy
Financial performance
Summary
Backup
Electricity market fundamentals
Project of new nuclear in the Czech Republic
EU ETS, derogation scheme in the CR
Regulation of distribution
Renewables support schemes
2017 generation outlook, weld checks
Latest and historical financial results
1
7
16
23
29
31
32
35
36
38
41
43
46
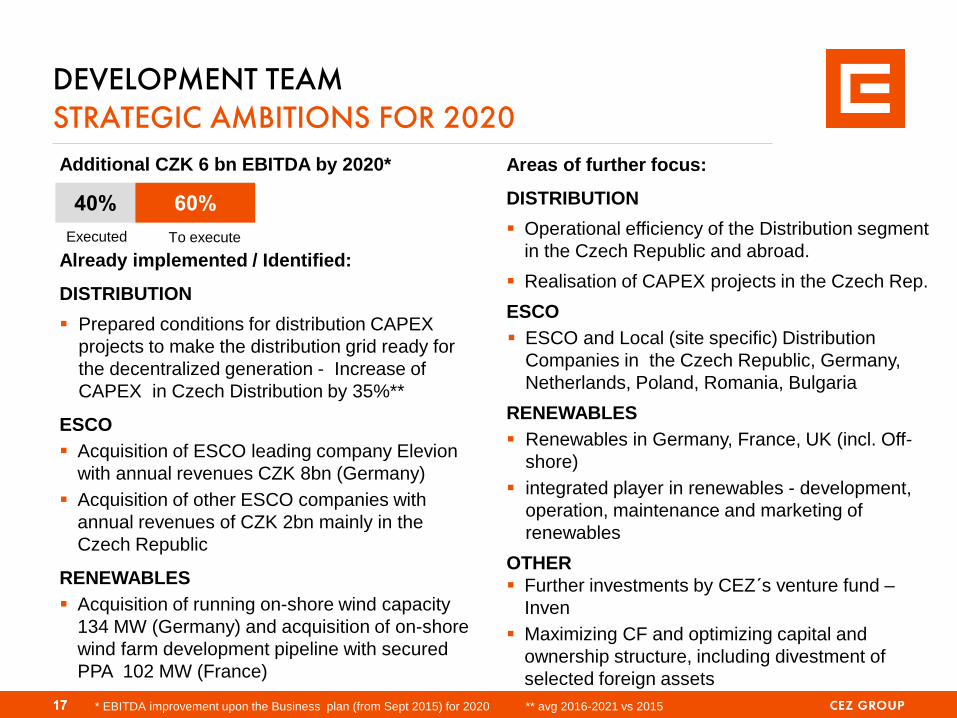
DEVELOPMENT TEAM STRATEGIC AMBITIONS FOR 2020
17 17
40% 60%
Additional CZK 6 bn EBITDA by 2020*
Executed To execute
Already implemented / Identified:
DISTRIBUTION
Prepared conditions for distribution CAPEX
projects to make the distribution grid ready for
the decentralized generation - Increase of
CAPEX in Czech Distribution by 35%**
ESCO
Acquisition of ESCO leading company Elevion
with annual revenues CZK 8bn (Germany)
Acquisition of other ESCO companies with
annual revenues of CZK 2bn mainly in the
Czech Republic
RENEWABLES
Acquisition of running on-shore wind capacity
134 MW (Germany) and acquisition of on-shore
wind farm development pipeline with secured
PPA 102 MW (France)
Areas of further focus:
DISTRIBUTION
Operational efficiency of the Distribution segment
in the Czech Republic and abroad.
Realisation of CAPEX projects in the Czech Rep.
ESCO
ESCO and Local (site specific) Distribution
Companies in the Czech Republic, Germany,
Netherlands, Poland, Romania, Bulgaria
RENEWABLES
Renewables in Germany, France, UK (incl. Off-
shore)
integrated player in renewables - development,
operation, maintenance and marketing of
renewables
OTHER
Further investments by CEZ´s venture fund –
Inven
Maximizing CF and optimizing capital and
ownership structure, including divestment of
selected foreign assets
** avg 2016-2021 vs 2015 * EBITDA improvement upon the Business plan (from Sept 2015) for 2020

8.4 10.0 10.8 10.7 10.9 10.8
2.5 3.1 2.6 2.8 2.3 2.4
0.0
5.0
10.0
15.0
2016 2017 2018 2019 2020 2021
Foreign
Czech Republic
IN 2016 CZECH DISTRIBUTION MADE UP FOR 70 % OF
DEVELOPMENT TEAM EBITDA, TRANSPARENT CZECH
REGULATION INCENTIVISES HIGHER INVESTMENTS
Czech Republic
2017
Bulgaria
2017
Romania
2017
RAB (local currency m) 92,750 544 2,384
RAB (€ m) 3,629 278 518.3
WACC pre-tax 7.951%
(nominal)
7.04% (nominal)
7.7%
(real)
Regulatory period 2016 – 2018 (2020*) 2015 - 2018 2014 - 2018
2016 EBITDA (CZK bn) 17.5 1.3 1.8
EUR/CZK = 25.56 EUR/BGN = 1.96, EUR/RON = 4.6 18
CZK bn CAPEX plan in the distribution segment
Overview of 2017 regulation parameters and 2016 EBITDA contribution
* On 31st August 2017 Energy Regulatory Office published the proposal for extension of 4th regulatory period till 31st December 2020. The proposal will
undergo a public consultation process. The final decision is expected to be published at the end of 2017 latest.

THE GERMAN ACQUISITION IS A MAJOR STEP TOWARD
FULFILLING OUR STRATEGIC AMBITIONS IN ESCO
19
Having acquired the ELEVION group, CEZ Group more than doubled the number
of its experts in ESCO services and already generates annual sales of approx.
CZK 13bn today.
The potential for CEZ Group’s dynamic growth in ESCO is amplified by the EU
countries’ commitment to major energy savings by 2030.
We estimate investment costs needed for the fulfilment of the EU energy efficiency directive until 2030 (derived
from GDP growth) at approx. EUR 600bn in Germany and approx. CZK 700bn in the Czech Republic.
However, high demand for ESCO services in the future is primarily guaranteed by attractiveness for customers:
projects effectively pay for themselves from savings (they do not need subsidies) and new technologies
provide customers with greater comfort and modern functionalities.
* Data for Elevion correspond to actual figures from July 2016 to June 2017, adjusted for specific effects; data for the Czech Repubiic
correspond to the 2017 estimate. Globally, they are indicative values aimed to illustrate the size of the ESCO portfolio.
Indicative values today* ČEZ ESCO
(Czech Republic) ELEVION
(Germany) ESCO TOTAL
ANNUAL SALES Approx. CZK 5bn Approx. CZK 8bn Approx. CZK 13bn
Past sales growth (incl.
acquisitions)
Almost 60%
annually on average
in the past 2 years
30% annually on
average in the past 5
years N/A
EBITDA/SALES 6%–7% 5%–6% Over 6%
ASSETS Approx. CZK 5bn Approx. CZK 3bn Approx. CZK 8bn
EMPLOYEE
HEADCOUNT Approx. 1,300 Over 1,800 Over 3,100

CEZ GROUP AIMS TO BECOME AN INTEGRATED PLAYER IN RENEWABLES
2021 2016 2017 2018 2019 2020
Ownership Development Maintenance Co-ownership
CEZ aims to become a fully
integrated development, operating,
maintenance and marketing of RES
In 2016 and 2017 CEZ acquired
operated wind farms in Germany
In 2017 CEZ acquired
wind farms in a late
development stage in
France
20

This is raising CEZ Group’s total capacity at wind farms in 2017 to
769.9 MW
The total installed capacity of operated German farms is 133.5 MW
(12.8 MW at the Fohren-Linden park, 85.25 MW at parks from wpd’s
portfolio, and 35.4 MW at the latest acquisition in Rhineland-Palatinate).
There are 53 wind turbines in total.
CEZ acquisitions to date generate CZK 0.85bn EBITDA potential for
fulfilling the 2020 strategic financial target for Renewables (achieving
additional* 2020 EBITDA of CZK 3bn).
NEW ACQUISITIONS OF WIND TURBINES IN GERMANY AND PROJECTS IN FRANCE WILL HELP US ACHIEVE OUR STRATEGIC AMBITION FOR 2020
We entered the wind energy market in France
Acquisition of projects for 9 wind farms in a late development stage in six
regions with a target installed capacity of up to 101.8 MW
All the farms have purchasing prices guaranteed for 15 years
Possibility to optimize turbine purchases and simultaneously influence
construction parameters
We expect connection to the grid and first revenues in 2019 to 2022
The seller was ABO wind, a renowned development company
Acquisition of another operated wind farm in Germany
14 operated turbines with a total installed capacity of 35.4 MW
Operating support in the form of a 20-year feed-in tariff
The wind farm is located in western Germany (Lettweiler Höhe near Rehborn
in Rhineland-Palatinate)
The seller was KGAL, a renowned German RES fund
21
CEZ Group wind installations in
Germany:
EBITDA beyond the Business Plan for 2020 (prepared in 2015)
Germany
• Feed-in tariff – average of 89 EUR/MWh
(flat)
France
• Project pipeline up to 102 MW – if
successful commissioning expected in
2019-22
• PPA secured – average price of 81
EUR/MWh (escalated)

CEZ INVESTS IN INNOVATIVE ENERGY COMPANIES
22
CZK 5bn Committed capital (by CEZ Group), CZK 1.2bn already invested,
Investment Period – 5-7 year
Sonnen voted most
innovative company in the
Global Cleantech 100 list
2016.
Sonnen - smart battery systems for storing energy from solar panels and other
renewable energy sources. CEZ ESCO already installed first Sonnen battery in
the CR. More than 12 000 installations globally (mainly Germany, Austria,
Switzerland, expanding in US, Australia, Italy)
Sunfire - unique reversible fuel cell technology, which is able to convert a fuel
(such as natural gas) into electricity and heat as well as electricity back into
hydrogen and other gases (Power-to-Gas) or synthetic fuels (Power-to-Liquids).
Tado – the European leader in smart thermostats, integrates heat and AC
management, integration with more than 5 000 heating and AC systems, ability to
provide diagnostics of connected equipment
Cloud & Heat – designs, builds, and operates environmentally friendly, water-
cooled, public and private data centers for cloud computing. The solution makes
use of heat from servers to heat offices and water in office buildings, up to 50%
reduction in operating costs in comparison with conventional solutions.
Vulog - the global independent leader in providing technology for shared mobility,
offering end-to-end solutions enabling mobility operators to launch large-scale
carsharing services.

AGENDA
23
Introduction, strategic priorities
Traditional Generation
Regulated and New Energy
Financial performance
Summary
Backup
Electricity market fundamentals
Project of new nuclear in the Czech Republic
EU ETS, derogation scheme in the CR
Regulation of distribution
Renewables support schemes
2017 generation outlook, weld checks
Latest and historical financial results
1
7
16
23
29
31
32
35
36
38
41
43
46

WE EXPECT 2017 EBITDA OF CZK 52BN, ADJUSTED NET
INCOME OF CZK 19BN
Selected negative effects as
compared to expectation from
Aug 8, 2017:
Expected postponement of court
decision concerning the payment of
SŽDC debt from 2011 beyond 2017
(total impact, including ancillary, on
EBITDA of approx. CZK -1.3bn) in
relation to the Supreme Court’s
decision concerning a dispute over
the payment of SŽDC debt from 2010
Selected positive effects as
compared to expectation from
Aug 8, 2017:
Lower depreciation and amortization
and higher capitalization of interest
expenses, primarily due to change in
the expected completion date of the
new Ledvice unit (approx. CZK
+0.8bn in total)
Adjusted net income values exclude extraordinary effects that are generally unrelated to ordinary financial performance in a given year (such as fixed asset impairments and goodwill write-offs).
19 19
0
10
20
2017 E (Aug 8) 2017 E (Nov 7)
53 52
0
20
40
60
2017 E (Aug 8) 2017 E (Nov 7)
EBITDA
ADJUSTED NET
INCOME
CZK bn
CZK bn
24
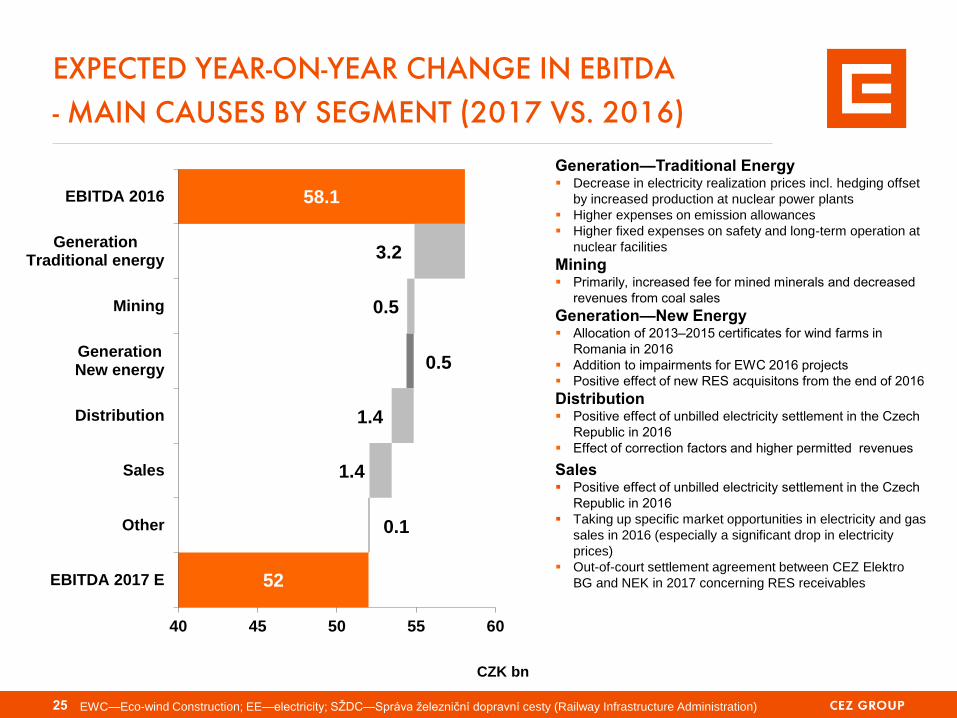
EXPECTED YEAR-ON-YEAR CHANGE IN EBITDA
- MAIN CAUSES BY SEGMENT (2017 VS. 2016)
25
Generation—Traditional Energy Decrease in electricity realization prices incl. hedging offset
by increased production at nuclear power plants
Higher expenses on emission allowances
Higher fixed expenses on safety and long-term operation at
nuclear facilities
Mining Primarily, increased fee for mined minerals and decreased
revenues from coal sales
Generation—New Energy Allocation of 2013–2015 certificates for wind farms in
Romania in 2016
Addition to impairments for EWC 2016 projects
Positive effect of new RES acquisitons from the end of 2016
Distribution Positive effect of unbilled electricity settlement in the Czech
Republic in 2016
Effect of correction factors and higher permitted revenues
Sales Positive effect of unbilled electricity settlement in the Czech
Republic in 2016
Taking up specific market opportunities in electricity and gas
sales in 2016 (especially a significant drop in electricity
prices)
Out-of-court settlement agreement between CEZ Elektro
BG and NEK in 2017 concerning RES receivables
EWC—Eco-wind Construction; EE—electricity; SŽDC—Správa železniční dopravní cesty (Railway Infrastructure Administration)
CZK bn
52
54.9
58.1
0.1
1.4
1.4
0.5
0.5
3.2
40 45 50 55 60
EBITDA 2017 E
Other
Sales
Distribution
GenerationNew energy
Mining
GenerationTraditional energy
EBITDA 2016
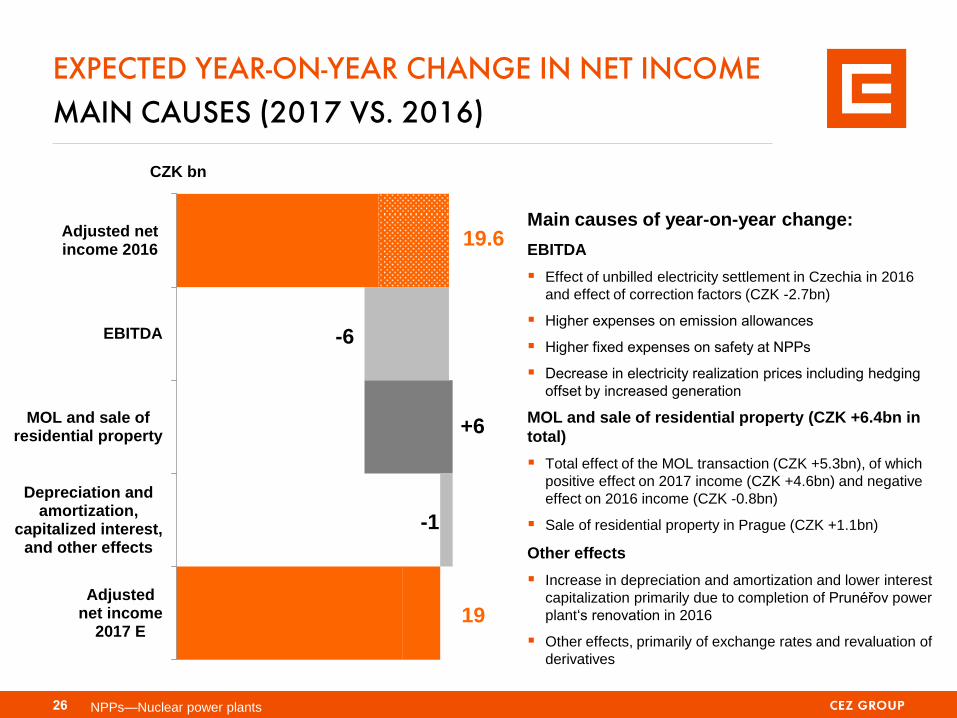
EXPECTED YEAR-ON-YEAR CHANGE IN NET INCOME
MAIN CAUSES (2017 VS. 2016)
Main causes of year-on-year change:
EBITDA
Effect of unbilled electricity settlement in Czechia in 2016
and effect of correction factors (CZK -2.7bn)
Higher expenses on emission allowances
Higher fixed expenses on safety at NPPs
Decrease in electricity realization prices including hedging
offset by increased generation
MOL and sale of residential property (CZK +6.4bn in
total)
Total effect of the MOL transaction (CZK +5.3bn), of which
positive effect on 2017 income (CZK +4.6bn) and negative
effect on 2016 income (CZK -0.8bn)
Sale of residential property in Prague (CZK +1.1bn)
Other effects
Increase in depreciation and amortization and lower interest
capitalization primarily due to completion of Prunéřov power
plant‘s renovation in 2016
Other effects, primarily of exchange rates and revaluation of
derivatives
NPPs—Nuclear power plants
19
19.6
-1
+6
-6
Adjustednet income
2017 E
Depreciation andamortization,
capitalized interest,and other effects
MOL and sale ofresidential property
EBITDA
Adjusted netincome 2016
CZK bn
26

8 9 15
20
40 50 53 50
45 40 40 40 40
33
49%
40% 41% 43%
50%
56% 55% 57% 59%
52% 56%
73% 78%
90%
0%
10%
20%
30%
40%
50%
60%
70%
80%
90%
100%
2003 2004 2005 2006 2007 2008 2009 2010 2011 2012 2013 2014 2015 2016
Dividend paid per share (CZK) Payout ratio*
DIVIDEND POLICY IS TO DISTRIBUTE 60 – 100 %
OF ADJUSTED NET INCOME OF 2016 AND 2017
PROFITS
27
Payout ratio* (%)
In June 2017
general meeting of
CEZ approved
management
proposal for 2016
dividend CZK 33
per share
Dividend payment
started on 1st
August 2017
* As percentage of adjusted net income

5,3
5.0
4.7
4.2
4.1
3.5
3.3
2.6
1.4
0.0
EON
EDF
EDP
RWE
Iberdrola
Engie
CEZ
Enel
PGE
Fortum
Net financialdebt/EBITDA
Net economicdebt**/ EBITDA
2.5
Average 3.4x
CURRENT LEVERAGE ALLOWS FOR DEBT FINANCED
ACQUISTIONS WITHOUT EXCEEDING ND/EBITDA 3.0x
Current credit rating
A-, stable outlook from S&P
Baa1, stable outlook from
Moody’s
Tolerated leverage
net financial debt/EBITDA ratio at
2.5-3.0x
assumes funding of new
development activities (primarily
acquisition of renewable projects,
distribution, sales and heat
assets)
Net economic debt/ EBITDA*
2016
*EBITDA as reported by companies, ** Net economic debt = net financial debt +
nuclear provisions + provisions for employee pensions + reclamation provision
28
In May 2017 sale
of stake in MOL -
~ 0.2x EBITDA
AGENDA
29
Introduction, strategic priorities
Traditional Generation
Regulated and New Energy
Financial performance
Summary
Backup
Electricity market fundamentals
Project of new nuclear in the Czech Republic
EU ETS, derogation scheme in the CR
Regulation of distribution
Renewables support schemes
2017 generation outlook, weld checks
Latest and historical financial results
1
7
16
23
29
31
32
35
36
38
41
43
46

SUMMARY
30
CEZ is operating renewed low cost and profitable generation fleet and is
positioned to get upsides from rising CO2 and/or hard coal prices
Future growth of CEZ comes from ESCO, distributed energy and
renewables in countries in which CEZ is present in Central/Western
Europe:
CEZ increased its investments into distribution
CEZ acquired ESCO companies in the Czech Republic and Germany
and aims to become a leading player in energy efficiency solutions
CEZ acquired renewables in Germany and France and aims to
become a fully integrated development, operating, maintenance and
marketing of RES
CEZ leverage allows for debt financed acquisitions not exceeding
ND/EBITDA 3.0x
Dividend policy for 2017 profit remains at 60-100% of adjusted net income
AGENDA
31
Introduction, strategic priorities
Traditional Generation
Regulated and New Energy
Financial performance
Summary
Backup
Electricity market fundamentals
Project of new nuclear in the Czech Republic
EU ETS, derogation scheme in the CR
Regulation of distribution
Renewables support schemes
2017 generation outlook, weld checks
Latest and historical financial results
1
7
16
23
29
31
32
35
36
38
41
43
46

0
10
20
30
40
No
v-1
2
Feb
-13
Ma
y-1
3
Aug-1
3
No
v-1
3
Feb
-14
Ma
y-1
4
Aug-1
4
No
v-1
4
Feb
-15
Ma
y-1
5
Aug-1
5
No
v-1
5
Fe
b-1
6
Ma
y-1
6
Aug-1
6
No
v-1
6
Feb
-17
Ma
y-1
7
Aug-1
7
No
v-1
7
0
30
60
90
120
No
v-1
2
Feb
-13
Ma
y-1
3
Aug-1
3
No
v-1
3
Feb
-14
Ma
y-1
4
Aug-1
4
No
v-1
4
Feb
-15
Ma
y-1
5
Aug-1
5
No
v-1
5
Feb
-16
Ma
y-1
6
Aug-1
6
No
v-1
6
Feb
-17
Ma
y-1
7
Aug-1
7
No
v-1
7
0
2
4
6
8
10
No
v-1
2
Feb
-13
Ma
y-1
3
Aug-1
3
No
v-1
3
Feb
-14
Ma
y-1
4
Aug-1
4
No
v-1
4
Feb
-15
Ma
y-1
5
Aug-1
5
No
v-1
5
Feb
-16
Ma
y-1
6
Aug-1
6
No
v-1
6
Feb
-17
Ma
y-1
7
Aug-1
7
No
v-1
7
32
HISTORICAL DEVELOPMENT OF PRICES OF INPUT
COMMODITIES
Oil Brent (USD/bl)
CO2 allowances (EUR/t) Coal (t)
Gas (EUR/MWh, in Germany)
NCG (spot)
Note: next month deliveries, spot, CO2 – Mid March delivery
EUR
USD
0
20
40
60
80
100
No
v-1
2
Feb
-13
Ma
y-1
3
Aug-1
3
No
v-1
3
Feb
-14
Ma
y-1
4
Aug-1
4
No
v-1
4
Feb
-15
Ma
y-1
5
Aug-1
5
No
v-1
5
Fe
b-1
6
Ma
y-1
6
Aug-1
6
No
v-1
6
Feb
-17
Ma
y-1
7
Aug-1
7
No
v-1
7

ELECTRICITY MARKETS IN THE REGION ARE
INTEGRATED, CEZ CAN SELL ITS POWER ABROAD
Source: EEX, PXE, TGE
DE
€ 37.1 /MWh
CR € 38.15 /MWh
SK € 42.25 /MWh
HU
€ 49.6 /MWh
PL
€ 40.5/MWh
Note: Prices for 2018 baseload – as of November 7th 2017 33
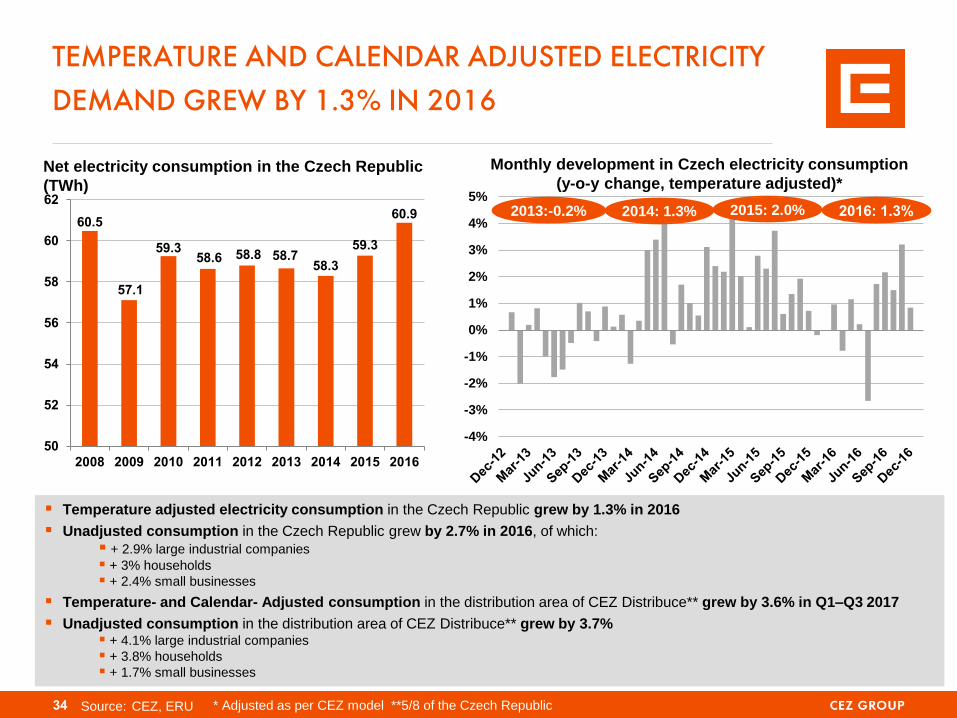
TEMPERATURE AND CALENDAR ADJUSTED ELECTRICITY
DEMAND GREW BY 1.3% IN 2016
34 Source: CEZ, ERU
Monthly development in Czech electricity consumption
(y-o-y change, temperature adjusted)*
60.5
57.1
59.3 58.6 58.8 58.7
58.3
59.3
60.9
50
52
54
56
58
60
62
2008 2009 2010 2011 2012 2013 2014 2015 2016
Net electricity consumption in the Czech Republic
(TWh)
-4%
-3%
-2%
-1%
0%
1%
2%
3%
4%
5%2015: 2.0% 2016: 1.3%
* Adjusted as per CEZ model **5/8 of the Czech Republic
2013:-0.2% 2014: 1.3%
Temperature adjusted electricity consumption in the Czech Republic grew by 1.3% in 2016
Unadjusted consumption in the Czech Republic grew by 2.7% in 2016, of which:
+ 2.9% large industrial companies
+ 3% households
+ 2.4% small businesses
Temperature- and Calendar- Adjusted consumption in the distribution area of CEZ Distribuce** grew by 3.6% in Q1–Q3 2017
Unadjusted consumption in the distribution area of CEZ Distribuce** grew by 3.7% + 4.1% large industrial companies
+ 3.8% households
+ 1.7% small businesses
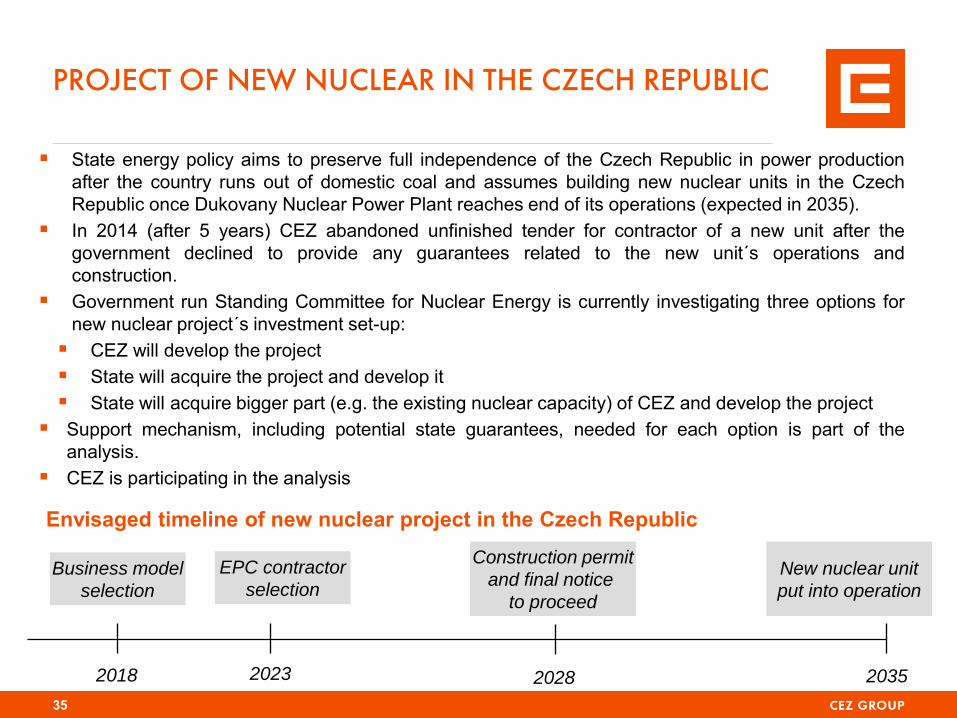
PROJECT OF NEW NUCLEAR IN THE CZECH REPUBLIC
State energy policy aims to preserve full independence of the Czech Republic in power production
after the country runs out of domestic coal and assumes building new nuclear units in the Czech
Republic once Dukovany Nuclear Power Plant reaches end of its operations (expected in 2035).
In 2014 (after 5 years) CEZ abandoned unfinished tender for contractor of a new unit after the
government declined to provide any guarantees related to the new unit´s operations and
construction.
Government run Standing Committee for Nuclear Energy is currently investigating three options for
new nuclear project´s investment set-up:
CEZ will develop the project
State will acquire the project and develop it
State will acquire bigger part (e.g. the existing nuclear capacity) of CEZ and develop the project
Support mechanism, including potential state guarantees, needed for each option is part of the
analysis.
CEZ is participating in the analysis
35
2018 2023 2028 2035
EPC contractor
selection Business model
selection
Construction permit
and final notice
to proceed
New nuclear unit
put into operation
Envisaged timeline of new nuclear project in the Czech Republic
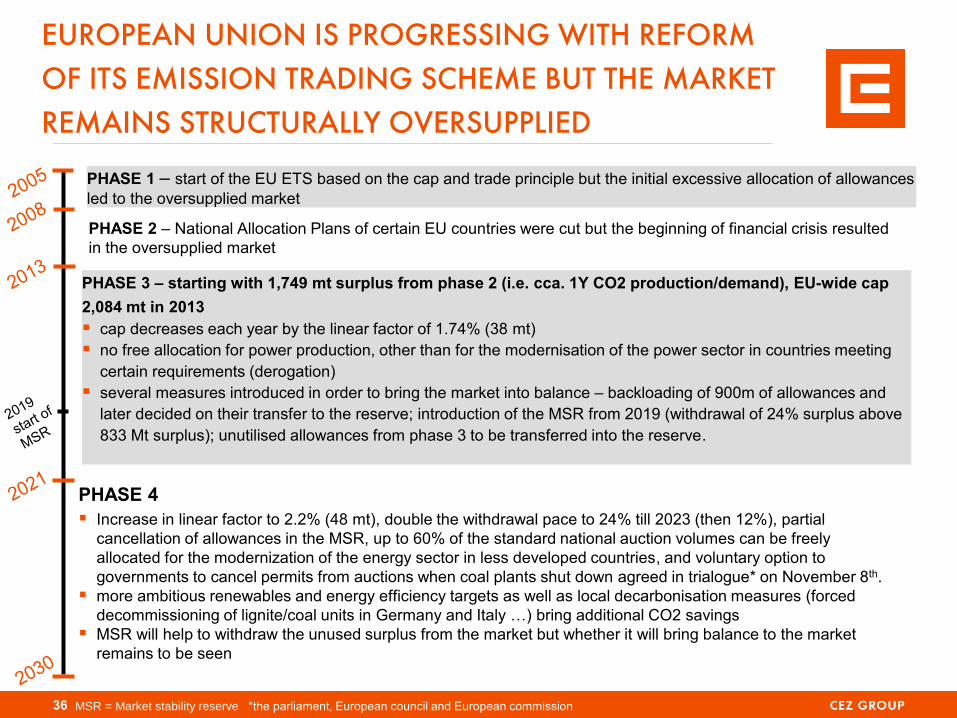
EUROPEAN UNION IS PROGRESSING WITH REFORM
OF ITS EMISSION TRADING SCHEME BUT THE MARKET
REMAINS STRUCTURALLY OVERSUPPLIED
PHASE 1 – start of the EU ETS based on the cap and trade principle but the initial excessive allocation of allowances
led to the oversupplied market
MSR = Market stability reserve *the parliament, European council and European commission 36
PHASE 2 – National Allocation Plans of certain EU countries were cut but the beginning of financial crisis resulted
in the oversupplied market
PHASE 3 – starting with 1,749 mt surplus from phase 2 (i.e. cca. 1Y CO2 production/demand), EU-wide cap
2,084 mt in 2013
cap decreases each year by the linear factor of 1.74% (38 mt)
no free allocation for power production, other than for the modernisation of the power sector in countries meeting
certain requirements (derogation)
several measures introduced in order to bring the market into balance – backloading of 900m of allowances and
later decided on their transfer to the reserve; introduction of the MSR from 2019 (withdrawal of 24% surplus above
833 Mt surplus); unutilised allowances from phase 3 to be transferred into the reserve.
PHASE 4
Increase in linear factor to 2.2% (48 mt), double the withdrawal pace to 24% till 2023 (then 12%), partial
cancellation of allowances in the MSR, up to 60% of the standard national auction volumes can be freely
allocated for the modernization of the energy sector in less developed countries, and voluntary option to
governments to cancel permits from auctions when coal plants shut down agreed in trialogue* on November 8th.
more ambitious renewables and energy efficiency targets as well as local decarbonisation measures (forced
decommissioning of lignite/coal units in Germany and Italy …) bring additional CO2 savings
MSR will help to withdraw the unused surplus from the market but whether it will bring balance to the market
remains to be seen

18.8
16.4
13.5
10.9
7.9
5.4
2.9
0.4
2013 2014 2015 2016 2017 2018 2019 2020
heat production
electricity production
CEZ GROUP CONTINUES TO RECEIVE PART
OF EMISSION ALLOWANCES FOR FREE
CEZ Group to receive up to 69.6 million emission allowances for electricity production in the Czech
Republic in 2013–2019 in exchange for investments reducing greenhouse gas emissions.
EC Commission has proposed that free allocation of up to 40% of emission allowances will continue
post 2020.
37
68% 66% 52% 39% 28%* 19%* 10%* 1%*
Expected allocation of allowances for CEZ Group in the Czech Republic (millions)
Allocation
as a % of emissions
* % of 2016 emissions
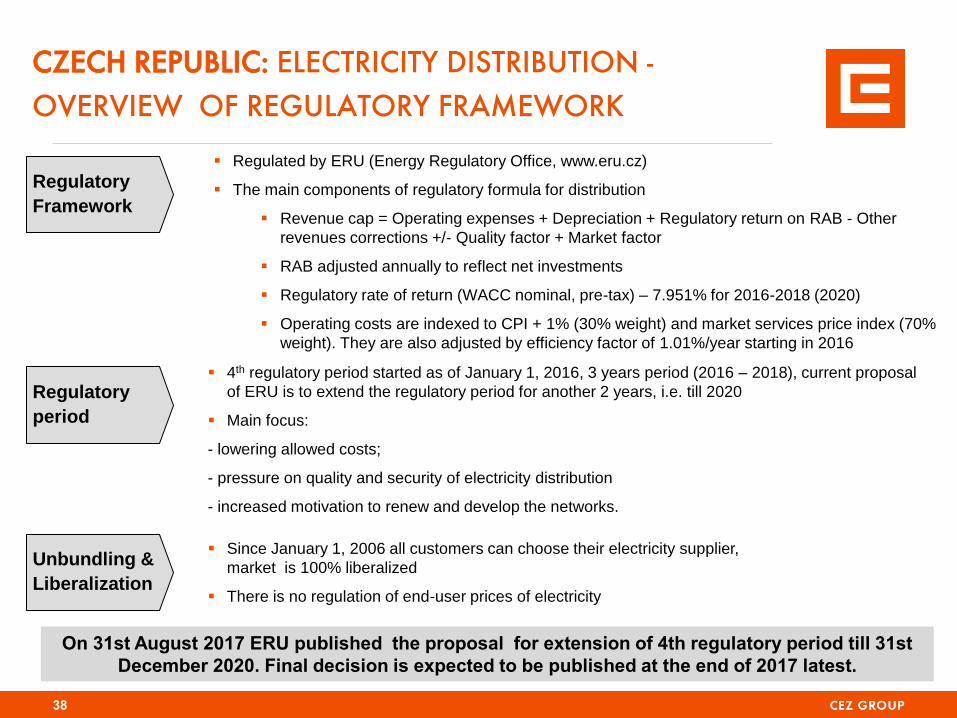
Regulatory
period
Unbundling &
Liberalization
4th regulatory period started as of January 1, 2016, 3 years period (2016 – 2018), current proposal
of ERU is to extend the regulatory period for another 2 years, i.e. till 2020
Main focus:
- lowering allowed costs;
- pressure on quality and security of electricity distribution
- increased motivation to renew and develop the networks.
Since January 1, 2006 all customers can choose their electricity supplier,
market is 100% liberalized
There is no regulation of end-user prices of electricity
CZECH REPUBLIC: ELECTRICITY DISTRIBUTION -
OVERVIEW OF REGULATORY FRAMEWORK
38
Regulatory
Framework
Regulated by ERU (Energy Regulatory Office, www.eru.cz)
The main components of regulatory formula for distribution
Revenue cap = Operating expenses + Depreciation + Regulatory return on RAB - Other
revenues corrections +/- Quality factor + Market factor
RAB adjusted annually to reflect net investments
Regulatory rate of return (WACC nominal, pre-tax) – 7.951% for 2016-2018 (2020)
Operating costs are indexed to CPI + 1% (30% weight) and market services price index (70%
weight). They are also adjusted by efficiency factor of 1.01%/year starting in 2016
On 31st August 2017 ERU published the proposal for extension of 4th regulatory period till 31st
December 2020. Final decision is expected to be published at the end of 2017 latest.

Regulatory
periods
Unbundling &
Liberalization
3rd regulatory period August 1, 2013 – July 31, 2015
4th regulatory period August 1, 2015 – June 30, 2018
Unbundling successfully completed by December 31, 2006
Since July 2007, all consumers have the right to become eligible but the effective market
degree of liberalized market was approximately 45% at the end of 2014.
Currently the last phase of liberalization focused on the low voltage customers is in
process.
Regulatory
Framework
Regulated by EWRC (Energy and Water Regulatory Commission)
The regulatory formula for distribution
Revenue cap = Costs + Regulatory return on RAB + Depreciation
Regulatory rate of return (WACC nominal, pre-tax) at 7.04 % for 4th regulatory period
Average values set for the NBV, depreciation and investments for the whole period
RAB set at EUR 277.4m for the 4th regulatory period
Technological losses in 4th regulatory period set by regulator at 8%
Efficiency factor introduced in the 2nd regulatory period, not applied in the 4th
regulatory period, yet. EWRC may apply it later.
BULGARIA: REGULATORY FRAMEWORK
OF ELECTRICITY DISTRIBUTION
39

Regulatory
periods
Regulatory
Framework
3rd regulatory period Jan 1, 2014 – Dec 31, 2018
Regulated by ANRE (Autoritatea Nationala de Reglementare in domeniul Energiei)
Price cap (tariff basket) methodology
Revenue = Controllable OPEX + non-controllable OPEX + Depreciation + Purchase of losses + Regulatory return
on RAB + Working capital - Revenues from reactive energy - 50% gross profit from other activities
Efficiency factor of 1.5% applied only to controllable OPEX
Losses ( technical + commercial ) reduction program agreed with ANRE on voltage levels
S (minimum quality) from 2014 in formula, but not yet applied
Possibility for annual corrections
Investment plan – approved by ANRE before regulatory period starts
Regulatory return (WACC pre-tax real terms) equals to 7.7% starting 2015, it can be revised by ANRE during
regulatory period
Working capital is equal to regulated remuneration of 1/12 from total OPEX
Distribution tariff growth capped in real terms at 10% yearly on voltage levels and at 7% yearly for average
weighted distribution tariff in the third regulatory period
ROMANIA: REGULATORY FRAMEWORK
OF ELECTRICITY DISTRIBUTION
Complete removal of regulated prices for industrial consumers by end 2013, for residential consumers by end
2017
Starting January 2014, non-residential customers that benefit of Universal Service (US) are priced with 100%
CPC tariff (free market component, endorsed by ANRE). The non-residential customers supplied on LRS
regime are priced with CPC tariff +x%, depending on voltage level.
Starting July 2013, the final price for the captive householders is formed of regulated tariff and a competitive
market component (CPC). The percentage of regulated tariff decreases , and the CPC tariff percentage
increases according to the Market Opening Calendar
Liberalization
40

CZECH REPUBLIC: RENEWABLES SUPPORT
41
Operators of renewable energy sources can
choose from 2 options of support:
Feed-in tariffs (electricity purchased by
distributor)
Green bonuses (electricity sold on the
market, bonuses paid by distributor, level of
green bonuses is derived from feed-in tariffs)
Feed-in tariffs are set by a regulator to ensure 15-
year payback period. During operation of a power
plant they are increased each year by PPI index
or by 2% at minimum and 4% at maximum.
Support is provided for 20 years to solar, wind,
pure biomass and biogas plants and for 30 years
to hydro.
Solar plants commissioned in 2014 or later do not
receive support
Solar plants put into operations in 2010 with
capacity over 30kWp are obliged to pay 10% tax
of revenues.
150 193 218 219 263 270 278 281 282
40
464
1,959 1,971 2,086 2,132 2,067 2,075 2,068
0
500
1000
1500
2000
2500
2008 2009 2010 2011 2012 2013 2014 2015 2016
Wind
Solar
Installed capacity of wind and solar power plants in the Czech Republic
(MWe)
Plants
commissioned in
2010
Plants
commissioned
in 2016
Solar <30 kW 521.0 0
Solar >30 kW 516.9 0
Wind 95.2 72.9
Source: Energy Regulatory Office (www.eru.cz), EUR/CZK = 27.02
2017 feed-in-tariffs (EUR per MWh)

ROMANIA: RENEWABLES SUPPORT UPDATE OF THE RULES ADOPTED IN 2017 SIGNIGICANTLY IMPROVES VISIBILITY OF FUTURE CASH FLOWS
42
20
25
30
35
40
45
50
55
60
Source: OPCOM
Green certificates market clearing price (EUR/certificate)
Two green certificates (GC) obtained by the producer for each MWh supplied from wind to the network until 2017,
one GC from 2018 onwards, duration of support – 15 years.
Legally set price for green certificate is EUR 29.4 – EUR 35 (adjusted in March 2017 from previous EUR 27 to
EUR 55)
In March 2017 the tradability of green certificates was extended – all certificates issued after 1st April 2017 are
tradable until 31st March 2032 (originally the lifespan was limited to 12 months).
The updated regulatory scheme assumes an obligation to buy a constant annual amount of green certificates for
15 years, starting Apr 1, 2017, so that all green certificates are absorbed at the end of the 15-year period.

2016 GENERATION VOLUMES AFFECTED BY
SHUTDOWNS IN NUCLEAR PLANTS, IN 2017
IMPROVEMENT IN NUCLEAR GENERATION EXPECTED
43 Due to precise mathematical rounding, the sum of partial values can sometimes differ from the total value.
29.5 31.5 29.5
4.5 5.5 6.0
26.8 24.1 28.4
0.0
10.0
20.0
30.0
40.0
50.0
60.0
70.0
2015 2016 2017E
Nuclear
Other
Coal
60.9 61.1 64
-6% +7%
+22%
-10% +18%
+9%
TW
h
2016 volume trends
- Extended outages of Dukovany NPP and Temelín NPP
primarily due to weld inspections
+ Operation of comprehensively renovated Prunéřov 2 Coal
Power Plant
+ Operation of new Ledvice 4 Coal Power Plant (during
construction)
+ Increased production at Počerady CCGT plant
2017 volume trends
+ Shorter outages, especially at Temelín NPP
+ Operation of renewed Prunéřov 2 Power Plant
+ Operation of new Ledvice 4 Coal Power Plant
- Lower production from Coal Power Plants in Poland
+ Higher production at Počerady CCGT plant
+ Higher production from wind power plants in
Romania and Germany

EXTENDED OUTAGES IN NUCLEAR PLANTS RELATE
TO WELD CHECKS AND LICENCE RENEWAL
44 Source: CEZ reporting under REMIT (Regulation on wholesale energy market integrity and transparency), as of October 2017
Regular non-destructive testing of welds carried out in
nuclear power plants.
In 2015 irregularities found in testing documentation
provided by outsourced supplier in the past.
All welds are being re-tested to restore order in testing
documentation and correct deficiencies.
0
50
100
150
200
250
300
2014 2015 2016 2017F 2018F
Total number of outage days for Temelin
Unit 2 Unit 1
0
100
200
300
400
500
2014 2015 2016 2017F 2018F
Total number of outage days for Dukovany
Unit 4 Unit 3 Unit 2 Unit 1
Dukovany
Licences of Dukovany´s 4 units coming to expiry and
need to be renewed – > higher than regular outages.
Unit 1 and 2 – all deficiencies remedied, new licenses
received in March 2016 (Unit 1) and July 2017 (Unit 2)
Re-testing in Units 3 and 4 in progress till 2017 -
increased outages as per the charts below.
Temelín
Re-testing is scheduled into 2017. Unlike in Dukovany,
some re-testing can be done during unit’s operation.
Unit 1 2016´s unplanned outages - mainly re-testing
related.
Unit 2 2016´s unplanned outages - mainly turbine oil
glands fault and replacement, i.e. most of the re-testing to
be done in 2017.
Most of re-testing, mainly in Dukovany, cannot be done
during operation – > increased outages
CEZ internalized significant part of services related to
selected tests to minimize risk of problems repetition.
Testing is pre-emptive. Negative testing result indicates
„only“ increased probability of future leakage. Nevertheless
any deficiencies result in re-welding as a pre-caution.

LARGE RENEWAL OF LIGNITE PLANT PORTFOLIO IS
ALMOST FINISHED
45
Tušimice Prunéřov Ledvice
Installed capacity 4 x 200 MWe 3x250 MWe 660 MWe
Efficiency 39% 40% 42,5%
Operational from 2010 (2 units) and
2011, 2012 mid 2016
now in test operation,
FAC expected in 4Q
2017
Expected
operating life 25 years 25 years 40 years
Reduction of fuel
consumption* 14% 18% 27%
*compared to units existing prior renewal

CEZ GROUP Q1 – Q3 2017 FINANCIAL RESULTS
* Adjusted net income = Net income adjusted for extraordinary effects that are generally unrelated to ordinary financial performance in a given
year (such as fixed asset impairments and goodwill write-offs).
** At the last date of the period
*** The increase is primarily related to new acquisitions, in particular of German company Elevion (almost 2,000 employees), and insourcing of
purchased services in the Czech Republic
Due to precise mathematical rounding, the sum of partial values listed can sometimes differ from the total value.
(CZK bn) Q1 - Q3 2016 Q1 - Q3 2017 Change %
Revenues 145.1 146.7 +1.6 +1%
EBITDA 43.8 41.1 -2.7 -6%
EBIT 21.6 19.4 -2.2 -10%
Net income 14.7 16.6 +1.9 +13%
Net income - adjusted * 16.7 17.3 +0.6 +4%
Operating CF 40.5 36.2 -4.3 -11%
CAPEX 21.5 19.2 -2.3 -11%
Net debt ** 140.0 137.0 -3.1 -2%
Q1 - Q3 2016 Q1 - Q3 2017 Change %
Installed capacity ** GW 16.1 15.5 -0.6 -4%
Generation of electricity - traditional energy TWh 44.0 44.6 +0.6 +1%
Generation of electricity - new energy TWh 1.1 1.4 +0.3 +25%
Electricity distribution to end customers TWh 36.8 38.3 +1.5 +4%
Electricity sales to end customers TWh 26.8 27.2 +0.3 +1%
Sales of natural gas to end customers TWh 5.1 6.7 +1.6 +30%
Sales of heat 000´TJ 15.3 15.8 +0.5 +3%
Number of employees **) ***) 000´s 26.6 29.3 +2.7 +10%
46
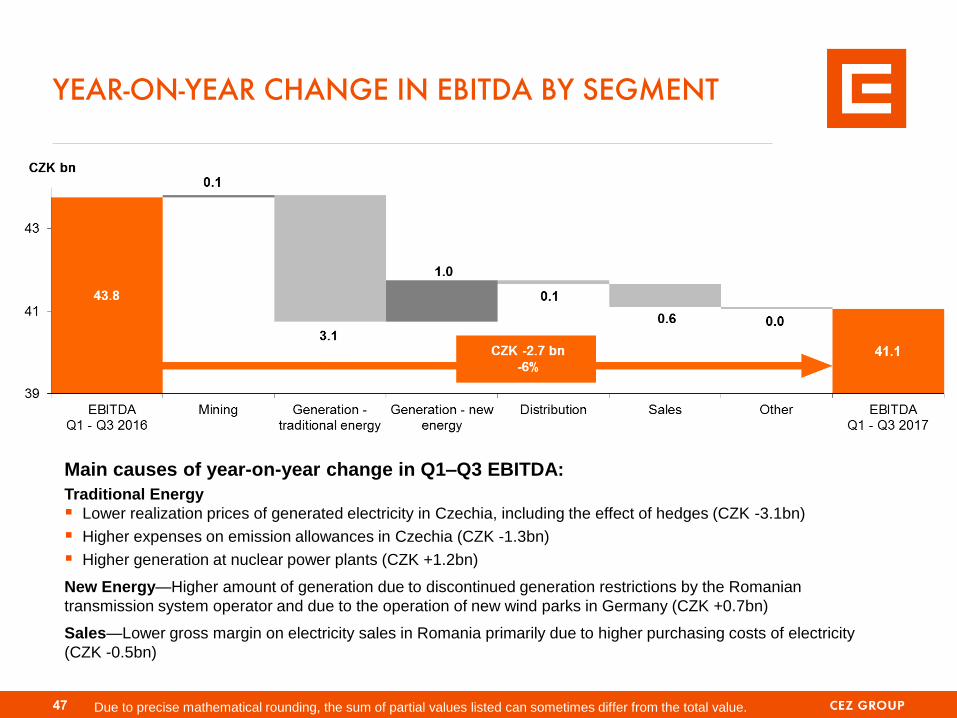
YEAR-ON-YEAR CHANGE IN EBITDA BY SEGMENT
Due to precise mathematical rounding, the sum of partial values listed can sometimes differ from the total value.
Main causes of year-on-year change in Q1–Q3 EBITDA:
Traditional Energy
Lower realization prices of generated electricity in Czechia, including the effect of hedges (CZK -3.1bn)
Higher expenses on emission allowances in Czechia (CZK -1.3bn)
Higher generation at nuclear power plants (CZK +1.2bn)
New Energy—Higher amount of generation due to discontinued generation restrictions by the Romanian
transmission system operator and due to the operation of new wind parks in Germany (CZK +0.7bn)
Sales—Lower gross margin on electricity sales in Romania primarily due to higher purchasing costs of electricity
(CZK -0.5bn)
47

(CZK bn) Q1 - Q3 2016 Q1 - Q3 2017 Change %
EBITDA 43.8 41.1 -2.7 -6%
Depreciation, amortization and impairments* -22.2 -21.6 +0.5 +2%
Other income (expenses) -3.3 0.0 +3.4 -
Interest income (expenses) -1.6 -2.5 -0.9 -53%
Interest on nuclear and other provisions -1.1 -1.2 -0.1 -9%
Income (expenses) from investments and securities -0.2 3.8 +4.0 -
Other -0.4 0.0 +0.4 +95%
Income taxes -3.6 -2.9 +0.7 +19%
Net income 14.7 16.6 +1.9 +13%
Net income - adjusted 16.7 17.3 +0.6 +4%
OTHER INCOME (EXPENSES) Q1 – Q3 2017
Depreciation, Amortization, and Impairments* (CZK +0.5bn)
Nonrecurrent income from sale of properties in Prague (CZK +1.1bn)
Higher fixed asset impairments in 2016 (CZK +0.7bn)
Higher depreciation and amortization (CZK -1.3bn), primarily due to putting renovated Prunéřov power plant into operation in 2016
Other Income (Expenses) (CZK +3.4bn)
Effect of termination of MOL stockholding (CZK +4.3bn), where overall effect of sale of MOL stock, including related operations, on profits in Q1–Q3
2017 was CZK +4.6bn and total profits in Q1–Q3 2016 were CZK +0.3bn
Higher interest expenses primarily due to lower interest capitalization after renovation of Prunéřov power plant in 2016 (CZK -0.9bn)
Share of the profit or loss of associates and joint ventures (CZK -0.4bn)
Other effects (CZK +0.4bn)
Net Income Adjustment
Net income in Q1–Q3 2017 is adjusted for partial goodwill write-off in Turkey (CZK +0.5bn) and for the negative effect of impairment of fixed assets
in Poland (CZK +0.2bn)
Net income in Q1–Q3 2016 is adjusted for the negative effect of impairment of fixed asset in Romania (CZK +1.0bn), for partial goodwill write-off in
Turkey (CZK +0.7bn), and for the negative effect of impairment of projects under development in Poland (CZK +0.3bn)
* Including profit/loss from sales of tangible and intangible fixed assets 48

Undrawn,committed
Drawn,committed
Drawn,uncommitted
CEZ GROUP MAINTAINS A STRONG LIQUIDITY
POSITION
Utilization of Short-Term Lines (as at Sep 30, 2017)
Available credit
facilities
CZK 18.6bn
CZK 10.1bn
CEZ Group has access to CZK 28.7bn in
committed credit facilities, using CZK 10.1bn
as at Sep 30, 2017.
Committed facilities are kept as a reserve for
covering unexpected needs and for funding
short-term financial needs.
The payment of dividends for 2016 (CZK
17.6bn) began on August 1, 2017. 99% of the
amount was paid as at Sep 30.
EUR 225m tap of 2028 bond issue was
issued on September 20, 2017. The effective
yield of the tap issue is 1.766%.
0
5
10
15
20
25
2017
20
18
2019
20
20
2021
2022
2023
2024
20
25
20
28
20
30
20
32
20
38
2039
2042
20
47
EURCZK JPY USD
mld. Kč
Bond Maturity Profile (as at Sep 30, 2017)
CZK 1.8bn
CZK bn
49
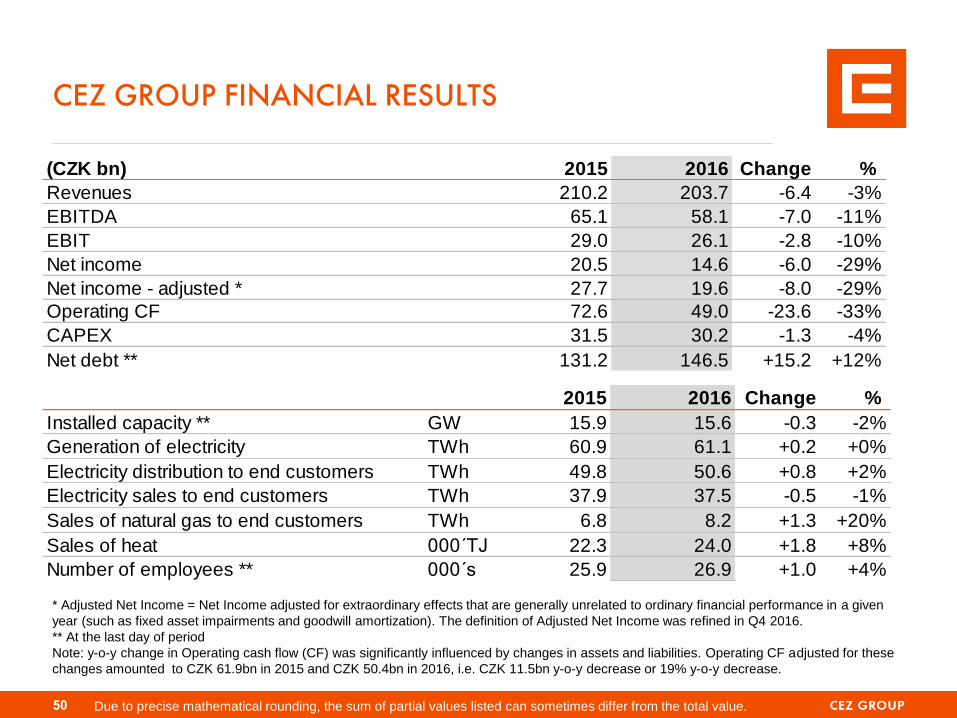
2015 2016 Change %
Installed capacity ** GW 15.9 15.6 -0.3 -2%
Generation of electricity TWh 60.9 61.1 +0.2 +0%
Electricity distribution to end customers TWh 49.8 50.6 +0.8 +2%
Electricity sales to end customers TWh 37.9 37.5 -0.5 -1%
Sales of natural gas to end customers TWh 6.8 8.2 +1.3 +20%
Sales of heat 000´TJ 22.3 24.0 +1.8 +8%
Number of employees ** 000´s 25.9 26.9 +1.0 +4%
CEZ GROUP FINANCIAL RESULTS
* Adjusted Net Income = Net Income adjusted for extraordinary effects that are generally unrelated to ordinary financial performance in a given
year (such as fixed asset impairments and goodwill amortization). The definition of Adjusted Net Income was refined in Q4 2016.
** At the last day of period
Note: y-o-y change in Operating cash flow (CF) was significantly influenced by changes in assets and liabilities. Operating CF adjusted for these
changes amounted to CZK 61.9bn in 2015 and CZK 50.4bn in 2016, i.e. CZK 11.5bn y-o-y decrease or 19% y-o-y decrease.
Due to precise mathematical rounding, the sum of partial values listed can sometimes differ from the total value.
doplnit
(CZK bn) 2015 2016 Change %
Revenues 210.2 203.7 -6.4 -3%
EBITDA 65.1 58.1 -7.0 -11%
EBIT 29.0 26.1 -2.8 -10%
Net income 20.5 14.6 -6.0 -29%
Net income - adjusted * 27.7 19.6 -8.0 -29%
Operating CF 72.6 49.0 -23.6 -33%
CAPEX 31.5 30.2 -1.3 -4%
Net debt ** 131.2 146.5 +15.2 +12%
50
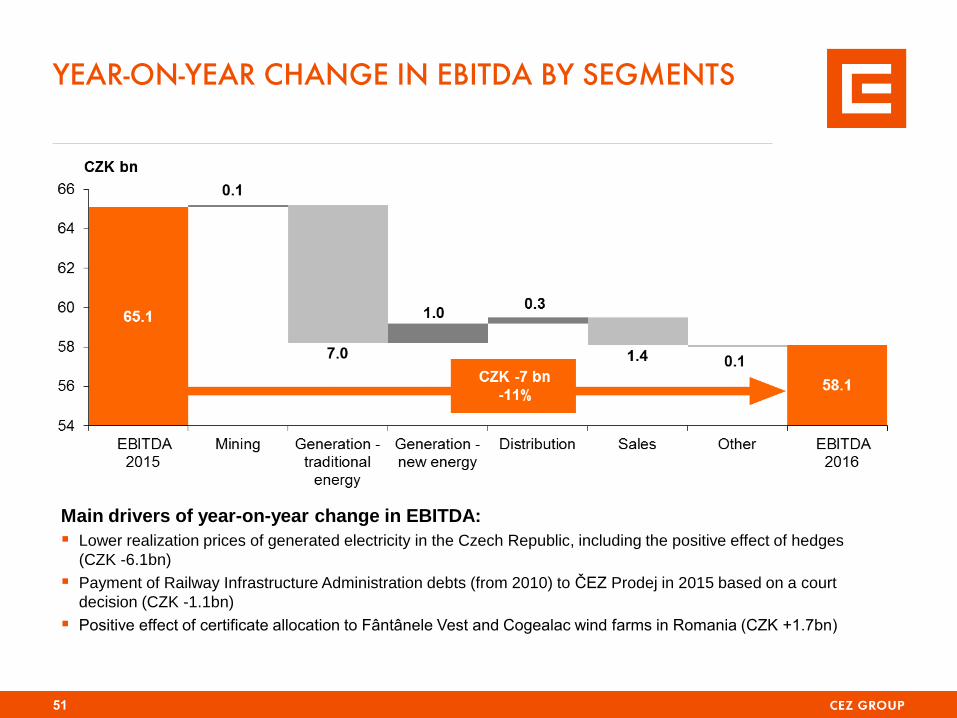
YEAR-ON-YEAR CHANGE IN EBITDA BY SEGMENTS
Main drivers of year-on-year change in EBITDA:
Lower realization prices of generated electricity in the Czech Republic, including the positive effect of hedges
(CZK -6.1bn)
Payment of Railway Infrastructure Administration debts (from 2010) to ČEZ Prodej in 2015 based on a court
decision (CZK -1.1bn)
Positive effect of certificate allocation to Fântânele Vest and Cogealac wind farms in Romania (CZK +1.7bn)
51

OTHER INCOME (EXPENSES)
Depreciation, Amortization, and Impairments* (CZK +4.2bn)
Lower additions to fixed asset impairments (CZK +4.6bn)
Higher depreciation and amortization (CZK -0.4bn) primarily due to started depreciation of comprehensively renovated Prunéřov Power
Plant
Other Income (Expenses) (CZK -4.7bn)
Refund of a portion of gift tax on emission allowances for 2011 and 2012 in 2015 (CZK -3.8bn)
Amortization of a portion of goodwill and additions to impairments at joint ventures in Turkey (CZK -1.3bn)**
Revaluation of MOL share option (CZK -0.9bn) due to rising share price
Bond buyback in 2015 (CZK +0.8bn)
Other (CZK +0.5bn) primarily FX gains
Net income adjustment ***
2015 net income adjusted for the negative effect of fixed asset impairments, goodwill amortization, and write-off of abandoned
investments (CZK +7.1bn)
2016 net income adjusted for the negative effect of fixed asset impairments, goodwill amortization, and write-off of abandoned
investments (CZK +4.4bn)** and for the negative effect of developed project impairments (CZK +0.7bn)
* Including profit/loss from sales of tangible and intangible fixed assets ** Reported under Income (Expenses) from investments and securities *** The definition of Adjusted Net Income was refined in Q4 2016
(CZK bn) 2015 2016 Change %
EBITDA 65.1 58.1 -7.0 -11%
Depreciation, amortization and impairments* -36.1 -32.0 +4.2 +12%
Other income (expenses) -2.1 -6.8 -4.7 >200%
Interest income (expenses) -2.5 -2.5 +0.0 +0%
Interest on nuclear and other provisions -1.7 -1.5 +0.2 +11%
Income (expenses) from investments and securities -0.3 -1.8 -1.5 >200%
Other 2.4 -1.1 -3.5 -
Income taxes -6.3 -4.8 +1.6 +25%
Net income 20.5 14.6 -6.0 -29%
Net income - adjusted 27.7 19.6 -8.0 -29%
52
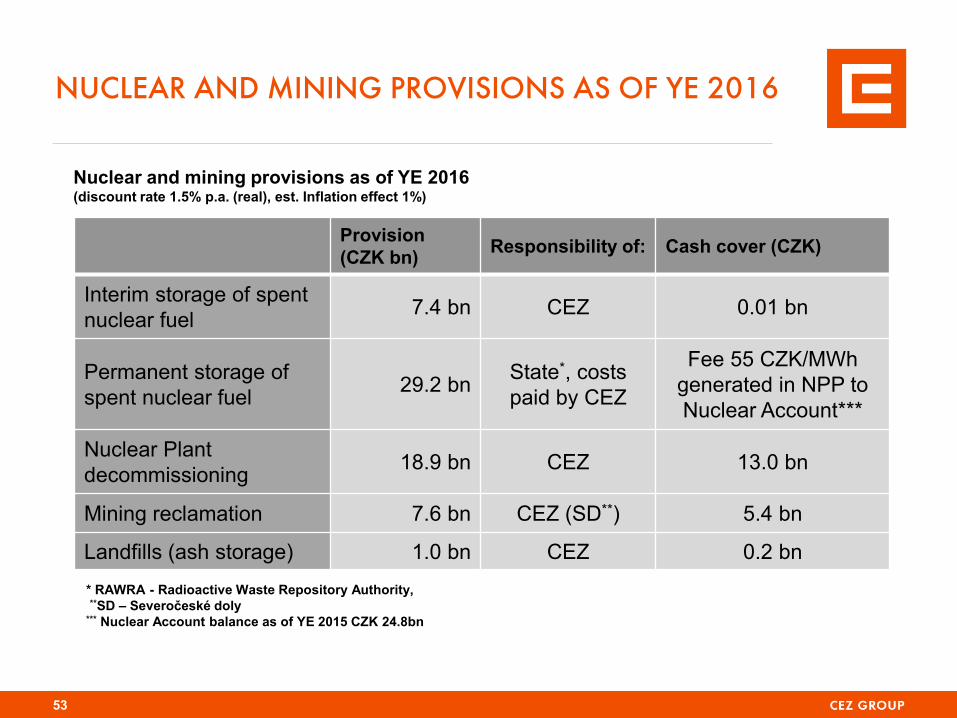
NUCLEAR AND MINING PROVISIONS AS OF YE 2016
53
Provision
(CZK bn) Responsibility of: Cash cover (CZK)
Interim storage of spent
nuclear fuel 7.4 bn CEZ 0.01 bn
Permanent storage of
spent nuclear fuel 29.2 bn
State*, costs
paid by CEZ
Fee 55 CZK/MWh
generated in NPP to
Nuclear Account***
Nuclear Plant
decommissioning 18.9 bn CEZ 13.0 bn
Mining reclamation 7.6 bn CEZ (SD**) 5.4 bn
Landfills (ash storage) 1.0 bn CEZ 0.2 bn
* RAWRA - Radioactive Waste Repository Authority,
**SD – Severočeské doly *** Nuclear Account balance as of YE 2015 CZK 24.8bn
Nuclear and mining provisions as of YE 2016 (discount rate 1.5% p.a. (real), est. Inflation effect 1%)
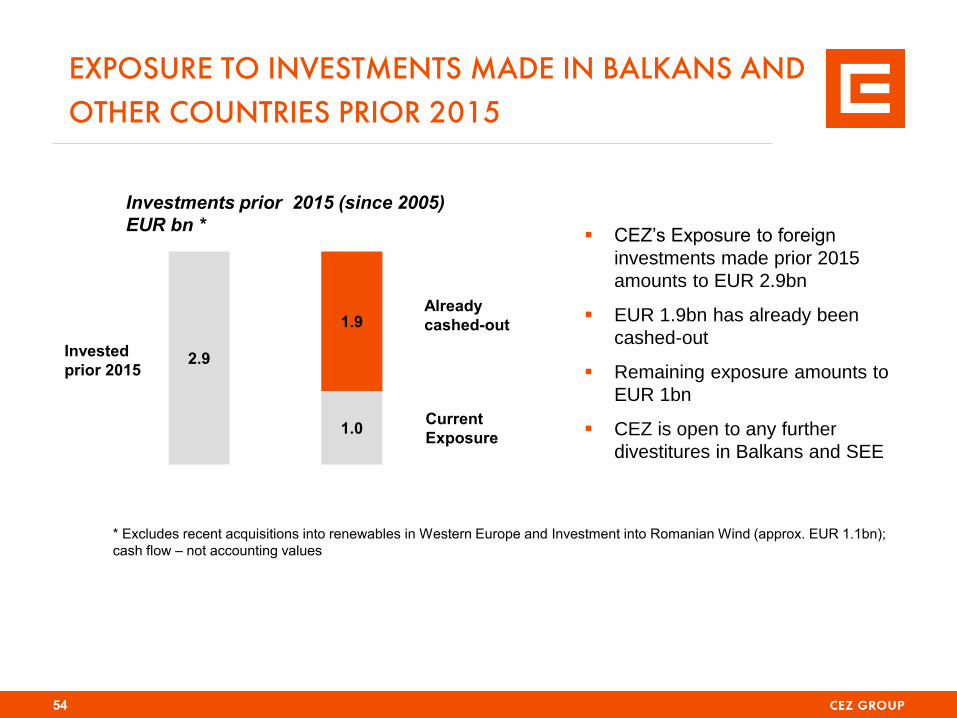
EXPOSURE TO INVESTMENTS MADE IN BALKANS AND
OTHER COUNTRIES PRIOR 2015
54
2.9
1.0
1.9
* Excludes recent acquisitions into renewables in Western Europe and Investment into Romanian Wind (approx. EUR 1.1bn);
cash flow – not accounting values
Already
cashed-out
Current
Exposure
Investments prior 2015 (since 2005)
EUR bn *
Invested
prior 2015
CEZ’s Exposure to foreign
investments made prior 2015
amounts to EUR 2.9bn
EUR 1.9bn has already been
cashed-out
Remaining exposure amounts to
EUR 1bn
CEZ is open to any further
divestitures in Balkans and SEE
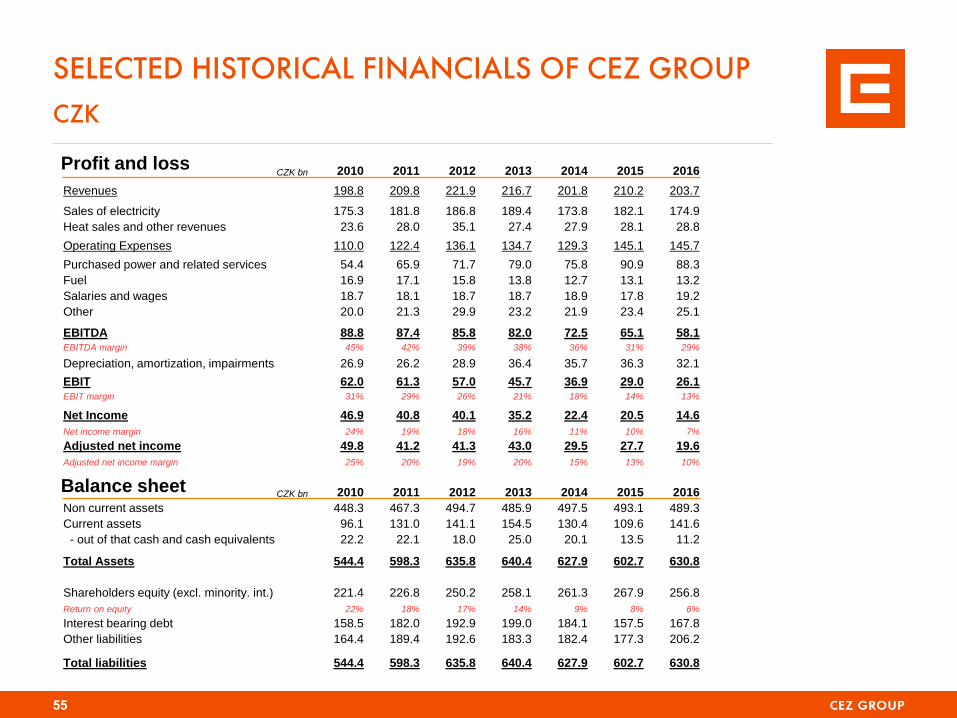
CZK bn 2010 2011 2012 2013 2014 2015 2016
Revenues 198.8 209.8 221.9 216.7 201.8 210.2 203.7
Sales of electricity 175.3 181.8 186.8 189.4 173.8 182.1 174.9
Heat sales and other revenues 23.6 28.0 35.1 27.4 27.9 28.1 28.8
Operating Expenses 110.0 122.4 136.1 134.7 129.3 145.1 145.7
Purchased power and related services 54.4 65.9 71.7 79.0 75.8 90.9 88.3
Fuel 16.9 17.1 15.8 13.8 12.7 13.1 13.2
Salaries and wages 18.7 18.1 18.7 18.7 18.9 17.8 19.2
Other 20.0 21.3 29.9 23.2 21.9 23.4 25.1
EBITDA 88.8 87.4 85.8 82.0 72.5 65.1 58.1 EBITDA margin 45% 42% 39% 38% 36% 31% 29%
Depreciation, amortization, impairments 26.9 26.2 28.9 36.4 35.7 36.3 32.1
EBIT 62.0 61.3 57.0 45.7 36.9 29.0 26.1 EBIT margin 31% 29% 26% 21% 18% 14% 13%
Net Income 46.9 40.8 40.1 35.2 22.4 20.5 14.6
Net income margin 24% 19% 18% 16% 11% 10% 7%
Adjusted net income 49.8 41.2 41.3 43.0 29.5 27.7 19.6
Adjusted net income margin 25% 20% 19% 20% 15% 13% 10%
CZK bn 2010 2011 2012 2013 2014 2015 2016
Non current assets 448.3 467.3 494.7 485.9 497.5 493.1 489.3
Current assets 96.1 131.0 141.1 154.5 130.4 109.6 141.6
- out of that cash and cash equivalents 22.2 22.1 18.0 25.0 20.1 13.5 11.2
Total Assets 544.4 598.3 635.8 640.4 627.9 602.7 630.8
Shareholders equity (excl. minority. int.) 221.4 226.8 250.2 258.1 261.3 267.9 256.8
Return on equity 22% 18% 17% 14% 9% 8% 6%
Interest bearing debt 158.5 182.0 192.9 199.0 184.1 157.5 167.8
Other liabilities 164.4 189.4 192.6 183.3 182.4 177.3 206.2
Total liabilities 544.4 598.3 635.8 640.4 627.9 602.7 630.8
SELECTED HISTORICAL FINANCIALS OF CEZ GROUP
CZK
55
Profit and loss
Balance sheet
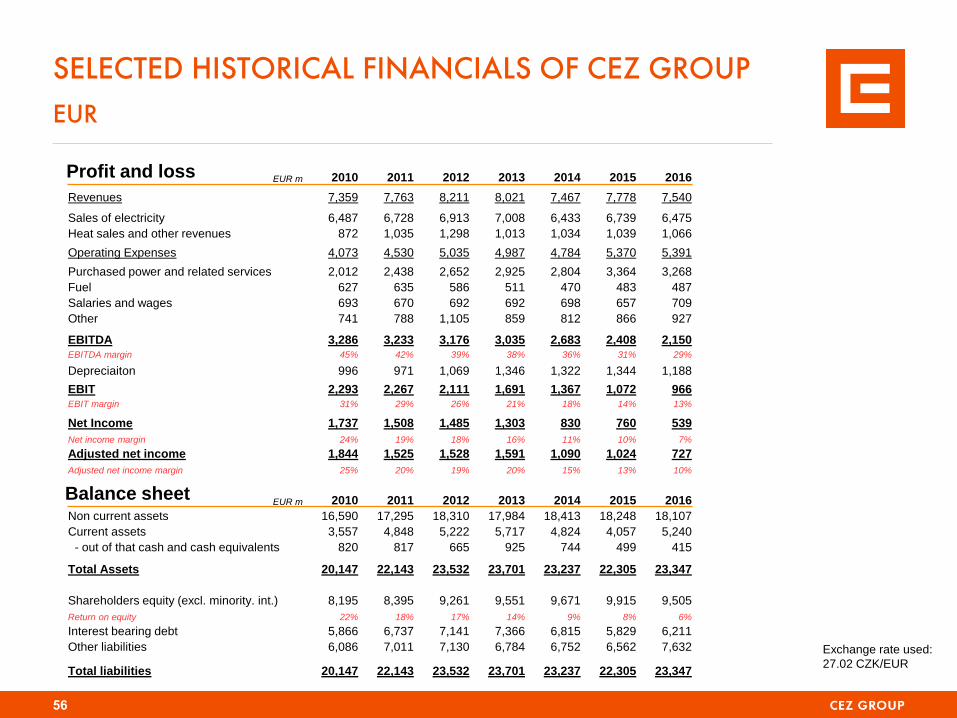
EUR m 2010 2011 2012 2013 2014 2015 2016
Revenues 7,359 7,763 8,211 8,021 7,467 7,778 7,540
Sales of electricity 6,487 6,728 6,913 7,008 6,433 6,739 6,475
Heat sales and other revenues 872 1,035 1,298 1,013 1,034 1,039 1,066
Operating Expenses 4,073 4,530 5,035 4,987 4,784 5,370 5,391
Purchased power and related services 2,012 2,438 2,652 2,925 2,804 3,364 3,268
Fuel 627 635 586 511 470 483 487
Salaries and wages 693 670 692 692 698 657 709
Other 741 788 1,105 859 812 866 927
EBITDA 3,286 3,233 3,176 3,035 2,683 2,408 2,150 EBITDA margin 45% 42% 39% 38% 36% 31% 29%
Depreciaiton 996 971 1,069 1,346 1,322 1,344 1,188
EBIT 2,293 2,267 2,111 1,691 1,367 1,072 966 EBIT margin 31% 29% 26% 21% 18% 14% 13%
Net Income 1,737 1,508 1,485 1,303 830 760 539
Net income margin 24% 19% 18% 16% 11% 10% 7%
Adjusted net income 1,844 1,525 1,528 1,591 1,090 1,024 727
Adjusted net income margin 25% 20% 19% 20% 15% 13% 10%
EUR m 2010 2011 2012 2013 2014 2015 2016
Non current assets 16,590 17,295 18,310 17,984 18,413 18,248 18,107
Current assets 3,557 4,848 5,222 5,717 4,824 4,057 5,240
- out of that cash and cash equivalents 820 817 665 925 744 499 415
Total Assets 20,147 22,143 23,532 23,701 23,237 22,305 23,347
Shareholders equity (excl. minority. int.) 8,195 8,395 9,261 9,551 9,671 9,915 9,505
Return on equity 22% 18% 17% 14% 9% 8% 6%
Interest bearing debt 5,866 6,737 7,141 7,366 6,815 5,829 6,211
Other liabilities 6,086 7,011 7,130 6,784 6,752 6,562 7,632
Total liabilities 20,147 22,143 23,532 23,701 23,237 22,305 23,347
Exchange rate used:
27.02 CZK/EUR
SELECTED HISTORICAL FINANCIALS OF CEZ GROUP
EUR
56
Profit and loss
Balance sheet
CEZ, a. s.
Duhova 2/1444
14 053 Praha 4
Czech Republic
www.cez.cz
57
INVESTOR RELATIONS CONTACTS
Jan Brožík
Investor Relations
Phone:+420 211 042 305
email: [email protected]
Radka Nováková
Shares and dividends administration
Phone:+420 211 042 541
email: [email protected]
Jan Hájek
Investor Relations
Phone:+420 211 042 687
email: [email protected]