cfa institute research challenge de manila university student research concepcion industrial...
TRANSCRIPT

CFA Institute Research Challenge hosted by
CFA Society of the Philippines Ateneo de Manila University

Ateneo de Manila University Student Research
Concepcion Industrial Corporation (CIC) This report is published for educational purposes only by students Industrial Sector, Electrical Component & Equipment Industry competing in the CFA Institute Research Challenge. Philippine Stock Exchange (PSE)
DATE: 11/28/2014 PRICE: PHP 41.00 RECOMMENDATION: BUY (23.14% UPSIDE) TICKER: CIC.PM (BLOOMBERG) TARGET PRICE: PHP 50.49
MARKET SNAPSHOT
Outstanding Shares 339.6 mn
Free Float Level 29%
Market Capitalization Php 13.6 bn
Listing Date 11/27/2013
Par Value Php 1.00
External Auditor Isla Lipana Co.
Adj. 52 week High: Php 43.69/share
Adj. 52 week Low: Php 16.54/share
Dividend Yield (NTM) 1.87%
Source: Philippine Stock Exchange
TRAILING RETURN
CIC PSEi
1 month 2.50% 3.22%
3 month 1.23% 2.73%
6 month 45.23% 7.46%
12 month 105.00% 18.22% Source: Thomson Reuters, Bloomberg
SUBSIDIARIES OF CIC
SUBSIDIARY MAIN PRODUCTS
Concepcion-Carrier Air Conditioning Company (CCAC)
Air Conditioners, Commercial Refrigerators
Concepcion Durables Inc. (CDI)
Residential Refrigerators
Concepcion Otis Philippines Inc. (COPI)
Elevators, Escalators, Moving Walkways
Concepcion Midea Inc. Philippines (CMIP)
Consumer Appliances
Source: Team Estimates
TARGET PRICE BREAKDOWN
SUBSIDIARY VALUE PER SHARE1
CCAC 35.74
CDI 11.42
COPI 3.10
CMIP 0.24
CIC 50.49 1Value per share attributable to CIC (in Php) Source: Team Estimates
EARNINGS PER SHARE (IN PHP)
Source: Team Estimates
CIC: There’s Something Cool in the Air
We issue a BUY recommendation on Concepcion Industrial Corporation (CIC) with a target price of Php 50.49/sh using Sum-of-Parts Valuation method and Discounted Free Cash Flow to Firm (DCF) analysis. This presents an upside of 23% from the closing price of Php 41.00/sh on November 28, 2014. We expect its EPS to grow at a compound annual growth rate (CAGR) of 12%, from Php 2.03/sh in 2014 to Php 4.08/sh in 2020, driven by its market leadership with proven track record, strong growth potential in underpenetrated markets, and financial flexibility to pursue new ventures. MARKET LEADERSHIP WITH PROVEN TRACK RECORD CIC is the number one seller and manufacturer of air conditioners and refrigerators in the country with a market share of 37% and 25% respectively. This is backed by a long operational history of over 50 years, its above-market performance, and its highly recognized brands such as Carrier, Condura, Kelvinator, and Toshiba. We believe that CIC can at least sustain its market leadership through margin expansion (reaching 20% EBITDA margin in 2020) driven by strong research and development capability, cost reduction efforts, and flexible operations. STRONG GROWTH POTENTIAL IN UNDERPENETRATED MARKETS CIC’s sales is expected to grow at a CAGR of 10% for the years 2014 to 2020. This will be driven by the country’s robust economic growth leading to increasing purchasing power and booming real estate industry. These factors will propel the demand for air conditioners and refrigerators as Philippines’ penetration rates are only at 6% and 35%, respectively, one of the lowest among its ASEAN neighbors. As the market leader, CIC is poised to capitalize on this growth. FINANCIAL FLEXIBILITY TO SUSTAIN BUSINESS AND PURSUE NEW VENTURES CIC can sustain its current business and pursue mergers and acquisitions (M&As) with its strong cash flows and underleveraged position. It is able to return value to its shareholders via dividends and finance its capital expenditures through internally generated funds as evidenced by its average free cash flows of around Php 1.1 bn annually for the next five years. CIC’s debt ratio has been consistently low at 14%, further highlighting the company’s low risk and capacity to acquire loans at a lower marginal cost of debt. The company’s strong cash flows and underleveraged position gives CIC the financial flexibility to seek new ventures in line with its long-term goal of being the leading provider of comprehensive consumer and building solutions. Recently, the company entered into joint ventures (JVs) with Otis Philippines and Midea to expand the company’s business into the people-moving products (e.g. elevators, escalators, moving walkways) and the Php 60-bn consumer appliance market. Moving forward, CIC intends to acquire fire, security, and lighting solutions as it strives to be a one-stop shop for both its individual and institutional clients.
KEY FINANCIAL RATIOS
2014E 2015F 2016F 2017F 2018F 2019F 2020F
Sales YoY Growth Rate (%) 19.55 10.86 10.29 9.95 9.68 9.49 9.27
EBITDA Margin (%) 18.44 17.70 18.30 18.87 18.97 19.08 19.71
Net Income Margin (%) 12.26 11.76 12.21 12.65 12.75 12.90 13.39
Cash Ratio 0.62 0.77 0.94 1.12 1.30 1.48 1.66
Debt Ratio (%) 14.18 12.27 10.72 9.35 8.22 7.25 6.39
Return on Equity (%) 30.34 27.20 25.68 24.34 22.68 21.42 20.82
Earnings per Share 2.03 2.17 2.48 2.87 3.17 3.51 4.08
EPS Growth (%) 27.27 6.68 14.22 16.01 10.54 10.59 16.18
Free Cash Flow per Share 1.92 2.44 2.87 3.28 3.65 4.03 4.60
0%
5%
10%
15%
20%
0.0
2.0
4.0
6.0
20
14E
20
15F
20
16F
20
17F
20
18F
20
19F
20
20
F
YoY
Gro
wth
EP
S (
in P
hp)
EPS YoY Growth

Ateneo de Manila University Student Research | 2
FIGURE 1. MARKET SHARE OF LOCAL PLAYERS IN AIR CONDITIONING INDUSTRY,
BY VOLUME (2013)
Source: Company Data
FIGURE 2. MARKET SHARE OF LOCAL PLAYERS IN THE REFRIGERATION
INDUSTRY, BY VOLUME (2013)
Source: Company Data
FIGURE 3. CIC REVENUE BREAKDOWN, BY SEGMENT (2013)
Source: Company Data
FIGURE 4. CIC’S EFFECTIVE OWNERSHIP IN ITS SUBSIDIARIES
Source: Company Data
FIGURE 5. GDP (IN PHP TN) AND GDP PER
CAPITA GROWTH RATES
Source: World Bank
Business Description Operating for more than 50 years, Concepcion Industrial Corporation (CIC) is Philippines’ leading supplier and manufacturer of air conditioning and refrigeration appliances. Currently, it is expanding into other consumer appliances and building solutions (see Appendix A-2). It caters to two market segments namely, consumer solutions and business & industrial solutions (see Appendix A-3), which accounts for 80% and 20% of 2013 revenues respectively. CIC's Business Model Canvas is shown in Appendix A-4.
MARKET LEADER IN AIR CONDITIONING AND REFRIGERATION CIC is a holding company that primarily operates through two of its subsidiaries, Concepcion-Carrier Air Conditioning Company (CCAC) and Concepcion Durables Inc. (CDI), the country’s leading suppliers of air conditioning at 37% volume share (see Figure 1) and refrigeration appliances at 25% volume share (see Figure 2) respectively. Air conditioning sales made up 65% of the company’s 2013 revenues, refrigeration sales accounted for 31%, and after-sales revenues made up 4% (see Figure 3). CCAC manufactures, sells, distributes, installs, and provides comprehensive air conditioning and commercial refrigeration products and services. This comprises 69% of 2013 sales. It employs a multi-brand strategy to target consumers from different segments, with Carrier and Toshiba catering to the high-end segment, Condura targeting the mid-tier segment, and Kelvinator targeting the entry level segments. On the other hand, CDI manufactures, assembles, wholesales, and retails residential refrigeration appliances through its market-leading brands, Kelvinator and Condura. It focuses solely on the residential and light commercial (RLC) segment, which accounted for 31% of the company’s sales in 2013 (see Figure 3). Both subsidiaries operate a manufacturing plant in Cabuyao, Laguna, with a combined production area of 35,000 sq. meters This is equivalent to an annual production capacity of 500,000 units for air conditioners and 300,000 units for refrigerators given 1-2 production shifts per day, making CIC the largest air conditioning and refrigeration manufacturer in the country. The management does not see the need to increase the plant capacity in the near future given its current utilization rate of 56% for CCAC and 78% for CDI, and that operations may scale up to 3-4 production shifts per day.
STRATEGIC PARTNERSHIPS AND ACQUISITIONS Last November 2013, CIC entered into a joint venture with Midea Group, one of the largest consumer appliance manufacturers and distributors in the world, to form Concepcion Midea Inc. Philippines (CMIP). CIC’s 40% share (see Figure 4) of CMIP allows it to broaden its reach in the Php 60-bn consumer appliance market. Last March 2014, CIC engaged in a joint venture agreement with UTC-Asia Pte. Ltd., a subsidiary of United Technologies Corp., to take 51% equity stake (see Figure 4) in Concepcion Otis Philippines Inc. (COPI). COPI sells and services elevators, escalators, and moving walkways, thus broadening the building and industrial solutions (BIS) that CIC can offer to its institutional clients. CIC plans to capitalize its current relationships with tier one real estate developers to drive growth in COPI’s revenues.
OWNERSHIP STRUCTURE CIC is owned by the public and three major shareholders. The three major shareholders are Foresight Realty and Development Corp., formerly Concepcion Holdings Inc., Hyland Realty and Development Corp., and Horizons Realty Inc. The Concepcion family, who has been operating the business for more than 50 years, owns these major shareholders, which comprise 71.4% of the total shares. The public owns the remaining 28.6%.
CORPORATE GOVERNANCE CIC believes in conducting its business and operations in accordance with the principles and best practices of good corporate governance. It aims to engender a good reputation in the market place, leading to long-term sustainability and success. Top management is comprised of experts with a proven track record of over 20 years of experience in the field to lead CIC to sustained growth. Further discussion on Corporate Governance is detailed in Appendix F.
Industry Overview and Competitive Positioning INDUSTRY OVERVIEW: STRONG GROWTH POTENTIAL Rise in Infrastructure Driven by Economic Growth The Philippines has enjoyed unprecedented economic growth over the years, with GDP per capita growth of around 7% from 2011 to 2013 (see Figure 5). Following this trend, the expected rise in GDP per capita will translate into more infrastructures such as housing, offices, and shopping malls. New office supply in the major commercial business districts is expected to grow at a CAGR of 8.3%, while the supply of residential units is expected to grow at a CAGR of 10.4% for the next three years. This rise in infrastructure translates into stronger demand for consumer appliances and industrial building solutions.
Wider Market Base Due to Demographic Shift and Increasing Household Income With the country’s low median age of 22.9 years old (see Figure 6), the working population is expected to grow rapidly. Coupled with a decreasing unemployment rate (see Figure 7), this translates into a growing middle class that is forecasted to comprise 61% of the population in 2017. In addition, the steady influx of overseas remittances further increases household disposable income at a CAGR of 7% from 2013 to 2020, outgrowing the forecasted inflation rate of 4% (see Figure 8). This demographic shift and rising household income will increase the size of CIC’s potential market.
37%
22%
9%
7%
6%
19%
CIC Panasonic Samsung Korur LG Others
25%
22%
12%
12%
11%
18%
CIC Panasonic LG Haier Sharp Others
51%
31%
14%
4%
CCAC-AC: Residential & Light Commercial CDI-Ref: Residential & Light Commercial CCAC-AC: Commercial & Industrial After-market Sales
CIC
CCAC
60%
Otis
51%
Midea
40%
CDI
100%
2.2%
10.3%
6.0% 7.0% 7.4%
0.0
3.0
6.0
9.0
12.0
20
09
20
10
20
11
20
12
20
13
GDP
GDP per capita Growth Rate
in Php
tn

Ateneo de Manila University Student Research | 3
FIGURE 6. AGE-SEX PYRAMID OF THE PHILIPPINES (2010)
Source: Philippine Statistical Authority
FIGURE 7. LABOR FORCE POPULATION (IN MN) AND UNEMPLOYMENT RATE
Source: World Bank, Philippine Statistics Authority, Philippine Institute for Development Studies
FIGURE 8. HOUSEHOLD ANNUAL DISPOSABLE INCOME IN PHP ‘000
Source: Bangko Sentral ng Pilipinas
FIGURE 9. AIR CONDITIONING AND REFRIGERATION PENETRATION RATES
Source: Euromonitor, World Bank
FIGURE 10. PORTER'S FIVE FORCES ANALYSIS
Source: Team Analysis
Growth Potential from Increasing Penetration Rate The penetration rates of air conditioners and refrigerators in the country are 6% and 35%, respectively, which are some of the lowest in the ASEAN region (see Figure 9). However, these rates are expected to increase over the years due to the booming real estate industry and the increasing purchasing power of the Filipinos. Together, these three factors directly contribute to the increasing demand for air conditioning and refrigeration units. With strong brand recognition and innovative solutions, CIC is geared to tap into these growing markets and grow the sales of CCAC, CDI, COPI, and CMIP at a CAGR of 9.83%, 10.21%, 13.58%, and 10.40% respectively for the years 2014 to 2020.
CIC and the ASEAN With the upcoming ASEAN economic integration, new competitors are expected to enter the country’s consumer appliance market. However, the industry analysis (see Table 8) indicates that CIC will remain as a market leader through its active M&A strategy and distinctive competencies. With a long operational history, CIC has the first-mover advantage and brand loyalty from consumers. Moreover, we do not expect the ASEAN economic integration to result into a price war. Through the ASEAN Trade in Goods Agreement (ATIGA), member nations are already implementing preferential tariff rates of 0% for imported air conditioners, refrigerators, and primary raw materials since February 2009. With CIC’s commitment to efficiency, active efforts in cost reduction, and vast distribution network, we expect CIC to withstand increasing competition in the industry.
Porter’s Five Forces Analysis A summary of our industry analysis is shown in Figure 10 and Table 8. A more extensive discussion is presented in Appendix C-1.
TABLE 8. PORTER’S FIVE FORCES ANALYSIS
PORTER’S FORCE
LEVEL DESCRIPTION
Bargaining Power of Buyers
Moderate to
Significant
Given the low switching cost, consumers drive quality and innovation of products in the industry. They pressure the manufacturers to provide differentiated products by incorporating features such as energy efficiency and environmental sustainability at affordable cost.
Bargaining Power of Suppliers
Low
Despite the high importance of quality and the lack of available substitutes for the raw material inputs, supplier power is low primarily due to minimal switching costs from undifferentiated raw material inputs and the large supplier size relative to the number of manufacturers.
Threat of New Entrant
Low Barriers to entry in the industry are very high due to the capital intensity, high fixed costs, heavy investments in R&D, and high significance of economies of scale.
Threat of Substitute
Low to Moderate
Electric and cooling fans are possible substitute products for air conditioners. As for refrigeration appliances, there are no clear substitute products, but consumers may choose to purchase their food on a per need basis. Despite the presence of cheaper alternatives, these do not provide its users the same level of utility as with air conditioners and refrigerators.
Rivalry of Existing
Competitors
Significant
The list of CIC’s key competitors for each market segment is summarized in Table 1. The presence of both local and international players intensifies the competition within the market. Buyers having moderate to significant bargaining power, price wars, high exit cost for the firms imply that the rivalry of existing competitors is significant.
Source: Team Analysis
COMPETITIVE POSITIONING: MARKET LEADERSHIP A detailed discussion of CIC’s strengths is presented below. The summary of the SWOT Analysis is shown in Appendix C-2.
Leading and Trusted Brands to Capture Different Market Segments Having operated for more than 50 years in the industry, CIC has a strong reputation in the country and a loyal customer base. CIC believes that holding numerous trusted brands in its portfolio allows it to achieve its leadership position in both air conditioning and refrigeration industries. CIC employs a multi-brand strategy in the market for air conditioners and refrigerators: Carrier and Toshiba for high-end segment, Condura as mid-tier brand, Kelvinator for entry to mid-tier segment, and Midea as an entry-level brand (see Table 9). This strategy allows CIC to capture a broader customer base by offering products with varying features and price points. This strategy is highly suitable for the country’s growing middle class.
Strong Local Knowledge and R&D Capability to Defend Market Leadership CIC prides itself in its strong local knowledge, which enables it to differentiate its products from its competitors. With its eight self-owned R&D laboratories, more than 30 engineers, and design teams, it develops customized product solutions, next-generation products, latest technology, and best practices that specially target local consumers (see Table 2). An example of its product innovation is the patented energy-saving plug built into Carrier air conditioners, which automatically switches the fan on when the air conditioner shuts down. This innovation is intended to allow consumers to save on electricity costs, as the electricity cost in the country is among the highest in Asia. Furthermore, the company’s strong R&D facility allows it to engage in cost reduction efforts such as product re-engineering to drive margin expansion.
6.0 4.0 2.0 0.0 2.0 4.0 6.0
5- 10-14
20-24 30-34 40-44 50-54 60-64 70-74 80-84
Male (in mn) Female (in mn)
Age
7.4% 7.5%
7.3%
7.0% 7.0% 7.1%
0
10
20
30
40
50
20
08
20
09
20
10
20
11
20
12
20
13
Labor Force Population (in mn)
Unemployment Rate (% of labor force)
in mn
0
100
200
300
400
500
600
700
20
08
20
09
20
10
20
11
20
12
20
13
20
14E
20
15F
20
16F
20
17F
4% inflation rate
in Php
'000
0
20
40
60
80
100
0%
20%
40%
60%
80%
100%
PH
L
IND
TH
A
MLY
SIN
GD
P p
er C
apita
(in U
SD
'00
0)
Peentr
ation R
ate
Air Conditioning Refrigeration GDP per capita, PPP (in USD '000)
0
1
2
3
4
5
Bargaining Power of Buyers
Threat of Substitute Products
Bargaining Power of Suppliers
Rivalry of Existing Competitors
Threat of New
Entrants

Ateneo de Manila University Student Research | 4
TABLE 1. COMPETITORS OF CIC
MARKET SEGMENT COMPETITOR
RLC Air Conditioning
Panasonic
Samsung
Hitachi
Commercial and Industrial Air Conditioning
Mitsubishi
Trane
York
Hitachi
LG
RLC Refrigeration
Panasonic
Samsung
Sharp
LG
Whirlpool
Commercial and Industrial Refrigeration
Grasso
GNQ
KR
Zikor
Ruey Shing Source: Company Data
TABLE 2. STRONG R&D CAPABILITY
STRONG R&D CAPABILITY
Philippines' Largest Air Conditioning and Refrigeration Lab
8 Self-Owned R&D Laboratories
Vibration Laboratory and Sound Room
Simulation and Environment Laboratory
3 Psychometric Laboratories
Thermal Cycling Room
Thermal Calibration Machine
Comprehensive Engineering and Design Team
30 Engineering and Design Teams
Source: Company Data
FIGURE 11. CIC EBITDA MARGIN VS. COMPETITORS IN 2012
Source: Thomson Reuters, Company Data
FIGURE 12. PRODUCT CYCLE
Source: Company Data
TABLE 3. DISTRIBUTION NETWORK
Nationwide Logistic Network
Distribution Across the Philippines
Nationwide Retail Coverage
90% Retail Store Coverage
In-Store Merchandisers
Over 1,000+ Merchandisers
Source: Company Data
TABLE 9. CIC'S AWARDS AND RECOGNITIONS
BRAND MARKET
SEGMENT AWARDS AND RECOGNITIONS
High-End
Philippines’ best-selling air conditioner brand in 2010 Reader’s Digest Trusted Brand for the past 17 years
Mid-Tier
Leading domestic air conditioning and refrigeration brand Reader’s Digest Trusted Brand for the past 9 years for air conditioners Reader’s Digest Trusted Brand for the past 2 years for refrigerators
Entry to Mid-Tier
Leading air conditioner and refrigerator brand internationally Introduced the world’s first automatic-control refrigerator
High-End Leading consumer brand globally Introduced the first inverter air conditioner
Entry Level
Leading appliance brand globally No.1 manufacturer of major home appliances for 2012 and 2013
Source: Company Data
Cost Leadership and Lean Manufacturing Operations Result to Immense Savings CIC has had consistently high EBITDA margins compared to its competitors in the past (see Figure 11). With CIC’s strong commitment to efficiency, strong profitability is expected to continue, as they are able to maintain an OPEX-to-sales percentage of 17% that is superior to its competitors. In 2013, the company adopted efforts to improve its operational efficiency, which is expected to amount to total savings of Php 73 mn from engineering, purchasing, and manufacturing activities.
Flexible Operations due to Unique Outsourcing Strategy Enables CIC to Supply Growing Demand CIC employs a unique outsourcing strategy that enables both of its air conditioning and refrigeration plants to maintain lean manufacturing systems. Certain stages in the manufacturing process are outsourced to “negosyo partner corporations”, which are cooperatives comprised mostly of former CIC employees. This strategy provides CIC’s production the flexibility to scale up or down depending on the demand and simultaneously controls costs.
Offering of Customized End-to-End Solutions to Cultivate Brand Loyalty CIC’s integrated operations, from manufacturing to after-sales services, allow it to adapt to changing consumer needs. It does not only offer air conditioning and refrigeration products, but also develop solutions that cater to the entire life cycle of its products (see Figure 12). Unlike other manufacturers, CIC enters as early as the planning and designing stage of real estate projects. Having its own manufacturing plant in the country and a strong R&D facility, CIC is able to customize air conditioner and refrigerator designs based on the needs of its clients. CIC believes that this unique end-to-end business model and its ability to custom-fit designs allow it to develop customer loyalty.
Extensive After-Sales Support and Strong Tier One Relationships to Mobilize COPI Growth CIC currently has a strong relationship with seven of the top ten tier one real estate developers in the country. Moreover, its after-sales network is also considered as the largest in the country (see Table 4). Its air conditioning business includes partnerships with over 170 installer companies, 70 service centers, and 8 dedicated parts stores, while its refrigeration business has 69 service centers nationwide. After-sales is considered to be COPI’s key driver for profitability as it has larger profit margins of around 30% to 40%. CIC’s joint venture to form COPI allows the latter to capitalize on CIC’s existing customer relationships and leverage on CIC’s strong after-sales support system, making it the preferred choice of consumers and clients in both the residential and commercial segment.
Wide-Scale Sales Distribution Network and Strong Brand Image to Propel CMIP Growth CIC has a wide-scale distribution network that places its products in approximately 90% of all appliance outlets in the country (see Table 3). This, together with its strong brand image, allows CMIP to increase its sales and build the Midea brand. CIC believes that its multi-channel presence and distribution are key to strengthening its relationships and partnerships with consumers and retailers by ensuring the availability of its products.
Corporate Key Directions and Growth Strategy STRENGTHENING MARKET LEADERSHIP Cost Reduction Efforts to Improve Profitability As CIC expands its current core business, it seeks to further strengthen cost leadership through unlocking potential synergies such as shared back end support systems and various cost reduction efforts. For the year ended 2013, CIC saved roughly Php 73 mn, amounting to 4% of the year’s COGS and OPEX. The list of cost reduction projects implemented in 2013 is presented in Appendix C-3. It is expected that the company will save up another Php 70 mn by the end of 2014 and Php 120 mn in the year 2015. CIC’s cost reduction efforts are focused on the following aspects:
• Purchasing Savings - trade discounts on bulk purchases, price hedging on raw materials
• Engineering-Related Savings - driven by the company’s strong research and development in increasing material productivity through altering product designs, down gauging, and material substitution
• Productivity Savings - increased efficiency and utilization rate of both equipment and employees
• Logistics Savings - optimization of distribution routes, maximization of container capacity
• Supplier Chargebacks - payment of replacement costs, penalties, and damages from suppliers due to defective raw materials
0%
5%
10%
15%
20%
CIC Panasonic Daikin Sampo
Designing Stage
Equipment Scoping and
Selection
Supply Installation
Testing and Commissioning
After-Sales

Ateneo de Manila University Student Research | 5
TABLE 4. AFTER-SALES SUPPORT
24/7 Customer Care
24/7 Contact Center
Nationwide Service & Install Capability
In-House Technicians
Service Center Finder
Carrier Certified Installer
Highly Trained Service Technicians
Training and Audit Partners - TESDA & Don Bosco
Dedicated Parts Stores
8 Totaline Parts Stores Strategically Located
Source: Company Data
FIGURE 13. INCREASING REFRIGERATOR PENETRATION RATE AS GDP PER CAPITA
INCREASES
Source: Euromonitor, World Bank
FIGURE 14. INCREASING AIR CONDITIONER PENETRATION RATE AS GDP PER CAPITA
INCREASES
Source: Euromonitor, World Bank
FIGURE 15. CCAC AND CDI OPERATING CASH FLOW
Source: Team Estimates
FIGURE 16. CIC DEBT-TO-ASSET RATIO
Source: Team Estimates
Diversifying Into Specialized Turnkey Solutions With a strong foothold in the retail segment of the air conditioning and refrigeration market, CIC aims to diversify its business into specialized turnkey solutions. Capitalizing on the company’s strong R&D capability and relationship with tier one real estate developers, CIC aims to provide custom-fit air conditioner and refrigerators to its institutional clients. This will enable the company to have an established after-sales customer base and tap a different distribution channel that has high volume demand.
TAPPING THE UNDERPENETRATED MARKET Multi-Brand Strategy to Capture Different Market Segments Holding numerous trusted brands in its portfolio, CIC implements a multi-brand strategy in the market for air conditioners and refrigerators: Carrier and Toshiba for high-end segment, Condura as mid-tier brand, Kelvinator for entry to mid-tier segments, and Midea as entry-level brand (see Table 9). The company believes its multi-brand strategy will allow it to continue to expand its product portfolio with varying features and price points, meeting the needs of a broader range of customers, especially in terms of the growing Philippine middle class.
GROWTH IN NEW VENTURES Comprehensive Product Lineup in Consumer Solutions Group CIC aims to become the largest consumer appliance company in the country. To achieve this, CIC plans to offer a comprehensive product lineup that caters to different market segments in the consumer appliance industry. This will allow CIC to maintain its leadership position in the core markets, broaden the company’s product range, and mitigate the risk of losing market share to differently priced substitutes. CIC’s recent joint venture agreement to form CMIP gives the company the access to penetrate the consumer appliance market and fill in the gaps in its product portfolio.
Complete Customized End-to-End Business and Industrial Solutions Provider CIC aims to provide complete end-to-end building and industrial solutions by eyeing strategic acquisitions and joint ventures in the field of security systems, lighting fixtures, and fire safety. Few of CIC’s possible acquisitions or JVs are United Technologies’ brands such as Chubb, leading provider of security and fire-safety solutions, and Kidde, leading manufacturer of residential smoke alarms, carbon monoxide (CO) alarms, and fire extinguishers. See Appendix C-4 for a list of UTC’s building and industrial system brands and products.
Investment Summary We issue a BUY recommendation on Concepcion Industrial Corporation (CIC) with a target price of Php 50.49/sh using Sum-of-Parts Valuation method and Discounted Free Cash Flow to Firm (DCF) analysis. This presents an upside of 23% from the closing price of Php 41.00/sh on November 28, 2014. We expect its EPS to grow at a CAGR of 12%, from Php 2.03/sh in 2014 to Php 4.08/sh in 2020, driven by its market leadership with proven track record, strong growth potential in underpenetrated markets, and financial flexibility to pursue new ventures.
DOMINANT MARKET POSITION SUPPORTED BY LOCAL KNOWLEDGE AND PRESENCE CIC is the market leader in its core businesses namely air conditioning and refrigeration garnering market share of 37% and 25% respectively. It can strengthen its market position through margin expansion (reaching 20% EBITDA margin in 2020) driven by strong R&D capability, cost reduction efforts, and flexible operations. With its long operational history of over 50 years, CIC has built its highly reputable brands such as Carrier, Condura, Kelvinator, and Toshiba through its commitment to product innovation and adaptability to local consumer preferences. With its products available in 90% of all appliance stores nationwide, CIC has a strong market presence and a comprehensive after-sales support.
SOLID TOPLINE GROWTH IN UNDERPENETRATED MARKETS We expect CIC’s sales to grow at a CAGR of 10% for the next five years due to growing demand for air conditioners and refrigerators. Increasing purchasing power, as evidenced by a GDP per capita growth rate of 8% year-over-year, is expected to push penetration rates of air conditioners and refrigerators, which are currently at 6% and 35% respectively. With an expanding middle class and a steady influx of overseas remittances, household income is expected to grow by 7% year-over-year from 2013 to 2020. With the Philippines at a tipping point relative to its ASEAN neighbors (see Figure 13 and Figure 14), CIC aims to further increase its revenues through capitalizing the booming real estate industry that is growing at a CAGR of 9.3% from 2013 to 2020 using its relationships with tier one real estate developers.
HEALTHY CASH FLOW TO FUND OPERATIONS AND FUTURE MERGERS AND ACQUISITIONS CIC’s long-term goal is to provide comprehensive solutions for both its consumer and business & industrial segments, which it intends to achieve by sustaining its current business and pursuing strategic acquisitions and joint ventures. Moving forward, CIC plans to further strengthen its building and industrial solutions by acquiring businesses specializing in security systems, lighting fixtures, and fire safety. CIC aims to become the one-stop shop for real estate developers to drive sustainable sales growth thereby strengthening its leadership position and providing potential upside. CIC has the option to sustain its current business and finance its new ventures with internally generated funds and borrowings. With strong cash flows that average at Php 1.1 bn annually from 2015 to 2020 (see Figure 15), CIC can return value to its shareholders via dividends and support its capital expenditures through internally generated funds. Moreover, as of the third quarter of 2014, CIC is in a net cash position and has a gross debt-to-equity ratio of only 27%. CIC’s debt-to-asset ratio has also been consistently low at 14% (see Figure 16) highlighting the company’s low risk and enabling the company to fund its future mergers and acquisitions with debt at a low marginal cost of capital.
0%
20%
40%
60%
80%
100%
120%
0 20 40 60 80
GDP per Capita, PPP (in USD '000)
Other Asian Countries
Philippines
Trend Line
0%
25%
50%
75%
100%
125%
150%
0 20 40 60 80
GDP per Capita, PPP (in USD '000)
Other Asian Countries
Philippines
Trend Line
0
300
600
900
1200
1500
20
14E
20
15F
20
16F
20
17F
20
18F
20
19F
20
20
F
Thousa
nds
CCAC CDI
in Php mn
0.00%
4.00%
8.00%
12.00%
16.00%
20
14E
20
15F
20
16F
20
17F
20
18F
20
19F
20
20
F

Ateneo de Manila University Student Research | 6
TABLE 5. TARGET PRICE BREAKDOWN
SUBSIDIARY VALUE PER SHARE1
CCAC 35.74
CDI 11.42
COPI 3.10
CMIP 0.24
CIC 50.49 1Value attributable to CIC (in Php)
Source: Team Estimates
FIGURE 17. CIC FORECASTED FCF TO FIRM
Source: Team Estimates
FIGURE 18. CCAC AND CDI SALES GROWTH RATES
Source: Team Estimates
FIGURE 19. CCAC AND CDI SALES FORECAST
Source: Team Estimates
FIGURE 20. CCAC AND CDI EBITDA MARGINS
Source: Team Estimates
VALUATION METHODS We used the Sum-of-Parts Valuation method and Discounted Free Cash Flow to Firm (DCF) analysis to arrive at our target price of Php 50.49/sh, which presents an upside of 23.14%. CIC operates through its four subsidiaries, namely CCAC, CDI, COPI, and CMIP. Its revenues are independently forecasted using weighted key driver growth rates with a premium, which slowly decreases over the years. The free cash flows derived from the sales forecasts are then discounted using their respective WACCs. We computed a moving WACC for CCAC ranging from 9.54% to 9.63%, based on a targeted capital structure of 10% debt and 90% equity. On the other hand, a constant WACC of 10.40% for CDI, COPI, and CMIP is applied, based on a 100%-equity capital structure. Lastly, we calculated a terminal growth rate of 2.60% 2.13%, 3.25%, and 3.31% for CCAC, CDI, COPI, and CMIP, respectively.
POSSIBLE INVESTMENT RISKS CIC experiences market risk in the form of volatilities in exchange rates, interest rates, and commodity prices. Aside from this, investors must also be aware of the industry risk like the intense rivalry in competition. Operational risks that CIC may face include unplanned breakdown of plant and equipment and the disruption of manufacturing and sales due to its heavy dependence on importation of raw materials and commercial units. A detailed discussion of the risks, together with the company’s response to mitigate these, is presented in the Investment Risk section and is followed by a Sensitivity and Scenario Analysis.
FIGURE 24. SHARE PRICE MOVEMENT AND NEWS FLOW
Source: Company Data, Thomson Reuters
Valuation
SUM OF PARTS - DCF VALUATION STRUCTURE We used the Sum-of-Parts Valuation method and Discounted Free Cash Flow to Firm (DCF) analysis in order to arrive at our target price of Php 50.49/s (see Table 5 and Figure 17), which presents an upside of 23.14% (see Appendix D-1). Using the Sum-of-Parts valuation structure, the forecast of CIC’s financials is divided into four business units, namely CCAC, CDI, COPI, and CMIP, which are treated independently.
ECONOMIC OUTLOOK AND COMPETENCIES SIGNAL GROWTH AND MARGIN EXPANSION IN CIC Core Business: CCAC and CDI The sales of CCAC and CDI are forecasted using two components – (1) weighted key driver growth rates and (2) a premium. We derived the weighted key driver growth rates by decomposing CIC’s key business segments, namely consumer solutions and building and industrial solutions. These segments are further divided into different categories where growth drivers are determined and weighted according to their impact on the business segment (see Appendix D-6). After which, a regression analysis is conducted to show the statistical significance and explanatory power of the key drivers used (see Appendix D-12). As both CCAC and CDI sales are growing above the industry average for the past decade, a premium is calculated for each of the subsidiaries to account for this faster growth rate. Operating in an underpenetrated market, we believe that both subsidiaries will continue to enjoy the benefits of a premium that slowly decreases from 2.80 for CCAC and 2.41 for CDI in 2014 to 0 at the terminal phase in 2021 (see Appendix D-13). The resulting industry growth rates, without the premium, are 8.88% and 9.50% for air conditioners and refrigerators respectively. Incorporating the premium yields a growth rate of 11.68% and 11.91% for CCAC and CDI respectively, both of which are at a diminishing marginal rate of decline thereafter until it reaches a sustainable growth in 2021 (see Figure 18). The growth rate components of CCAC and CDI are outlined in Appendix D-7 and D-8. CIC’s core businesses rely heavily on importing commodities such as steel, copper, and aluminum. To take into account the fluctuations of the prices of these commodities, we have adjusted the COGS margin of CCAC and CDI to match the forecasted movement of the market (see Appendix D-18), resulting to a COGS margin of 60.83% for CCAC and 80.92% for CDI. With CIC’s flexibility in operations and strong commitment towards efficiency through its cost reduction efforts, CCAC’s EBITDA margin is expected to be 22%, which is significantly higher than the industry average of 10%. As for CDI, EBITDA margin is expected to reach 8% by 2014-2016, 10% by 2017-2019, and 12% from 2020 onwards (see Figure 20).
20
14E
20
15F
20
16F
20
17F
20
18F
20
19F
20
20
F 0.0
0.2
0.4
0.6
0.8
1.0
1.2
1.4
1.6
1.8
8.0%
9.0%
10.0%
11.0%
12.0%
20
14E
20
15F
20
16F
20
17F
20
18F
20
19F
20
20
F
CCAC CDI
0
2
4
6
8
10
20
14E
20
15F
20
16F
20
17F
20
18F
20
19F
20
20
F
CCAC CDI
in Php bn
0.0%
5.0%
10.0%
15.0%
20.0%
25.0%
20
14E
20
15F
20
16F
20
17F
20
18F
20
19F
20
20
F
CCAC CDI
Semi-Annual Dividend
Declaration
Finalized JV with Otis
Annual Report Release
Quarterly Report Release
News Release about JV
with Midea
Annual Stockholder's
Meeting
0%
50%
100%
150%
200%
250% 11
/27/
13
12/1
1/13
12/2
5/1
3
1/8/1
4
1/22/1
4
2/5
/14
2/1
9/1
4
3/5
/14
3/1
9/1
4
4/2
/14
4/1
6/1
4
4/3
0/1
4
5/1
4/1
4
5/2
8/1
4
6/1
1/14
6/2
5/1
4
7/9/1
4
7/23/1
4
8/6
/14
8/2
0/1
4
9/3
/14
9/1
7/14
10/1
/14
10/1
5/1
4
10/2
9/1
4
11/1
2/1
4
11/2
6/1
4
CIC
Share
Pri
ce a
nd P
SE
i
(as
% o
f 11
/27/
13 V
alu
es)
CIC PSEi

Ateneo de Manila University Student Research | 7
FIGURE 21. COPI NET PROFIT MARGINS
Source: Team Estimates
FIGURE 22. COPI FORECASTED SALES, IN PHP MN
Source: Team Estimates
FIGURE 23. CMIP REVENUE FORECAST,
IN PHP MN
Source: Team Estimates
TABLE 6. WACC COMPUTATIONS (2014)
INPUT VALUE METHODOLOGY
Beta 1.02 Peers’ Beta
Risk-free Rate
4.75% T-Bond rate (25 years)
Market Premium
5.56% Bloomberg
Cost of Equity
10.40% Team Computations
Cost of Debt
2.63% Prevailing cost of debt
Debt to Equity Ratio
10:90 Forecasted Capital Structure
WACC 9.54% (2014)
Team Computations
Source: Team Analysis
TABLE 7. TERMINAL GROWTH RATES
SUBSIDIARY TERMINAL GROWTH
RATE
CCAC 2.60%
CDI 2.13%
CMIP 3.25%
COPI 3.31% Source: Team Analysis
Growth and Expansion Business: COPI COPI has three revenue streams, namely new equipment and installation (NEI), services and maintenance (S&M), and repair and modernization (R&M). The 13.58% growth rate of COPI’s NEI is based on the country’s booming residential and non-residential building industry growth rate of 11.40% plus a premium of 2.18% (see Appendix D-9). This growth rate is backed by CIC’s extensive after-sales support and strong relationship with tier one real estate developers. We expect a 9% net profit margin from NEI sales, which is consistent with Otis’ historical performance. In forecasting S&M and R&M sales, a rainfall model is built to take into account the decreasing retention rate of customers who avail of after-sales services as their equipment ages, and the increasing probability for older machines to break down (see Appendix D-14). The net profit margins of S&M and R&M are expected to be at 20%-30% in 2014-2020 (see Figure 21). CIC expects COPI’s revenues to reach Php 342 mn (see Figure 22), which is equivalent to 3.8% of CIC’s forecasted total revenue in 2014.
Growth and Expansion Business: CMIP As a distributor of a relatively new brand in the country, CMIP is not expected to be profitable in its first two years of operations as current efforts are focused on building the Midea brand. It is expected to incur a loss in 2014, and break even in 2015. However, CIC’s wide-scale distribution network and strong brand reputation are expected to drive CMIP’s sales by a CAGR of 10.40% (see Appendix D-10) from 2014 to 2020, reaching Php 452 mn in sales (see Figure 23). The sales growth rate is calculated by adding a 2.18% premium to the country’s consumer appliance CAGR of 8.22%. We expect CMIP’s net profit margin to reach 2% in 2016, 3% in 2017, 4% in 2018, 6% in 2019 and stabilize at 7% thereafter. This net profit margin is highly comparable to similar firms such as Midea Group China, which has an EBITDA margin of around 8.65% (see Appendix D-20). CMIP’s net profit margin is expected to be lower since it does not manufacture its products locally. CMIP is estimated to generate Php 250 mn sales, which is equivalent to 2.76% of CIC’s forecasted total revenue for the year 2014.
CAPITAL EXPENDITURE CIC’s annual capital expenditure is composed of maintenance CAPEX and growth CAPEX. CIC’s maintenance capital expenditure is expected to be stable at around Php 55 mn every year under the assumption that CIC reinvests back its annual depreciation expense as maintenance CAPEX. For its growth CAPEX, the management does not see the need to increase the plant manufacturing capacity despite the expected increase in sales. It currently operates with two working shifts, and can be increased to three or four shifts should the need arise. However, the company incurs Php 20 mn in growth CAPEX every five years for its grill modernization project. This project aims to keep CIC’s air conditioner grill designs up to date.
WEIGHTED AVERAGE COST OF CAPITAL (WACC) Using pure-play method, we computed CIC’s beta by adjusting the average unlevered beta of its peers based on CIC’s capital structure and arrived at a value of 1.02 (see Appendix D-16). With a market premium of 5.56% and a risk-free rate of 4.75%, we obtained a 10.40% cost of equity (see Table 6). On the other hand, CIC’s cost of debt is subject to the fluctuations of the country’s interest rates as we expect its short-term debt to be rolled over to finance the company’s future acquisitions. CIC’s prevailing cost of debt is around 2.63% in 2014, which is expected to move to as high as 3.92% in 2018, and eventually dip down to 3.07% at the terminal phase. Accounting for interest rate fluctuations, we arrived at a moving WACC ranging from 9.54% to 9.63% for CCAC, based on the capital structure of 10% debt and 90% equity (see Table 6 and Appendix D-19). With a 100%-equity capital structure, a constant WACC of 10.40% is used for CDI, COPI, and CMIP.
TERMINAL GROWTH RATE The terminal growth rates for CCAC, CDI, and CMIP are based on the growth rates of mature air conditioning, refrigeration, and consumer appliance markets, respectively. The selection of such markets is based on their geographic location and penetration rates. The terminal growth rate for COPI is based on the sales growth rates of selected elevator companies that operate in mature markets. The terminal growth rate used for CCAC, CDI, COPI, and CMIP are 2.60%, 2.13%, 3.25%, and 3.31% respectively (see Table 7). A detailed discussion on the computation of these growth rates is presented in Appendix D-17.
RELATIVE VALUATION
TABLE 10. PEER COMPARABLE RATIOS
COMPANY P/E PRICE/ FCF EV/ EBITDA EV/ SALES PEG RATIO
CIC 20.90 4.53 9.72 1.72 0.65
Ree (VNM) 8.80 7.71 11.96 2.69 0.42
Singer (THA) 14.06 36.64 10.32 1.77 1.20
Daikin (JPN) 21.04 23.56 10.65 1.48 1.33
Mitsubishi (JPN) 16.25 8.64 6.93 0.71 2.60
Toshiba (JPN) 29.72 33.60 8.33 0.62 2.28
Hitachi (JPN) 13.67 120.79 7.70 0.83 1.22
Peer Median 15.16 28.58 9.33 1.16 1.27 Legend: Favorable Unfavorable Source: Bloomberg, Team Estimates
A relative valuation analysis is conducted among Asian peers of CIC (see Appendix D-15 for Peer Selection Criteria). CIC posted a relatively higher P/E (TTM) ratio of 20.90x compared to its peers trading at 15.16. However, this high P/E ratio is justified by its PEG (TTM) ratio of 0.65x, which is significantly lower than that of the industry, thus supporting our BUY recommendation.
0%
5%
10%
15%
20%
25%
30%
20
14E
20
15F
20
16F
20
17F
20
18F
20
19F
20
20
F
New Equipment and Installation
Service and Maintenance
Repair and Modernization
0%
5%
10%
15%
0
200
400
600
800
20
14E
20
15F
20
16F
20
17F
20
18F
20
19F
20
20
F
YoY
Gro
wth
Rate
CO
PI S
ale
s (i
n P
hp m
n)
Repair and Modernization Service and Maintenance New Equipment and Installation
-200
-100
0
100
200
300
400
500
600
20
14E
20
15F
20
16F
20
17F
20
18F
20
19F
20
20
F
Revenues Net Income (Loss)
in Php
mn

Ateneo de Manila University Student Research | 8
Financial Analysis
TABLE 11. CCAC AND CDI KEY RATIOS
KEY RATIOS CCAC CDI
Industry Median
2012 2013 2014E 2015F 2016F 2012 2013 2014E 2015F 2016F
Profitability Ratios
Gross Profit Margin (%) 29.65 39.22 38.01 39.40 38.35 39.36 17.39 19.47 19.38 18.18 19.29
EBITDA Margin (%) 10.08 20.20 22.53 22.64 21.63 22.61 4.24 5.47 8.01 7.85 7.72
Net Income Margin (%) 6.30 13.59 15.31 15.37 14.64 15.33 1.86 2.29 4.50 4.50 4.50
Liquidity Ratios
Quick Ratio 0.91 1.95 1.89 1.29 1.52 1.80 0.73 1.39 1.42 1.41 1.44
Current Ratio 1.78 2.42 2.45 1.60 1.85 2.14 1.08 2.15 2.11 2.10 2.13
Activity Ratios
Days of Sales Outstanding 79.33 87.46 81.39 79.31 85.62 85.82 114.66 122.89 113.38 114.02 114.25
Days of Inventory on Hand 74.00 73.24 68.89 69.03 66.06 67.27 57.76 76.96 73.39 70.76 71.88
Number of Days Payables 54.62 109.19 113.04 107.16 103.81 105.72 124.87 129.94 97.59 113.22 115.00
Cash Conversion Cycle 89.74 51.50 37.25 41.18 47.88 47.37 47.55 69.92 89.18 71.56 71.13
Cash Flow Ratios
Cash Flow-to-Revenue 0.11 0.14 0.14 0.04 0.03
Cash Return-on-Equity 0.28 0.30 0.28 0.11 0.10
Cash Flow per Share 1.90 2.66 3.05 0.30 0.31
Dividend Coverage Ratio 2.64 3.31 3.60 2.99 2.73
DuPont Analysis
Tax Burden 0.63 0.70 0.70 0.70 0.70 0.70 0.67 0.65 0.70 0.70 0.70
Interest Burden 1.06 1.00 1.00 0.98 0.98 0.98 0.98 0.88 1.00 1.00 1.00
EBIT Margin (%) 6.26 19.73 22.26 22.40 21.35 22.36 2.71 3.70 6.43 6.43 6.43
Asset Turnover 0.91 1.62 1.63 1.44 1.21 1.15 1.79 1.63 1.71 1.68 1.68
Leverage 2.39 1.59 1.66 1.80 1.82 1.69 6.52 2.80 1.79 1.82 1.82
Return on Equity (%) 13.24 35.78 42.28 39.72 32.36 29.78 20.83 9.69 13.76 13.71 13.72 Source: Team Estimates
FIGURE 25. CIC FORECASTED SALES, IN PHP BN
Source: Team Estimates
FIGURE 26. CCAC AND CDI EBITDA MARGIN VS. INDUSTRY MEDIAN
Source: Company Data, Team Estimates
FIGURE 27. CIC CASH RATIO VS. INDUSTRY MEDIAN
Source: Company Data, Team Estimates
SUSTAINABLE GROWTH OF CORE BUSINESS CIC posted revenues of Php 7.5 bn and net earnings of Php 866 mn in 2013. With the strong growth potential of the air conditioning and refrigeration markets in the country, we expect CIC to double its revenues to Php 16 bn by 2020 (see Figure 25), translating into net earnings of Php 2.1 bn. With rising GDP per capita and a booming real estate industry, we expect CCAC’s revenues to grow at a CAGR of 9.83% from 2014 to 2020 and CDI’s sales to rise at a CAGR of 10.21% from 2014 to 2020.
EXPANDING BUSINESS THROUGH M&A CIC’s recent ventures on COPI and CMIP are expected to contribute revenues of Php 1 bn or 6.43% of total sales, and net income of Php 138 mn or 6.57% of total net income in 2020. Furthermore, this expansion is expected to drive CIC’s profitability to a 19.71% EBTIDA margin with COPI’s high-margin after-sales services having a net income margin of 30% in 2020. These subsidiaries are also expected to contribute 6.50% of CIC’s CFO in 2020.
HIGH OPERATIONAL EFFICIENCY LEADS TO SUPERIOR MARGINS CIC has a strong commitment to operational efficiency with its adoption of UTC’s Achieving Competitive Excellence (ACE) System that ensures the efficiency and effectiveness of its manufacturing operations. This is evident in CIC’s increasing fixed asset turnover, reaching 83.13 in 2020, and its total asset turnover of 1.45 in 2014, which is 59% higher than the peer median of 0.91. It also employs operational strategies to protect its profits such as its outsourcing to “negosyo partners.” Moreover, CIC’s aggressive efforts in cost reduction are expected to contribute Php 120 mn in savings in 2015, driving EBITDA margins to 19.71%. With these, we expect CIC to achieve EBITDA margins of around 22% for CCAC and 10% for CDI starting 2017 (see Figure 26).
CASH-GENERATING ENGINE ENABLING FINANCIAL FLEXIBILITY CIC is highly liquid with a cash ratio of 0.62 in 2014, which is 51% higher than the peer median of 0.41. Its strong liquidity position is supported by its well-managed inventory and strong bargaining power against suppliers, as exhibited by its CCC of 50 days, which is 44% lower than the peer median. This strong liquidity position enables CIC to fulfill its 30% dividend policy with a dividend coverage ratio of around 3.7x starting 2014. Furthermore, with a CFO/CAPEX of 22x in 2016, CIC has the flexibility to internally finance its operations and capital expenditures. We expect this to be sustained with CIC’s reliable cash flows, as reflected in its high Cash Flow Ratio (CFO/Average Current Liabilities) of 0.37 in 2014, which is 95% higher than the peer median (see Figure 27). The reliability of CIC’s cash flows is further supported by the company’s high level of profitability. Its strong financial position highlights the company’s financial flexibility to expand its business through internally generated funds.
UNLEVERAGED POSITION ENABLES CIC TO FINANCE NEW VENTURES CIC is highly unleveraged with no long-term debt from 2011 to 2013. It currently has a short-term debt of Php 1 bn that is expected to roll over, pegging its debt-to-asset ratio to 11% in 2016, which is 56% lower than the peer median of 25%. With its minimal debt and superb credit rating, CIC has the ability to acquire new debt at a low marginal cost of capital to fund its future mergers and acquisitions.
0.0
5.0
10.0
15.0
20.0
20
14E
20
15F
20
16F
20
17F
20
18F
20
19F
20
20
F
CCAC CDI COPI CMIP
in Php
bn
0%
5%
10%
15%
20%
25%
2012 2013 2014E 2015F 2016F
CCAC CDI Industry Median
0%
10%
20%
30%
40%
50%
20
14E
20
15F
20
16F
20
17F
20
18F
20
19F
20
20
F
CIC Industry Median

Ateneo de Manila University Student Research | 9
FIGURE 28. RISK MATRIX
IMP
AC
T
High
h OR1
Mediu
m
OR2 IR1 MR3
OR4 MR1 IR2
OR3 MR2
Low
w
Low Medium High
PROBABILITY
Source: Team Analysis
TABLE 12. RISK ANALYSIS
RISKS MITIGATING FACTORS
Market Risk
Foreign Exchange Risk
Acquisition of future and forward contracts for price hedging
Short Term Locked-In Exchange Rate
Reinvestment Rate Risk
Good credit rating
Solid company financials
Commodity Price Risk
Price hedging of raw materials
60-days supplier contracts to lock-in prices
Industry Risk
Intense Rivalry in the Competition
Cost Reduction
Strong Track Record
Leading and Trusted Brands
Continuous Product Development
Increasing Electricity Costs
Energy Efficient Air Conditioning Units and Refrigerators
Operational Risk
Unplanned Breakdown of Plant and Equipment
Leading and Trusted Brands
Continuous Product Development
Heavy Dependence on Importation
Increasing Capacity of Production Plant
Multi Sourcing Strategy
Corporate Governance
Two Independent Board Members
Strong Talent Acquisition Programs
Execution Risk
Implementation of Industry Best Practices
Hiring of Abled and Experienced Professionals
Source: Team Analysis
Investment Risks The investment risks are summarized in Figure 28 and its mitigating factors are outlined in Table 12.
MARKET RISK | FOREIGN EXCHANGE RISK (MR1) A substantial portion of CIC’s raw materials is imported from suppliers abroad. Major sources include Taiwan and China for aluminum; Malaysia and China for copper; and Taiwan, China, Korea, and Italy for steel. Given this, fluctuations in the exchange rate between the Philippine Peso and foreign currencies may increase the company’s expenses and reduce profitability. This could adversely affect the company’s business, financial condition, and results of operations. To counter this impending risk, the company invests in future and forward contracts to hedge on foreign currency exchanges.
MARKET RISK | REINVESTMENT RATE RISK (MR2) Based on the financial statements of the company, CIC only has short-term loans. The management may opt to roll this over in the future, thus needing to renew their current rate. This exposes CIC to reinvestment rate risk as the current interest rate in the market is rising. However, due to CIC’s good credit standing, the management will be able to bargain for lower rate.
MARKET RISK | COMMODITY PRICES RISK (MR3) As a manufacturer, CIC requires certain raw materials such as copper, aluminum, and steel. The prices of these raw materials heavily fluctuate due to the global market conditions. Any increase in the raw material prices will significantly increase the company’s cost of goods sold, but CIC cannot readily increase its selling retail price and pass on these additional costs. This, in effect, would decrease the company’s margins. To mitigate this risk, CIC engages in price hedging activities and locks-in prices with its suppliers for certain raw materials.
INDUSTRY RISK | INTENSE RIVALRY IN THE COMPETITION (IR1) With the intense competition in the air conditioning and refrigeration industry at hand, CIC’s ability to maintain or increase its market share and profitability may be limited. To be able to thrive in an increasingly competitive market, CIC is implementing continuous cost reduction measures and numerous product developments in both its air condition and refrigeration manufacturing facilities.
INDUSTRY RISK | INCREASING ELECTRICITY COSTS DUE TO SHORTAGE (IR2) Air conditioners and refrigerators are few of the household appliances known to have high electricity consumption. The impending increase in electricity costs discourages consumers to buy air conditioners and refrigerators. To address this issue, CIC is continuously developing energy-efficient air conditioners and refrigerators such as the Carrier Optima that provides uncompromised cooling with low electricity consumption, and additional 40% cost savings with the company’s patented Energy Savings Plug.
OPERATIONAL RISK | UNPLANNED BREAKDOWN OF PLANT AND EQUIPMENT (OR1) CIC currently produces all of its residential air conditioners and refrigerators at a single factory location in Light Industry and Science Park in Cabuyao, Laguna, Philippines. Due to lack of geographical diversification, CIC’s manufacturing operations is exposed to greater risks of interruptions from plant or equipment breakdown. Any unexpected circumstance such as power shortage, natural disasters, or equipment breakdown that may cause CIC’s entire manufacturing operations to stop can drastically affect CIC’s supply of air conditioners and refrigerators. To prevent any downtime caused by equipment breakdown, CIC invests approximately Php 50 mn to Php 60 mn annually to rehabilitate and maintain the company’s manufacturing facility.
OPERATIONAL RISK | HEAVY DEPENDENCE ON IMPORTS (OR2) CIC imports roughly 70% of the raw materials and component parts used in the production of air conditioners and refrigerators. Moreover, CIC imports all of its commercial air conditioning and refrigeration units. Given this, the price, availability, and timely delivery of the various raw materials and component parts largely affect CIC’s operations. To mitigate such risk, the company uses multiple sourcing strategies, with supply forecasts set every three to six months and pricing terms set annually, depending on the supplier.
OPERATIONAL RISK | CORPORATE GOVERNANCE RISK (OR3) CIC started as a family business of the Concepcions. As the company starts to venture out and be a public entity, issues may arise such as building credibility and ensuring transparency and accountability. To be able to address this problem, CIC is taking necessary actions to ensure the presence of strong and independent elements in the board such as hiring two independent auditors and acquiring talents both locally and from abroad.
OPERATIONAL RISK | EXECUTION RISK (OR4) CIC’s recent joint venture and acquisition, COPI and CMIP, are still in the transition and gestation period with the new management. With this, there are still uncertainties whether CIC’s new management can turn around the business and induce growth into the new JVs. To ensure the success of these new business ventures, CIC implements industry best practices and hires professionals with more than 20 years of industry experience to manage the business.
Sensitivity and Scenario Analysis To determine the effect of certain investment risks on the intrinsic value of CIC, a sensitivity and scenario analysis is conducted. The first part of the conducted sensitivity analysis determines the minimum changes in certain variables that may shift our recommendation (see Table 15 and Table 16). After conducting such, we evaluate the impact of possible changes in the weighted cost of capital, industry sales growth, and commodity price growth rate to the target price (see Table 14, Table 17, and Table 18).

Ateneo de Manila University Student Research | 10
1 9.54% for CACC 2014
TABLE 13. RATING GUIDE
RATING GUIDE
BUY HOLD SELL
Greater Than 10% upside
0 to 10% Upside
Negative Returns
> Php 45.1/sh Php 41 – 45.1/sh < Php
41/share Source: Team Analysis
TABLE 14. WACC SENSITIVITY ANALYSIS
WEIGHTED COST OF CAPITAL
PRICE/SHARE
14.00% 30.62
13.00% 33.92
12.00% 37.94
11.56% 40.00
11.00% 42.92
10.81% 44.01
10.00% 49.26
9.54% 50.49
9.00% 57.59
8.00% 69.01
7.00% 85.60 Source: Team Analysis
FIGURE 29. WACC SENSITIVITY ANALYSIS
Source: Team Analysis
TABLE 15. VALUATION WITHOUT CMIP AND COPI
CCAC 35.74
CDI 11.42
CIC 47.15
(15% Upside) Source: Team Analysis
TABLE 16. SENSITIVITY ANALYSIS ON ASSUMPTIONS
CHANGES IN VARIABLES TO SHIFT RECOMMENDATION TO HOLD/SELL
Variable Base Case Hold Change in
Percentage Points
Sell Change in
Percentage Points
Industry Growth Rate for CCAC 8.88% 6.03% (2.85%) 4.01% (4.87%)
Industry Growth Rate for CDI 9.50% 1.60% (7.90%) (6.80%) (16.30%)
Weighted Cost of Capital 9.54%1 10.81% 1.27% 11.56% 2.02%
CCAC Terminal Growth Rate 2.60% 0.44% (2.16%) (1.70%) (4.30%)
CDI Terminal Growth Rate 2.13% (17.80%) (19.93%) (100%) (102.13%) Source: Team Analysis
TABLE 17. SCENARIO ANALYSIS: CCAC AND CDI SALES GROWTHS
INDUSTRY SALES GROWTH FOR CCAC
IN
DU
STR
Y S
ALE
S
GR
OW
TH
FO
R C
DI
10.0% 9.0% 8.88% 8.0% 7.0% 5.0% 3.0% 1.0%
11.0% 54.99 52.43 52.13 50.01 47.73 43.53 39.80 36.48
10.0% 53.88 51.32 51.02 48.91 46.62 42.43 38.69 35.37
9.5% 53.35 50.79 50.49 48.38 46.09 41.90 38.16 34.84
9.0% 52.84 50.28 49.98 47.86 45.58 41.38 37.65 34.32
5.0% 49.26 46.7 46.40 44.28 42.00 37.81 34.07 30.75
3.0% 47.79 45.23 44.92 42.81 40.53 36.33 32.60 29.27
1.0% 46.49 43.94 43.63 41.52 39.24 35.04 31.30 27.98 Source: Team Analysis
We also conducted a sensitivity analysis on the fluctuations of the commodity prices of steel, aluminum, and copper. Historically, these commodity prices fluctuate within ±200 basis points. Table 18 shows the impact of commodity price growth changes on CIC’s target price. A 100 basis point increase in commodity price growth rate translates to a 100 basis point decrease in CIC’s share price. Thus, a ±200 basis point change in the commodity price growth will not change our BUY recommendation.
TABLE 18. SCENARIO ANALYSIS: COMMODITY PRICE GROWTH RATE
CHANGE IN COMMODITY PRICES GROWTH RATE
COGS MARGIN CIC SHARE PRICE CCAC CDI
(200 basis points) 59.99% 80.01% 51.89
(100 basis points) 60.41% 80.46% 51.19
Base Case 60.83% 80.92% 50.49
+100 basis points 61.25% 81.38% 49.79
+200 basis points 61.67% 81.83% 49.09
Source: Team Analysis One of the variables that will significantly affect our valuation is the WACC. The current moving WACC used to discount CIC’s free cash flows ranges from 9.54% to 9.63% depending on the Philippine interest rates for the corresponding years. Based on the sensitivity analysis conducted, WACC should increase by 127 basis points reaching 10.81% before our recommendation changes to hold. Moreover, WACC should reach as high as 11.56% for our recommendation to change from buy to sell (see Table 14 and Figure 29). As mentioned above, CIC is exposed to execution risk with the company’s recent JVs, COPI and CMIP. CIC expects to turn around its recent joint ventures in the years 2014 to 2015. Despite the company’s efforts to integrate COPI and CMIP into its core business, there are still uncertainties regarding how these recent joint ventures will fare in the succeeding years. Our base case valuation indicates that both COPI and CMIP contribute roughly Php 3.34 per share. Without both, the target price of CIC will fall to Php 47.15 per share, representing 15% upside from the Php 41 per share closing price last November 28, 2014 (see Table 15).
0
20
40
60
80
100
7.00% 12.00% 17.00%
CIC
Share
Pri
ce (
Php)
WACC
Buy Sell Hold

Ateneo de Manila University Student Research | 11
Table of Contents APPENDIX A: COMPANY OVERVIEW ............................................................................................................................................ 12
Appendix A-1. Glossary of Terms ................................................................................................................................................................................... 12 Appendix A-2. CIC Subsidiaries ...................................................................................................................................................................................... 14 Appendix A-3. Overall Distribution ................................................................................................................................................................................. 15 Appendix A-4. Business Model Canvas .......................................................................................................................................................................... 15
APPENDIX B: FINANCIAL STATEMENTS ..................................................................................................................................... 16 Appendix B-1. Consolidated Balance Sheet ................................................................................................................................................................... 16 Appendix B-2. Consolidated Income Statement ............................................................................................................................................................ 16 Appendix B-3. Consolidated Cash Flow Statement ........................................................................................................................................................ 17 Appendix B-4. Consolidated Statement of Retained Earnings ....................................................................................................................................... 17 Appendix B-5. CCAC Balance Sheet .............................................................................................................................................................................. 18 Appendix B-6. CCAC Income Statement ........................................................................................................................................................................ 19 Appendix B-7. CCAC Cash Flow Statement ................................................................................................................................................................... 19 Appendix B-8. CCAC Statement of Retained Earnings ................................................................................................................................................. 19 Appendix B-9. CDI Balance Sheet .................................................................................................................................................................................. 20 Appendix B-10. CDI Income Statement .......................................................................................................................................................................... 20 Appendix B-11. CDI Cash Flow Statement ..................................................................................................................................................................... 21 Appendix B-12. CDI Statement of Retained Earnings ................................................................................................................................................... 21 Appendix B-13. COPI Balance Sheet .............................................................................................................................................................................. 22 Appendix B-14. COPI Income Statement ........................................................................................................................................................................ 22 Appendix B-15. COPI Statement of Cash Flows ............................................................................................................................................................ 22 Appendix B-16. COPI Statement of Retained Earnings ................................................................................................................................................. 23 Appendix B-17. CMIP Income Statement ....................................................................................................................................................................... 23
APPENDIX C: INDUSTRY OVERVIEW AND COMPETITIVE POSITIONING .................................................................................. 24 Appendix C-1. Porter’s Five Forces Analysis ................................................................................................................................................................ 24 Appendix C-2. SWOT Analysis ....................................................................................................................................................................................... 26 Appendix C-3. Cost Reduction Methods ......................................................................................................................................................................... 27 Appendix C-4. Possible Mergers and Acquisitions ........................................................................................................................................................ 27
APPENDIX D: VALUATION ............................................................................................................................................................. 30 Appendix D-1. Summary of Sum of Parts and DCF Methods ....................................................................................................................................... 30 Appendix D-2. CCAC Free Cash Flow and Valuation .................................................................................................................................................... 31 Appendix D-3. CDI Free Cash Flow and Valuation ........................................................................................................................................................ 31 Appendix D-4. COPI Free Cash Flow and Valuation ..................................................................................................................................................... 31 Appendix D-5. CMIP Free Cash Flow and Valuation ..................................................................................................................................................... 31 Appendix D-6. Key Drivers for Growth .......................................................................................................................................................................... 32 Appendix D-7. CCAC Growth Rate ................................................................................................................................................................................. 33 Appendix D-8. CDI Growth Rate ..................................................................................................................................................................................... 34 Appendix D-9. COPI Growth Rate .................................................................................................................................................................................. 34 Appendix D-10. CMIP Growth Rate ................................................................................................................................................................................ 34 Appendix D-11. Summary of Growth Rates ................................................................................................................................................................... 35 Appendix D-12. Regression Backing .............................................................................................................................................................................. 36 Appendix D-13. Premium ................................................................................................................................................................................................ 40 Appendix D-14. COPI Sales Forecast ............................................................................................................................................................................. 41 Appendix D-15. Criteria for Peers Selection .................................................................................................................................................................. 42 Appendix D-16. Beta Calculation ..................................................................................................................................................................................... 42 Appendix D-17. Terminal Growth Rate Calculation ....................................................................................................................................................... 43 Appendix D-18. Commodity Price Adjustment ............................................................................................................................................................... 44 Appendix D-19. Moving WACC ........................................................................................................................................................................................ 45 Appendix D-20. Peer Group of CMIP ............................................................................................................................................................................. 45
APPENDIX E: FINANCIAL ANALYSIS ............................................................................................................................................ 46 Appendix E-1. CIC Key Ratios ........................................................................................................................................................................................ 46 Appendix E-2. CCAC Key Ratios ..................................................................................................................................................................................... 47 Appendix E-3. CDI Key Ratios ......................................................................................................................................................................................... 48 Appendix E-4. COPI Key Ratios ...................................................................................................................................................................................... 49 Appendix E-5. Key Ratios of Peers ................................................................................................................................................................................ 49
APPENDIX F: CORPORATE GOVERNANCE .................................................................................................................................. 50 Appendix F-1. Summary of Corporate Governance and Social Responsibility ............................................................................................................ 50 Appendix F-2. Board of Directors .................................................................................................................................................................................. 51 Appendix F-3. Senior Management ................................................................................................................................................................................ 52

Ateneo de Manila University Student Research | 12
Appendix A: Company Overview APPENDIX A-1. GLOSSARY OF TERMS
CIC: CONCEPCION INDUSTRIAL CORPORATION
Concepcion Industrial Corporation (CIC), formerly Concepcion Air Conditioning Corporation (CAC), is the holding company of one of the Philippines’ most established supplier and manufacturer of air conditioning and refrigeration appliances. It recently expanded into other consumer appliances and people-moving equipment, such as elevators, escalators, and moving walkways. CIC operates mainly through two of its subsidiaries, Concepcion Air Conditioning Company (CCAC), and Concepcion Durables Inc. (CDI). Its recently established subsidiaries include Concepcion Otis Philippines Inc. (COPI) and Concepcion Midea Inc. Philippines (CMIP). COPI is a joint venture agreement with UTC-Asia Pte. Ltd., a subsidiary of United Technologies Corp. CMIP, on the other hand, is a joint venture agreement with Midea Inc.
CCAC: CONCEPCION-CARRIER AIR CONDITIONING COMPANY
Concepcion-Carrier Air Conditioning (CCAC) is a subsidiary of CIC that manufactures, sells, distributes, installs, and provides comprehensive air conditioning and commercial refrigeration products and services. CCAC is a joint venture between CIC and Carrier Corporation, thus allowing the company to include Carrier and Toshiba air conditioners as well as Totaline parts in its product portfolio. Other brands of CCAC include Condura, Kelvinator. CCAC manufactures most of its air conditioning equipment in the largest air conditioning manufacturing facility in the country, which is located in Light Industry and Science Park in Cabuyao, Laguna, Philippines. The plant has a capacity of 500,000 units per year.
CDI: CONCEPCION DURABLES INC.
Concepcion Durables Inc. (CDI) is a subsidiary of CIC that manufactures, assembles, wholesales, and retails residential refrigeration appliances through its market-leading brands, Kelvinator and Condura. CDI manufactures residential refrigerators in its factory, adjacent to CCAC’s air conditioning facility in Light Industry and Science Park in Cabuyao, Laguna, Philippines. CDI’s factory has a capacity of 300,000 units per year.
CMIP: CONCEPCION MIDEA INC. PHILIPPINES
Concepcion Midea Inc. Philippines (CMIP) is a recent joint venture between CIC and Midea Group wherein CIC will distribute Midea’s consumer appliance products such as oven toasters, electric fans, washing machines, and refrigerators among others. Midea was established in 1968 and is a prominent consumer appliance manufacturer, and has operations in countries such as China, Vietnam, Egypt, Brazil, Argentina, and India. CIC effectively owns 40% of CMIP.
COPI: CONCEPCION OTIS PHILIPPINES INC.
Concepcion Otis Philippines Inc. (COPI), formerly Otis Elevator Company, is a recent joint venture agreement between CIC and UTC-Asia Pte. Ltd., a subsidiary of United Technologies Corp. It sells and services elevators, escalators, and moving walkways. Established in 1935, it is the first elevator company in the country. CCAC has an 85% stake in COPI effectively making CIC own 51% of the company. UTC: UNITED TECHNOLOGIES CORPORATION
United Technologies Corporation (UTC) is a conglomerate that provides high technology products and services to its customers in the commercial, aerospace, defense, and building industries worldwide. The company operates in the following six products and brands: (1) Otis, (2) Carrier, (3) UTC Fire & Security, (4) Pratt & Whitney, (5) Hamilton Sundstrand, and (6) Sikorsky. The first three brands cater to its commercial business segment, while the latter three brands cater to its aerospace segment. BIS: BUILDING AND INDUSTRIAL SOLUTIONS
The Building and Industrial Solutions (BIS) segment of CIC refers to the design, sales, and after-sales of commercial air conditioners, refrigerators, and people-moving equipment.
RLC: RESIDENTIAL AND LIGHT COMMERCIAL
Residential and Light Commercial (RLC) is CIC’s business segment that refers to products and services that are sold for domestic or small business applications through retailers and dealers. The residential and light commercial market for air conditioning refers to individual buyers purchasing for their homes or condominiums along with real estate developers. For air conditioning, these include window room, split-type, and multi-split air conditioners. For refrigeration, these include direct cool refrigerators, freezers, and no-frost refrigerators.
NEI: NEW EQUIPMENT AND INSTALLATION
COPI’s New Equipment and Installation (NEI) refers to the revenue stream from the sale and installation of new people-moving equipment. S&M: SERVICES AND MAINTENANCE
COPI’s Services and Maintenance (S&M) refers to the revenue stream from service and maintenance of Otis people-moving equipment.
R&M: REPAIR AND MODERNIZATION
COPI’s Repair and Modernization (R&M) refers to the revenue stream from the repair and modernization of Otis people-moving equipment.
CAPEX: CAPITAL EXPENDITURE
Capital Expenditure (CAPEX) refers to funds used to acquire or upgrade fixed assets for the business. This outlay can be classified as either growth or maintenance CAPEX. Growth CAPEX is used to increase the scope of the company’s operations, while maintenance CAPEX is used to sustain the current scope of the company’s operations.
OPEX: OPERATING EXPENSES
Operating Expenses (OPEX) are expenses that are incurred during the normal operations of the company. Examples of which are employee cost, outside services, rent & utilities, advertising & promotions, warranty cost, and the like. M&A: MERGERS AND ACQUISITIONS
Mergers and Acquisitions (M&A) refer to a consolidation of companies either through a merger where two companies form one company or an acquisition where one company purchases another.
JV: JOINT VENTURE
Joint Venture (JV) is a business arrangement wherein two or more parties pool resources to create a new project or company.

Ateneo de Manila University Student Research | 13
R&D: RESEARCH AND DEVELOPMENT
Research and Development (R&D) is defined as a general term for activities related to the enterprise of corporate innovation. R&D efforts are usually enforced either to reduce the costs of a company through efficiency or innovate new technology to revolutionize the field. CAGR: COMPOUND ANNUAL GROWTH RATE
Compound Annual Growth Rate (CAGR) is defined as the constant year-over-year growth rate of a variable. This is computed by the formula:
𝐶𝐴𝐺𝑅 =𝐸𝑛𝑑𝑖𝑛𝑔 𝑉𝑎𝑙𝑢𝑒
𝐵𝑒𝑔𝑖𝑛𝑛𝑖𝑛𝑔 𝑉𝑎𝑙𝑢𝑒
!# !" !"#$%
− 1.
DCF: DISCOUNTED FREE CASH FLOW TO FIRM METHOD
Discounted Free Cash Flow to Firm Method (DCF) is a valuation method used to estimate the attractiveness of an investment opportunity. Discounted cash flow analysis uses future free cash flow projections and discounts them to arrive at a present value, which is used to evaluate the potential for investment. This is estimated using the following formula:
𝐹𝐶𝐹𝐹 =𝐹𝐶𝐹𝐹!1 + 𝑟 ! +
𝐹𝐶𝐹𝐹!1 + 𝑟 ! +⋯+
𝐹𝐶𝐹𝐹!1 + 𝑟 !.
EV: ENTERPRISE VALUE
Enterprise Value (EV) is a measure of the company’s value computed as the market capitalization plus debt, minority interest, and preferred shares, minus total cash and cash equivalents.
EBITDA: EARNINGS BEFORE INTEREST, TAX, DEPRECIATION AND AMORTIZATION
Earnings Before Interest, Tax, Depreciation, and Amortization (EBITDA) is also called operational income. It tells us how much the company is making from its normal course of business. It is computed as Revenue minus the sum of Cost of Goods Sold and Operating Expenses.
ROE: RETURN ON EQUITY
Return on Equity (ROE) is the amount of net income return as a percentage of shareholder’s equity. This measures profitability of a company and is calculated by dividing Net Income by Shareholder’s Equity.
𝑅𝑂𝐸 = 𝑁𝑒𝑡 𝐼𝑛𝑐𝑜𝑚𝑒
𝑆ℎ𝑎𝑟𝑒ℎ𝑜𝑙𝑑𝑒𝑟!𝑠 𝐸𝑞𝑢𝑖𝑡𝑦
CFO: CASH FLOW FROM OPERATIONS
Cash Flow from Operations (CFO) or Operating Cash Flow is the amount of cash generated from the normal operations of the business.
P/E RATIO: PRICE-TO-EARNINGS RATIO
Price-to-Earnings (P/E) Ratio is the Price per Share divided by the Earnings Per Share (EPS).
𝑃/𝐸 =𝑃𝑟𝑖𝑐𝑒 𝑝𝑒𝑟 𝑠ℎ𝑎𝑟𝑒
𝐸𝑎𝑟𝑛𝑖𝑛𝑔𝑠 𝑝𝑒𝑟 𝑠ℎ𝑎𝑟𝑒
PEG RATIO: PRICE-TO-EARNINGS TO GROWTH RATIO
Price-to-Earnings Growth (PEG) Ratio is a valuation measure that indicates the trade-off among the price of a stock, the earnings generated per share (EPS), and the company's expected growth.
𝑃𝐸𝐺 = 𝑃/𝐸 𝑅𝑎𝑡𝑖𝑜𝐸𝑃𝑆 𝐺𝑟𝑜𝑤𝑡ℎ
× 100%

Ateneo de Manila University Student Research | 14
Source: CIC Investor Briefing Manual
APPENDIX A-2. CIC SUBSIDIARIES
CORE BUSINESS
Growth & Expansion
Leading Air Conditioning Company in the
Philippines
60%
CORE BUSINESS Growth & Profitability
Leading Consumer Refrigeration Company in
the Philippines
100%
GROWTH PLATFORMS Expansion
Expanding Brand Offering in Consumer Appliances
Sector
40%
Expanding Brand Offering in People-Moving
Products
51%

Ateneo de Manila University Student Research | 15
APPENDIX A-3. OVERALL DISTRIBUTION
LEGAL ENTITY CONSUMER SOLUTIONS BUILDING & INDUSTRIAL SOLUTIONS
Distribution
Retailers & Dealers Direct & Contractors
Source: CIC Investor Briefing Manual
APPENDIX A-4. BUSINESS MODEL CANVAS
BUSINESS MODEL CANVAS
KEY PARTNERS
KEY ACTIVITIES VALUE
PROPOSITIONS CUSTOMER RELATIONSHIPS
CUSTOMER SEGMENTS
• Local and foreign suppliers of raw Materials
• Negosyo partners for production
• Company distributors
• Manufactures and distributes residential air conditioning units and refrigerators from Cabuyao, Laguna Plant
• Imports and distributes commercial air conditioning units, refrigerators, white goods appliance, and people-moving products
• Provides after-sales service
• High quality air conditioners, refrigerators, white goods, and people-moving products
• 70 air conditioning service centers for customer support
• 69 refrigerator service centers for customer support
• 8 Totaline dedicated parts stores
• 170 installer companies
• Consumer solutions
• Business and industrial solutions
KEY RESOURCES CHANNELS
• 1.5 ha Cabuyao, Laguna manufacturing plant
• Strong R&D facility
• Strong track record of management
• Present in approximately 90% of all appliance outlets in the country
• Institutional clients such as Tier one real estate companies
COST STRUCTURE REVENUE STREAMS
• Imported and Locally-Sourced Raw Materials
• Operating Expenses of Cabuyao, Plant
• Employee Costs
• Retail and institutional sales of air conditioners and refrigerators
• After-sales service
• Sales of white goods appliance from Concepcion-Midea
• Sales of people-moving products from Concepcion-Otis
Source: Team Analysis, Company Data
Residential & Light Commercial Air Conditioning
Commercial Air conditioning & Refrigeration
Residential
Refrigeration
Laundry, Kitchen Refrigeration & Air Conditioning
Elevators & Escalators

Ateneo de Manila University Student Research | 16
Appendix B: Financial Statements
APPENDIX B-1. CONSOLIDATED BALANCE SHEET
(IN MILLIONS PHP) 2011 2012 2013 2014E 2015F 2016F 2017F 2018F 2019F 2020F
ASSETS
Current Assets
Cash and Cash Equivalents 849 1,230 1,529 1,922 2,584 3,368 4,289 5,295 6,422 7,712
Trade and Other Receivables, Net 1,625 2,043 2,007 2,405 2,666 2,941 3,234 3,547 3,884 4,243
Inventories, Net 790 943 1,105 1,135 1,278 1,390 1,534 1,676 1,835 2,013
Prepayments and Other Current Assets 57 56 85 94 104 115 126 138 151 165
Total Current Assets 3,321 4,272 4,725 5,555 6,633 7,814 9,183 10,656 12,293 14,133
Non-Current Assets
Property and Equipment, Net 165 174 179 179 195 191 187 183 179 195
Goodwill and Investment in Associates - - - 1,071 1,071 1,071 1,071 1,071 1,071 1,071
Deferred Income Tax Assets, Net 166 199 237 237 237 237 237 237 237 237
Retirement Benefit Asset 9 - - - - - - - - -
Deposits and Other Non-Current Asset 5 5 13 13 13 13 13 13 13 13
Total Non-Current Assets 345 379 428 1,499 1,515 1,511 1,507 1,503 1,499 1,515
Total Assets 3,666 4,651 5,154 7,054 8,148 9,325 10,690 12,159 13,792 15,648
LIABILITIES
Current Liabilities
Trade Payables and Other Liabilities 1,089 1,897 1,650 1,903 2,143 2,329 2,569 2,806 3,072 3,367
Provision for Warranty 16 30 38 42 47 52 57 62 68 74
Short Term Debt - 282 170 1,000 1,000 1,000 1,000 1,000 1,000 1,000
Other Provisions 138 132 88 109 114 118 123 128 134 140
Income Tax Payable 33 81 67 67 67 67 67 67 67 67
Total Current Liabilities 1,277 2,422 2,014 3,122 3,370 3,566 3,816 4,064 4,341 4,648
Non-Current Liabilities
Retirement Benefit Obligation 11 18 62 62 62 62 62 62 62 62
Provision for Warranty 23 47 45 59 66 72 79 87 95 104
Deposit for Future Share Subscription 516 - - - - - - - - -
Total Non-Current Liabilities 549 65 107 122 128 135 142 149 158 166
Total Liabilities 1,826 2,488 2,121 3,244 3,498 3,701 3,957 4,213 4,499 4,814
EQUITY
Share Capital 1,068 1,068 1,731 1,731 1,731 1,731 1,731 1,731 1,731 1,731
Share Premium - - 141 141 141 141 141 141 141 141
Retained Earnings 773 1,111 1,189 1,967 2,806 3,780 4,888 6,102 7,449 8,990
Other Comprehensive Loss (1) (17) (27) (27) (27) (27) (27) (27) (27) (27)
Total Equity 1,840 2,163 3,032 3,811 4,650 5,624 6,732 7,946 9,293 10,834
Total Liabilities and Equity 3,666 4,651 5,154 7,054 8,148 9,325 10,690 12,159 13,792 15,648
APPENDIX B-2. CONSOLIDATED INCOME STATEMENT
(IN MILLIONS PHP) 2011 2012 2013 2014E 2015F 2016F 2017F 2018F 2019F 2020F
Net Sales and Services 5,606 6,940 7,588 8,822 9,781 10,787 11,859 13,005 14,236 15,552
Cost of Sales and Services (3,738) (4,719) (5,128) (5,857) (6,598) (7,170) (7,913) (8,646) (9,466) (10,378)
Gross Profit 1,868 2,221 2,460 2,965 3,183 3,617 3,946 4,359 4,771 5,174
Operating Expenses (994) (1,297) (1,227) (1,394) (1,511) (1,702) (1,767) (1,951) (2,113) (2,168)
Other Operating Income, Net 54 55 31 - - - - - - -
EBIT 928 979 1,264 1,571 1,672 1,915 2,178 2,408 2,657 3,006
Interest Expense (0) (1) (10) (26) (28) (34) (36) (39) (33) (31)
EBT 928 977 1,254 1,545 1,644 1,881 2,142 2,369 2,624 2,975
Provision for Income Tax (278) (289) (377) (464) (493) (564) (643) (711) (787) (892)
Net Income 651 688 877 1,082 1,151 1,317 1,500 1,658 1,837 2,082
Other Comprehensive Income 3 (15) (11) - - - - - - -
Share in Net Income (Loss) in Associate
2
- - - (43) - 2 4 7 9 13
Total Comprehensive Income 653 673 867 1,038 1,151 1,319 1,504 1,665 1,847 2,095
2 CIC’s share in CMIP’s loss using 40% effective ownership

Ateneo de Manila University Student Research | 17
APPENDIX B-3. CONSOLIDATED CASH FLOW STATEMENT
(IN MILLIONS PHP) 2014E 2015F 2016F 2017F 2018F 2019F 2020F
Operating Cash Flows
EBIT 1,571 1,672 1,915 2,178 2,408 2,657 3,006
Add: Depreciation 55 59 59 59 59 59 59
Add: Net Income (Loss) in Associate3 (43) - 2 4 7 9 13
Operating Cash Flow before Changes in Working Capital 1,583 1,731 1,976 2,242 2,474 2,726 3,077
Decrease (Increase) in Accounts Receivable (398) (262) (275) (293) (313) (337) (360)
Decrease (Increase) in Inventory (29) (144) (111) (144) (142) (159) (177)
Decrease (Increase) in Prepayments (9) (10) (11) (11) (12) (13) (14)
Increase (Decrease) in Accounts Payable 253 239 186 240 237 266 295
Increase (Decrease) in Provision of Warranty 4 5 5 5 5 6 6
Increase (Decrease) in Other Provisions 21 5 5 5 5 6 6
Increase (Decrease) in Income Tax Payable - - - - - - -
Changes in Working Capital (158) (168) (201) (199) (220) (231) (244)
Payment of Taxes (464) (493) (564) (643) (711) (787) (892)
Net Cash from Operating Activities 961 1,070 1,211 1,400 1,544 1,707 1,941
Investing Cash Flows
Investments (1,071) - - - - - -
Capital Expenditure (55) (75) (55) (55) (55) (55) (75)
Provision for LT Warranty 14 6 7 7 8 8 9
Net Cash from Investing Activities (1,112) (69) (48) (48) (47) (47) (66)
Financing Cash Flows
Net Loan 830 - - - - - -
Dividend Payments (260) (311) (345) (396) (451) (499) (554)
Interest Expense (26) (28) (34) (36) (39) (33) (31)
Net Cash for Financing Activities 544 (340) (379) (432) (490) (532) (585)
Net Cash 393 662 784 921 1,006 1,128 1,290
Beginning, Cash 1,529 1,922 2,584 3,368 4,289 5,294 6,422
Ending, Cash 1,922 2,584 3,368 4,289 5,294 6,422 7,712
APPENDIX B-4. CONSOLIDATED STATEMENT OF RETAINED EARNINGS
(IN MILLIONS PHP) 2014E 2015F 2016F 2017F 2018F 2019F 2020F
Beginning, Retained Earnings 1,189 1,967 2,806 3,780 4,888 6,102 7,449
Add: Net Income 1,038 1,151 1,319 1,504 1,665 1,847 2,095
Less: Dividend Payments (260) (311) (345) (396) (451) (499) (554)
Ending, Retained Earnings 1,967 2,806 3,780 4,888 6,102 7,449 8,990
3 CIC’s share in CMIP’s loss using 40% effective ownership

Ateneo de Manila University Student Research | 18
APPENDIX B-5. CCAC BALANCE SHEET
4 Based on 90 days sales outstanding
5 Based on 70 days inventory
6 Percentage of sales: 0.10% of annual sales
7 Annual depreciation expense is equal to annual maintenance CAPEX
8 Php 20 mn growth capital expenditure for new grill design
9 Php 20 mn growth capital expenditure for new grill design
10 Otis goodwill
11 Constant, assuming tax paid is equal to tax expense
12 Constant
13 Constant
14 Based on 110 days payables
15 Percentage of sales: 0.70% of annual sales
16 Php 1 bn outstanding loan at 2.675% interest rate
17 Constant
18 Constant, assuming tax paid is equal to tax expense
19 Constant
20 Percentage of sales: 1% of annual sales
21 Constant
22 Constant
(IN MILLIONS PHP) 2011 2012 2013 2014E 2015F 2016F 2017F 2018F 2019F 2020F
ASSETS
Current Assets
Cash and Cash Equivalents 745 1,162 1,153 1,456 2,030 2,736 3,497 4,349 5,287 6,280
Trade and Other Receivables, Net4 975 1,251 1,113 1,459 1,617 1,782 1,958 2,146 2,347 2,561
Inventories, Net5 562 571 669 688 775 841 927 1,012 1,106 1,212
Prepayments and Other Current Assets6 4 4 6 6 7 7 8 9 10 10
Total Current Assets 2,286 2,988 2,940 3,609 4,428 5,366 6,391 7,515 8,749 10,063
Non-Current Assets
Property and Equipment, Net7 63 46 69 69 85
8 81 77 73 69 85
9
Goodwill and Investment in Associates - - - 1,07110
1,071 1,071 1,071 1,071 1,071 1,071
Deferred Income Tax Assets, Net11 154 194 228 228 228 228 228 228 228 228
Retirement Benefit Asset12
9 - - - - - - - - -
Deposits and Other Non-Current Assets13
5 5 13 13 13 13 13 13 13 13
Total Non-Current Assets 231 245 310 1,381 1,397 1,393 1,389 1,385 1,381 1,397
Total Assets 2,516 3,233 3,250 4,990 5,825 6,759 7,780 8,900 10,130 11,460
LIABILITIES
Current Liabilities
Trade Payables and Other Liabilities14
680 1,010 1,025 1,081 1,218 1,321 1,457 1,590 1,738 1,904
Provision for Warranty15
16 30 38 41 46 51 56 61 67 73
Short Term Debt - - - 1,00016
1,000 1,000 1,000 1,000 1,000 1,000
Other Provisions17 102 116 68 68 68 68 68 68 68 68
Income Tax Payable18
33 81 67 67 67 67 67 67 67 67
Total Current Liabilities 830 1,236 1,199 2,258 2,400 2,507 2,648 2,786 2,941 3,113
Non-Current Liabilities
Retirement Benefit Obligation19
- 18 50 50 50 50 50 50 50 50
Provision for Warranty20
23 33 45 59 66 72 79 87 95 104
Total Non-Current Liabilities 23 51 95 109 115 122 129 137 145 154
Total Liabilities 852 1,288 1,294 2,367 2,515 2,629 2,778 2,923 3,086 3,266
EQUITY
Share Capital21
943 943 943 943 943 943 943 943 943 943
Retained Earnings 719 1,015 1,040 1,706 2,393 3,213 4,085 5,060 6,127 7,277
Other Comprehensive Loss22
1 (13) (27) (27) (27) (27) (27) (27) (27) (27)
Total Equity 1,664 1,945 1,957 2,623 3,310 4,130 5,002 5,977 7,044 8,194
Total Liabilities and Equity 2,516 3,233 3,250 4,990 5,825 6,759 7,780 8,900 10,130 11,460

Ateneo de Manila University Student Research | 19
APPENDIX B-6. CCAC INCOME STATEMENT
(IN MILLIONS PHP) 2011 2012 2013 2014E 2015F 2016F 2017F 2018F 2019F 2020F
Net Sales and Services23
3,816 4,645 5,300 5,918 6,556 7,228 7,942 8,703 9,517 10,387
Cost of Sales and Services24
(2,234) (2,823) (3,285) (3,587) (4,042) (4,383) (4,835) (5,276) (5,768) (6,319)
Gross Profit 1,583 1,822 2,015 2,332 2,514 2,845 3,107 3,427 3,748 4,069
Operating Expenses25
(720) (951) (875) (1,006) (1,115) (1,229) (1,350) (1,480) (1,618) (1,766)
Other Operating Income, Net 52 45 41 - - - - - - -
EBIT 914 917 1,180 1,326 1,400 1,616 1,757 1,948 2,131 2,303
Interest Expense - - - (26)26
(28)27
(34)28
(36)29
(39)30
(33)31
(31)32
EBT 914 917 1,180 1,299 1,371 1,582 1,721 1,908 2,098 2,272
Provision for Income Tax33
(274) (271) (355) (390) (411) (475) (516) (572) (629) (682)
Net Income 640 646 825 910 960 1,108 1,204 1,336 1,468 1,590
Other Comprehensive Income34
5 (15) (14) - - - - - - -
Total Comprehensive Income 645 631 811 910 960 1,108 1,204 1,336 1,468 1,590
APPENDIX B-7. CCAC CASH FLOW STATEMENT
(IN MILLIONS PHP) 2014E 2015F 2016F 2017F 2018F 2019F 2020F
Operating Cash Flows
EBIT 1,326 1,400 1,616 1,757 1,948 2,131 2,303
Add: Depreciation 14 18 18 18 18 18 18
Operating Cash Flow before Changes in Working Capital 1,340 1,418 1,635 1,775 1,966 2,149 2,321
Decrease (Increase) in Accounts Receivable (347) (157) (166) (176) (188) (201) (215)
Decrease (Increase) in Inventory (19) (87) (65) (87) (85) (94) (106)
Decrease (Increase) in Prepayments 0 (1) (1) (1) (1) (1) (1)
Increase (Decrease) in Accounts Payable 56 137 103 136 133 148 166
Increase (Decrease) in Provision of Warranty 3 4 5 5 5 6 6
Increase (Decrease) in other Provisions - - - - - - -
Increase (Decrease) in Income Tax Payable - - - - - - -
Changes in Working Capital (307) (104) (124) (122) (135) (142) (149)
Payment of Taxes (390) (411) (475) (516) (572) (629) (682)
Net Cash from Operating Activities 644 903 1,036 1,137 1,259 1,378 1,490
Investing Cash Flows Investments (1,071) - - - - - -
Capital Expenditure (14) (34) (14) (14) (14) (14) (34)
Provision for LT Warranty 14 6 7 7 8 8 9
Net Cash from Investing Activities (1,071) (28) (8) (7) (7) (6) (26)
Financing Cash Flows Net Loan 1,000 - - - - - -
Dividend Payments35
(243) (273) (288) (332) (361) (401) (441)
Interest Expense (26) (28) (34) (36) (39) (33) (31)
Net Cash for Financing Activities 730 (301) (322) (368) (401) (434) (471)
Net Cash 303 574 706 761 851 938 993
Beginning, Cash 1,153 1,456 2,030 2,736 3,497 4,349 5,287
End, Cash 1,456 2,030 2,736 3,497 4,349 5,287 6,280
APPENDIX B-8. CCAC STATEMENT OF RETAINED EARNINGS
(IN MILLIONS PHP) 2014E 2015F 2016F 2017F 2018F 2019F 2020F
Beginning, Retained Earnings 1,040 1,706 2,393 3,213 4,085 5,060 6,127
Add: Net Income 910 960 1,108 1,204 1,336 1,468 1,590
Less: Dividend Payments (243) (273) (288) (332) (361) (401) (441)
Ending, Retained Earnings 1,706 2,393 3,213 4,085 5,060 6,127 7,277
23
11.67% to 8.88% Year-Over-Year Growth Rate from 2014 to 2020 24
60%-61% COGS Margin 25
17% OPEX Margin 26
Php 1 bn short term debt at 2.625% interest rate 27
Php 1 bn short term debt at 2.83% interest rate 28
Php 1 bn short term debt at 3.36% interest rate 29
Php 1 bn short term debt at 3.60% interest rate 30
Php 1 bn short term debt at 3.92% interest rate 31
Php 1 bn short term debt at 3.28% interest rate 32
Php 1 bn short term debt at 3.07% interest rate 33
30% corporate tax rate 34
Zero out 35
Payout Ratio: 30% of prior year’s net income

Ateneo de Manila University Student Research | 20
APPENDIX B-9. CDI BALANCE SHEET
(IN MILLIONS PHP) 2011 2012 2013 2014E 2015F 2016F 2017F 2018F 2019F 2020F
ASSETS
Current Assets
Cash and Cash Equivalents 104 68 77 156 185 210 299 379 471 666
Trade and Other Receivables, Net36
650 792 749 842 935 1,034 1,140 1,254 1,377 1,509
Inventories, Net37
229 371 406 424 478 522 577 632 694 763
Prepayments and Other Current Assets38
53 52 46 64 71 79 87 95 105 115
Total Current Assets 1,035 1,283 1,278 1,487 1,670 1,845 2,103 2,361 2,647 3,053
Non-Current Assets Property and Equipment, Net
39 102 129 110 110 110 110 110 110 110 110
Deferred Income Tax assets, Net40
12 6 8 8 8 8 8 8 8 8
Total Non-Current Assets 114 134 118 118 118 118 118 118 118 118
Total Assets 1,149 1,418 1,396 1,605 1,788 1,964 2,221 2,480 2,765 3,171
LIABILITIES
Current Liabilities
Trade Payables and Other Liabilities41
410 887 425 679 765 835 924 1,012 1,111 1,221
Short Term Borrowings - 282 170 -42
- - - - - -
Provision for Warranty43
1 1 - 1 1 1 1 1 1 1
Other Provisions44
37 16 - 26 28 31 35 38 42 46
Total Current Liabilities 447 1,186 595 705 795 867 959 1,051 1,154 1,268
Non-Current Liabilities Retirement Benefit Obligation
45 11 - 12 12 12 12 12 12 12 12
Provision for Warranty46
- 14 - - - - - - - -
Deposit for Future Share Subscription47
516 - - - - - - - - -
Total Non-Current Liabilities 526 14 12 12 12 12 12 12 12 12
Total Liabilities 973 1,200 608 718 807 880 972 1,064 1,166 1,281
EQUITY
Share Capital48
125 125 500 500 500 500 500 500 500 500
Share Premium49
- - 141 141 141 141 141 141 141 141
Retained Earnings 54 96 149 247 341 444 610 776 959 1,250
Other Comprehensive Loss50
(3) (4) (1) (1) (1) (1) (1) (1) (1) (1)
Total Equity 176 218 789 887 981 1,084 1,250 1,416 1,599 1,890
Total Liabilities and Equity 1,149 1,418 1,396 1,605 1,788 1,964 2,221 2,480 2,765 3,171
APPENDIX B-10. CDI INCOME STATEMENT
(IN MILLIONS PHP) 2011 2012 2013 2014E 2015F 2016F 2017F 2018F 2019F 2020F
Net Sales and Services51 1,789 2,294 2,289 2,561 2,845 3,146 3,469 3,815 4,187 4,588
Cost of Sales and Services52
(1,504) (1,895) (1,843) (2,065) (2,328) (2,539) (2,809) (3,078) (3,378) (3,713)
Gross Profit 285 399 446 496 517 607 660 737 809 875
Operating Expenses (273) (347) (352) (332) (334) (405) (362) (410) (450) (351)
Other Operating Income, Net 2 10 (9) - - - - - - -
EBIT 14 62 85 165 183 202 297 327 359 524
Interest Expense (0.011) (1.392) (9.955) - - - - - - -
EBT 14 61 75 165 183 202 297 327 359 524
Provision for Income Tax53
(4) (18) (22) (49) (55) (61) (89) (98) (108) (157)
Net Income 10 43 52 115 128 142 208 229 251 367
Other Comprehensive Income54
(2) (1) 3 - - - - - - -
Total Comprehensive Income 8 42 55 115 128 142 208 229 251 367
36
Based on 120 days sales outstanding 37
Based on 75 days inventory 38
Percentage of sales: 2.5% of annual sales 39
Annual depreciation expense is equal to annual maintenance CAPEX 40
Constant 41
Based on 120 days payables 42
Paid off Php 170 mn outstanding loan 43
Percentage of sales: 0.03% of annual sales 44
Percentage of sales: 1% of annual sales 45
Constant 46
Zero out 47
Zero out 48
Constant 49
Constant 50
Constant 51
11.91% to 9.5% Year-Over Year Growth Rate from 2014 to 2020 52
80-81% COGS margin 53
30% corporate tax rate 54
Zero out

Ateneo de Manila University Student Research | 21
APPENDIX B-11. CDI CASH FLOW STATEMENT
(IN MILLIONS PHP) 2014E 2015F 2016F 2017F 2018F 2019F 2020F
Operating Cash Flows
EBIT 165 183 202 297 327 359 524
Add: Depreciation 41 41 41 41 41 41 41
Operating Cash Flow before Changes in Working Capital 205 223 243 338 368 399 565
Decrease (Increase) in Accounts Receivable (93) (93) (99) (106) (114) (122) (132)
Decrease (Increase) in Inventory (18) (54) (43) (55) (55) (62) (69)
Decrease (Increase) in Prepayments (18) (7) (8) (8) (9) (9) (10)
Increase (Decrease) in Accounts Payable 254 86 70 89 88 99 110
Increase (Decrease) in Provision of Warranty 1 0 0 0 0 0 0
Increase (Decrease) in other Provisions 26 3 3 3 3 4 4
Changes in Working Capital 151 (65) (77) (77) (86) (91) (96)
Payment of Taxes (49) (55) (61) (89) (98) (108) (157)
Net Cash from Operating Activities 307 104 105 171 184 201 311
Investing Cash Flows
Capital Expenditure (41) (41) (41) (41) (41) (41) (41)
Net Cash from Investing Activities (41) (41) (41) (41) (41) (41) (41)
Financing Cash Flows
Net Loan (170) - - - - - -
Dividend Payments55
(17) (35) (38) (42) (62) (69) (75)
Interest Expense - - - - - - -
Net Cash for Financing Activities (187) (35) (38) (42) (62) (69) (75)
Net Cash 80 28 26 88 81 92 195
Beginning, Cash 77 156 185 210 299 379 471
End, Cash 156 185 210 299 379 471 666
APPENDIX B-12. CDI STATEMENT OF RETAINED EARNINGS
(IN MILLIONS PHP) 2014E 2015F 2016F 2017F 2018F 2019F 2020F
Beginning, Retained Earnings 149 247 341 444 610 776 959
Add: Net Income 115 128 142 208 229 251 367
Less: Dividend Payments (17) (35) (38) (42) (62) (69) (75)
Ending, Retained Earnings 247 341 444 610 776 959 1,250
55
Payout Ratio: 30% of prior year’s net income

Ateneo de Manila University Student Research | 22
APPENDIX B-13. COPI BALANCE SHEET
(IN MILLIONS PHP) 2013 2014E 2015F 2016F 2017F 2018F 2019F 2020F
ASSETS
Current Assets
Cash and Cash Equivalents 299 353 400 449 517 586 676 767
Trade and Other Receivables, Net56
145 103 114 124 135 147 160 174
Inventories, Net57
31 23 25 27 29 32 35 38
Other Current Assets58
32 24 27 29 31 34 37 40
Total Assets 507 503 566 630 713 798 909 1019
LIABILITIES
Current Liabilities
Trade Payables and Other Liabilities59
200 143 159 173 188 204 223 241
Other Liabilities60
20 15 17 19 20 22 24 26
Total Liabilities 220 159 176 192 208 226 247 267
EQUITY
Retained Earnings 0 57 102 151 218 285 375 464
Share Capital 287 287 287 287 287 287 287 287
Total Equity 287 344 390 438 505 573 662 752
Total Liabilities and Equity 507 503 566 630 713 798 909 1019
APPENDIX B-14. COPI INCOME STATEMENT
(IN MILLIONS PHP) 2014E61
2015F 2016F 2017F 2018F 2019F 2020F
New Equipment & Installation 106 120 137 155 177 201 228
YoY Growth (28%) 14% 14% 14% 14% 14% 14%
Repair & Modernization 110 122 135 146 156 169 177
YoY Growth (31%) 8% 3% 4% 5% 5% 6%
Service & Maintenance 127 137 141 147 154 162 171
YoY Growth 1% 11% 11% 8% 7% 8% 4%
Total Sales 342 380 413 448 487 532 576
Cost of Sales and Services62
(205) (228) (248) (269) (292) (319) (346)
Gross Profit 137 152 165 179 195 213 230
Operating Expenses (56) (62) (69) (55) (61) (45) (52)
EBIT 81 90 96 124 133 168 179
Tax Expense63
(24) (27) (29) (37) (40) (50) (54)
New Equipment & Installation 10 11 12 14 16 18 20
Net Income Margin 9% 9% 9% 9% 9% 9% 9%
Service & Maintenance 25 27 28 37 38 49 51
Net Income Margin 20% 20% 20% 25% 25% 30% 30%
Repair & Modernization 22 24 27 36 39 51 53
Net Income Margin 20% 20% 20% 25% 25% 30% 30%
Total Net Income 57 63 67 87 93 117 125
Total Net Income Margin 17% 17% 16% 19% 19% 22% 22%
APPENDIX B-15. COPI STATEMENT OF CASH FLOWS
(IN MILLIONS PHP) 2014E 2015F 2016F 2017F 2018F 2019F 2020F
Operating Cash Flows
EBIT 81 90 96 124 133 168 179
Decrease (Increase) in Accounts Receivable 42 (11) (10) (11) (12) (14) (13)
Decrease (Increase) in Inventory 8 (2) (2) (2) (3) (3) (3)
Decrease (Increase) in Other Current Assets 9 (3) (2) (2) (3) (3) (3)
Increase (Decrease) in Accounts Payable (57) 16 14 15 16 19 18
Increase (Decrease) in Other Current Liabilities (4) 2 1 2 2 2 2
Changes in Working Capital (3) 1 1 1 1 1 1
Payment of Taxes (24) (27) (29) (37) (40) (50) (54)
Net Cash from Operating Activities 54 64 68 88 94 119 126
Financing Cash Flows
Dividend Payments64
- (17) (19) (20) (26) (28) (35)
Net Cash for Financing Activities - (17) (19) (20) (26) (28) (35)
Net Cash 54 47 50 68 68 91 91
Beginning, Cash 299 353 400 449 517 586 676
End, Cash 353 400 449 517 586 676 767
56
Based on 110 days sales outstanding 57
Based on 40 days inventory 58
Percentage of sales: 7% of annual sales 59
Based on 255 days payables 60
Percentage if sales: 4.5% of annual sales 61
2014 revenue is based on 9 months ended actual sales of COPI divided by 0.067 (2 out of the 3 quarters – Q2 and Q3) 62
60% COGS Margin 63
30% corporate tax rate 64
Dividend payout ratio: 30% of prior year’s net income

Ateneo de Manila University Student Research | 23
APPENDIX B-16. COPI STATEMENT OF RETAINED EARNINGS
(IN MILLIONS PHP) 2014E 2015F 2016F 2017F 2018F 2019F 2020F
Beginning, Retained Earnings - 57 102 151 218 285 375
Add: Net Income 57 63 67 87 93 117 125
Less: Dividend Payments - (17) (19) (20) (26) (28) (35)
Ending, Retained Earnings 57 102 151 218 285 375 464
APPENDIX B-17. CMIP INCOME STATEMENT
(IN MILLIONS PHP) 2014E 2015F 2016F 2017F 2018F 2019F 2020F
Sales65
250 276 305 336 371 410 453
Net Income (108)66
- 6 11 17 23 32
Net Income Margin (43%)67
0%68
2% 3% 4% 6% 7%
65
10.40% CAGR for 2014 to 2020 66
Estimated using the Q3 17Q loss of CMIP 67
Based on company’s guidance 68
Based on company’s guidance, CMIP will breakeven on 2015

Ateneo de Manila University Student Research | 24
Appendix C: Industry Overview and Competitive Positioning
APPENDIX C-1. PORTER’S FIVE FORCES ANALYSIS
SUMMARY OF PORTER’S FIVE FORCES ANALYSIS
The Philippine air conditioning and refrigeration industry is analyzed by taking manufacturers and suppliers of air conditioning and refrigeration appliances as players. The key buyers are divided into two segments: the consumer segment and the building and industrial segment. They exert moderate buying power due to increasing purchasing power of the Filipinos backed by the country’s strong economic fundamentals. The industry players source most of their raw material inputs such as aluminum, copper, and steel, as well as other components like compressors and motors, from abroad. The large number of suppliers, coupled with low differentiation of inputs, results in low supplier power. Despite the low penetration rate in the country relative to its ASEAN neighbors, air conditioners and refrigerators do not have strong substitute products that can provide the same level of utility to its users. The low switching cost to cheaper alternatives results in a low to moderate threat to the business. The existence of strong brands in the market and the presence of economies of scale resulting from capital-intensive and high-volume manufacturing facilities make the threat of new entrants insignificant. However, these factors, together with high exit costs, contribute to the significant degree of rivalry in the industry.
MODERATE TO SIGNIFICANT BARGAINING POWER OF BUYERS
DRIVERS OF BUYER POWER
Factor Weight Power Score Buyer size 0.12 5 0.60
Oligopsony threat 0.06 3 0.18
Low-cost switching 0.12 5 0.60
Undifferentiated product 0.10 2 0.20
Tendency to switch 0.10 4 0.40
Price sensitivity 0.10 4 0.40
Financial muscle 0.12 4 0.48
Backwards integration 0.06 2 0.12
Buyer independence 0.10 4 0.40
Product dispensability 0.12 2 0.24
Overall 1.00
3.62
Insights: Consumers drive quality and innovation of products in the industry. They pressure the manufacturers to provide differentiated products by incorporating features such as energy efficiency and environmental sustainability at affordable cost. Companies strive to satisfy consumer preferences as the latter has a significant tendency to switch given the low switching cost and their strong financial muscle. Overall, buyers have moderate to significant bargaining power in the Philippine air conditioning and refrigeration industry.
0
1
2
3
4
5 Buyer size
Oligopsony threat
Low-cost switching
Undifferentiated product
Tendency to switch
Price sensitivity
Financial muscle
Backwards integration
Buyer independence
Product dispensability
Drivers of Buyer Power
Legend: 1 – Insignificant threat to the business 2 – Low threat to the business 3 – Moderate threat to the business 4 – Significant threat to the business 5 – High threat to the business
Source: Team Analysis
Legend: 1 = weak driver, 5 = strong driver Source: Team Estimates
0
1
2
3
4
5
Bargaining Power of Buyers
Bargaining Power of Suppliers
Threat of New Entrants
Threat of Substitute Products/Services
Rivalry of Existing Competitors
Porter's Five Forces Analysis

Ateneo de Manila University Student Research | 25
LOW BARGAINING POWER OF SUPPLIERS
DRIVERS OF SUPPLIER POWER
Factor Weight Power Score
Small supplier size 0.08 1 0.08
Oligopoly threat 0.12 1 0.12
Supplier switching cost 0.12 2 0.24
Supplier independence 0.12 1 0.12
Player dispensability 0.10 2 0.20
No substitute inputs 0.12 4 0.48
Importance of quality/cost 0.12 5 0.60
Differentiated input 0.12 1 0.12
Forward integration 0.10 1 0.10
Overall 1.00
2.06
Insights: Despite the high importance of quality and the lack of available substitutes for the raw material inputs, supplier power is low primarily due to the undifferentiated raw material inputs and the large supplier size relative to the number of manufacturers. This, together with the low supplier switching cost, results in low independence on the part of the suppliers. Hence, the bargaining power of suppliers is low.
LOW THREAT OF NEW ENTRANTS
FACTORS INFLUENCING THE LIKELIHOOD OF NEW ENTRANTS
Factor Weight Power Score
Low-cost switching 0.09 5 0.45
Undifferentiated product 0.07 2 0.14
Scale unimportant 0.11 1 0.11
Low fixed costs 0.11 1 0.11
Little regulation 0.07 3 0.21
Incumbents acquiescent 0.09 1 0.09
Distribution accessible 0.11 3 0.33
Suppliers accessible 0.11 3 0.33
Little IP involved 0.09 3 0.27
Weak brands 0.09 1 0.09
Market growth 0.06 3 0.18
Overall 1.00
2.31
Insights: In addition to the existence of strong brands in the market, the barrier to new entrants in the industry is very high due to the capital intensity and the importance of economies of scale. High fixed costs are associated with the equipment and machineries needed to manufacture the products. Likewise, heavy investments on R&D are necessary to satisfy the consumers’ preferences and secure brand loyalty. Thus, new entrants pose a low threat to air conditioning and refrigeration businesses in the country.
LOW TO MODERATE THREAT OF SUBSTITUTE PRODUCTS AND SERVICES
FACTORS INFLUENCING THE THREAT OF SUBSTITUTES
Factor Weight Power Score
Low-cost switching 0.20 5 1.00
Cheap alternative 0.20 5 1.00
Beneficial alternative 0.60 1 0.60
Overall 1.00
2.60
Insights: Electric and cooling fans are possible substitute products for air conditioners. On the other hand, as for refrigeration appliances, there are no clear substitute products, but consumers may choose to purchase their food on a per need basis instead. However, despite the low switching cost to these cheaper alternatives, these do not provide its users the same level of utility as with air conditioners and refrigerators. Therefore, the threat of substitute products and services is low in the market.
0
1
2
3
4
5 Small supplier size
Oligopoly threat
Supplier switching cost
Supplier independence
Player dispensability
No substitute inputs
Importance of quality/cost
Differentiated input
Forward integration
Drivers of Supplier Power
0
1
2
3
4
5
Low-cost switching
Undifferentiated product
Scale unimportant
Low fixed costs
Little regulation
Incumbents acquiescent
Distribution accessible
Suppliers accessible
Little IP involved
Weak brands
Market growth
Factors Influencing the Likelihood of New Entrants
0
1
2
3
4
5 Low-cost switching
Cheap alternative Beneficial alternative
Factors Influencing the Threat of Substitutes
Legend: 1 = weak driver, 5 = strong driver Source: Team Estimates
Legend: 1 = weak driver, 5 = strong driver Source: Team Estimates
Legend: 1 = weak driver, 5 = strong driver Source: Team Estimates

Ateneo de Manila University Student Research | 26
SIGNIFICANT RIVALRY OF EXISTING COMPETITORS
SIGNIFICANT RIVALRY OF EXISTING COMPETITORS
Factor Weight Power Score
Competitor size 0.11 5 0.55
Number of players 0.11 5 0.55
Low-cost switching 0.11 5 0.55
Undifferentiated product 0.08 2 0.16
Low fixed costs 0.08 2 0.16
Easy to expand 0.11 4 0.44
Hard to exit 0.11 5 0.55
Lack of diversity 0.06 2 0.12
Similarity of players 0.06 2 0.12
Storage costs 0.06 4 0.24
Zero-sum game 0.11 5 0.55
Overall 1.00
3.99
Insights: The competing brands in the RLC segment for air conditioning are Carrier, Condura, Toshiba, Kelvinator, Panasonic, Samsung, Hitachi, and other international brands. The commercial and industrial air conditioning market is dominated by Carrier, Mitsubishi, Trane, York, Hitachi, and LG, among others. Meanwhile, the major players in the RLC refrigeration market are Condura, Kelvinator, Panasonic, Samsung, Sharp, LG, Whirlpool, and others. Lastly, in the commercial and industrial refrigeration market, CIC competes with Grasso, GNQ, KR, Zikor, and Ruey Shing, among others. These key competitors have well-established reputation in the industry and have developed loyal customers. The presence of both local and international players boosts the competition within the market. Certain degree of product differentiation and the diversity of players in the industry ease rivalry to some extent. However, the relative low cost of expansion and high exit costs mean that it is likely for the established companies to increase capacity, continue to operate, and dominate the market. Overall, the rivalry of existing competitors poses a significant threat to the business.
APPENDIX C-2. SWOT ANALYSIS
Source: Team Analysis
STRENGTHS WEAKNESSES
• Leading and trusted brands
• Multi-brand strategy
• Strong local knowledge
• Strong research and development for innovation
• Cost leadership
• Lean manufacturing operations
• Flexible operations due to unique outsourcing strategy
• Customized end-to-end solutions
• Strong tier one relationship
• Wide-scale distribution network
• Heavy dependence on importation
• High fixed and employee costs
OPPORTUNITIES THREATS
• Philippines has low penetration rate in both air conditioning and refrigeration industry
• Booming real estate and construction industry
• Growing middle class
• Increasing consumer disposable income
• Foreign exchange risk
• Reinvestment rate risk
• Commodity price risk
• Intense rivalry within the market
• Increasing electricity cost from shortages
• Unplanned breakdown of plant and equipment
• Corporate governance risk
• Execution risk from recent M&As
0
1
2
3
4
5 Competitor size
Number of players
Low-cost switching
Undifferentiated product
Low fixed costs
Easy to expand Hard to exit
Lack of diversity
Similarity of players
Storage costs
Zero-sum game
Drivers of Degree of Rivalry
Legend: 1 = weak driver, 5 = strong driver Source: Team Estimates

Ateneo de Manila University Student Research | 27
APPENDIX C-3. COST REDUCTION METHODS
COST REDUCTION METHODS IN 2013
Engineering Savings
Design Changes Projects Savings
Change in Material Specification 4 2.7 mn
Change in Reduction of thickness 6 5.4 mn
Change due to Design Improvement 7 19.4 mn
Parts Reduction 1 1.9 mn
Engineering Cost Savings 18 29.4 mn
Purchasing Savings
Alternative Supplier Projects Savings
Imported 10 24.1 mn
Local 7 2.1 mn
Local to Imported 1 2.2 mn
Imported to Local 2 0.8 mn
Purchasing Savings 20 29.2 mn
Manufacturing/Logistic Savings
Cost Reduction Projects Savings
Diesel Cost Reduction 4.0 mn
Light and Power Reduction 5.3 mn
Warehouse Cost 5.4 mn
Manufacturing Savings 14.7 mn
Total Savings: 73.3 mn
Source: CIC Investor Briefing Manual
APPENDIX C-4. POSSIBLE MERGERS AND ACQUISITIONS
CIC aims to provide complete end-to-end building and industrial solutions by eyeing strategic acquisitions and joint ventures in the field of security systems, lighting fixtures, and fire safety. As both Carrier and Otis are brands under UTC, few of CIC’s possible acquisitions or JVs are UTC’s other brands, such as those shown below:
UTC PRODUCTS & BRANDS DESCRIPTION
Founded by the inventor of the first patented detector lock in 1818, Chubb is a leading provider of security and fire-safety solutions for businesses and industry nationwide.
Kidde is a leading manufacturer of residential smoke alarms, carbon monoxide (CO) alarms and fire extinguishers, and has been delivering advanced fire-safety technology for more than 90 years.
Automated Logic Corporation provides innovative building-management solutions that maximize energy efficiency and sustainable building operation while ensuring comfort.
Autronica is a leading innovator, manufacturer and supplier of fire safety equipment and marine safety monitoring and surveillance equipment.
Carrier Transicold helps improve transport and shipping temperature control with a complete line of equipment and services for refrigerated transport and cold chain visibility.
Delta Security Solutions provides integrated security services for commercial, industrial and government premises in France offering remote maintenance and 24/7 online customer support.

Ateneo de Manila University Student Research | 28
Det-Tronics is the global leader in fire- and gas-safety systems, providing premium flame and gas-detection and hazard-mitigation systems for high-risk processes and industrial operations.
Founded by the inventor of the first electric bell in 1872, Edwards provides fire-safety and security solutions around the world.
Fireye is a leading manufacturer of flame safeguard controls and burner management systems for commercial and industrial applications around the world.
Gulf Security Technology Co., GST, is a leader of China’s fire and security industry and a trusted provider of comprehensive fire system solutions around the world.
Interlogix provides leading security and life-safety solutions for both residential and commercial applications covering intrusion, video, transmission and access.
Lenel provides enterprise software, integrated systems and access-control systems to manage multiple security systems, real-time intelligent video content analysis, biometric access, smart card applications and visitor-management systems for corporate and government security customers.
Marioff is the world’s largest supplier of water mist fire protection technology, with unrivalled experience supplying system solutions worldwide under the HI-FOG® brand.
As one of the largest energy services companies in the U.S., NORESCO utilizes design-build, performance-based contracting vehicles and asset monetization solutions to deliver energy and maintenance savings and significant infrastructure upgrades to existing facilities.
Onity supports the hospitality, commercial, education and military segments with a full spectrum of products that include electronic locks, electronic safes and energy-management solutions.
As the world’s leading provider of cold-chain visibility solutions, Sensitech enables global leaders in the food and pharmaceuticals industries to track and monitor assets across the supply chain to protect the integrity of temperature-sensitive products.
Sicli is France’s top supplier of fire extinguishers and hose reels with a service branch network across France and Switzerland.

Ateneo de Manila University Student Research | 29
Supra is a leading manufacturer of key-control and entry-management products.
Taylor Company manufactures commercial foodservice equipment to serve frozen desserts, frozen beverages and grilled specialties.
UTEC manufactures microprocessor-based controls for heating, ventilation, air-conditioning and refrigeration manufacturers worldwide. The company is also a major supplier of standard and programmable thermostats and zoning systems.
Source: UTC Website

Ateneo de Manila University Student Research | 30
Appendix D: Valuation
APPENDIX D-1. SUMMARY OF SUM OF PARTS AND DCF METHODS
EQUITY VALUE BREAKDOWN
VALUE (PHP MN) VALUE PER
SHARE % OF
VALUE VALUATION METHOD
CCAC 13,137.15 38.68 72.39% 60% Stake DCF Model
CDI 3,877.49 11.42 21.37% 100% Stake DCF Model
COPI 1,051.87 3.10 5.80% 51% Stake DCF Model
CMIP 80.19 0.24 0.44% 40% Stake DCF Model
Total Enterprise Value 18,146.70 53.43 Net Debt (1,000.00) (2.94) Equity Value 17,146.70 50.49
CCAC WACC CALCULATION 2014E 2015E 2016E 2017E 2018E 2019E 2020E TERMINAL
Risk Free Rate 4.75% 4.75% 4.75% 4.75% 4.75% 4.75% 4.75% 4.75%
Market Premium 5.56% 5.56% 5.56% 5.56% 5.56% 5.56% 5.56% 5.56%
Levered Beta69
1.02 1.02 1.02 1.02 1.02 1.02 1.02 1.02
CAPM Cost 10.40% 10.40% 10.40% 10.40% 10.40% 10.40% 10.40% 10.40%
After-Tax Interest Rate 1.84% 1.98% 2.35% 2.52% 2.74% 2.30% 2.15% 2.31%
Capital Structure - Equity 90.00% 90.00% 90.00% 90.00% 90.00% 90.00% 90.00% 90.00%
Capital Structure - Loan 10.00% 10.00% 10.00% 10.00% 10.00% 10.00% 10.00% 10.00%
WACC70
9.54% 9.56% 9.59% 9.61% 9.63% 9.59% 9.57% 9.59%
Outstanding Shares (in mn) 339.62
CDI/COPI/CMIP WACC CALCULATION 2014E 2015E 2016E 2017E 2018E 2019E 2020E TERMINAL
Risk Free Rate 4.75% 4.75% 4.75% 4.75% 4.75% 4.75% 4.75% 4.75%
Market Premium 5.56% 5.56% 5.56% 5.56% 5.56% 5.56% 5.56% 5.56%
Levered Beta71 1.02 1.02 1.02 1.02 1.02 1.02 1.02 1.02
CAPM Cost 10.40% 10.40% 10.40% 10.40% 10.40% 10.40% 10.40% 10.40%
After-Tax Interest Rate 1.84% 1.98% 2.35% 2.52% 2.74% 2.30% 2.15% 2.31%
Capital Structure - Equity 100.00% 100.00% 100.00% 100.00% 100.00% 100.00% 100.00% 100.00%
Capital Structure - Loan 0.00% 0.00% 0.00% 0.00% 0.00% 0.00% 0.00% 0.00%
WACC72
10.40% 10.40% 10.40% 10.40% 10.40% 10.40% 10.40% 10.40%
Outstanding Shares (in mn) 339.62
69
See Appendix D-16 70
See Appendix D-19 71
See Appendix D-16 72
See Appendix D-19

Ateneo de Manila University Student Research | 31
APPENDIX D-2. CCAC FREE CASH FLOW AND VALUATION
APPENDIX D-3. CDI FREE CASH FLOW AND VALUATION
YEAR 2014E 2015F 2016F 2017F 2018F 2019F 2020F
EBIT 165 183 202 297 327 359 524
Tax Retention Rate 70% 70% 70% 70% 70% 70% 70%
EBIT(1-T) 115 128 142 208 229 251 367
CAPEX (41) (41) (41) (41) (41) (41) (41)
Change in Net Working Capital (151) 65 77 77 86 91 96
Free Cash Flow (76) 153 178 245 274 302 423
WACC 10.40% 10.40% 10.40% 10.40% 10.40% 10.40% 10.40% PV of FCFF (76) 138 146 182 185 184 234
Total Value 992 Terminal Value 2,885 Total Value 3.877 No. of Shares 339.62 Value per share 11.42
APPENDIX D-4. COPI FREE CASH FLOW AND VALUATION
YEAR 2014E 2015F 2016F 2017F 2018F 2019F 2020F
EBIT 81 90 96 124 133 168 179
Tax Retention Rate 70% 70% 70% 70% 70% 70% 70%
EBIT(1-T) 57 63 67 87 93 117 125
CAPEX - - - - - - -
Change in Net Working Capital 3 (1) (1) (1) (1) (1) (1)
Free Cash Flow 60 62 67 86 92 116 124
51% of FCFC Attributable to CIC 41 46 49 63 68 86 91
WACC 10.40% 10.40% 10.40% 10.40% 10.40% 10.40% 10.40% PV of FCFF 41 41 40 47 46 52 50
Total Value 319 Terminal Value 733 Total Value 1,052 No. of Shares 339.62 Value per share 3.10
APPENDIX D-5. CMIP FREE CASH FLOW AND VALUATION
YEAR 2014E 2015F 2016F 2017F 2018F 2019F 2020F
Total Net Income (108) - 6 11 17 23 32
40% of Net Income Attributable to CIC (43) - 2 4 7 9 13
WACC 10.40% 10.40% 10.40% 10.40% 10.40% 10.40% 10.40% PV of FCFF (43) - 2 3 4 6 7
Total Value 80 No. of Shares 339.62 Value per share 0.24
YEAR 2014E 2015F 2016F 2017F 2018F 2019F 2020F
EBIT 1,326 1,400 1,616 1,757 1,948 2,131 2,303
Tax Retention Rate 70% 70% 70% 70% 70% 70% 70%
EBIT(1-T) 928 980 1,131 1,230 1,363 1,491 1,612
CAPEX (14) (34) (14) (14) (14) (14) (34)
Change in Net Working Capital 307 104 124 122 135 142 149
Free Cash Flow 1,220 1,049 1,241 1,337 1,484 1,619 1,726
60% of FCF Attributable to CIC 732 629 745 802 890 971 1,036
WACC 9.54% 9.56% 9.59% 9.61% 9.63% 9.59% 9.57%
PV of FCFF 732 574 620 609 616 614 599
Total Value 4,365 Terminal Value 8,772 Net Debt 1,000 Total Value 12,137 No. of Shares 339.62 Value per share 35.74

Ateneo de Manila University Student Research | 32
Industry Value of Air Conditioning
Appliances
Consumer Solutions
70%
First Time Buyers
55%
GDP Per Capita
27.5%
New Residential Units Supply
27.5%
Replacement Market
15%
Upper Middle Income Class Households
15%
Building and Industrial Solutions
30%
Non-Residential Segment
30%
New Office Supply
30%
Industry Value of
Commercial Refrigeration
Appliances
Commercial Segment
100%
Consumer Food Service
19%
Consumer Food Service Outlets
19%
Retailing
81%
Grocery Retail Outlets
81%
Industry Value of
Residential Refrigeration
Appliances
Consumer Segment
100%
First Time Buyers
58%
GDP Per Capita
29%
New Residential Units Supply
29%
Replacement Market
42%
Upper Middle Income Class Households
42%
APPENDIX D-6. KEY DRIVERS FOR GROWTH
Explained Variable
Segment73
Category74
Explanatory Variable75
Explained Variable
Segment
Category76
Explanatory Variable
Explained Variable
Segment
Category77
Explanatory Variable
Source: National Statistics Coordination Board, Euromonitor International, Business Monitor International, Colliers International Philippines Research, World Bank, and International Monetary Fund
73
Based on the target breakdown of sales per segment by the management. 74
Based on the forecasted number of additional households that possess air conditioners from 2014 to 2020 with respect to its 10-year lagged period. The lag of 10 years is equivalent to the replacement cycle of air conditioners according to Euromonitor. 75
Equal weights are given to GDP per capita and new residential building supply. 76
Based on the percentage distribution of the consumer food service retail sales value and grocery retail sales value as forecasted by Euromonitor for the years 2014-2020. 77
Based on the forecasted number of additional households that possess refrigerators from 2014 to 2020 with respect to its 9-year lagged period. The lag of 9 years is equivalent to the replacement cycle of refrigerators according to Euromonitor.

Ateneo de Manila University Student Research | 33
• GDP per Capita – Gross domestic product is the sum of gross value added by all resident producers in the economy plus any product taxes
and minus any subsidies not included in the value of the products. It is calculated without making deductions for depreciation of fabricated assets or for depletion and degradation of natural resources. The variable explains the number of first time buyers of air conditioners and refrigerators in the consumer solutions segment.
78
• New Residential Units Supply – Number of new residential units forecasted by Colliers International Philippines Research from 2014 to 2017 on the following locations: Makati CBD, Rockwell, Fort Bonifacio, Ortigas, and Eastwood.
79
• Upper Middle Income Class Households – Equivalent to the number of households with an annual disposable income above the middle class median income of Php 430,728 but below the middle class maximum income of Php 2.3 mn, the variable counts the upper half of middle income households as defined by the National Statistics Coordination Board. The variable explains the replacement market in the consumer solutions segment for both appliances.
80
• New Office Supply – Net usable area of office supply forecasted by Colliers International Philippines Research from 2014 to 2016 on the following locations: Makati CBD, Ortigas, Fort Bonifacio, Eastwood, Alabang, Manila, Pasay, Mandaluyong, Quezon City, and other fringe locations.
81
• Consumer Food Service Outlets – Composed of cafés/bars, full-service restaurants, fast food, 100% home delivery/takeaway, self-service cafeterias, and street stalls/kiosks. The variable explains the sales of refrigeration appliances in the commercial segment.
82
• Grocery Retail Outlets – Retailers selling predominantly food/beverages/tobacco and other everyday groceries. This is the aggregation of hypermarkets, supermarkets, discounters, convenience stores, independent small grocers, chained forecourt retailers, independent forecourt retailers, food/drink/tobacco specialists, and other grocery retailers. The variable explains the sales of refrigeration appliances in the commercial segment.
83
APPENDIX D-7. CCAC GROWTH RATE
SEGMENT % CATEGORY % EXPLANATORY VARIABLE % EFF. % GROWTH
RATE
Residential and Non-Residential Air Conditioning Industry
Consumer Solutions Segment
70.0% First Time Buyers 79.2%
GDP per Capita 50.0% 27.7% 7.90%
New Residential Units Supply 50.0% 27.7% 10.40%
Replacement Market 20.8% Upper Middle Income Class HH 100.0% 14.6% 9.99%
Building and Industrial Solutions Segment
30.0% Non-Residential Segment
100.0% New Office Supply 100.0% 30.0% 8.25%
Average Industry Growth Rate: 9.00%
SEGMENT % CATEGORY % EXPLANATORY VARIABLE % EFF. % GROWTH
RATE
Commercial Refrigeration Industry
Commercial Segment 100.0%
Consumer Food Service
19.3% Consumer Food Service Outlets 100.0% 19.3% 0.82%
Retailing 80.7% Grocery Retail Outlets 100.0% 80.7% 0.73%
Average Industry Growth Rate: 0.74%
TOTAL CCAC SALES GROWTH RATE % GROWTH RATE
Air Conditioning Industry Growth Rate84
98.50% 9.00%
Commercial Refrigeration Industry Growth Rate 1.50% 0.74%
Weighted Average Industry Growth Rate 8.88%
CCAC Premium85
2.80%
Total CCAC Sales Growth Rate 11.68%
78
World Bank 79
Colliers International Research Report 80
Euromonitor International 81
Colliers International Research Report 82
Euromonitor International 83
Euromonitor International 84
Based on the percentage distribution of CCAC sales of air conditioners and commercial refrigerators in 2013. 85
See Appendix D-13

Ateneo de Manila University Student Research | 34
APPENDIX D-8. CDI GROWTH RATE
SEGMENT % CATEGORY % EXPLANATORY VARIABLE % EFF. % GROWTH
RATE
Residential and Non-Residential Air Conditioning Industry
Consumer Segment
100.0% First Time Buyers 57.8%
GDP per Capita 50.0% 28.9% 7.90%
New Residential Units Supply 50.0% 28.9% 10.40%
Replacement Market 42.2% Upper Middle Income Class Households 100.0% 42.2% 9.99%
Average Industry Growth Rate: 9.50%
TOTAL CDI SALES GROWTH RATE GROWTH RATE
Residential Refrigeration Industry Growth Rate 9.50%
CDI Premium86
2.41%
Total CDI Sales Growth Rate 11.91%
APPENDIX D-9. COPI GROWTH RATE
The growth rate for COPI is pegged with the industry value of the residential and non-residential building segments. With the increase in the number of buildings, the demand for elevators and escalators is bound to follow. As such, we assume COPI’s sales growth to follow the residential and non-residential building value growth rate. Forecasted values from 2014 to 2020 are gathered from Business Monitor International (BMI). The CAGR is computed as follows:
YEAR RESIDENTIAL AND NON-
RESIDENTIAL BUILDING INDUSTRY
VALUE (PHP MN)
2013 512,750
2014 572,650
2015 652,580
2016 723,350
2017 801,830
2018 888,800
2019 985,150
2020 1,091,840
CAGR 11.40%
A premium of 2.18% is then added to the industry growth rate of 11.40% to arrive at COPI’s year-over-year sales growth rate of 13.58% from 2014 to 2020.
APPENDIX D-10. CMIP GROWTH RATE
CMIP’s include washing machines, microwaves, electric fans, and toasters, all of which fall under the consumer appliance category. Since the sales of CMIP are strongly associated with household expenditure for consumer appliances, we use the latter as the basis of our sales forecast. Data from 2014-2019 are obtained from Euromonitor International. The CAGR is computed as follows:
YEAR HOUSEHOLD EXPENDITURE FOR
HOUSEHOLD APPLIANCES (PHP MN)
2013 29,000
2014 31,500
2015 34,200
2016 36,900
2017 39,800
2018 43,100
2019 46,600
CAGR 8.22%
A premium of 2.18% is then added to the industry growth rate of 8.22% to arrive at CMIP’s year-over-year sales growth rate of 10.40% from 2014 to 2020.
86 See Appendix D-13.

Ateneo de Manila University Student Research | 35
APPENDIX D-11. SUMMARY OF GROWTH RATES
CCAC 2014E 2015F 2016F 2017F 2018F 2019F 2020F
Industry Growth Rate 8.88% 8.88% 8.88% 8.88% 8.88% 8.88% 8.88%
Premium 2.80% 1.90% 1.37% 1.00% 0.71% 0.47% 0.27%
CCAC Sales Growth 11.68% 10.78% 10.25% 9.88% 9.58% 9.35% 9.15%
CAGR 9.83%
CDI 2014E 2015F 2016F 2017F 2018F 2019F 2020F
Industry Growth Rate 9.50% 9.50% 9.50% 9.50% 9.50% 9.50% 9.50%
Premium 2.41% 1.58% 1.09% 0.75% 0.48% 0.26% 0.07%
CDI Sales Growth 11.91% 11.08% 10.59% 10.25% 9.98% 9.76% 9.58%
CAGR 10.21%
COPI 2014E 2015F 2016F 2017F 2018F 2019F 2020F
Industry Growth Rate 11.40% 11.40% 11.40% 11.40% 11.40% 11.40% 11.40%
Premium 2.18% 2.18% 2.18% 2.18% 2.18% 2.18% 2.18%
COPI: NEI Sales Growth 13.58% 13.58% 13.58% 13.58% 13.58% 13.58% 13.58%
CMIP 2014E 2015F 2016F 2017F 2018F 2019F 2020F
Industry Growth Rate 8.22% 8.22% 8.22% 8.22% 8.22% 8.22% 8.22%
Premium 2.18% 2.18% 2.18% 2.18% 2.18% 2.18% 2.18%
CMIP Sales Growth 10.40% 10.40% 10.40% 10.40% 10.40% 10.40% 10.40%
Source: Team Analysis

Ateneo de Manila University Student Research | 36
APPENDIX D-12. REGRESSION BACKING
For statistical backing of the growth rates that we used, we conducted a regression analysis for CCAC’s air conditioning business and CDI’s residential refrigeration business. This is done to strengthen our drivers for growth. Four key statistics, namely the adjusted R
2, F-statistic, t-statistic, and the
correlation are considered to show the statistical significance and explanatory power of the variables.
ADJUSTED R2
Adjusted R2 indicates how much of the variance in the dependent variable is explained by the independent variable. This value has been adjusted to
take into account the problem of an increasing R2 when the number of explanatory variables increases. This measure is more indicative of the
predictive power of the analysis than the ordinary R2. This value is calculated as:
𝐴𝑑𝑗.𝑅! = 𝑅! − (1 − 𝑅!)𝑝
𝑛 − 𝑝 − 1
Where R2 is the ordinary R
2
n is sample size p is the number of regressors
F-TEST
The F-test examines the predictive power of the entire model. The statistic for the F-test is calculated as:
𝐹 =𝑆𝑆𝑇𝑅/(1 − 𝑘)𝑆𝑆𝐸/(𝑛 − 𝑘)
Where SSTR is the treatment sum of squares SSE is the sum of squares due to error The hypotheses for the F-test are
𝐻!: 𝛽! = 𝛽! = ⋯ = 𝛽! = 0 𝐻!: 𝛽! ≠ 0 𝑓𝑜𝑟 𝑠𝑜𝑚𝑒 𝑖 = 1,2,… ,𝑛.
T-STATISTIC
The t-statistic tells us the level of statistical significance of each regressors’ coefficient. This is calculated as:
𝑡𝛽 =𝛽 − 𝛽0𝑆𝐸𝛽
Where 𝑆𝐸𝛽 is standard error of the least squares estimate
The hypotheses for the t-test are: 𝑓𝑜𝑟 𝑖 = 1,2,… ,𝑛,
𝐻!: 𝛽! = 0 𝐻!: 𝛽! ≠ 0.
CORRELATION
Correlation shows us the degree of linear dependence, and direction of interaction among variables. The level of dependence strengthens as the
correlation approaches ±1. Two variables are inversely proportional when the correlation is negative, while they are directly proportional when the correlation is positive. It is computed as:
𝜌𝑥𝑦 = 𝐶𝑂𝑉(𝑋, 𝑌)
𝜎𝑥𝜎𝑦
CCAC AIR CONDITIONER BUSINESS
AIR CONDITIONER
INDUSTRY
GDP PER CAPITA
UPPER MIDDLE INCOME CLASS HOUSEHOLDS
Php Millions Php Thousands
Euromonitor Euromonitor Euromonitor
6,929 46,630 987
7,482 49,482 870
8,051 52,375 942
8,661 55,546 967
9,267 61,279 1,100
9,823 66,593 1,360
10,412 72,107 1,846
11,047 77,699 2,605
11,485 85,314 3,299
11,930 88,199 3,070
12,692 97,230 3,746
11,661 103,039 4,675
12,266 110,281 5,594
13,146 118,441 6,366
Adjusted R2 0.90 0.95
F-stat (p-value) 1.52E-07 3.87E-05
T-stat (p-value) 1.52E-07 3.87E-05
Correlation 0.95 0.87

Ateneo de Manila University Student Research | 37
GDP PER CAPITA
Air conditioner sales is regressed with the Philippine GDP per capita. We expect a positive effect from this regressor given that higher levels of GDP per capita (a proxy measure of purchasing power) will allow more people to afford air conditioners. Analysis on data from year 2000 onwards yields the following results:
REGRESSION STATISTICS
Multiple R 0.95
R2 0.91
Adjusted R2
0.90
Standard Error 637.84
Observations 14
ANOVA
df SS MS F Significance F
Regression 1 47,603,708 47,603,708 117.01 1.52E-07
Residual 12 4,882,145 406,845.40 Total 13 52,485,853
COEFFICIENTS STANDARD ERROR T-STAT P-VALUE LOWER 95% UPPER 95% LOWER 95.0% UPPER 95.0%
Intercept 4,062.57 605.43 6.71 2.16E-05 2,743.45 5,381.69 2,743.45 5,381.69
GDP per Capita 0.08 0.01 10.82 1.52E-07 0.06 0.10 0.06 0.10
The result above shows that the coefficient of GDP per capita is positive. This indicates that the sales value of the air conditioning industry increases as GDP per capita increases.
NUMBER OF UPPER MIDDLE INCOME CLASS
Air conditioner sales is regressed with the number of upper middle-income class households. We expect a positive effect from this regressor given that an increase in the number of upper middle-income class households implies more people switching to higher standards of living. This variable is a proxy measure for the number of people replacing their air conditioners. Analysis on data from year 2000 onwards yields the following results:
REGRESSION STATISTICS
Multiple R 0.88
R Square 0.77
Adjusted R Square 0.75
Standard Error 1,006.12
Observations 14
ANOVA
df SS MS F Significance F
Regression 1 40,338,526 40,338,526 39.85 3.87E-05
Residual 12 12,147,327 1,012,277 Total 13 52,485,853
COEFFICIENTS STANDARD
ERROR T-STAT P-VALUE LOWER 95% UPPER 95%
LOWER 95.0%
UPPER 95.0%
Intercept 7,808.69 483.66 16.14 1.67E-09 6,754.88 8,862.50 6,754.88 8,862.50
GDP per Capita
0.95 0.15 6.31 3.87E-05 0.62 1.28 0.62 1.28
0
2,000
4,000
6,000
8,000
10,000
12,000
14,000
0
20,000
40,000
60,000
80,000
100,000
120,000
140,000
1 2 3 4 5 6 7 8 9 10 11 12 13 14
Air C
onditio
ner In
dustry S
ale
s Valu
e (in
Php m
n)
GD
P p
er
Capita (
in P
hp)
GDP per Capita Airconditioner Industry

Ateneo de Manila University Student Research | 38
The result above shows that the coefficient of the number of upper middle-income class households is positive. This indicates that the sales value of the air conditioning industry increases as the variable increases.
CDI RESIDENTIAL REFRIGERATION BUSINESS
RESIDENTIAL REFRIGERATION
GDP PER CAPITA UPPER MIDDLE INCOME CLASS
HOUSEHOLDS
Php Millions Php Thousands
Euromonitor Euromonitor Euromonitor
4,240 46,630 987
4,647 49,482 870
5,097 52,375 942
5,596 55,546 967
6,150 61,279 1,100
6,763 66,593 1,360
7,445 72,107 1,846
8,174 77,699 2,605
8,593 85,314 3,299
8,937 88,199 3,070
10,188 97,230 3,746
9,424 103,039 4,675
10,460 110,281 5,594
11,350 118,441 6,366
Adjusted R2 0.97 0.98
F Stat (p-value) 8.83E-11 2.35E-12
t Stat (p-value) 8.83E-11 2.35E-12
Coefficients 9.60E-02 1.13E+00
Correlation 0.99 0.94
GDP PER CAPITA
Refrigerator sales is regressed with the Philippine GDP per capita. We expect a positive effect from this regressor given that higher levels of GDP per capita (a proxy measure of purchasing power) will allow more people to afford refrigerators. Analysis on data from year 2000 onwards yields the following results:
REGRESSION STATISTICS
Multiple R 0.99
R Square 0.97
Adjusted R Square 0.97
Standard Error 392.41
Observations 14
ANOVA
df SS MS F Significance F
Regression 1 66,608,428 66,608,428 433 8.83E-11
Residual 12 1,847,797 153,983 Total 13 68,456,225
COEFFICIENTS STANDARD ERROR T-STAT P-VALUE LOWER 95% UPPER 95% LOWER 95.0% UPPER 95.0%
Intercept 214.14 372.47 0.57 0.58 (597.39) 1,025.67 (597.39) 1,025.67
GDP per Capita
0.10 0.01 20.80 8.83E-11
0.09 0.11 0.09 0.11
0
1,000
2,000
3,000
4,000
5,000
6,000
7,000
0
2,000
4,000
6,000
8,000
10,000
12,000
14,000
20
00
20
02
20
04
20
06
20
08
20
10
20
12
20
14
Num
ber o
f Upper M
iddle
Inco
me
House
hold
s (in th
rousa
nds)
AC
Indust
ry S
ale
s Valu
e
(in P
hp m
n)
Air Conditioning Industry Sales Value
Upper Middle Income Class Households

Ateneo de Manila University Student Research | 39
The result above shows that the coefficient of GDP per capita is positive. This indicates that the sales value of the refrigeration industry increases as GDP per capita increases.
UPPER MIDDLE INCOME CLASS HOUSEHOLDS
Refrigerator sales is regressed with the number of upper middle-income class households. We expect a positive effect from this regressor given that an increase in the number of upper middle-income class households implies more people switching to higher standards of living. This variable is a proxy measure of the number of people replacing their refrigerators. Analysis on data from year 2000 onwards yields the following results:
REGRESSION STATISTICS
Multiple R 0.99
R Square 0.99
Adjusted R Square 0.98
Standard Error 290.21
Observations 14
ANOVA
df SS MS F Significance F
Regression 1 67,445,558 67,445,558 801 2.35E-12
Residual 12 1,010,667 84,222 Total 13 68,456,225
COEFFICIENTS STANDARD ERROR T-STAT P-VALUE LOWER 95% UPPER 95% LOWER 95.0% UPPER 95.0%
Intercept (12,687.50) 722.76 (17.55) 6.36E-10 (14,262.30) (11,112.70) (14,262.30) (11,112.70)
GDP per Capita
1.13 0.04 28.30 2.35E-12
1.04 1.22 1.04 1.22
The result above shows that the coefficient of the number of upper middle-income class households is positive. This indicates that the sales value of the refrigeration industry increases as the variable increases.
0
2,000
4,000
6,000
8,000
10,000
12,000
0
20,000
40,000
60,000
80,000
100,000
120,000
140,000
1 2 3 4 5 6 7 8 9 10 11 12 13 14
Resid
entia
l Refrig
era
tor In
dustry
Resid
enatia
l Reg.n
G
DP
per
Capita (
in P
hp)
GDP per Capita Residential Refirgeration
0
2,000
4,000
6,000
8,000
0
3,000
6,000
9,000
12,000
1 2 3 4 5 6 7 8 9 10 11 12 13 14
Resid
entia
l Refrig
era
tion
Industry S
ale
s Valu
e
(in P
hp m
n)
Num
ber
of
Upper
Mid
dlin
e
Inco
me H
Hs
Residential Refirgeration
Upper Middle Income Class Households

Ateneo de Manila University Student Research | 40
APPENDIX D-13. PREMIUM
CIC has historically outperformed the industry. As such, a premium is added to the industry growth rate in obtaining CIC’s forecasted sales growth rates to take into account CIC’s ability to capitalize on its distinctive competencies. The premium of each of the subsidiaries is obtained by getting the average of the differences in the annual growth rates between the industry and the subsidiary. The table below shows CCAC and CDI sales with their respective industry sales values:
CCAC SALES
INDUSTRY VALUE
CDI SALES INDUSTRY
VALUE
1999 2,264 7,481 1999 - -
2000 2,463 8,110 2000 - -
2001 3,219 8,724 2001 - -
2002 3,000 9,356 2002 - -
2003 3,506 10,052 2003 - -
2004 4,089 10,706 2004 - -
2005 4,154 11,276 2005 - -
2006 5,074 11,902 2006 - -
2007 4,498 12,582 2007 - -
2008 4,263 12,688 2008 1,534 8,593
2009 3,240 12,988 2009 1,843 8,937
2010 4,280 13,772 2010 1,789 10,188
2011 3,816 12,767 2011 2,294 9,424
2012 4,645 13,387 2012 2,289 10,460
2013 5,300 14,284 2013 2,531 11,350
CCAC Premium 2.80 CDI Premium 2.41
We derived COPI and CMIP’s premium using the mean of the annual weighted average of CCAC’s and CDI’s yearly premium with respect to sales. For CMIP and COPI, the premium is expected to be constant at 2.18% given that both are still in their gestation period. However, we adjusted CCAC’s and CDI’s premiums of 2.80% and 2.41%, respectively, to factor in the possible slower growth in CIC’s core business as it expands further. The premium of each subsidiary will drop down to 0 at the terminal phase in 2021. To derive the decreasing premium for CCAC, we used the equation below:
𝑦 = −0.013 ln 𝑥 − 2013 + 0.0281 The logarithmic equation accounts for the diminishing marginal rate of decline of CCAC’s premium. CCAC’s premium on top of the industry growth in the succeeding years is shown in the figure below:
On the other hand, to derive the decreasing premium for CDI, we use the equation below:
𝑦 = −0.012 ln 𝑥 − 2013 + 0.024 CDI’s premium over the industry growth for the succeeding years is shown below:
0.00%
0.50%
1.00%
1.50%
2.00%
2.50%
3.00%
2013 2015 2017 2019
CC
AC
Pre
miu
m
Year
0.00%
0.50%
1.00%
1.50%
2.00%
2.50%
3.00%
2013 2015 2017 2019
CD
I P
rem
ium
Year
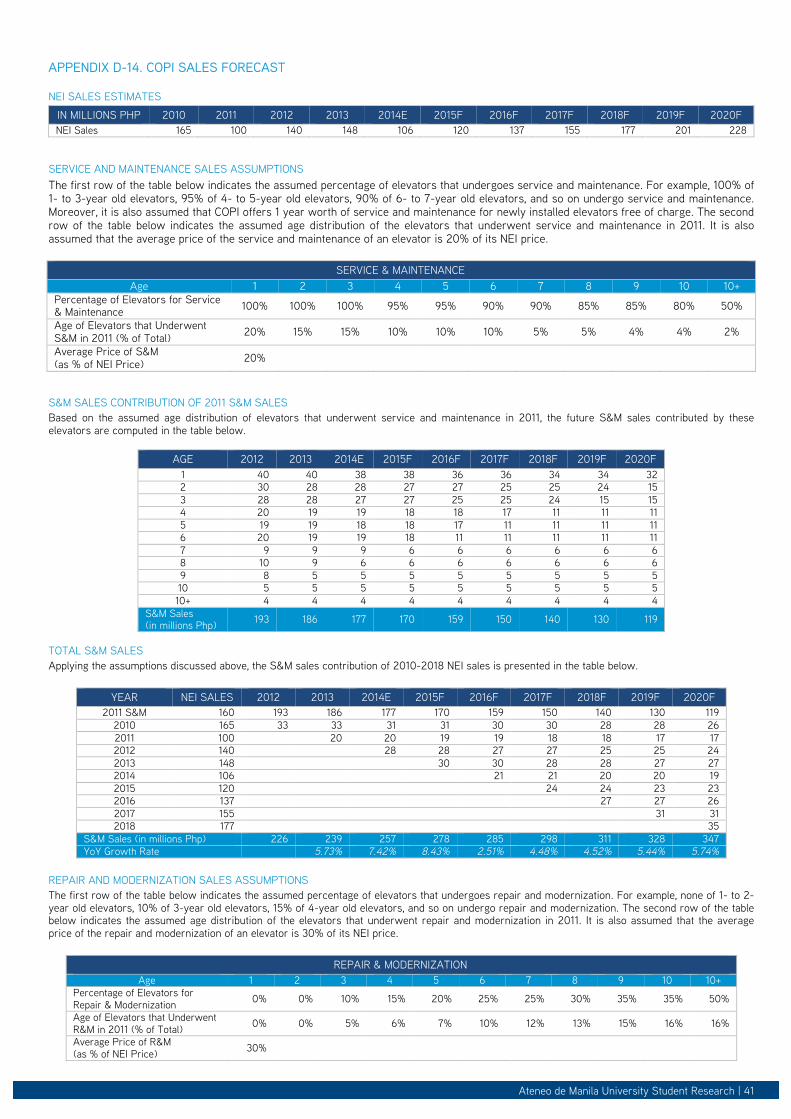
Ateneo de Manila University Student Research | 41
APPENDIX D-14. COPI SALES FORECAST
NEI SALES ESTIMATES
IN MILLIONS PHP 2010 2011 2012 2013 2014E 2015F 2016F 2017F 2018F 2019F 2020F
NEI Sales 165 100 140 148 106 120 137 155 177 201 228
SERVICE AND MAINTENANCE SALES ASSUMPTIONS
The first row of the table below indicates the assumed percentage of elevators that undergoes service and maintenance. For example, 100% of 1- to 3-year old elevators, 95% of 4- to 5-year old elevators, 90% of 6- to 7-year old elevators, and so on undergo service and maintenance. Moreover, it is also assumed that COPI offers 1 year worth of service and maintenance for newly installed elevators free of charge. The second row of the table below indicates the assumed age distribution of the elevators that underwent service and maintenance in 2011. It is also assumed that the average price of the service and maintenance of an elevator is 20% of its NEI price.
SERVICE & MAINTENANCE
Age 1 2 3 4 5 6 7 8 9 10 10+
Percentage of Elevators for Service & Maintenance
100% 100% 100% 95% 95% 90% 90% 85% 85% 80% 50%
Age of Elevators that Underwent S&M in 2011 (% of Total)
20% 15% 15% 10% 10% 10% 5% 5% 4% 4% 2%
Average Price of S&M (as % of NEI Price)
20%
S&M SALES CONTRIBUTION OF 2011 S&M SALES
Based on the assumed age distribution of elevators that underwent service and maintenance in 2011, the future S&M sales contributed by these elevators are computed in the table below.
AGE 2012 2013 2014E 2015F 2016F 2017F 2018F 2019F 2020F
1 40 40 38 38 36 36 34 34 32
2 30 28 28 27 27 25 25 24 15
3 28 28 27 27 25 25 24 15 15
4 20 19 19 18 18 17 11 11 11
5 19 19 18 18 17 11 11 11 11
6 20 19 19 18 11 11 11 11 11
7 9 9 9 6 6 6 6 6 6
8 10 9 6 6 6 6 6 6 6
9 8 5 5 5 5 5 5 5 5
10 5 5 5 5 5 5 5 5 5
10+ 4 4 4 4 4 4 4 4 4
S&M Sales (in millions Php)
193 186 177 170 159 150 140 130 119
TOTAL S&M SALES
Applying the assumptions discussed above, the S&M sales contribution of 2010-2018 NEI sales is presented in the table below.
YEAR NEI SALES 2012 2013 2014E 2015F 2016F 2017F 2018F 2019F 2020F
2011 S&M 160 193 186 177 170 159 150 140 130 119
2010 165 33 33 31 31 30 30 28 28 26
2011 100
20 20 19 19 18 18 17 17
2012 140
28 28 27 27 25 25 24
2013 148
30 30 28 28 27 27
2014 106
21 21 20 20 19
2015 120
24 24 23 23
2016 137
27 27 26
2017 155
31 31
2018 177
35
S&M Sales (in millions Php) 226 239 257 278 285 298 311 328 347
YoY Growth Rate 5.73% 7.42% 8.43% 2.51% 4.48% 4.52% 5.44% 5.74%
REPAIR AND MODERNIZATION SALES ASSUMPTIONS
The first row of the table below indicates the assumed percentage of elevators that undergoes repair and modernization. For example, none of 1- to 2-year old elevators, 10% of 3-year old elevators, 15% of 4-year old elevators, and so on undergo repair and modernization. The second row of the table below indicates the assumed age distribution of the elevators that underwent repair and modernization in 2011. It is also assumed that the average price of the repair and modernization of an elevator is 30% of its NEI price.
REPAIR & MODERNIZATION
Age 1 2 3 4 5 6 7 8 9 10 10+
Percentage of Elevators for Repair & Modernization
0% 0% 10% 15% 20% 25% 25% 30% 35% 35% 50%
Age of Elevators that Underwent R&M in 2011 (% of Total)
0% 0% 5% 6% 7% 10% 12% 13% 15% 16% 16%
Average Price of R&M (as % of NEI Price)
30%

Ateneo de Manila University Student Research | 42
R&M SALES CONTRIBUTION OF 2011 R&M SALES
Based on the assumed age distribution of elevators that underwent repair and modernization in 2011, the future R&M sales contributed by these elevators are computed in the table below.
AGE 2012 2013 2014E 2015F 2016F 2017F 2018F 2019F 2020F
1 - - - - - - - - -
2 - - - - - - - - -
3 10 13 16 16 19 23 23 32 32
4 10 13 13 15 18 18 26 26 26
5 11 11 14 16 16 23 23 23 23
6 13 15 18 18 26 26 26 26 26
7 19 22 22 31 31 31 31 31 31
8 20 20 28 28 28 28 28 28 28
9 19 28 28 28 28 28 28 28 28
10 29 29 29 29 29 29 29 29 29
10+ 21 21 21 21 21 21 21 21 21
R&M Sales (in millions Php)
152 172 188 202 216 226 233 243 243
TOTAL R&M SALES
Applying the assumptions discussed above, the R&M sales contribution of 2010-2017 NEI sales is presented in the table below.
YEAR NEI SALES 2012 2013 2014E 2015F 2016F 2017F 2018F 2019F 2020F
2011 R&M 129 152 172 188 202 216 226 233 243 243
2010 165
5 7 10 12 12 15 17 17
2011 100
3 5 6 8 8 9 11
2012 140
4 6 8 11 11 13
2013 148
4 7 9 11 11
2014 106
3 5 6 8
2015 120
4 5 7
2016 137
4 6
2017 155
5
R&M Sales (in millions Php) 152 177 198 221 245 264 284 307 321
YoY Growth Rate 16.29% 12.42% 11.24% 10.90% 7.76% 7.48% 8.24% 4.47%
APPENDIX D-15. CRITERIA FOR PEERS SELECTION
The initial pool for CIC’s peers is composed of companies in the same industry and geographic region as CIC. This pool is trimmed down based on the Enterprise Value/Sales (EV/S) ratio. This ratio takes into account the profitability, growth, and cost of capital of a company. Companies with EV/S ratio closest to that of CIC are listed down as the peers. The following are the companies that satisfied the above conditions:
COMPANY TICKER
Refrigeration and Electronic Engineering Company REE VN
Singer SINGER.TB
Daikin 6367 JT
Mitsubishi 6503 JT
Toshiba 6502 JP
Hitachi 6501 JT
Source: Bloomberg
APPENDIX D-16. BETA CALCULATION
COMPANY TICKER BETA (LEVERED) D/E TAX RATE (TTM) UNLEVERED BETA
Refrigeration, Electrical, Engineering Corporation REE.VN 1.35 0.09 12.61% 1.25
Singer SINGER.TB 1.16 0.84 15.24% 0.68
Daikin 6367.JP 1.12 0.70 33.16% 0.76
Toshiba 6502.JP 0.99 0.91 40.00% 0.64
Mitsubishi 6503.JP 1.23 0.22 26.79% 1.06
Hitachi 6501.JP 1.16 0.72 27.62% 0.76
Comparables’ Ave. Beta (Unlevered) 0.86
CIC: Debt Php 1.00 bn
CIC: Equity Php 3.81 bn
CIC: D/E 0.26
CIC: Tax Rate 30%
CIC: Beta 1.02
Source: Bloomberg, Team Analysis

Ateneo de Manila University Student Research | 43
APPENDIX D-17. TERMINAL GROWTH RATE CALCULATION
CCAC: CONCEPCION-CARRIER AIR CONDITIONING COMPANY
The terminal growth rate for CCAC is based on the growth rate of mature air conditioning markets. These markets are identified based on their geographic region and penetration rates.
INDUSTRY SALES VALUE
Country Currency 2010 2011 2012 2013 2014 2015 2016 2017 2018
Hong Kong HKD mn 2,744.20 2,828.50 2,927.90 3,039.00 3,195.10 3,248.20 3,312.60 3,382.90 3,450.60
Japan JPY bn 771.10 768.50 755.90 829.10 841.90 839.30 830.50 823.30 818.50
Singapore SGD mn 334.00 351.50 375.70 396.30 418.80 427.70 437.30 447.80 459.10
ANNUAL GROWTH RATES
Country 2011 2012 2013 2014 2015 2016 2017 2018 Average
Hong Kong 3.07% 3.51% 3.79% 5.14% 1.66% 1.98% 2.12% 2.00% 2.91%
Japan (0.34%) (1.64%) 9.68% 1.54% (0.31%) (1.05%) (0.87%) (0.58%) 0.81%
Singapore 5.24% 6.88% 5.48% 5.68% 2.13% 2.24% 2.40% 2.52% 4.07%
Terminal Growth Rate 2.60%
CDI: CONCEPCION DURABLES INC.
The terminal growth rate for CDI is based on the growth rate of mature refrigeration markets. These markets are identified based on their geographic region and penetration rates.
INDUSTRY SALES VALUE
Country Currency 2010 2011 2012 2013 2014 2015 2016 2017 2018
Japan JPY bn 403.30 385.50 360.00 380.90 398.20 408.60 414.20 418.20 421.30
Singapore SGD mn 115.60 120.10 126.80 133.30 140.20 142.20 144.40 147.00 149.80
South Korea KRW bn 1,289.70 1,323.90 1,366.00 1,446.20 1,499.60 1,518.60 1,535.30 1,551.10 1,564.40
ANNUAL GROWTH RATES
Country 2011 2012 2013 2014 2015 2016 2017 2018 Average
Japan (4.41%) (6.61%) 5.81% 4.54% 2.61% 1.37% 0.97% 0.74% 0.63%
Singapore 3.89% 5.58% 5.13% 5.18% 1.43% 1.55% 1.80% 1.90% 3.31%
South Korea 2.65% 3.18% 5.87% 3.69% 1.27% 1.10% 1.03% 0.86% 2.46%
Terminal Growth Rate 2.13%
COPI: CONCEPCION OTIS PHILIPPINES INC.
The terminal growth rate for COPI is based on the growth rate of selected companies in mature markets. The selected companies are Hitachi, Fujitec, and Hyundai.
COMPANY SALES
Company Currency 2010 2011 2012 2013
Hitachi (JPN) JPY mn 5,313,790 5,269,259 5,534,462 5,355,119
Hyundai (KOR) KRW mn 835,400 879,200 915,600 1,064,700
Fujitec (JPN) JPY mn 51,284 52,431 50,817 52,866
ANNUAL GROWTH RATES
Country 2011 2012 2013 Average
Hitachi (0.84%) 5.03% (3.24%) 0.32%
Hyundai 5.24% 4.14% 16.28% 8.56%
Fujitec 2.24% (3.08%) 4.03% 1.06%
Terminal Growth Rate 3.31%
CMIP: CONCEPCION MIDEA INC. PHILIPPINES
The terminal growth rate for CMIP is based on the growth rate of mature consumer appliance markets. These markets are identified based on their geographic region and penetration rates.
INDUSTRY SALES VALUE
Country Currency 2010 2011 2012 2013 2014 2015 2016 2017 2018
Hong Kong HKD mn 8,267.20 8,551.90 8,869.50 9,182.40 9,569.60 9,635.60 9,714.30 9,799.80 9,879.50
Singapore SGD mn 768.90 816.90 870.80 919.90 971.10 989.50 1,008.60 1,028.20 1,048.70
South Korea KRW bn 6,836.30 7,120.70 7,429.90 8,209.60 8,595.70 8,722.20 8,826.20 8,907.60 8,976.80
ANNUAL GROWTH RATES
Country 2011 2012 2013 2014 2015 2016 2017 2018 Average
Hong Kong 3.44% 3.71% 3.53% 4.22% 0.69% 0.82% 0.88% 0.81% 2.26%
Singapore 6.24% 6.60% 5.64% 5.57% 1.89% 1.93% 1.94% 1.99% 3.98%
South Korea 4.16% 4.34% 10.49% 4.70% 1.47% 1.19% 0.92% 0.78% 3.51%
Terminal Growth Rate 3.25%

Ateneo de Manila University Student Research | 44
APPENDIX D-18. COMMODITY PRICE ADJUSTMENT
The three major commodities used by CIC are copper, aluminum, and steel. As commodities, they are susceptible to price volatilities. To take this into account, the COGS are adjusted based on price commodity forecasts from World Bank. The iron commodity is used to forecast the movement of steel as the latter is an alloy, which constitutes primarily of iron. The breakdown of the raw materials for air conditioners and refrigerators is given in the table below:
AIR CONDITIONERS % OF PURCHASES REFRIGERATION % OF PURCHASES
Compressors 35% Steel 28%
Copper 17% Plastic 24%
Plastic 18% Compressors 20%
Aluminum 5% Foam Chemicals 13%
Steel Plates 5% Aluminum 5%
Fan Motors 8% Copper 4%
Others 12% Others 6%
The following tables show the detailed computation for CCAC’s and CDI’s COGS.
CCAC: CONCEPCION-CARRIER AIR CONDITIONING
IN PHP MN 2014E 2015F 2016F 2017F 2018F 2019F 2020F
Initial COGS based on 60% 3,551 3,934 4,337 4,765 5,222 5,710 6,232
Aluminum 178 197 217 238 261 286 312
Compressors 1,243 1,377 1,518 1,668 1,828 1,999 2,181
Steel Plates 178 197 217 238 261 286 312
Fan Motors 284 315 347 381 418 457 499
Copper Portion 604 669 737 810 888 971 1,059
New COGS
Aluminum 180 202 219 241 264 289 315
Compressors 1,265 1,430 1,541 1,701 1,854 2,027 2,222
Steel Plates 181 207 221 245 266 291 320
Fan Motors 279 322 350 386 421 461 505
Copper Portion 616 702 751 833 904 988 1,087
Adjusted COGS 2,521 2,862 3,082 3,406 3,710 4,055 4,449
Complete COGS 3,587 4,042 4,383 4,835 5,276 5,768 6,319
COGS Margin 60.60% 61.65% 60.64% 60.88% 60.62% 60.61% 60.83%
CDI: CONCEPCION DURABLES INC.
IN PHP MN 2014E 2015F 2016F 2017F 2018F 2019F 2020F
Initial COGS based on 80% 2,049 2,276 2,517 2,775 3,052 3,350 3,671
Aluminum portion 102 114 126 139 153 167 184
Steel 574 637 705 777 855 938 1,028
Compressors 410 455 503 555 610 670 734
Copper Portion 82 91 101 111 122 134 147
New COGS
Aluminum portion 104 117 127 140 154 169 186
Steel 585 669 718 799 870 955 1,055
Compressors 417 473 511 566 619 680 748
Copper Portion 77 91 101 111 122 134 147
Adjusted COGS 1,184 1,349 1,457 1,616 1,766 1,938 2,135
Complete COGS 2,065 2,328 2,539 2,809 3,078 3,378 3,713
COGS Margin 80.62% 81.82% 80.71% 80.98% 80.68% 80.67% 80.93%
-10.00%
-5.00%
0.00%
5.00%
10.00%
2014F 2015F 2016F 2017F 2018F 2019F 2020F
Commodity Price Growth Rates
Aluminum Copper Iron

Ateneo de Manila University Student Research | 45
APPENDIX D-19. MOVING WACC
CIC currently has a short-term debt of Php 1 bn, which it plans to roll over. Since this debt has a short maturity, CIC is exposed to reinvestment rate risk. To take this risk into account, we adjusted the WACC according to interest rate forecasts from Bloomberg. The interest rate forecast is based on the mean of the projections of different analysts from Bloomberg. The year-over-year change in basis points is applied to CIC’s current before-tax cost of debt of 2.625% to arrive at the cost of debt forecast. As CCAC’s D/E ratio is different from that of CDI, COPI, and CMIP, CCAC’s WACC is adjusted to incorporate this difference.
2014E 2015F 2016F 2017F 2018F 2019F 2020F TERMINAL
Risk Free Rate 4.75% 4.75% 4.75% 4.75% 4.75% 4.75% 4.75% 4.75%
Market Risk Premium 5.56% 5.56% 5.56% 5.56% 5.56% 5.56% 5.56% 5.56%
Beta 1.02 1.02 1.02 1.02 1.02 1.02 1.02 1.02
CCAC
WACC COMPUTATION 2014E 2015F 2016F 2017F 2018F 2019F 2020F TERMINAL
Weight of Equity 90.00% 90.00% 90.00% 90.00% 90.00% 90.00% 90.00% 90.00%
Weight of Debt 10.00% 10.00% 10.00% 10.00% 10.00% 10.00% 10.00% 10.00%
Beta 1.02 1.02 1.02 1.02 1.02 1.02 1.02 1.02
Expected Return on Equity 10.40% 10.40% 10.40% 10.40% 10.40% 10.40% 10.40% 10.40%
Expected Return on Debt 2.63% 2.83% 3.36% 3.60% 3.92% 3.28% 3.07% 3.30%
After Tax Cost of Debt 1.84% 1.98% 2.35% 2.52% 2.74% 2.30% 2.15% 2.31%
WACC 9.54% 9.56% 9.59% 9.61% 9.63% 9.59% 9.57% 9.59%
2014E 2015F 2016F 2017F 2018F 2019F 2020F TERMINAL
Risk Free Rate 4.75% 4.75% 4.75% 4.75% 4.75% 4.75% 4.75% 4.75%
Market Risk Premium 5.56% 5.56% 5.56% 5.56% 5.56% 5.56% 5.56% 5.56%
Beta 1.02 1.02 1.02 1.02 1.02 1.02 1.02 1.02
CDI/COPI/CMIP
WACC COMPUTATION 2014E 2015F 2016F 2017F 2018F 2019F 2020F TERMINAL
Weight of Equity 100.00% 100.00% 100.00% 100.00% 100.00% 100.00% 100.00% 100.00%
Weight of Debt 0.00% 0.00% 0.00% 0.00% 0.00% 0.00% 0.00% 0.00%
Beta 1.02 1.02 1.02 1.02 1.02 1.02 1.02 1.02
Expected Return on Equity 10.40% 10.40% 10.40% 10.40% 10.40% 10.40% 10.40% 10.40%
Expected Return on Debt 2.63% 2.83% 3.36% 3.60% 3.92% 3.28% 3.07% 3.30%
After Tax Cost of Debt 1.84% 1.98% 2.35% 2.52% 2.74% 2.30% 2.15% 2.31%
WACC 10.40% 10.40% 10.40% 10.40% 10.40% 10.40% 10.40% 10.40%
APPENDIX D-20. PEER GROUP OF CMIP
In forecasting CMIP’s profit margin at the terminal phase, we compared it with other mature companies in the consumer appliance industry.
PEER TICKER EBITDA
MARGIN
NET PROFIT
MARGIN
Midea Group Co Ltd-A 000333 CH 8.30% 7.40%
Panasonic Corp 6752 JP 5.10% 2.30%
Qingdao Haier Co Ltd-A 600690 CH 7.40% 7.00%
Elec-Tech International Co-A 002005 CH 7.00% 3.10%
Hangzhou Robam Appliances-A 002508 CH 16.00% 14.50%
Hisense Kelon Elec Hld-H 921 HK 0.70% 1.60%
Joyoung Co Ltd -A 002242 CH 14.50% 10.40%
Wuxi Little Swan Co-B 200418 CH 7.40% 7.10%
Guangdong Xinbao Electrica-A 002705 CH 5.10% 4.20%
Rinnai Corp 5947 JP 9.00% 5.80%
Shenzhen Fenda Technology -A 002681 CH 14.60% 13.00%
Average 8.65% 6.95%
The table above shows that consumer appliance companies have an average EBITDA margin of 8.65%. Taking into consideration the average expenses for depreciation, amortization, financing costs, and taxes, we estimate CMIP’s profit margin to be around 7% during the terminal phase.

Ateneo de Manila University Student Research | 46
Appendix E: Financial Analysis
APPENDIX E-1. CIC KEY RATIOS
CIC 2011 2012 2013 2014E 2015F 2016F 2017F 2018F 2019F 2020F
Liquidity Ratios
Current Ratio 2.60 1.76 2.35 1.78 1.97 2.19 2.41 2.62 2.83 3.04
Quick Ratio 1.94 1.35 1.76 1.39 1.56 1.77 1.97 2.18 2.37 2.57
Cash Ratio 0.66 0.51 0.76 0.62 0.77 0.94 1.12 1.30 1.48 1.66
Activity Ratios
Receivables Turnover
3.78 3.75 4.00 3.86 3.85 3.84 3.84 3.83 3.83
Inventory Turnover
5.45 5.01 5.23 5.47 5.37 5.41 5.39 5.39 5.39
Payables Turnover
3.16 2.89 3.30 3.26 3.21 3.23 3.22 3.22 3.22
Days of Sales Outstanding
96.45 97.39 91.25 94.62 94.87 95.03 95.15 95.26 95.37
Days of Inventory on Hand
67.02 72.89 69.80 66.75 67.91 67.42 67.76 67.71 67.67
Number of Days of Payables
115.49 126.23 110.73 111.91 113.81 112.95 113.44 113.33 113.23
Cash Conversion Cycle
47.98 44.04 50.32 49.45 48.97 49.50 49.47 49.63 49.81
Total Asset Turnover
1.67 1.55 1.45 1.29 1.23 1.19 1.14 1.10 1.06
Fixed Asset Turnover
40.92 42.92 49.26 52.28 55.87 62.72 70.27 78.62 83.13
Working Capital Turnover
3.56 3.33 3.43 3.43 2.87 2.47 2.18 1.96 1.79
Profitability Ratios
Gross Profit Margin 33.32% 32.00% 32.42% 33.61% 32.55% 33.53% 33.27% 33.52% 33.51% 33.27%
EBITDA Margin 18.44% 17.70% 18.30% 18.87% 18.97% 19.08% 19.71%
EBIT Margin 16.56% 14.10% 16.66% 17.81% 17.10% 17.75% 18.37% 18.52% 18.67% 19.33%
Net Income Margin 11.61% 9.92% 11.56% 12.26% 11.76% 12.21% 12.65% 12.75% 12.90% 13.39%
Pretax Margin 16.56% 14.08% 16.53% 17.51% 16.81% 17.44% 18.07% 18.21% 18.44% 19.13%
Return on Assets
17.73% 19.26% 20.20% 18.88% 18.26% 17.70% 16.76% 16.07% 15.82%
Return on Equity
33.63% 33.36% 30.34% 27.20% 25.68% 24.34% 22.68% 21.42% 20.82%
Solvency Ratios
Debt-to-Equity Ratio 0.00 0.13 0.06 0.26 0.22 0.18 0.15 0.13 0.11 0.09
Total Debt Ratio 0.00 0.06 0.03 0.14 0.12 0.11 0.09 0.08 0.07 0.06
Interest Coverage 84,408.18 703.16 127.01 59.86 59.12 56.98 60.51 61.43 81.01 97.90
Financial Leverage 1.99 2.15 1.70 1.85 1.75 1.66 1.59 1.53 1.48 1.44
Cash Flow Ratios
Cash Flow-to-Revenue
0.11 0.11 0.11 0.12 0.12 0.12 0.12
Cash Return-on-Assets
0.16 0.14 0.14 0.14 0.14 0.13 0.13
Cash Return-on-Equity
0.28 0.25 0.24 0.23 0.21 0.20 0.19
Cash-to-Income
0.61 0.64 0.63 0.64 0.64 0.64 0.65
Cash Flow per Share
2.83 3.15 3.57 4.12 4.54 5.03 5.71
DuPont Analysis
Tax Burden 0.70 0.69 0.69 0.67 0.70 0.70 0.70 0.70 0.70 0.70
Interest Burden 1.00 1.00 0.99 0.98 0.98 0.98 0.98 0.98 0.99 0.99
EBIT Margin 16.56% 14.10% 16.66% 17.81% 17.10% 17.75% 18.37% 18.52% 18.67% 19.33%
Asset Turnover
1.67 1.55 1.45 1.29 1.23 1.19 1.14 1.10 1.06
Leverage
2.08 1.89 1.78 1.80 1.70 1.62 1.56 1.51 1.46
Return on Equity
33.63% 33.36% 30.34% 27.20% 25.68% 24.34% 22.68% 21.42% 20.82%

Ateneo de Manila University Student Research | 47
APPENDIX E-2. CCAC KEY RATIOS
CCAC 2011 2012 2013 2014E 2015F 2016F 2017F 2018F 2019F 2020F
Liquidity Ratios
Current Ratio 2.75 2.42 2.45 1.60 1.85 2.14 2.41 2.70 2.98 3.23
Quick Ratio 2.07 1.95 1.89 1.29 1.52 1.80 2.06 2.33 2.60 2.84
Cash Ratio 0.90 0.94 0.96 0.64 0.85 1.09 1.32 1.56 1.80 2.02
Activity Ratios
Receivables Turnover
4.17 4.48 4.60 4.26 4.25 4.25 4.24 4.24 4.23
Inventory Turnover
4.98 5.30 5.29 5.53 5.43 5.47 5.44 5.45 5.45
Payables Turnover
3.34 3.23 3.41 3.52 3.45 3.48 3.46 3.47 3.47
Days of Sales Outstanding
87.46 81.39 79.31 85.62 85.82 85.96 86.06 86.15 86.23
Days of Inventory on Hand
73.24 68.89 69.03 66.06 67.27 66.73 67.08 67.01 66.95
Number of Days of Payables
109.19 113.04 107.16 103.81 105.72 104.86 105.40 105.31 105.21
Cash Conversion Cycle
51.50 37.25 41.18 47.88 47.37 47.82 47.74 47.86 47.97
Total Asset Turnover
1.62 1.63 1.44 1.21 1.15 1.09 1.04 1.00 0.96
Fixed Asset Turnover
85.16 91.93 85.32 84.74 86.70 100.06 115.48 133.35 134.26
Working Capital Turnover
2.90 3.03 3.83 3.88 2.96 2.41 2.05 1.81 1.63
Profitability Ratios
Gross Profit Margin 41.47% 39.22% 38.01% 39.40% 38.35% 39.36% 39.12% 39.38% 39.39% 39.17%
EBITDA Margin 20.20% 22.53% 22.64% 21.63% 22.61% 22.35% 22.59% 22.58% 22.35%
EBIT Margin 23.96% 19.73% 22.26% 22.40% 21.35% 22.36% 22.12% 22.38% 22.39% 22.17%
Net Income Margin 16.90% 13.59% 15.31% 15.37% 14.64% 15.33% 15.17% 15.35% 15.43% 15.31%
Pretax Margin 23.96% 19.73% 22.26% 21.95% 20.92% 21.89% 21.67% 21.93% 22.04% 21.87%
Return on Assets
21.96% 25.03% 22.07% 17.75% 17.61% 16.57% 16.02% 15.43% 14.73%
Return on Equity
34.98% 41.59% 39.72% 32.36% 29.78% 26.38% 24.34% 22.56% 20.87%
Solvency Ratios
Debt-to-Equity Ratio 0.38 0.30 0.24 0.20 0.17 0.14 0.12
Total Debt Ratio 0.20 0.17 0.15 0.13 0.11 0.10 0.09
Interest Coverage 50.50 49.49 48.09 48.79 49.68 64.95 75.00
Financial Leverage 1.51 1.66 1.66 1.90 1.76 1.64 1.56 1.49 1.44 1.40
Cash Flow Ratios
Cash Flow-to-Revenue
0.11 0.14 0.14 0.14 0.14 0.14 0.14
Cash Return-on-Assets
0.16 0.17 0.16 0.16 0.15 0.14 0.14
Cash Return-on-Equity
0.28 0.30 0.28 0.25 0.23 0.21 0.20
Cash-to-Income
0.49 0.65 0.64 0.65 0.65 0.65 0.65
Cash Flow per Share
1.90 2.66 3.05 3.35 3.71 4.06 4.39
Dividend Coverage Ratio
2.64 3.31 3.60 3.42 3.48 3.44 3.38
DuPont Analysis
Tax Burden 0.70 0.70 0.70 0.70 0.70 0.70 0.70 0.70 0.70 0.70
Interest Burden 1.00 1.00 1.00 0.98 0.98 0.98 0.98 0.98 0.98 0.99
EBIT Margin 23.96% 19.73% 22.26% 22.40% 21.35% 22.36% 22.12% 22.38% 22.39% 22.17%
Asset Turnover - 1.62 1.63 1.44 1.21 1.15 1.09 1.04 1.00 0.96
Leverage - 1.59 1.66 1.80 1.82 1.69 1.59 1.52 1.46 1.42
Return on Equity
34.98% 41.59% 39.72% 32.36% 29.78% 26.38% 24.34% 22.56% 20.87%

Ateneo de Manila University Student Research | 48
APPENDIX E-3. CDI KEY RATIOS
CDI 2011 2012 2013 2014E 2015F 2016F 2017F 2018F 2019F 2020F
Liquidity Ratios
Current Ratio 2.32 1.08 2.15 2.11 2.10 2.13 2.19 2.25 2.29 2.41
Quick Ratio 1.69 0.73 1.39 1.42 1.41 1.44 1.50 1.55 1.60 1.72
Cash Ratio 0.23 0.06 0.13 0.22 0.23 0.24 0.31 0.36 0.41 0.53
Activity Ratios
Receivables Turnover
3.18 2.97 3.22 3.20 3.19 3.19 3.19 3.18 3.18
Inventory Turnover
6.32 4.74 4.97 5.16 5.08 5.11 5.09 5.09 5.10
Payables Turnover
2.92 2.81 3.74 3.22 3.17 3.20 3.18 3.18 3.19
Days of Sales Outstanding
114.66 122.89 113.38 114.02 114.25 114.42 114.56 114.66 114.76
Days of Inventory on Hand
57.76 76.96 73.39 70.76 71.88 71.40 71.72 71.67 71.61
Number of Days of Payables
124.87 129.94 97.59 113.22 115.00 114.24 114.76 114.67 114.58
Cash Conversion Cycle
47.55 69.92 89.18 71.56 71.13 71.58 71.52 71.66 71.79
Total Asset Turnover
1.79 1.63 1.71 1.68 1.68 1.66 1.62 1.60 1.55
Fixed Asset Turnover
19.94 19.21 23.35 25.93 28.68 31.62 34.78 38.17 41.83
Working Capital Turnover
6.69 5.87 3.50 3.44 3.40 3.27 3.11 2.99 2.80
Profitability Ratios
Gross Profit Margin 15.93% 17.39% 19.47% 19.38% 18.18% 19.29% 19.02% 19.32% 19.33% 19.07%
EBITDA Margin 4.24% 5.47% 8.01% 7.85% 7.72% 9.74% 9.63% 9.54% 12.31%
EBIT Margin 0.78% 2.71% 3.70% 6.43% 6.43% 6.43% 8.57% 8.57% 8.57% 11.43%
Net Income Margin 0.59% 1.86% 2.29% 4.50% 4.50% 4.50% 6.00% 6.00% 6.00% 8.00%
Pretax Margin 0.78% 2.65% 3.26% 6.43% 6.43% 6.43% 8.57% 8.57% 8.57% 11.43%
Return on Assets
3.27% 3.93% 7.68% 7.55% 7.55% 9.95% 9.74% 9.58% 12.37%
Return on Equity
21.31% 10.98% 13.76% 13.71% 13.72% 17.84% 17.18% 16.67% 21.04%
Solvency Ratios
Debt-to-Equity Ratio 0.00 1.30 0.22 0.00 0.00 0.00 0.00 0.00 0.00 0.00
Total Debt Ratio 0.00 0.20 0.12 0.00 0.00 0.00 0.00 0.00 0.00 0.00
Interest Coverage 1,273.73 44.70 8.50
Financial Leverage 6.54 6.51 1.77 1.81 1.82 1.81 1.78 1.75 1.73 1.68
Cash Flow Ratios
Cash Flow-to-Revenue
0.04 0.03 0.05 0.05 0.05 0.07
Cash Return-on-Assets
0.06 0.06 0.08 0.08 0.08 0.10
Cash Return-on-Equity
0.11 0.10 0.15 0.14 0.13 0.18
Cash-to-Income
0.57 0.52 0.58 0.56 0.56 0.59
Cash Flow per Share
0.30 0.31 0.50 0.54 0.59 0.92
Dividend Coverage Ratio
2.99 2.73 4.03 2.94 2.93 4.13
DuPont Analysis
Tax Burden 0.60 0.67 0.65 0.70 0.70 0.70 0.70 0.70 0.70 0.70
Interest Burden 1.00 0.98 0.88 1.00 1.00 1.00 1.00 1.00 1.00 1.00
EBIT Margin 0.78% 2.71% 3.70% 6.43% 6.43% 6.43% 8.57% 8.57% 8.57% 11.43%
Asset Turnover
1.79 1.63 1.71 1.68 1.68 1.66 1.62 1.60 1.55
Leverage
6.52 2.80 1.79 1.82 1.82 1.79 1.76 1.74 1.70
Return on Equity
21.31% 10.98% 13.76% 13.71% 13.72% 17.84% 17.18% 16.67% 21.04%

Ateneo de Manila University Student Research | 49
APPENDIX E-4. COPI KEY RATIOS
COPI 2014E 2015F 2016F 2017F 2018F 2019F 2020F
Liquidity Ratios
Current Ratio 2.31 3.17 3.21 3.29 3.43 3.53 3.68
Quick Ratio 2.02 2.87 2.92 3.00 3.14 3.24 3.39
Cash Ratio 1.36 2.22 2.27 2.35 2.49 2.59 2.74
Activity Ratios
Receivables Turnover 2.76 3.20 3.19 3.19 3.19 3.18 3.18
Inventory Turnover 7.72 5.16 5.08 5.11 5.09 5.09 5.10
Payables Turnover 1.20 3.22 3.17 3.20 3.18 3.18 3.19
Days of Sales Outstanding 132.18 114.02 114.25 114.42 114.56 114.66 114.76
Days of Inventory on Hand 47.30 70.76 71.88 71.40 71.72 71.67 71.61
Number of Days of Payables 305.35 113.22 115.00 114.24 114.76 114.67 114.58
Cash Conversion Cycle -125.88 71.56 71.13 71.58 71.52 71.66 71.79
Total Asset Turnover 0.68 1.68 1.68 1.66 1.62 1.60 1.55
Working Capital Turnover 1.08 3.44 3.40 3.27 3.11 2.99 2.80
Profitability Ratios
Gross Profit Margin 60.00% 60.00% 60.00% 60.00% 60.00% 60.00% 60.00%
EBIT Margin 23.70% 23.58% 23.36% 27.78% 27.42% 31.55% 31.00%
Net Income Margin 16.59% 16.51% 16.35% 19.45% 19.20% 22.08% 21.70%
Return on Assets 11.24% 11.73% 11.29% 12.98% 12.36% 13.76% 12.97%
Return on Equity 17.99% 17.08% 16.30% 18.47% 17.34% 19.03% 17.68%
Solvency Ratios
Financial Leverage 1.46 1.45 1.44 1.41 1.39 1.37 1.36
Cash Flow Ratios
Cash Flow-to-Revenue 0.16 0.17 0.17 0.20 0.19 0.22 0.22
Cash Return-on-Assets 0.11 0.12 0.11 0.13 0.12 0.14 0.13
Cash Return-on-Equity 0.17 0.17 0.17 0.19 0.18 0.19 0.18
Cash-to-Income 0.67 0.71 0.71 0.71 0.71 0.71 0.71
Cash Flow per Share 0.90 0.30 0.31 0.50 0.54 0.59 0.92
Dividend Coverage Ratio
3.74 3.64 4.35 3.61 4.23 3.58
DuPont Analysis
Tax Burden 0.70 0.70 0.70 0.70 0.70 0.70 0.70
Interest Burden 1.00 1.00 1.00 1.00 1.00 1.00 1.00
EBIT Margin 23.70% 23.58% 23.36% 27.78% 27.42% 31.55% 31.00%
Asset Turnover 0.68 0.71 0.69 0.67 0.64 0.62 0.60
Leverage 1.60 1.46 1.44 1.42 1.40 1.38 1.36
Return on Equity 17.99% 17.08% 16.30% 18.47% 17.34% 19.03% 17.68%
APPENDIX E-5. KEY RATIOS OF PEERS
REE SINGER DAIKIN MITSUBISHI TOSHIBA HITACHI
Liquidity Ratios
Current Ratio 1.97 2.28 2.04 1.58 1.22 1.41
Quick Ratio 0.24 1.18 0.93 0.57 0.88 3.34
Activity Ratios
Days of Sales Outstanding 77.86 1.80 56.70 88.13 80.79 109.19
Days of Inventory on Hand 161.90 54.19 90.31 74.71 72.83 73.29
Number of Days of Payables 33.75 32.09 42.34 88.04 91.14 66.89
Cash Conversion Cycle 206.02 23.90 104.67 74.80 63.48 115.59
Profitability Ratios
Gross Profit Margin 30.33% 39.03% 35.46% 28.97% 24.07% 27.26%
EBITDA Margin 28.63% (16.73%) 16.14% 9.70% 7.44% 10.45%
Net Income Margin 37.22% 7.44% 8.25% 5.16% 1.29% 2.65%
DuPont Analysis
Tax Burden 84.29% 84.72% 60.94% 65.16% 30.64% 50.42%
Interest Burden 1.95 (0.81) 1.01 1.13 0.65 1.12
EBIT Margin 19.50% (16.19%) 9.68% 6.57% 4.57% 5.95%
Asset Turnover 0.35 0.80 0.91 1.18 1.04 0.88
Leverage 1.45 2.27 2.39 2.30 5.13 4.13
Return on Equity 16.18% 21.11% 13.19% 13.29% 6.69% 11.42%

Ateneo de Manila University Student Research | 50
Appendix F: Corporate Governance
APPENDIX F-1. SUMMARY OF CORPORATE GOVERNANCE AND SOCIAL RESPONSIBILITY
CIC believes in conducting its business and operations in accordance with the principles and best practices of good corporate governance. It aims to engender a good reputation in the market place, leading to long-term sustainability and success. Prior to public listing, the Board of Directors adopted a Corporate Governance Manual that integrates the established governance policies and practices, conforming to SEC Circular 6 (2009), to be applied to the entire company, its subsidiaries, and affiliate companies. Our analysis of CIC’s quality of governance focuses on the following facets:
• Board —Established audit, risk, governance, and nomination and election committees
• Shareholder Rights — One-share-one-vote policy; mechanisms in place that protect minority shareholders against actions of controlling shareholders such as the right to nominate candidates for the board of directors, pre-emptive right, right of inspection, appraisal rights, and a right to dividends
• Audit and Oversight — Separate internal audit function, overseen by board; comprehensive enterprise wide compliance program that is annually reviewed; designated Chief Governance Officer
• Compensation — Discloses compensation policies and beneficial ownership of management
CIC’s efforts for social responsibility have mainly been through its subsidiaries CCAC andd CDI, holding an environmental advocacy. CCAC contributed to the formulation of the Chemical Control Order for the phase-out, recycling, and disposal of CFC’s in the Philippines. Also, CCAC has been actively participating in the Philippine Ozone Desk of the Environmental Management Bureau, Department of Environment and Natural Resources, and the World Bank’s Environment Department. With its Condura brand, CIC has been organizing a marathon for charity since 2008. In 2013, the Condura Skyway Marathon is not only for the benefit of mangroves in Zamboanga de Sibugay but also for other charities. Other initiatives include “Pearl Project” last January 2013 to help underprivileged children with education, Red Cross Blood-letting Drive, Tree Planting in the Municipality of Muntinlupa, and Air Conditioning Unit Donations to the CRIBS Foundation.

Ateneo de Manila University Student Research | 51
APPENDIX F-2. BOARD OF DIRECTORS
DIRECTOR POSITION AFFILIATIONS
Raul Joseph A. Concepcion Chairman of the Board Chief Executive Officer
• President of CCAC and of Concepcion Industries, Inc. (CII)
• Chairman Emeritus of the Philippine Appliance Industry Association (PAIA)
Renna C. Hechanova-Angeles Vice Chairman and Treasurer • Vice Chairman and Corporate Secretary of CDI
• Director of CCAC
• Corporate Secretary of Contel Communications
• Director of the joint venture company between Ayala Land Inc., and Concepcion Industries, Inc.
• Corporate Secretary of Republic Commodities Corporation (RCC)
• Executive Vice President and Corporate Secretary of CII
• Corporate Secretary of Hy-Land
Raul Anthony A. Concepcion Director of the Board • President and Chief Operations Officer of Contel Communications
• Vice President of the joint venture company between Ayala Land, Inc. and CII
• President and Chief Operations Officer of CDI
• Founder and Chief Event Officer of Condura Run
• Finalist in the Ernst and Young Entrepreneur of the Year Awards in 2011
• Business Excellence Awardee
Jose Ma. A. Concepcion III Director of the Board • President and CEO of RFM Corporation
• Chairman of the Board of Directors of RFM Unilever Ice Cream, Inc.
• Co-Chairman of the Agri-Business and Food Committee of PCCI
• Member of Philippine Association of Flour Millers (PAFMIL)
• Member of Philippine Chamber of Food Manufacturers, Inc. (PCFM)
• Member of Makati Business Club
• Member of the Management Association of the Philippines (MAP)
• Active member of the Rotary Club of Makati Central
• Vice Chairman and Trustee of RFM Foundation, Inc.
• Director of the Laura Vicuna Foundation for Street Children
• Vice Chairman of the Micro Small and Medium Enterprise Development Council (MSMED)
Ma. Victoria Herminia C. Young Director of the Board • Director, Vice President and General Manager of the White King Division of RFM Corporation
• Director and General Manager of Interbank Commissary Corporation
• President of RFM Foundation Inc.
• Trustee of Soul Mission Organization
• Trustee of Ronald McDonald House of Charities
• Director of the Assumption Alumnae Association
Raissa C. Hechanova-Posadas Director of the Board • Director of RFM Foundation Inc.
• Advisor to the Board of Directors of BDO Private Bank
• Member of the Board of Trustees of Knowledge Channel Foundation, Inc.
• Board of Trustee of Nth Millennium Foundation
• Managing Director of Citigroup
Cesar A. Buenaventura Independent Director • Vice Chairman of the Board of Directors of the DMCI Holdings
• Vice Chairman of the Board of Directors of AG&P Company of Manila and Montecito Properties, Inc.
• Director of Semirara Coal Company
• Director of iPeople Inc
• Director of Petronenergy Resources Corp.
• Director of Pilipinas Shell Petroleum Corporation
• First Filipino CEO and Chairman of the Shell Group of Companies
• Member of the Board of Regents of the University of the Philippines
• Member of the Board of Trustees of the Asian Institute of Management
• President of the Benigno Aquino S. Foundation
Melito S. Salazar, Jr. Independent Director • Chairman of the Incite.Gov
• Director of the University of St. La Salle Bacolod
• Director of the Chamber of Commerce of the Philippine Islands
• Chairman and President of Quickminds Corporation
• Independent Director of Frontier Oil Corporation
• Vice Chairman and Independent Director of PBVB Card Co.
• Chairman and Independent Director of Inter Asia Development Bank
• Vice President of Manila Bulletin Publishing
• Independent Director of Phils. First Insurance Corporation
• Previously served as Governor of the Board of Investments from 1988 to 1995
Source: Company Data

Ateneo de Manila University Student Research | 52
APPENDIX F-3. SENIOR MANAGEMENT
DIRECTOR POSITION AFFILIATIONS
Raul Anthony A. Concepcion President, CDI • President and Chief Operations Officer of Contel Communications
• Vice President of the joint venture company between Ayala Land, Inc. and Concepcion Industries, Inc. (CII)
• President and Chief Operations Officer of CDI
• Founder and Chief Event Officer of Condura Run
• Finalist in the Ernst and Young Entrepreneur of the Year Awards in 2011
• Business Excellence Awardee
Rafael C. Hechanova, Jr. Vice President, Business Development and Marketing, CIC and CCAC
• Director of Concepcion – Carrier Realty Holdings Inc.
• Director of Hy-land
• Served as Director of the Pacific Basin Development Company in Vancouver, Canada
• Director of CAC from 1998 to 2013
• Director of CCAC from 2006 to 2009
Ma. Victoria A. Betita Chief Finance and Information Officer
• Finance director and country controller for Asea Brown Boveri Group from 1996 to 2001
• Chief financial office of CCAC and Treasurer and CFO of Carrier subsidiaries from 2001 to 2005
Rajan Komarasu Director, Business Solutions Group, CCAC
• Chief Financial Officer of CCAC from 2007 to 2011
• Asia Director of UTC for Shanghai
• Certified Public Accountant in Singapore
Harold Thomas Perkinar, Jr. Director, Consumer Solutions Group, CCAC
• Worked as Product Manager at Akzo Nobel Car Refinishes and Akzo Nobel Automotive and Aerospace Coatings in Asia from 2002 to 2012
Alexander T. Villanueva Director, Manufacturing and Supply Chain Management, CCAC
• Served as the quality director of CCAC from 2006 to 2009
• Worked as Head of Quality at Ford Motor Company and Nissan Motor Company
Source: Company Data

Disclosures: Ownership and material conflicts of interest: The author(s), or a member of their household, of this report does not hold a financial interest in the securities of this company. The author(s), or a member of their household, of this report does not know of the existence of any conflicts of interest that might bias the content or publication of this report. Receipt of compensation: Compensation of the author(s) of this report is not based on investment banking revenue. Position as a officer or director: The author(s), or a member of their household, does not serve as an officer, director or advisory board member of the subject company. Market making: The author(s) does not act as a market maker in the subject company’s securities. Disclaimer: The information set forth herein has been obtained or derived from sources generally available to the public and believed by the author(s) to be reliable, but the author(s) does not make any representation or warranty, express or implied, as to its accuracy or completeness. The information is not intended to be used as the basis of any investment decisions by any person or entity. This information does not constitute investment advice, nor is it an offer or a solicitation of an offer to buy or sell any security. This report should not be considered to be a recommendation by any individual affiliated with, CFA Society Philippines, CFA Institute or the CFA Institute Research Challenge with regard to this company’s stock.
CFA Institute Research Challenge