cfd analysis of pelton runner
TRANSCRIPT

8/10/2019 CFD Analysis of Pelton Runner
http://slidepdf.com/reader/full/cfd-analysis-of-pelton-runner 1/6
International Journal of Scientific and Research Publications, Volume 4, Issue 8, August 2014 1ISSN 2250-3153
www.ijsrp.org
CFD Analysis of Pelton Runner Amod Panthee *, Hari Prasad Neopane **, Bhola Thapa **
* Turbine Testing Lab, Department of Mechanical Engineering, School of Engineering, Kathmandu University, Dhulikhel, Nepal** Department of Mechanical Engineering, School of Engineering, Kathmandu University, Dhulikhel, Nepal
Abstract - This paper presents Computational Fluid Dynamics (CFD) analysis of Pelton turbine of Khimti Hydropower in Nepal. The purpose of CFD analysis is to determine torque generated by the turbine and pressure distributions in bucket for further work onfatigue analysis. The CFD analysis is carried out on model size Pelton runner reduced at 1:3.5 scale to minimize computational costand time. The operating conditions for model size runner is selected in accordance with IEC 60193 and IEC 1116. The paper describesthe methods used for CFD analysis using ANSYS CFX software. 3 buckets are used to predict the flow behavior of complete Peltonturbine. k-ε and SST turbulence model with interphase transfer method as free surface and mixture model is compared in the paper.The pressure distribution is found maximum at bucket tip and runner Pitch Circle Diameter (PCD). The torque generated by themiddle bucket is replicated over time to determine total torque generated by Pelton turbine.
I ndex T erms - Pelton turbine, Computational Fluid Dynamics (CFD), Similitude, Turbulence Model, Torque
I. I NTRODUCTION
omputational Fluid Dynamics (CFD), is a branch of fluid dynamics which uses numerical methods and algorithms to solve fluidflow problems. Reduction of time and cost to predict the model behavior in real environment is key advantage of CFD analysis.
However, the CFD analysis results should be analysed and validated before the model is accepted [1].ANSYS CFX and ANSYS Fluent are the commercial CFD codes available. The main difference between these is the way solvers
integrate the flow equations and solution strategies. CFX uses finite volume elements to discretize the domain. Contrarily, Fluentutilizes finite volumes. They are both control volume based solvers, which ensures conservation of flow quantities. The CFD analysisof Pelton turbine in the paper is carried out using ANSYS CFX [2].
The Pelton turbine is a good choice in situation where the volume flow is small relatively to head. The paper describes the CFDanalysis of scaled Pelton turbine of Khimti Hydropower in Nepal. The purpose of CFD analysis of model Pelton turbine is todetermine the pressure distribution in the Pelton bucket which shall be used for fatigue analysis of Pelton runner with two different
bucket geometry, with and without fillet at root section, as shown in figure 1. The design geometry of bucket was changed duringwelding repair and runner failure occurred after 10000 hours of operation [3]. In addition, the torque generated by the turbine isdetermined in the paper.
II. METHODOLOGY
The methodology used for CFD analysis of Pelton turbine is shown in Figure 2. The 3D model of Pelton turbine was created withreference to Khimti Hydropower. The rotating domain and stationary domain for CFD analysis was modeled using PRO/Engineer andANSYS Design Modeler respectively. The model size runner was selected considering laboratory test facility and IEC 60193 testrequirements. The numerical methods and boundary conditions were defined in ANSYS CFX and the numerical results werecomputationally and analytically validated. The torque was calculated and computationally valid pressure distribution was exportedfor fatigue analysis.
C
(a) Before Repair (b) After RepairFigure 1. Runner geometry before and after repair
With fillet betweensplitter and runner disc Without fillet between
splitter and runner disc

8/10/2019 CFD Analysis of Pelton Runner
http://slidepdf.com/reader/full/cfd-analysis-of-pelton-runner 2/6
International Journal of Scientific and Research Publications, Volume 4, Issue 8, August 2014 2ISSN 2250-3153
www.ijsrp.org
Figure 2. Methodology for CFD analysis
III. 3D MODELING OF PELTON TURBINE
2D contour plot of Pelton bucket was used to model 3D Pelton runner for CFD analysis. Each contour lines were exported usingAutoCAD and imported in PRO/Engineer software to build 3D model, shown in Figure 3. Figure 4 shows the selected Pelton bucketfor CFD analysis. Half bucket was selected for analysis since the Pelton bucket is symmetric about the splitter. This reduces the totaltime for computational analysis [4].
Figure 3. 3D Model of Pelton Turbine Figure 4. Selected Pelton Bucket for CFD Analysis
IV. SELECTION OF MODEL SIZE RUNNER
Scaled runner has been selected to reduce the computational cost and considering the future prospects of verifying the CFD result atTurbine Testing Lab, Kathmandu University. The laboratory test facility and minimum requirements for model test of hydraulicturbines mentioned in IEC 60193 and IEC 1116 has been used to obtain hydraulic similitude conditions between the model and
prototype. The turbine data for prototype is shown in Table 1.A kinematically similar turbine is obtained when the model and prototype are geometrically similar and ratio of their fluid velocity
and peripheral velocity is equal. A complete similarity is achieved when the Reynolds number is equal between the model runner and prototype in addition to kinematic similarity. These condit ions are satisfied when the speed number is equal in both the turbines [5].Therefore, equations 1 – 3 are used to determine the hydraulic similitude conditions [6].
Equation 1
√ Equation 2
√ Equation 3
Besides, minimum requirements for model Pelton turbine as stated in IEC 60193 and hydraulic similitude conditions, shown inTable 2, and the laboratory test facility available at Turbine Testing Lab, shown in table 3, are used to determine the appropriateoperating conditions for model Pelton turbine, shown in Table 4 [6] [7].
3D Modelling of Pelton Turbine(With reference to Khimti Hydropower)
Selection of Model Size Runner(Meet the requirements for Experimental Test)
CFD Analysis using ANSYS CFX
Analysis of the Numerical Results
IEC 60193 Laboratory TestFacility
Stationary Domain(ANSYS Design
Rotating Domain(PRO/Engineer)
Numerical Methods Boundary Conditions
Export computationally valid pressuredistribution for fatigue analysis
Mesh Dependent TestAnalytical Solution

8/10/2019 CFD Analysis of Pelton Runner
http://slidepdf.com/reader/full/cfd-analysis-of-pelton-runner 3/6
International Journal of Scientific and Research Publications, Volume 4, Issue 8, August 2014 3ISSN 2250-3153
www.ijsrp.org
Table 1: Turbine Data: PrototypeParameter Unit ValuePitch Circle Diameter mm 1400
Number of Buckets - 22 Number of Nozzles - 2Head (H) m 660Discharge (Q) m /s 2.15Rotational Speed RPM 600
Table 2: Hydraulic Similitude ConditionsParameter Unit ValueSpeed Number - 0.076Speed Factor - 10.44Flow Factor - 0.014Minimum Reynold’s Number - 2 10 6
Minimum Hydraulic Specific Energy J/Kg 500
Minimum Bucket Width mm 80
Table 3: Laboratory ConstraintParameter Unit ValueHead(H)
Open System m 30Closed System m 150
Discharge (Q) m 3/s 0.5Torque (T) Nm 2000
Table 4: Selected Model Turbine Operating ConditionParameter Unit ValueHead (H) m 53.9Discharge (Q) m /s 0.05Pitch Circle Diameter (PCD) mm 400Scale Factor - 1:3.5
V. MESHING
Stationary and rotating domain was discretized separately using ANSYS Meshing. The stationary domain, shown in Figure 5 (a),consists of two regions, water and air flow region. Water flow region is of prime interest while discretizing the stationary domain.Sweep method was used in core region of water while inflation method was used in boundary region of water and air [8]. The mesh instationary domain consisted of structured hexahedral type mesh. Figure 5 (b), (c) shows the mesh in stationary domain.
(a) Rotating Domain (b) Mesh (c) Bucket surface and Inlet
Figure 6: Rotating Domain
(a) Stationary Domain (b) Mesh (c) Nozzle RegionFigure 5: Stationary Domain
Water Flow Region Air Flow Region
Bodies of Influence

8/10/2019 CFD Analysis of Pelton Runner
http://slidepdf.com/reader/full/cfd-analysis-of-pelton-runner 4/6
International Journal of Scientific and Research Publications, Volume 4, Issue 8, August 2014 4ISSN 2250-3153
www.ijsrp.org
Automatic type of meshing method was used in rotating domain due to complex geometry of the bucket. The rotating domain wasdivided into three region of interest where fine mesh was created. A body of influence method was used in inlet and outlet region ofthe bucket, and the bucket surface meshed using inflation method, shown in Figure 6 (a) [8].
VI. NUMERICAL ANALYSIS
The governing equations of viscous flow are based on conservation of mass, momentum and energy which are langrangian innature. The governing equations are expressed using equations 4 – 6 [9].
Conservation of Mass: Equation 4
Conservation of Momentum: Equation 5
Conservation of Energy: Equation 6
The numerical analysis of CFD in Pelton turbine consists of incompressible fluid flow that reduces the conservation of mass andmomentum to equation 7 – 8 respectively. In addition, the temperature effect is negligible during the analysis. Therefore, conservationof energy is ignored during analysis [9].
Equation 7 Equation 8
The standard k- model is extensively used due to its excellent performance. But, it shows poor performance in unconfined flowregions where the boundary is curved, and in rotating and swirling flows. Similarly, the Wilcox model does not require wall dampingfunctions and it is robust in near wall regions. However, its robustness is decreased due to sensitivity in free stream region. SST modelis the hybrid model which used the Wilcox model in near wall region and standard k- model in the fully turbulent region. Acomparative study of turbulence model has been carried out using k- and k- ω based SST model separately in the paper [10].
The domain type for both the rotating and stationary domain was defined fluid. Air and water, both at 25 0C, with continuous fluidmorphology was used in analysis. The fluid model was selected as homogeneous model with standard free surface model. Theinterface compression level was set to 2 to produce better convergence. Shear Stress Transport (SST) type turbulence model has beenused with automatic wall function. The surface tension model has been set as continuum surface force with primary fluid as water.Interphase transfer model was studied separately using free surface and mixture model. The initial conditions for the fluid volumefractions was defined 1 and 0 for air and water respectively. Since there is no pressure difference between the inlet and the outlet, thereference pressure was set to 1 atmosphere. And the domain motion option was set to rotating and stationary for rotating andstationary domain respectively. The symmetry boundary condition was applied in the middle plane diving the turbine into twosections. Smooth wall with no slip conditions was applied in the bucket wall.
VII. RESULTS AND DISCUSSION
The CFD analysis was carried out using k- and SST model separately using mixture model and free surface model as interphasetransfer method, as shown in Table 5. The simulation failed to converge using k- turbulence model. However, SST model convergefor both mixture and free surface interphase models. This is due to the fact that k-e model has poor performance in unconfined flowwhere the boundary is curved. But, SST model uses k- and Wilcox model in fully turbulent and near wall region respectively.
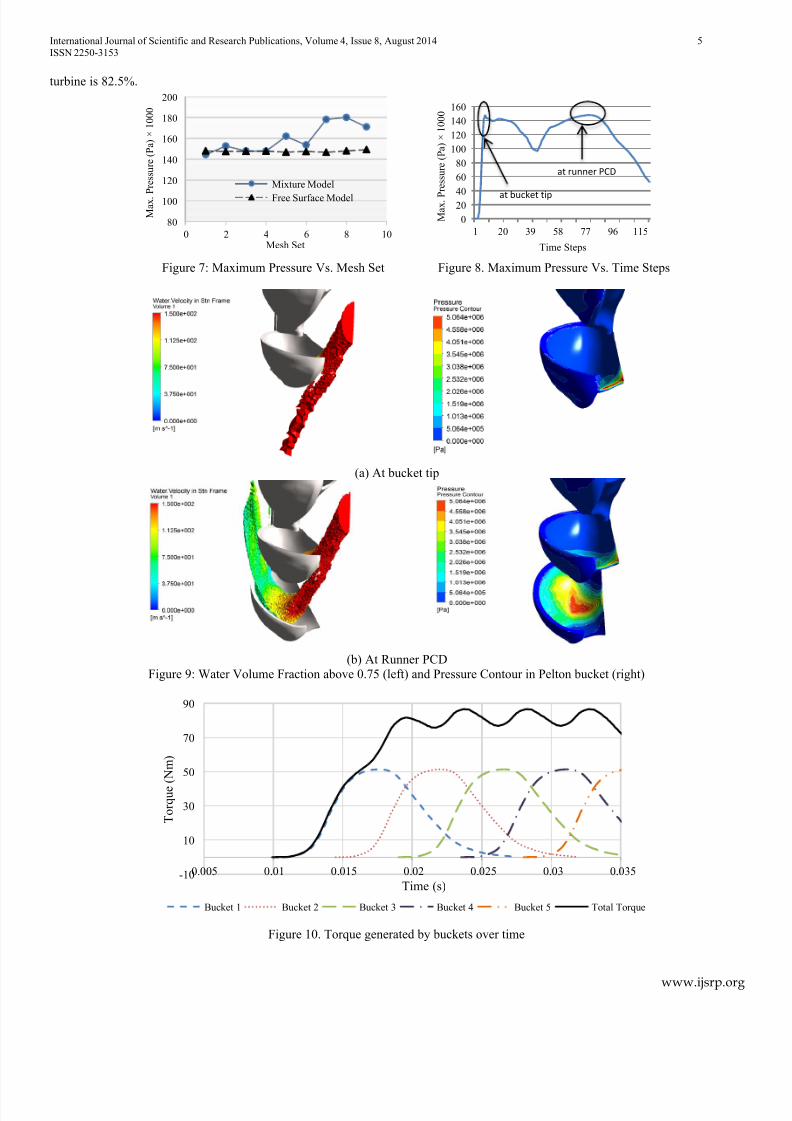
Mesh dependent test was carried out to computationallyvalidate the result in seven different mesh sets. The totalnumber of nodes was varied from 0.75 million to 4.3millions. Figure 7 shows the mesh dependent test using
SST model using mixture model and free surface model as interphase transfer method. It was found that the results are better whenusing free surface model [11].
The pressure distribution in middle bucket was exported from ANSYS CFX, shown in Figure 8. It was found that the pressure peaks are obtained at bucket tip and PCD of runner. The pressure peak in bucket tip is due to flow disturbance when jet strikes buckettip. It is obvious to obtain the pressure peak at runner PCD since the Pelton runner are designed such that it would convert most of thehydraulic energy to mechanical energy when the jet strikes the runner PCD [12]. The water volume fraction with velocity index and
pressure distribution in Pelton bucket is shown in Figure 9.The torque generated by the runner can be predicted by using the torque data produced by middle bucket. A single torque data is
replicated over time calculating the frequency of bucket during rotation, using equation 9. The calculated frequency for the modelturbine is 0.0045 seconds. Figure 10 shows torque generated by different buckets and total torque produced by Pelton turbine. Thecomparison of computational torque with analytical solution obtained using equation 10 showed that mechanical efficiency of the
Table 5: Convergence Vs. Turbulence Model and Interphase TransferMixture Model Free Surface Model
K E Model Failed FailedSST Model Converged Converged
8/10/2019 CFD Analysis of Pelton Runner
http://slidepdf.com/reader/full/cfd-analysis-of-pelton-runner 5/6
International Journal of Scientific and Research Publications, Volume 4, Issue 8, August 2014 5ISSN 2250-3153
www.ijsrp.org
turbine is 82.5%.
Figure 7: Maximum Pressure Vs. Mesh Set Figure 8. Maximum Pressure Vs. Time Steps
(a) At bucket tip
(b) At Runner PCDFigure 9: Water Volume Fraction above 0.75 (left) and Pressure Contour in Pelton bucket (right)
Figure 10. Torque generated by buckets over time
80
100
120
140
160
180
200
0 2 4 6 8 10
M a x .
P r e s s u r e ( P a ) ×
1 0 0 0
Mesh Set
Mixture Model
Free Surface Model
-10
10
30
50
70
90
0.005 0.01 0.015 0.02 0.025 0.03 0.035
T o r q u e
( N m
)
Time (s)
Bucket 1 Bucket 2 Bucket 3 Bucket 4 Bucket 5 Total Torque
02040
6080
100120140160
1 20 39 58 77 96 115
M a x . P r e s s u r e
( P a ) ×
1 0 0 0
Time Steps
at bucket tip
at runner PCD
8/10/2019 CFD Analysis of Pelton Runner
http://slidepdf.com/reader/full/cfd-analysis-of-pelton-runner 6/6
International Journal of Scientific and Research Publications, Volume 4, Issue 8, August 2014 6ISSN 2250-3153
www.ijsrp.org
VIII. CONCLUSION
The CFD analysis of scaled Pelton turbine of Khimti Hydropower was performed using ANSYS CFX software. The scale factorfor selected model turbine was 1:3.5. Scaling of the turbine reduces computational time and cost. The time and cost in CFD analysis ofPelton turbine is also reduced by selecting 3 buckets to predict the behavior of complete turbine. The result showed that SST model isrobust turbulence model to conduct CFD analysis of Pelton turbine. In addition, free surface interphase transfer method gives betterresult than mixture model. It was found that peak pressure is obtained at bucket tip and PCD of runner. The pressure distribution ineach bucket surface was exported using monitor tool in ANSYS CFX for further analysis on fatigue of Pelton turbine. The torqueresults obtained from the single bucket can be replicated over time to predict the total torque transferred by the Pelton turbine. Thetorque results obtained from CFD showed that the model Pelton turbine has efficiency of 82.5%.
R EFERENCES
[1] A. Sharma, P. Sharma, A. Kothari, Numerical Simulation of Pressure Distribution in Pelton Turbine Nozzle for the DifferentShapes of Spear, International Journal of Innovations in Engineering and Technology, Vol 1, Issue 4, December 2012.
[2] ANSYS User Guide, Version 14.0, 2011[3] A. Panthee, B. Thapa, H. P. Neopane, Quality Control in Welding Repair of Pelton Turbine, Proceedings in 3 rd Asia Pacific Forum
of Renewable Energy (AFORE), Jeju, Korea, November 4 – 7, 2014[4] L. Souari, M. Hassairi, Numerical Simulation of the Flow into a Rotating Pelton Bucket , International Journal of Emerging
Technology and Advanced Engineering, Vol. 3, Issue 2, February 2013.[5] United States Department of Interiors Bureau of Reclamation (USBR), Hydraulic Model Testing, Denver, Colorado, 1980.[6] International Electro-technical Commission, IEC 60193, Hydraulic turbines, storage pumps and pump turbines – Model
Acceptance Tests, 1999.[7] International Electro-technical Commission, IEC 1116, Electromechanical Equipment Guide for Small Hydroelectric Installations,
1992.[8] ANSYS Modeling and Meshing Guide, Version 14.0, 2011.[9] ANSYS CFX Modeling Theory, Version 14.0, 2011.
[10] L. E. Klemetsen, An Experimental and Numerical Study of Free Surface Pelton Bucket Flow, MSc Thesis, Norwegia Universityof Science and Technology, 2010.[11] D. Jost, P. Menzar, A. Lipej, Numerical Prediction of Pelton Turbine Efficiency, IOP Conference Series: Earth and
Environmental Science, Vol. 12, 2010.[12] A. Perrig. F. Avellan, j. L. Kueny, M. Farhat, E. Parkinson, Flow in Pelton Turbine Bucket: Numerical and Experimental
Investigations, Transactions of the ASME 128 (2006).
AUTHORS
First Author – Amod Panthee, MS by Research Student, Turbine Testing Lab, Department of Mechanical Engineering, School ofEngineering, Kathmandu University, Dhulikhel, Nepal, email: [email protected] Author – Associate Professor Hari Prasad Neopane, PhD, Department of Mechanical Engineering, School of Engineering,Kathmandu University, email: [email protected] Author – Professor Bhola Thapa, PhD, Department of Mechanical Engineering, School of Engineering, Kathmandu
University, email:[email protected]
Correspondence Author – Amod Panthee, [email protected], [email protected], +977-9841551828
Equation 9
Equation 10