cfl office market report - q1 2016
TRANSCRIPT

Summary StatisticsQ1 2016 Office Market Central FL
Vacancy Rate 11.5%
Change From Q4 2015 (Percent) -0.4%
Absorption (Square Feet) 337.958
New Construction (Square Feet) 81,000
Under Construction (Square Feet) 245,811
Asking Rents Per Square Foot Per Year
Current Quarter $19.97
Previous Quarter $19.93
Year Ago $19.64
Market IndicatorsRelative to Prior Period Q1 2016 Q2 2016*
VACANCY
NET ABSORPTION
CONSTRUCTION
OVERALL RENTAL RATE
CLASS A RENTAL RATE
Note: Construction is the change in Under Construction. *Projected
Strong Job Growth Tightens Market; Rising Rental Rates Across Central FloridaExecutive SummaryThe Central Florida office market remained steady and active through the first quarter of 2016. Many Class A buildings are full or nearly 100 percent occupied. Tenants are finding fewer options to consider when evaluating office space requirements.
Leasing activity remains strong and rightsizing has minimized. The market is seeing more expansions than contractions as tenants renew. The growing number of expansions is largely due to the region’s thriving economy. Notably, Orlando ranked #1 in the U.S. for job growth in 2015, ranked second as a most competitive business location among large U.S. cities, and continues to be a growing hub for technology, especially in simulation, medical and “VR,” or virtual reality.
With limited options available for quality space, tenants are provided with a “take-what-you-can-get” market. Limited space has shifted the dynamic in the landlords’ favor. Lease rates are rising marketwide and building owners are spending capital to upgrade their common areas, lobbies and tenant amenities. This includes additional food options for tenants in an effort to capture the demand.
Market Highlights > Office landlords are opting for longer lease terms. Five-year to seven-year terms for vacant space are becoming more common. Landlords anticipate a slowdown within two to three years and hope longer terms will bridge the period of uncertainty.
> Due to the lack of quality space in the central business district, there is pent-up demand for more space. Several submarkets are expected to see new development in the near future.
Research & Forecast Report
CENTRAL FLORIDA | OFFICEFirst Quarter 2016
0
2
4
6
8
10
12
Mar
-16
Sep-
15
Mar
-15
Sep-
14
Mar
-14
Sep-
13
Mar
-13
Sep-
12
Mar
-12
Sep-
11
Mar
-11
Florida Metro Orlando USA
2 Central FL Research & Forecast Report | Q1 2016 | Office | Colliers International
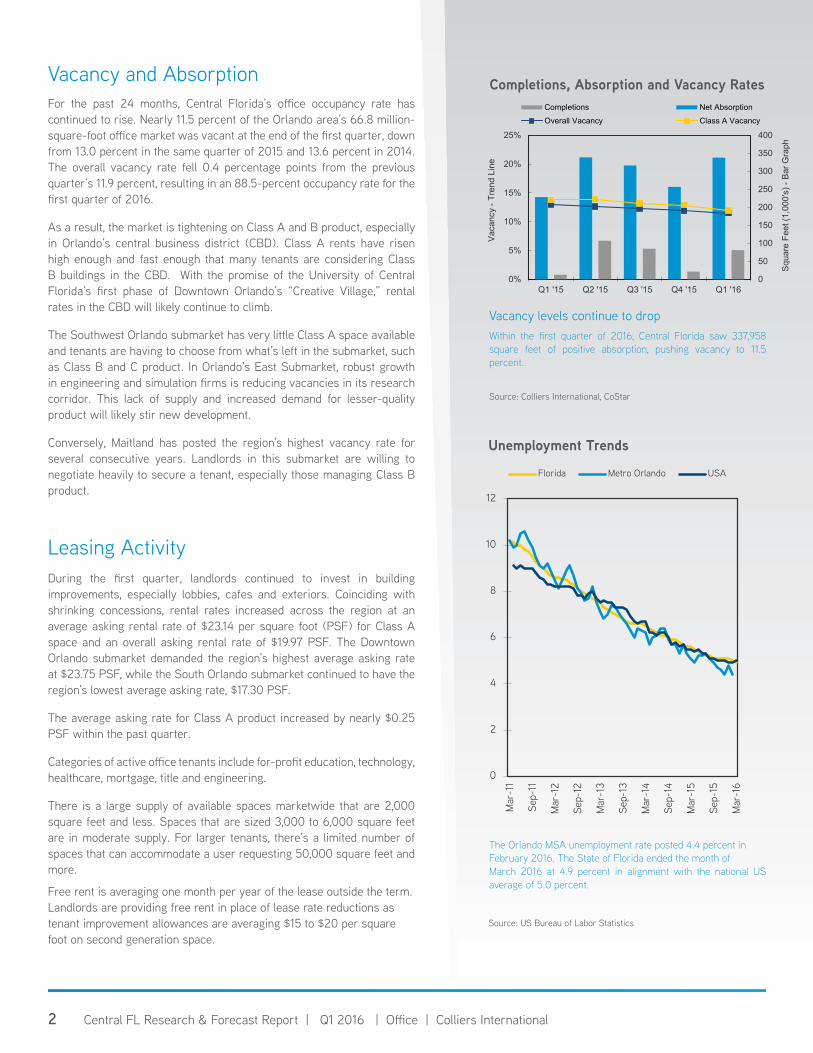
Completions, Absorption and Vacancy Rates
Source: Colliers International, CoStar
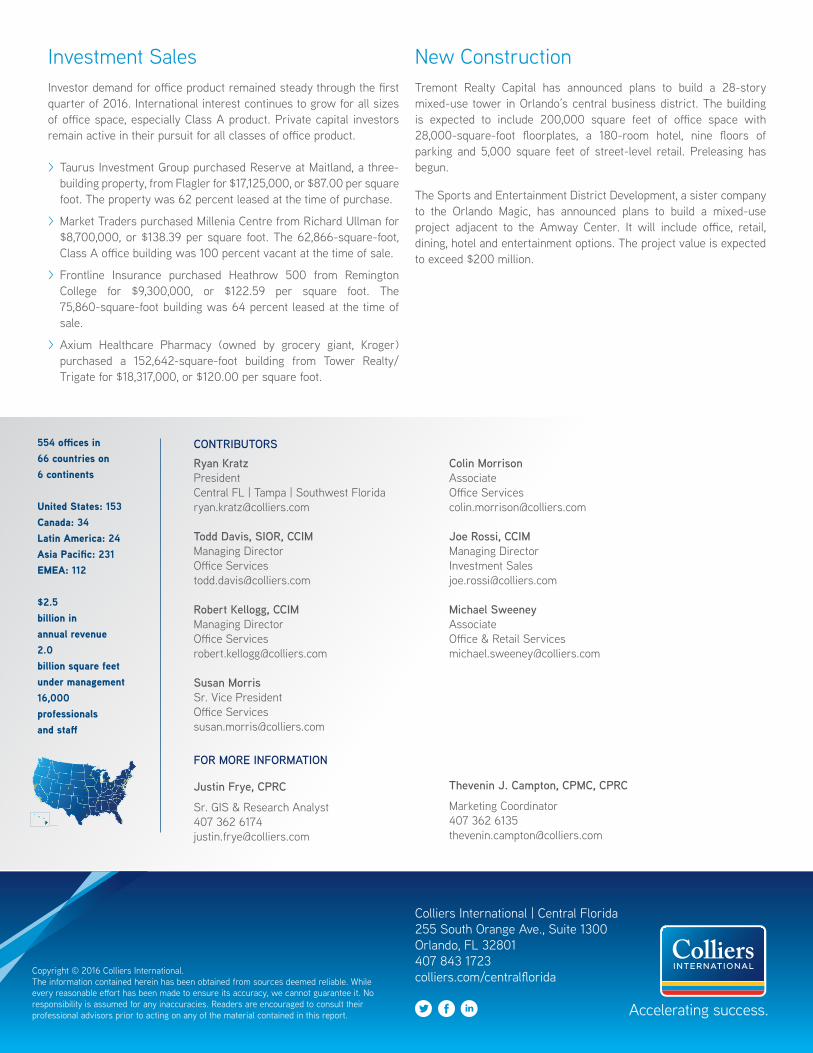
Unemployment Trends
Source: US Bureau of Labor Statistics
Vacancy levels continue to dropWithin the first quarter of 2016, Central Florida saw 337,958 square feet of positive absorption, pushing vacancy to 11.5 percent.
The Orlando MSA unemployment rate posted 4.4 percent inFebruary 2016. The State of Florida ended the month ofMarch 2016 at 4.9 percent in alignment with the national US average of 5.0 percent.
Vacancy and AbsorptionFor the past 24 months, Central Florida’s office occupancy rate has continued to rise. Nearly 11.5 percent of the Orlando area’s 66.8 million-square-foot office market was vacant at the end of the first quarter, down from 13.0 percent in the same quarter of 2015 and 13.6 percent in 2014. The overall vacancy rate fell 0.4 percentage points from the previous quarter’s 11.9 percent, resulting in an 88.5-percent occupancy rate for the first quarter of 2016.
As a result, the market is tightening on Class A and B product, especially in Orlando’s central business district (CBD). Class A rents have risen high enough and fast enough that many tenants are considering Class B buildings in the CBD. With the promise of the University of Central Florida’s first phase of Downtown Orlando’s “Creative Village,” rental rates in the CBD will likely continue to climb.
The Southwest Orlando submarket has very little Class A space available and tenants are having to choose from what’s left in the submarket, such as Class B and C product. In Orlando’s East Submarket, robust growth in engineering and simulation firms is reducing vacancies in its research corridor. This lack of supply and increased demand for lesser-quality product will likely stir new development.
Conversely, Maitland has posted the region’s highest vacancy rate for several consecutive years. Landlords in this submarket are willing to negotiate heavily to secure a tenant, especially those managing Class B product.
Leasing ActivityDuring the first quarter, landlords continued to invest in building improvements, especially lobbies, cafes and exteriors. Coinciding with shrinking concessions, rental rates increased across the region at an average asking rental rate of $23.14 per square foot (PSF) for Class A space and an overall asking rental rate of $19.97 PSF. The Downtown Orlando submarket demanded the region’s highest average asking rate at $23.75 PSF, while the South Orlando submarket continued to have the region’s lowest average asking rate, $17.30 PSF.
The average asking rate for Class A product increased by nearly $0.25 PSF within the past quarter.
Categories of active office tenants include for-profit education, technology, healthcare, mortgage, title and engineering.
There is a large supply of available spaces marketwide that are 2,000 square feet and less. Spaces that are sized 3,000 to 6,000 square feet are in moderate supply. For larger tenants, there’s a limited number of spaces that can accommodate a user requesting 50,000 square feet and more.
Free rent is averaging one month per year of the lease outside the term. Landlords are providing free rent in place of lease rate reductions as tenant improvement allowances are averaging $15 to $20 per square foot on second generation space.
0%
5%
10%
15%
20%
25%
0
50
100
150
200
250
300
350
400
Q1 '16Q4 '15Q3 '15Q2 '15Q1 '15
Vac
ancy
-Tr
end
Line
Squ
are
Feet
(1,0
00's
) -B
ar G
raph
Completions Net Absorption
Overall Vacancy Class A Vacancy

3 Central FL Research & Forecast Report | Q1 2016 | Office | Colliers International
SALES ACTIVITY
PROPERTY ADDRESS CLASS BUYER NAME SIZE (SF) SALES PRICE SUBMARKET
30, 65 and 70 Keller Road (Reserve at Maitland) B Taurus Investment Group 196,835 $17,125,000 ($87.00/SF) Winter Park/Maitland
3902 Millenia Drive (Millenia Centre) A Market Traders 62,866 $8,700,000 ($138.39/SF) Southwest Orlando
3200 Lake Emma Road B Axium Healthcare Pharmacy 152,642 $18,317,000 ($120.00/SF) Sanford/Lake Mary
LEASING ACTIVITY
PROPERTY ADDRESS CLASS TENANT NAME SIZE (SF) LEASE TYPE SUBMARKET
4000-4298 Millenia Blvd., DeVry A Nova Southeastern University 71,900 New Southwest Orlando
3210 Lake Emma Rd., Lake Emma Corporate Park B AT&T 30,709 New Sanford/Lake Mary
2400 Maitland Center Pkwy. A Centerpoint Financial 21,840 New Winter Park/Maitland
SUBMARKET BREAKDOWN
Prop. Type Bldgs.Total Inventory
SFDirect Vac.
%Total Vac.
%Net Absorp.
Current Qtr. SFNet Absorp.
YTD SFNew Completions
SF
Under Construc.
SF
Avg. Direct Asking Rate Full Service
Downtown
A 25 5,682,970 12.5% 13.0% -37,276 -37,276 0 0 $26.34
B,C 204 6,585,570 9.7% 9.8% 36,977 36,977 0 0 $21.23
Overall 229 12,268,540 11.0% 11.3% -299 -299 0 0 $23.35
Maitland
A 31 4,232,740 16.8% 17.0% 18,800 18,800 0 0 $19.53
B,C 90 3,129,449 14.4% 14.9% 20,507 20,507 0 0 $17.91
Overall 121 7,362,189 15.8% 16.1% 39,307 39,307 0 0 $18.91
East Orange
A 36 3,664,734 8.7% 8.7% 63,179 63,179 0 0 $24.78
B,C 381 11,931,495 9.4% 9.4% 52,396 52,396 0 0 $18.86
Overall 417 15,596,229 9.2% 9.3% 115,575 115,575 0 0 $20.12
Seminole
A 30 3,974,016 10.0% 10.2% 50,834 50,834 0 0 $22.64
B,C 291 8,596,403 15.3% 15.3% -16,407 -16,407 18,000 29,211 $17.38
Overall 321 12,570,419 13.6% 13.7% 34,427 34,427 18,000 29,211 $18.88
South Orlando
A 30 3,438,674 9.1% 9.9% 85,407 85,407 0 50,000 $24.40
B,C 155 5,499,807 16.6% 16.6% 44,949 44,949 22,000 0 $15.76
Overall 185 8,938,481 13.7% 14.0% 130,356 130,356 22,000 50,000 $17.30
SW Orlando
A 41 3,909,547 10.2% 10.9% 72,243 72,243 0 136,000 $24.12
B,C 175 6,585,760 6.5% 6.6% -45,847 -45,847 41,000 0 $20.77
Overall 216 10,495,307 7.9% 8.2% 26,396 26,396 41,000 136,000 $22.66
CENTRAL FLORIDA OVERALL MARKET
Qtr. & Year Bldgs.Total Inventory
SFDirect Vac. % Total Vac. %
Net Absorp. Current Qtr. SF
Net Absorp. YTD SF
New Completions SF
Under Construc.
SF
Overall Avg. Direct Asking
Rate FS
Class A Avg. Direct Asking
Rate FS
2016 Q1 1,473 66,838,341 11.3% 11.5% 337,958 337,958 81,000 245,811 $19.97 $23.14
2015 Q4 1,470 66,757,341 11.7% 11.9% 256,658 1,140,102 21,422 246,211 $19.93 $22.86
2015 Q3 1,469 66,735,919 12.1% 12.3% 316,114 883,444 85,000 254,422 $19.69 $22.63
2015 Q2 1,468 66,650,919 12.5% 12.6% 338,798 567,330 107,124 203,422 $19.61 $22.74
2015 Q1 1,466 66,543,795 12.8% 13.0% 228,532 228,532 12,600 208,124 $19.64 $22.49
4 North American Research & Forecast Report | Q4 2014 | Office Market Outlook | Colliers International
Copyright © 2016 Colliers International.The information contained herein has been obtained from sources deemed reliable. While every reasonable effort has been made to ensure its accuracy, we cannot guarantee it. No responsibility is assumed for any inaccuracies. Readers are encouraged to consult their professional advisors prior to acting on any of the material contained in this report.
Colliers International | Central Florida255 South Orange Ave., Suite 1300 Orlando, FL 32801407 843 1723colliers.com/centralflorida
FOR MORE INFORMATION
Justin Frye, CPRC
Sr. GIS & Research Analyst407 362 [email protected]
Investment SalesInvestor demand for office product remained steady through the first quarter of 2016. International interest continues to grow for all sizes of office space, especially Class A product. Private capital investors remain active in their pursuit for all classes of office product.
> Taurus Investment Group purchased Reserve at Maitland, a three-building property, from Flagler for $17,125,000, or $87.00 per square foot. The property was 62 percent leased at the time of purchase.
> Market Traders purchased Millenia Centre from Richard Ullman for $8,700,000, or $138.39 per square foot. The 62,866-square-foot, Class A office building was 100 percent vacant at the time of sale.
> Frontline Insurance purchased Heathrow 500 from Remington College for $9,300,000, or $122.59 per square foot. The 75,860-square-foot building was 64 percent leased at the time of sale.
> Axium Healthcare Pharmacy (owned by grocery giant, Kroger) purchased a 152,642-square-foot building from Tower Realty/Trigate for $18,317,000, or $120.00 per square foot.
New ConstructionTremont Realty Capital has announced plans to build a 28-story mixed-use tower in Orlando’s central business district. The building is expected to include 200,000 square feet of office space with 28,000-square-foot floorplates, a 180-room hotel, nine floors of parking and 5,000 square feet of street-level retail. Preleasing has begun.
The Sports and Entertainment District Development, a sister company to the Orlando Magic, has announced plans to build a mixed-use project adjacent to the Amway Center. It will include office, retail, dining, hotel and entertainment options. The project value is expected to exceed $200 million.
Ryan KratzPresidentCentral FL | Tampa | Southwest [email protected]
Todd Davis, SIOR, CCIMManaging DirectorOffice [email protected]
Robert Kellogg, CCIMManaging DirectorOffice [email protected]
Susan MorrisSr. Vice PresidentOffice [email protected]
Colin MorrisonAssociateOffice [email protected]
Joe Rossi, CCIMManaging DirectorInvestment [email protected]
Michael SweeneyAssociateOffice & Retail [email protected]
554 offices in 66 countries on 6 continents
United States: 153 Canada: 34 Latin America: 24 Asia Pacific: 231 EMEA: 112
$2.5billion in annual revenue2.0billion square feet under management16,000professionals and staff
Updated May 2012
CONTRIBUTORS
Thevenin J. Campton, CPMC, CPRC
Marketing Coordinator407 362 [email protected]