cgro guest investigator program progress report …
TRANSCRIPT

CGRO GUEST INVESTIGATOR PROGRAM
/4- - , /CL4
PROGRESS REPORT FOR GRANT NAG 5-2420:
"EGRET HIGH ENERGY CAPABILITY" and "MULTIWAVELENGTH FLARE
STUDIES"
AND GRANT NAG 5-3518: "SOLAR FLARE PROTON SPECTRA"
Principal Investigator: Dr. Edward L. Chupp
Period Covered by Report: 11/15/96 - 11/15/97
Space Science Center, University of New Hampshire, Durham NH 03824
The study of EGRET/TASC flare data has been funded during phases 3-6 of the CGRO Guest
Investigator program. The funding and accomplishments can be summarized as follows:
Phase 3. - Under PI Dr. David L. Bertsch (GSFC) the proposal "Use of EGRET High-Energy
Capability to Investigate Energetic Solar Flare Processes" was funded with E. L. Chupp and P. P.
Dunphy as Co-Investigators at a level of $15,500 instead of the $22,000 requested (NAG 5-2420).
Under Phase 3 support the accomplishments were:
UNH was assigned the responsibility to use their accelerator neutron measurements to verify the
TASC response function and to modify the TASC fitting program to include a high energy neutron
contribution. Direct accelerator-based measurements by UNH of the energy-dependent efficiencies
for detecting neutrons with energies from 36 to 720 MeV in NaI were compared with Monte Carlo
TASC calculations. The calculated TASC efficiencies are somewhat lower (by about 20%) than
the accelerator results in the energy range 70-300 MeV. The measured energy-loss spectrum for
207 MeV neutron interactions in NaI were compared with the Monte Carlo response for 200 MeV
neutrons in the TASC indicating good agreement. Based on this agreement, the simulation was
considered to be sufficiently accurate to generate a neutron response library to be used by UNH in
modifying the TASCfitting program to include a neutron component in the flare spectrun modeling.
TASCenergy-loss data on the 1991 June 11 flare was transferred to UNH.
Phase 4. - Under PI Dr. E. L. Chupp the proposal "Study of High Energy Neutrons and Gamma-
Rays Using the EGRET/TASC" was funded at a level of $30,000 (Supplement 1) while the level
https://ntrs.nasa.gov/search.jsp?R=19970041494 2020-06-16T01:32:43+00:00Zbrought to you by COREView metadata, citation and similar papers at core.ac.uk
provided by NASA Technical Reports Server

requestedfor theproposedworkwas$49,000.UnderPI Dr. DavidL. Bertschthe proposal"Investi-gationof EnergeticSolarFlareProcessesUsingtheHighEnergyCapabilitiesof EGRET" provided
UNH Co-Investigators Chupp and Dunphy with $16,796 of additional funding (Supplement 2) to
continue the work started under the phase 3 program instead of the requested amount of $25,000.
Under Phase _ the accomplishments were:
The Phase 3 effort to determine a high energy neutron contribution to the emissions from the 1991
June 11 solar flare was continued. A preliminary upper limit to the neutron fluence (> 50 MeV)
from this flare was found by adding a theoretical solar neutron spectrum to the TASC spectral
fit program. The result was <27 neutrons cm -2 which corresponds to < 2.2 x 10²s neutrons sr -1
(> 50 MeV) emitted from the Sun toward the Earth. This is about a factor of 10 less than the
neutron emissivity from the 1982 June 3 solar flare. This result was presented by P. P. Dunphy, E.
L. Chupp, D. L. Bertsch, E. J. Schneid, and S. Gottesman at the 24th International Cosmic Ray
Conference at Rome in September 1995. Subsequently, the TASC spectral fitting program has been
modified to include components from: */-ray lines (solar and background), bremsstrahlung, neutral
pion decay and high energy neutron interactions.
The next step in the analysis of this event, was doing full fits to the TASC energy-loss spectra as a
function of time. A significant hardening of the solar proton spectrum over time was found for the
flare. The results from the analysis were presented at the 188th meeting of the AAS in Madison,
WI by P. P. Dunphy et al. in June 1996.
Phase 5. - Under PI Dr. E. L. Chupp the proposal "Multiwavelength Studies of October 91 X-Class
Solar Flares Observed by EGRET" was funded at a level of $15,000 (Supplement 3) instead of the
$52,000 requested.
Under Phase 5 the accomplishments and ongoing work are:
For the Phase 5 work, we have gathered a significant amount of correlated data for flares observed
by the EGRET/TASC. This includes the TASC spectral data for 5 X-class flares between 1991
October 21 and 1991 November 3, as well as the corresponding response functions which account
for the solar angle and the spacecraft mass. Also obtained were: Yohkoh ttXT time histories and
images for the 1991 October 27 flare, Yohkoh GRS time histories and gamma-ray line spectra
for the 1991 October 27 flare, standard GOES x-ray data and NOAA radio reports, Nobeyama
2

radioreports,and ChineseAcademyof SciencesSolar-GeophysicalData. Workon this data, withemphasison the flareof 1991October27is ongoing.
Phase 6. - Under PI Dr. E. L. Chupp the proposal "Characterization of Solar Flare Proton Spectra
Using EGRET/TASC Data" was funded at a level of $25,000 (NAG 5-3518).
Under Phase 6 the accomplishments and ongoing work are:
The goal of the Phase 6 program is to apply the analysis technique used successfully with the
EGRET / TASC energy-loss spectra for the 1991 June 11 flare to data on the remaining X-class
flares observed in 1991 June as funding permits. The first priority was to use the results from
fitting the June 11 flare spectra to constrain the flare proton spectral shape and intensity. Our
results to date demonstrate that the TASC spectral analysis contributes crucial information on the
particle spectrum interacting at the Sun. A preliminary draft of a paper describing this analysis
is attached as an Appendix. We plan to submit the paper to a refereed journal by the end of this
year. The next step in the work will be to use a similar analysis on the flare of 1991 June 4.

APPENDIX
GAMMA-RAYS AND NEUTRONS AS A PROBE
OF FLARE PROTON SPECTRA: THE SOLAR
FLARE OF 11 JUNE 1991
Philip P. Dunphy 1, Edward L. Chupp 2, David L. Bertsch 3,
Edward J. Schneid 4, Stephen P_. Gottesman s, and Gottfried Kanbach 6
1Space Science Center, University of New Harnphire, Durham, NH 03824
2Physics Department, University of New Hampshire, Durham, NH 03824
3Laboratory .for High Energy Astrophysics, Goddard Space Flight Center, Greenbelt, MD 20771
4Northrup Grurnrnan, Bethpage, NY 11714
5Northrup Grurnman, Baltimore, MD 21203
6Max-Planck-fnstitut .f_r Extraterrestrische Physik, 85740 Garching, Germany
1 INTRODUCTION
The likelihood of the significant production of measurable fluxes of gamma-rays and neutrons in
solar flares was investigated by a number of workers, long before the relevant observations were
available (e.g., Fireman 1963; Chupp 1963; Dolan and Fazio 1965). The potential value of gamma-
ray and neutron measurements as a probe of energetic ions generated in solar flares was pointed out
and expected fluxes were calculated in detail by Ramaty and Lingenfelter (1967) and Lingenfelter
(1969). The role of neutrons directly detected at 1 AU and gamma-rays from pion (_r) decay were
seen to be directly related to very energetic ions, because of the high threshold kinetic energy
required for their production (_ 300 MeV for both 7r's and neutrons in p-p reactions).
Solar flare neutrons were first detected directly by the SMM spectrometer on 21 June 1980 (Chuppet al. 1985). Evidence of pion-decay gamma-rays from the same flare was reported by Forrest et
al. (1985). Several such satellite-based observations have since been made by SMM (Chupp et al.
1987), GAMMA-1 (Akimov 1991, 1994a,b), and Comptel/CGRO (Ryan et al. 1994; Rank et al.
1994, 1997). The effects of highly energetic neutrons have also been seen by ground-based neutron
monitors from a few flares (Debrunner et al. 1983; Smart et al. 1990; Shea et al. 1991; Takahashi et
al. 1991; Muraki et al. 1991; Chiba et al. 1992). In the present paper, we report on an analysis of
the response of the EGRET Total Absorption Shower Counter (TASC) on the Compton Gamma
Ray Observatory to the solar flare of 11 June 1991. We argue that the high-energy emission (> 10
MeV) detected by the TASC in the later stages of the flare is dominated by pion-decay gamma-rays
and neutrons. The appearance of this emission marks a significant change in the spectral shape of
the protons that interact in the solar atmosphere.

2 DESCRIPTION OF THE EGRET/TASC
The EGRET (Energetic Gamma Ray Experiment Telescope) is a large gamma-ray detector com-
prising a spark chamber, a NaI(T1) scintillator/calorimeter, and an anticoincidence plastic scintilla-
tor dome. EGRET was designed primarily as a telescope to image 20 MeV to 30 GeV gamma-rays
from cosmic sources with high sensitivity. The NaI calorimeter, or TASC, is a large (76 x 76 ×
20 cm 3) spectrometer which measures the total energy of gamma-rays detected by EGRET. The
TASC also has a burst/solar flare mode that records spectra in the energy range of 1 to 200 MeV
every 32.75 s independent of the spark chamber and the anticoincidence dome. More information
about the EGRET detector system can be found in Hughes et al. (1988), Kanbach et al. (1989),
and Thompson et al. (1993).
Because of its large volume and mass, the TASC has a high efficiency for detecting solar flare
gamma-rays and neutrons > 10 MeV. The EGRET, as well as the other detectors aboard CGRO,
axe not normally pointed at the Sun, except for times of high solar activity when the Sun is chosen
as a target of opportunity. Therefore the response of the TASC to solar gamma-rays and neutrons
depends on the orientation of CGRO during a particular flare. This response can be calculated
using a "mass model" that accounts for the effects of material throughout the CGRO spacecraft.
The response to gamma-rays is calculated using a standard Monte Carlo code for high-energy
gamma-rays, EGS4 (Nelson 1985). The response to neutrons is calculated with an analogous code
for neutrons, CALOR (Jensen 1990).
Figure 1 shows the calculated energy-loss spectrum in the TASC from 200 MeV neutrons. To
check the accuracy of the neutron response code, we have compared this sample calculation with
an energy-loss spectrum measured in a large NaI scintillation detector exposed to a tagged neutron
beam at 207 MeV (Dunphy et al. 1989). The comparison shows good agreement with deviationsno more than about 20% from 10 to 200 MeV.
3 DESCRIPTION OF THE OBSERVATIONS AND ANALY-
SIS
The solar flare of 11 June 1991 was one of a series of flares from active region 6659 that took place
during June 1991. Following the occurrence of two GOES X-class flares on 4 June and 6 June, the
CGRO instruments were pointed at the Sun. As a result, the active region was close to the EGRET
pointing axis (zenith angle = 14°) during the 11 June flare. This flare, which was categorized as
GOES class X12, was located at 31°N and 17°W in heliocentric coordinates (Solar Geophysical
Data).
Figure 2 shows the response of the EGRET/TASC detector to the flare emission over a range of
energy losses from 2 to 200 MeV. The net counting rate due to the flare (32.75 s time bins) has
been determined by subtracting background measured approximately 24 hours before and after the
flare, when the orbital and geomagnetic conditions were similar. A significant flare contribution

waspresentfromabout01:59UT until 02:39UT. Thecountingrateprofileshowsseveraldistinctivefeaturesoverthis time period: two relativelyshortburstsfrom 01:59- 02:10,an intervalof lowcountingratefrom 02:10- 02:13,andanextendedexcessafter02:13.Forpurposesof analysis,weidentifythe first intervalasphaseI, thesecondastheinterphase,andthethird asphaseII. PhasesI andII aresimilarto onesdefinedbyMandzhavidzeet al. (1996) for this flare, as we discuss below.
Phase I can be subdivided according to the two bursts into time periods of 01:59 - 02:03 (phase
I-l) and 02:03 - 02:10 (phase I-2). These time intervals are shown in Figure 2 and listed in Table
1. We note that the sharpness of time structure is limited by the TASC time resolution of 32.75s.
The separation of the data into these phases can also be justified directly from a comparison of the
"hardness" of the energy-loss spectrum for each phase. To specify the hardness, we compare the
TASC counting rate in the energy-loss range 30-200 MeV to the rate in the range 4-8 MeV. These
rates and their ratios are shown in Table 1. The ratio R(30-200)/R(4-8) is seen to be more than
an order of magnitude greater in phase II compared to the bursts of phase I, implying a significantchange in the parent particle spectra.
To specify the details of the spectral changes with time, we fit the energy-loss spectrum for each
phase with a multi-component model gamma-ray and neutron spectrum. There are five gamma-
ray components: (1) a power law in energy, assumed to be due to electron bremsstrahlung; (2) a
line spectrum from nuclear de-excitation; (3) a line at 2.223 MeV from neutron capture by protons;
(4) a spectrum (dominated by lines at ,,_ 7.6 MeV) from activation of Fe nuclear levels by neutrons
in the spacecraft; and (5) a broad "line" peaking at 67 MeV from Ir° decay plus a continuum due
to bremsstrahlung from electrons and positrons from _r+ decay. For the neutron spectrum, two
types of spectral shapes are used: (1) a neutron spectrum calculated to be produced by protons
with a power law spectrum in energy (Murphy et al. 1987) and (2) a neutron spectrum calculated
to be produced by protons with a Bessel function spectrum (Murphy et al. 1987). These proton(and therefore, neutron) spectral shapes are related to different proton acceleration mechanisms
(Murphy et al. 1987).
The components of the model are folded through the gamma-ray and neutron response functions
described above and fit to the observed energy-loss spectra using a standard Levenberg-Marquardt
non-linear multi-parameter iterative fitting routine (Press et al. 1989). The results of the fitting
procedure are shown in Figure 3. Taking each phase in turn, we point out a number of features.
The spectra from the two bursts during phase I are quite similar, with a power-law continuum,
a significant contribution from the nuclear line de-excitation component (apparent mainly in the
energy range 4-8 MeV), and a strong neutron-capture line at 2.2 MeV. During this phase, there
is no significant contribution from pion-decay gamma-rays, solar neutrons, or Fe activation. In
fact, these components were omitted from the phase I fits shown in Figure 3. The fit to the
interphase has only two significant components: a power-law continuum and the 2.2 MeV neutron-
capture line. Again, no pion-decay or neutron component is used in the fit. Finally, the fit to the
phase II spectrum indicates a significant pion-decay and/or neutron component but no significant
power-law component. Otherwise, this fit requires all of the gamma-ray components listed above.
Unfortunately, the response of the EGRET/TASC is very similar for both pion-decay gamma-ray
spectra and high-energy neutron spectra. Therefore, we have used combinations of pion-decay
and neutron spectra based on theoretical calculations (Murphy and Ramaty 1985). The best-fit

parametersandassociateduncertaintiesfor eachof the phases are listed in Table 2. In the following
section, we discuss the implications of the differences between the spectra.
4 RESULTS AND DISCUSSION
One of the most obvious features of the evolution of the high-energy emission from this flare is
the clear hardening of the detected spectrum between phases I and II. This can be seen both in
the spectral hardness ratios in Table 1 and in the change in spectral shape in Figure 3, where
an intensification in the spectrum above 10 MeV occurs during phase II. In our fitting model,
this implies a flux of solar neutrons and pion-decay gamma-rays which were not present earlier.
Mandzhavidze et al. (1996) have already pointed out the change in spectral shape. In fact, the
change in shape is more radical than their analysis would imply. Since spectral analysis of the
TASC data was beyond the scope of their paper, they had assumed that the emission detected > 10
MeV in phase I was due to pion decay. The present spectral analysis indicates that this energy
range is actually dominated by electron bremsstrahlung. Thus the change in spectral shape is due
to the appearance of a pion-decay component. This, in turn, is due to the hardening of the ion
spectrum that produces the nuclear lines and the pion-decay emission.
The virtual disappearance during the interphase of nuclear lines that are a signature of ion in-
teractions imply that the phase I and phase II emissions are, to some extent, independent. Thiscould mean that the ion acceleration mechanisms or the sites of the acceleration are different. The
presence of a strong 2.2 MeV neutron-capture line during the interphase is not inconsistent with
a decrease in ion interactions, since neutron capture line emission is expected to be delayed with
respect to the de-excitation lines (Prince et al. 1983; Hua and Lingenfelter 1987).
Using the best-fit neutron and gamma-ray spectral parameters obtained from each phase of the
flare, fluences for various components can be calculated, and these are listed in Table 3. These flu-
ences can be applied to appropriate solar gamma-ray and neutron production models (e.g., Murphy
and Ramaty 1985; Murphy et al. 1987) to constrain the flare proton spectrum. In particular, the
relative fluences of the 2.2 MeV line (F2.2), the nuclear line emission in the range 4-7 MeV (F4-7),
and _r°-decay gamma-rays (Fro) can be used to constrain the energy spectrum of solar protons
that produce these emissions. In Figure 4, we plot the relevant ratios, F2.2/F4-T andF_r0/F4-T, as
a function of proton spectral shape, based on calculations by Murphy and Ramaty (1985). From
these plots we see that the proton spectral shape is consistent with a Bessel function parameter
of 0.019+0.005 for phase I-1 and 0.028±0.005 for phase I-2, but inconsistent with a power law. In
contrast, the phase II proton spectral shape is consistent with a power-law spectrum with index
2.8±0.2, but inconsistent with a Bessel function shape. This evolution in ion spectral shape is
reminiscent of the flare of 3 June 1982. In that case, Murphy et al. (1987) argued that the initial
burst of gamma-rays (and neutrons) was due to ion acceleration by a 2nd-order Fermi process,
while the time-extended emission was caused by shock acceleration.
We conclude by noting a more general similarity of the high-energy time history of this flare with
other large flaxes. In particular, the presence of an initial impulsive phase (phase I here), followed
4

by a "delayed"or "extended"phasewith a harderion spectrum(phaseII here), appearto bethe rule rather than the exceptionfor the largestX-classflaresdetectedby SMM, CGRO,andGAMMA-1 (Dunphyand Chupp1994;Akimov et al. 1991, 1994a, 1994b; Ryan et al. 1994). It is
already known that electrons (> 1 MeV) and ions (> 100 MeV) can be accelerated together over
short time scales (,,,1 s) (Forrest and Chupp 1983; Kane et al. 1986). Thus, acceleration models that
produce bursts on even shorter time scales than those in phase I have been addressed (references).Models that explain particle acceleration and/or trapping with emphasis on ions which would be
appropriate to the phase II emission reported here have also been put forward (Ryan and Lee 1991;
Kocharov et al. 1993; Guglenko et al. 1990; Mandzhavidze et al. 1996). Given the commonness of
extended phase emission, models which do not depend on unusual or special conditions at the flaresite should be favored.
5 ACKNOWLEDGEMENTS
The authors gratefully acknowledge support from NASA through grant NAG 5-2420 (UNH) and
contract NAS 5-31210 (Northrup Grumman).
6 REFERENCES
Akimov, V. V., et al., Proc. 22nd Int. Cosmic Ray Conf. (Dublin) 3, 73 (1991).
Akimov, V. V., et al. , in J. M. Ryan and W. T. Vestrand (eds.), High-Energy Solar Phenomena,
AIP, New York, 106 (1994a).
Akimov, V. V., Leikov, N. G., Kurt, V. G., and Chertok, I. M., in J. M. Ryan and W. T. Vestrand
(eds.), High-Energy Solar Phenomena, AIP, New York, 130 (1994b).
Chiba, N., et al. , Astroparticle Phys. 1 27 (1992).
Chupp, E. L., in W. N. Hess (ed.), AAS-NASA Symposium on the Physics of Solar Flares, NASA
SP-50, 445 (1963).
Chupp, E.L., et al., ApJ (Letters) 273, L95 (1982).
Chupp, E.L., et al., ApJ 318, 913 (1987).
Debrunner, It., F1/ickiger, E., Chupp, E. L., and Forrest, D. J., Proc. 18th Int. Cosmic. Ray Conf.
4, 75 (1983).
Dolan, J. F. and Fazio, G. G., Rev. of Geophys. 3,319 (1965).
Dunphy, P. P., and Chupp, E. L., in J. M. Ryan and W. T. Vestrand (eds.), High-Energy Solar
Phenomena, AIP, New York, 112 (1994).
Dunphy, P. P., et al. , Experimental Astrophys. 2,233 (1989).
Fireman, E. L., in W. N. Hess (ed.), AAS-NASA Symposium on the Physics of Solar Flaxes, NASA
SP-50, 279 (1963).
Forrest, D. J., and Chupp, E. L., Nature 305 (59), 291 (1983).
5

Forrest,D. J. et al. , Proc. 19th Int. Cosmic. Ray Conf. 4, 146 (1985).
Guglenko, V. G., et al., ApJ (Supplement) 73,209 (1990).
Hun, X.-M., and Lingenfelter, R.E., ApJ 323, 779 (1987).
Hughes, E. B. et al. , IEEE Trans. Nucl. Sci. NS-27, 364 (1988).
Jensen, C. M., CALOR/VAX Users Manual, Applied Science Corporation, Landover, MD (1990).
Ka_bach, G. et al. , Proc. of the Gamma Ray Observatory Workshop, 2-1 (1989).
Ka_bach, G. et al. , A & A Suppl. Series 97, 349 (1993).
Kane, S. R., et al. , ApJ (Letters) 300, L95 (1986).
Kocharov, G. E., et al. , Proc. 23rd Int. Cosmic Ray Conf. 3, 123 (1993).
Lingenfelter, R. E., Sol. Phys. 8, 341 (1969).
Lingenfelter, R. E. and Ramaty, R., in B. S. P. Shen (ed.), High-Energy Nuclear Reactions in
Astrophysics, W. A. Benjamin, Inc., New York, 99 (1967).
Ma_dzhavidze, N., a_nd Ramaty, R., ApJ 389,739 (1992).
Mandzhavidze, N., and Ramaty, R., Nuclear Physics B. Proc. Suppl. 33, 141 (1993).
Mandzhavidze, N., Ramaty, R., Bertsch, D. L., and Schneid, E. J., *** (1996).
Muraki, Y., et aI. , ICCR-Report-248-91-17, ICCR, Univ. of Tokyo (1991).
Murphy, R. J. and Ramaty, R., Advances in Space Research 4 #7, 127 (1985).
Murphy, R. J., Dermer, C. D., and Ramaty, R., ApJ Suppl. 63,721 (1987).
Nelson, W. R., The EGS4 Code System, SLAC-265, Stanford Linear Accelerator Center, December
(1985).
Press, W. H. et al. , Numerical Recipes: The Art of Scientific Computing, Cambridge University
Press, Cambridge, pp. 523-528 (1989).
Prince, T. A., et al. , Proc. 18th Int. Cosmic Ray Conf. 4, 79 (1983).
Rank, G., et al. , in J. M. Ryan and W. T. Vestrand (eds.), High-Energy Solar Phenomena, AIP,
New York, 100 (1994).
Rank, G. et al. , Proc. 25th Int. Cosmic Ray Conf. **, 5 (1997).
Ryan, J. M., and Lee, M. A., ApJ 368, 316 (1991).
Ryan, J. M., et al. , in J. M. Ryan and W. T. Vestrand (eds.), High-Energy Solar Phenomena,
AIP, New York, 89 (1994).
Shea, M. A., Smart, D. F., and Pyle, K. R., Geophys. Res. Letters 18, 1655 (1991).
Smart, D. F., et al., ApJ (Supplement) 73,269 (1990).
Solar Geophysical Data.
Takahashi, K., et al. , Proc. 22nd Int. Cosmic Ray Conf. 3, 37 (1991).
Thompson, D. J., et al. , Ap. J. Suppl. Set. 86, 629 (1993).
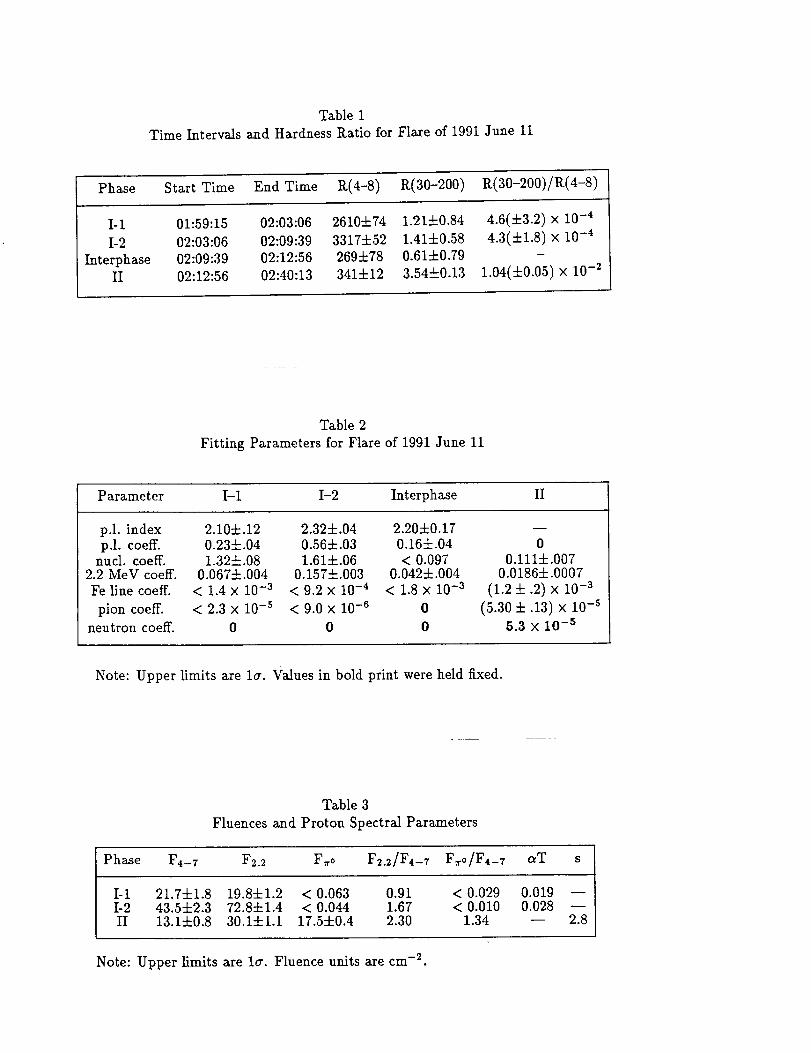
Table1TimeIntervalsandHardnessRatiofor Flareof 1991 June 11
Phase Start Time End Time R(4-8) R(30-200) R(30-200)/R(4-8)
I-1 01:59:15 02:03:06 2610±74 1.21±0.84 4.6(±3.2) × 10 -4
I-2 02:03:06 02:09:39 3317±52 1.41±0.58 4.3(±1.8) × 10 -4
Interphase 02:09:39 02:12:56 269±78 0.61±0.79II 02:12:56 02:40:13 341±12 3.54±0.13 1.04(±0.05) x 10 -2
Table 2
Fitting Parameters for Flare of 1991 June 11
Parameter I-1 I-2 Interphase II
p.1. index 2.10±.12 2.32±.04 2.20±0.17 --p.1. coeff. 0.23±.04 0.56±.03 0.16±.04 0
nucl. coeff. 1.32±.08 1.61±.06 < 0.097 0.111±.0072.2 MeV coeff. 0.067±.004 0.157±.003 0.042±.004 0.0186±.0007
Felinecoeff. < 1.4x 10 -3 <9.2x 10⁻⁴ < 1.8x10 -3 (1.2±.2)×10 -3
pion coeff. < 2.3 x 10 -s < 9.0 × 10⁻⁶ 0 (5.30 =t: .13) x 10 -s
neutron coeff. 0 0 0 5.3 x 10 -5
Note: Upper limits are la. Values in bold print were held fixed.
Table 3
Fluences and Proton Spectral Parameters
Phase F4-T F2.2 F=o F2.2/F4-7 F,_o/F4_7 aT s
I-I 21.7±1.8 19.8±1.2 < 0.063 0.91 < 0.029 0.019 --I-2 43.5±2.3 72.8±1.4 < 0.044 1.67 < 0.010 0.028 --II 13.1±0.8 30.1±1.1 17.5±0.4 2.30 1.34 -- 2.8
Note: Upper limits are I_. Fluence units are cm -2.

FIGURE CAPTIONS
Figure 1. Monte Carlo simulation of the response of the EGRET/TASC to 200 MeV neutrons.
Responses to both a cylindrical beam of neutrons which extends outside the EGRET envelope
(solid line) and a thin pencil beam (dashed line) axe shown.
Figure 2. Time history of the response of the TASC during the flare of 11 June 1991 in several
energy-loss bands. Background has been subtracted. Demarcations of the phases discussed in the
text axe shown.
Figure 3. Plots of the energy-loss spectra (background subtracted) observed by the TASC. The
spectra were fit with a multi-component model spectrum described in the text.
Figure 4. The fluence ratios F2.2/F4-7 and F_0/F4_7 are plotted for two proton spectral shapes:
(a) a Bessel function in energy characterized by parameter aT and (b) a power law in energy with
index -s. The curves are theoretical values based on calculations by Murphy and Ramaty (1985).
The thickened sections correspond to the values observed for 3 time periods (I-l, I-2, and II) during
the flare of 11 June 1991.

-110
>
_; 10 -2
[.J
"_ O_ 3;5 1__c
-410
CALOR SIMULATION RESULTS
4-- 6.0xt0 events, cylinder beam, O1-FEB-95
(rexten=tO em)8
5.0xlO events, pencit beam, 14-FEB-94
!,'" ! ,,:', _= |t 0" '_ _ '= _i 8 = 0
' " i_i !i'! _ _" !1 _ = 0
o
En = 200 MeV' _ ' 1 ___
i!!;
• !il | .i,, i i
ii _: i i
__iI ii:i _ = == 'i_ ;
o:i _ :_ii d ii I m
l'ii=!'_= !i, l,, ,,w__1 ,_ , , , , , , .....
10 100 1000
Response (MeV)
Figure i.

40000
tj
m 30000
_r3
c4
c-D0
20000
10000
0
-10000
40000
_J
30000
L£)r-,-
c4f,-.)
(y}
c-
O(J
; 1000
-1000
1000 _
t_
c4
I-i I-2 Int.
<
II
-,,.
2.0-2.4 tvleV
- T +q--F '{-F-]--FT-F7--1-T-T-T-t -r--F-F-'[
4.0-o.4 M _,_,'
] -Ff -F F-T-T -T--r- F-F-FI-r-T-F F-T- r- F-]
50 -
150 - 200
11.09 11.10 11.11
Time ( day on June, 1991 )
11.12
Figure 2.

O(b
CO
I>(D
03
(-
OC_)
I0000 O0
1000 O0
I O0 00
10.00
I00
0.10
0.01
10000 O0
I000.00
10000
10.00
I .00
10000.00
1OOOOO
I O0 O0
10.00
I.O0
0.10
OO1
10000.00 I
1000.00 "
I00.00
I000
1.00
0.10
0.01
_,_,, PHASE I- 1
_" ._ PHASE I-2
'k
l_hlkh,h
.. III'l_Li%....,,.,......
i i
PHASE II
I__\11 _I I
PfON-OECAY _MMA_"_._I_ L ,
t
NEUTRONS
I0 100
Energy (MeV)
Figure 3.

0
I--<rr
100.000
I0.000
1.000
0.100
0.010
FLUENCE RATIOS FOR BESSEL FUNCTION PROTON SPECTRA, T i i r j I _ i 1 1 _ i
0.001
0.001
F2.2
/y2/i_ -7
I I I I II I [ I , , , , i i J I
0.010 0.100
aT
a
I ' ' ' ' ' '
.000
(/I
0
<rw
100.000
10.000
1.000
0.I00
0.010
0.001
2
FLUENCE RATIOS FOR POWER LAW PROTON SPECTRA
II
4
S
5 6
Figure 4.