challenges from stabilization ation to to growth 2q 3q 4q 1q 2q 3q 4q 1q 2q 3q 4q 1q 2q 3q 4q 1q 2q...
TRANSCRIPT
1CLSA 2010
Copyright© 2010 Anritsu Corporation. All rights reserved
Challenges Challenges from stabilizfrom stabilizationation toto growthgrowth
TSE symbol : 6754(http://www.anritsu.co.jp/e/ir)
February 25th, 2010 – CLSA Japan Forum
Hiromichi TodaPresidentAnritsu Corporation
2CLSA 2010
All information contained in this release which pertains to the current plans, estimates, strategies and beliefs of Anritsu Corporation (hereafter "Anritsu") that is not historical fact shall be considered forward- looking statements of future business results or other forward-looking projections pertinent to the business of Anritsu. Implicit in reliance on these and all future projections is the unavoidable risk, caused by the existence of uncertainties about future events, that any and all suggested projections may not, come to pass. Forward-looking statements include but are not limited to those using words such as "believe", "expect", "plans", "strategy", "prospects", "forecast", "estimate", "project", "anticipate", "may" or "might" and words of similar meaning in connection with a discussion of future operations or financial performance.
Actual business results are the outcome of a number of unknown variables and may substantially differ from the figures projected herein.Factors which may affect the actual business results include but are not limited to the economic situation in the geographic areas in which Anritsu conducts business, including but not limited to, Japan, Americas, Asia, and Europe, changes in actual demand for Anritsu products and services, increases or decreases in the competitive nature of markets in which Anritsu sells products or buys supplies, changing aptitudes at providing services, and exchange rates.
You also should not place reliance on any obligation of Anritsu to update or revise any forward-looking statements, whether as a result of new information, future events or otherwise. Anritsu disclaims any such obligation.
Cautionary Statement
3CLSA 2010
Agenda
Overview of business
Mid-term goal
Test & Measurement (T&M) Market and actions
4CLSA 2010
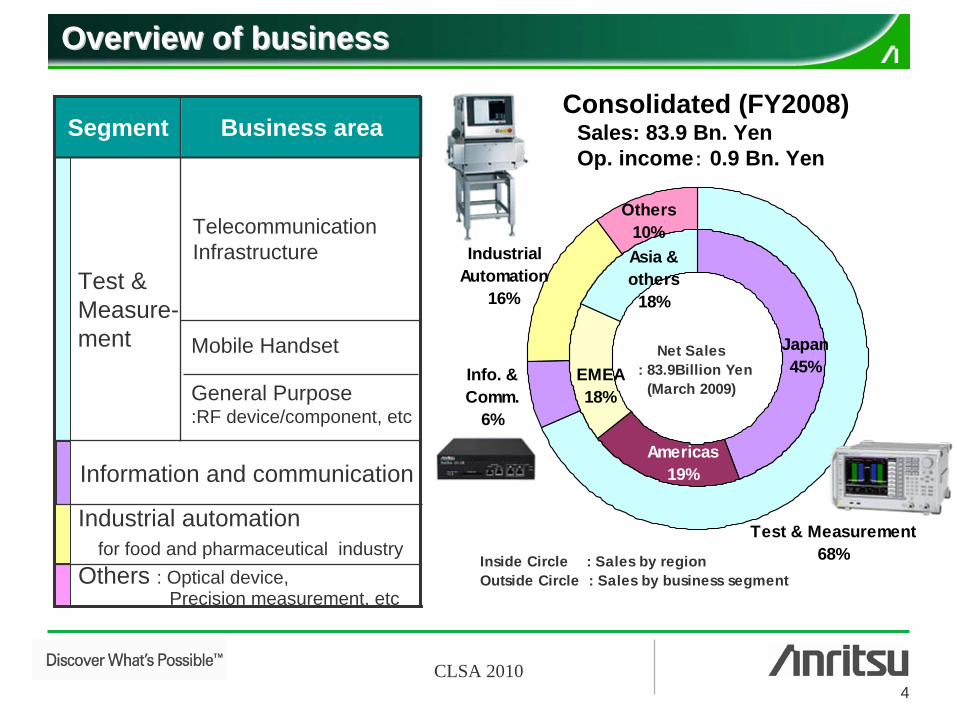
Overview of businessOverview of business
Consolidated (FY2008)Sales: 83.9 Bn. YenOp. income:
0.9 Bn. Yen
Others : Optical device, Precision measurement, etc
Industrial automationfor food and pharmaceutical industry
Information and communication
General Purpose:RF device/component, etc
Mobile Handset
Telecommunication Infrastructure
Test & Measure- ment
Business areaSegment
Japan45%
Americas19%
EMEA18%
Asia &others
18%
IndustrialAutomation
16%
Others10%
Test & Measurement68%
Info. &Comm.
6%
Inside Circle : Sales by regionOutside Circle : Sales by business segment
Net Sales : 83.9Billion Yen
(March 2009)
5CLSA 2010
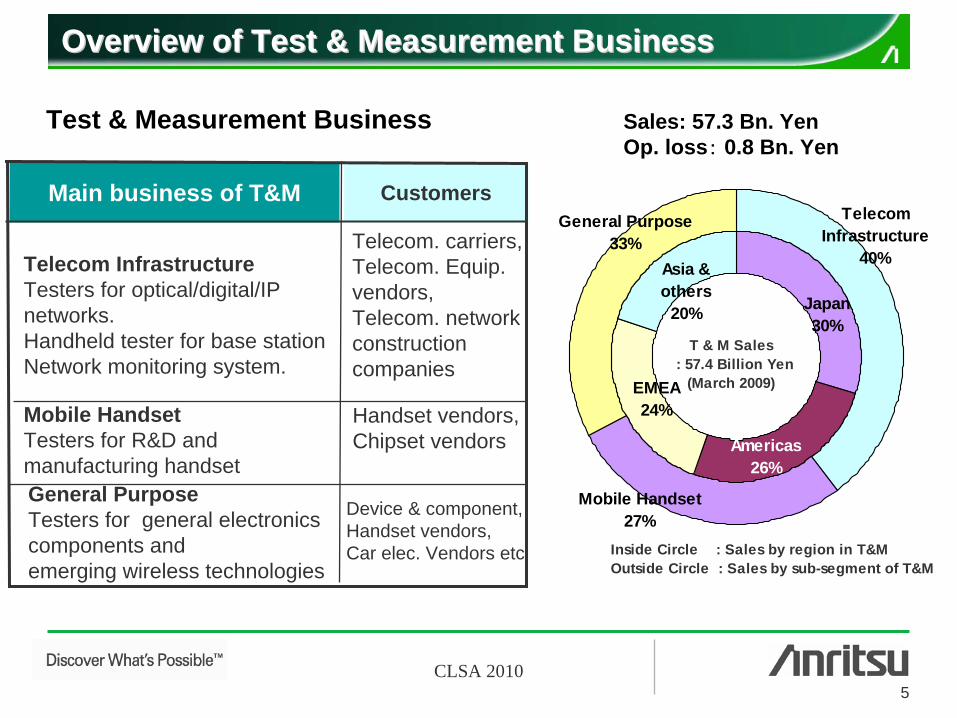
Japan30%
Americas26%
EMEA24%
Asia &others
20%
Inside Circle : Sales by region in T&MOutside Circle : Sales by sub-segment of T&M
Mobile Handset27%
TelecomInfrastructure
40%
General Purpose33%
T & M Sales : 57.4 Billion Yen
(March 2009)
OOverviewverview of of Test & Measurement BusinessTest & Measurement Business
Sales: 57.3 Bn. YenOp. loss:
0.8 Bn. YenTest & Measurement Business
Mobile HandsetTesters for R&D and manufacturing handsetGeneral PurposeTesters for general electronics components and emerging wireless technologies
Telecom InfrastructureTesters for optical/digital/IP networks.Handheld tester for base stationNetwork monitoring system.
Main business of T&M
Handset vendors, Chipset vendors
Device & component, Handset vendors, Car elec. Vendors etc
Telecom. carriers, Telecom. Equip. vendors,Telecom. network construction companies
Customers
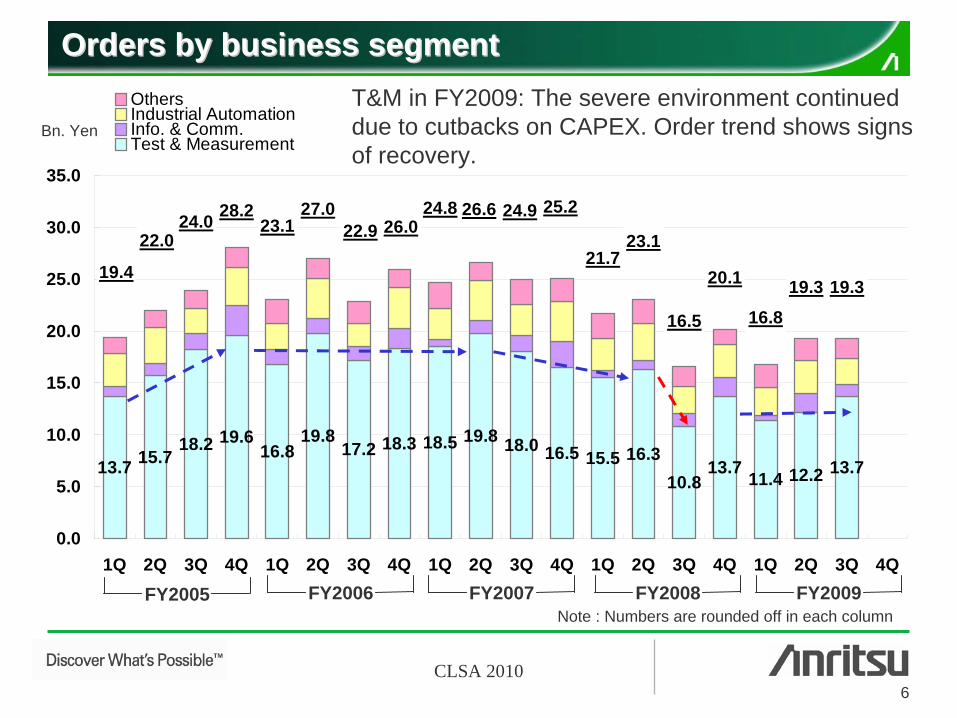
6CLSA 2010
13.7 15.718.2 19.6
16.819.8
17.2 18.3 18.5 19.8 18.0 16.5 15.5 16.310.8
13.7 11.4 12.2 13.7
21.723.1
16.5
20.1
16.819.3 19.3
25.226.624.826.022.9
27.023.1
28.224.022.0
19.4
24.9
0.0
5.0
10.0
15.0
20.0
25.0
30.0
35.0
1Q 2Q 3Q 4Q 1Q 2Q 3Q 4Q 1Q 2Q 3Q 4Q 1Q 2Q 3Q 4Q 1Q 2Q 3Q 4Q
OthersIndustrial AutomationInfo. & Comm.Test & Measurement
Orders by business segmentOrders by business segment
Note : Numbers are rounded off in each column
Bn. Yen
FY2005 FY2006 FY2007 FY2008 FY2009
T&M in FY2009: The severe environment continued due to cutbacks on CAPEX. Order trend shows signs of recovery.
7CLSA 2010
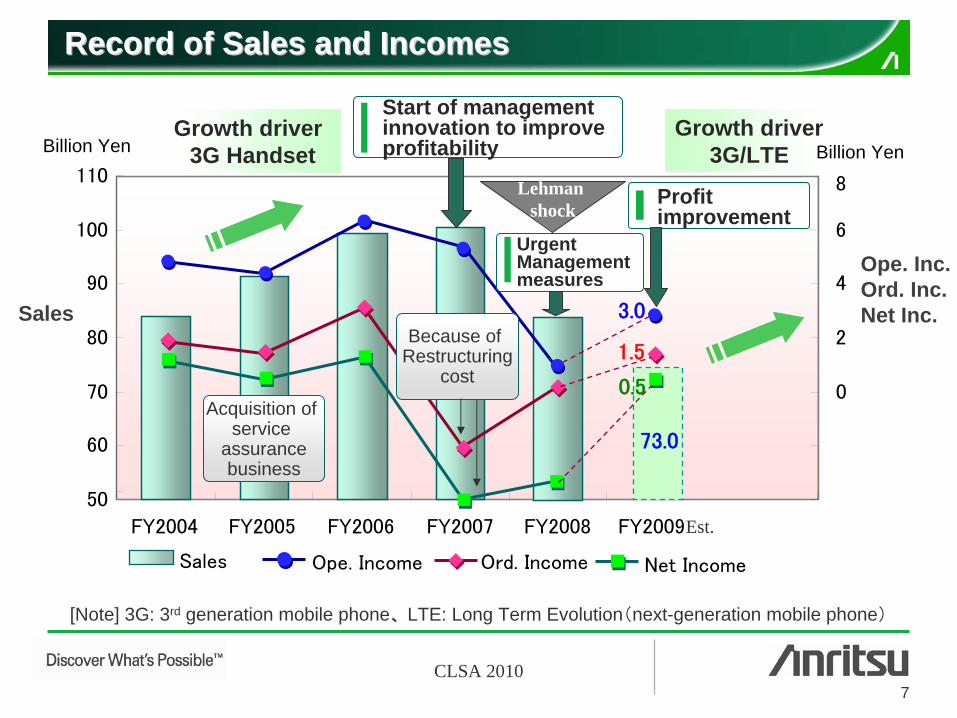
73.0
3.0
1.5
0.5
FY2004 FY2005 FY2006 FY2007 FY2008
Sales Ope.
Income Ord. Income Net Income
RecordRecord of Sales and Incomeof Sales and Incomess
Sales
Billion Yen
50
60
70
80
90
100
110
0
2
4
6
8
Est.FY2009
Ope. Inc.Ord. Inc.Net Inc.
Lehman shock
Start of management innovation to improve profitability
Urgent Management measures
Growth driver3G Handset
Acquisition of service
assurancebusiness
Growth driver3G/LTE
Profit improvement
[Note] 3G: 3rd generation mobile phone、
LTE: Long Term Evolution(next-generation mobile phone)
Billion Yen
Because of Restructuring
cost
8CLSA 2010
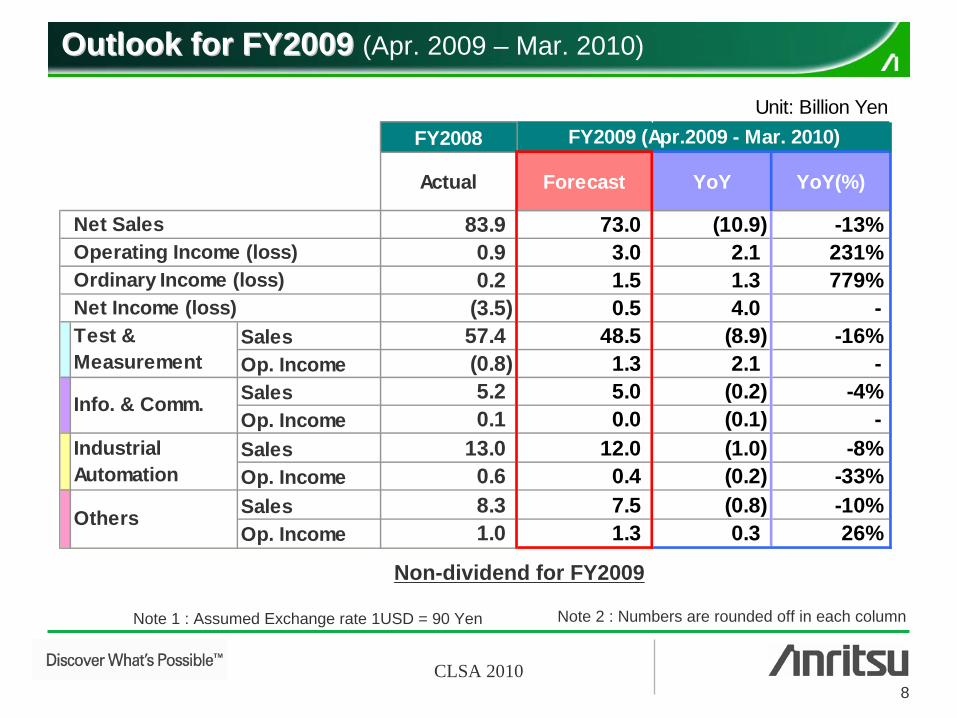
Outlook for FY200Outlook for FY20099 (Apr. 2009 – Mar. 2010)
Note 2 : Numbers are rounded off in each columnNote 1 : Assumed Exchange rate 1USD = 90 Yen
Non-dividend for FY2009
Unit: Billion YenFY2008
Actual Forecast YoY YoY(%)
83.9 73.0 (10.9) -13%0.9 3.0 2.1 231%0.2 1.5 1.3 779%
(3.5) 0.5 4.0 - Sales 57.4 48.5 (8.9) -16%Op. Income (0.8) 1.3 2.1 - Sales 5.2 5.0 (0.2) -4%Op. Income 0.1 0.0 (0.1) - Sales 13.0 12.0 (1.0) -8%Op. Income 0.6 0.4 (0.2) -33%Sales 8.3 7.5 (0.8) -10%Op. Income 1.0 1.3 0.3 26%
FY2009 (Apr.2009 - Mar. 2010)
Net Sales
Net Income (loss)
Others
Operating Income (loss)Ordinary Income (loss)
Info. & Comm.
IndustrialAutomation
Test &Measurement
9CLSA 2010
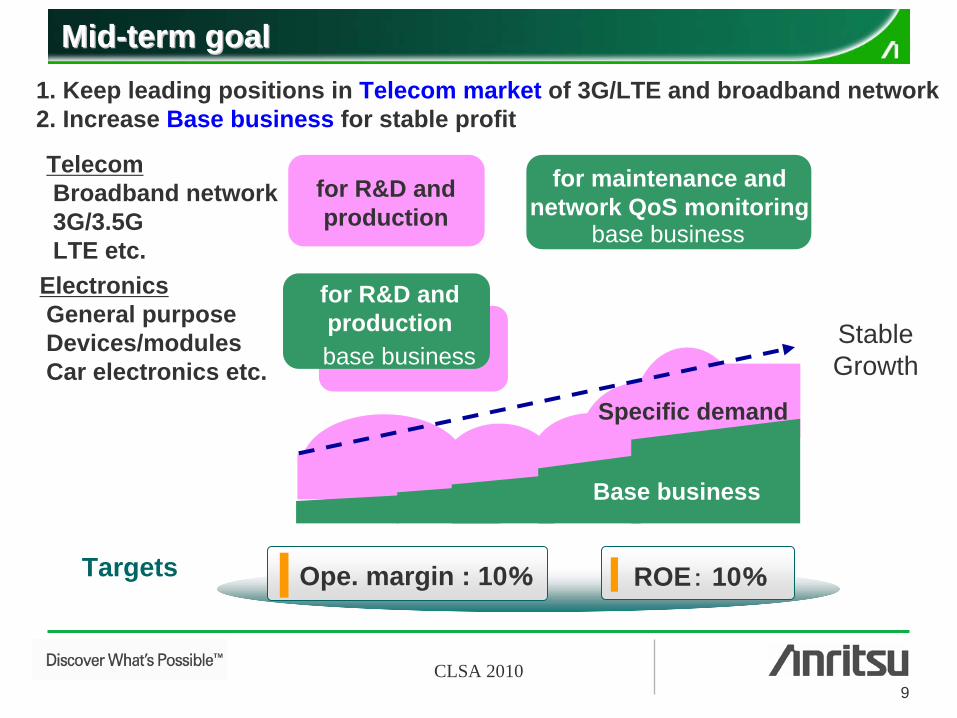
ElectronicsGeneral purposeDevices/modulesCar electronics etc.
TelecomBroadband network3G/3.5GLTE etc.
1. Keep leading positions in Telecom market of 3G/LTE and broadband network2. Increase Base business for stable profit
for maintenance and network QoS monitoring
Stable Growth
for R&D and production
base business
base business
Specific demand
for R&D and production
MidMid--term goalterm goal
Base business
ROE:
10%Ope. margin : 10%Targets
10CLSA 2010
T&M Market trend and actions
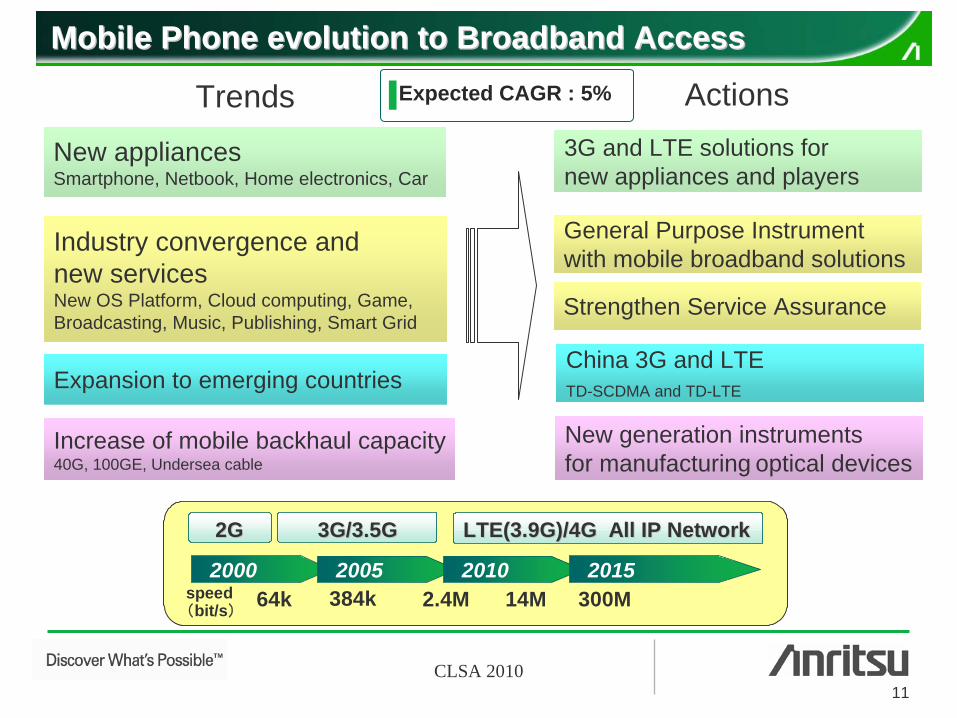
Mobile Phone evolution to Broadband Access
Handset and Smartphone
3G in China
LTE
Carrier CAPEX and Data traffic, RF device
11CLSA 2010
New appliancesSmartphone, Netbook, Home electronics, Car
Increase of mobile backhaul capacity40G, 100GE, Undersea cable
Industry convergence and new servicesNew OS Platform, Cloud computing, Game,Broadcasting, Music, Publishing, Smart Grid
Expansion to emerging countries
Trends Actions3G and LTE solutions for new appliances and players
New generation instrumentsfor manufacturing optical devices
General Purpose Instrumentwith mobile broadband solutions
China 3G and LTETD-SCDMA and TD-LTE
Strengthen Service Assurance
Mobile Phone evolution to Broadband AccessMobile Phone evolution to Broadband AccessExpected CAGR : 5%
2000 2005 2010 2015speed(bit/s)
64k 384k 2.4M 14M 300M
2G2G 3G/3.5G3G/3.5G LTE(3.9GLTE(3.9G)/4G)/4G All IP NetworkAll IP Network
2000 2005 2010 2015speed(bit/s)
64k 384k 2.4M 14M 300M
2G2G 3G/3.5G3G/3.5G LTE(3.9GLTE(3.9G)/4G)/4G All IP NetworkAll IP Network
12CLSA 2010
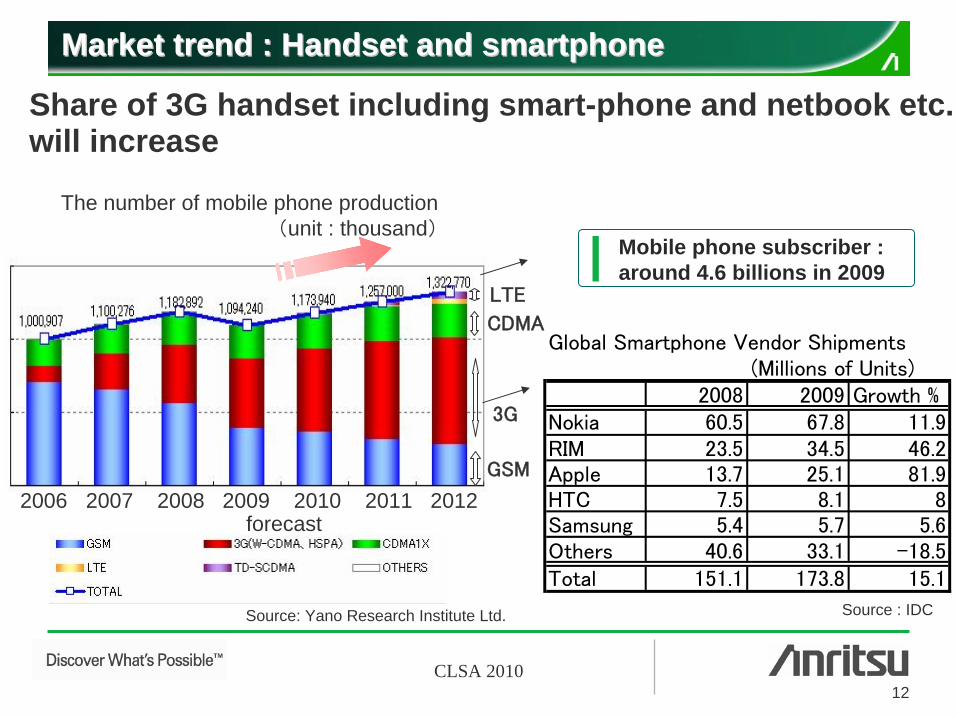
MMarket trendarket trend : Handset and : Handset and smartphonesmartphone
3G
CDMA
GSM
Source: Yano Research Institute Ltd.
LTE
The number of mobile phone production(unit : thousand)
Global Smartphone Vendor Shipments(Millions of Units)
2008 2009 Growth %Nokia 60.5 67.8 11.9RIM 23.5 34.5 46.2Apple 13.7 25.1 81.9HTC 7.5 8.1 8Samsung 5.4 5.7 5.6Others 40.6 33.1 -18.5Total 151.1 173.8 15.1
Source : IDC
2006 2007 2008 2009 2010 2011 2012forecast
Share of 3G handset including smart-phone and netbook etc. will increase
Mobile phone subscriber : around 4.6 billions in 2009
13CLSA 2010
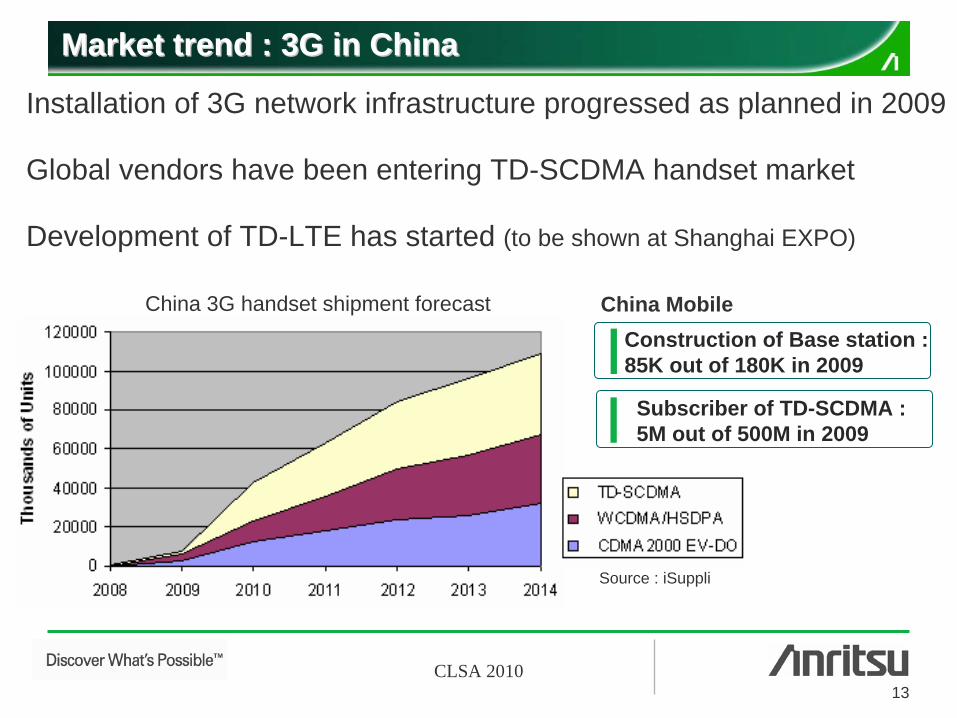
Market trend : 3G in China Market trend : 3G in China
Source : iSuppli
China 3G handset shipment forecast
Installation of 3G network infrastructure progressed as planned in 2009
Global vendors have been entering TD-SCDMA handset market
Development of TD-LTE has started (to be shown at Shanghai EXPO)
Subscriber of TD-SCDMA : 5M out of 500M in 2009
Construction of Base station : 85K out of 180K in 2009
China Mobile
14CLSA 2010
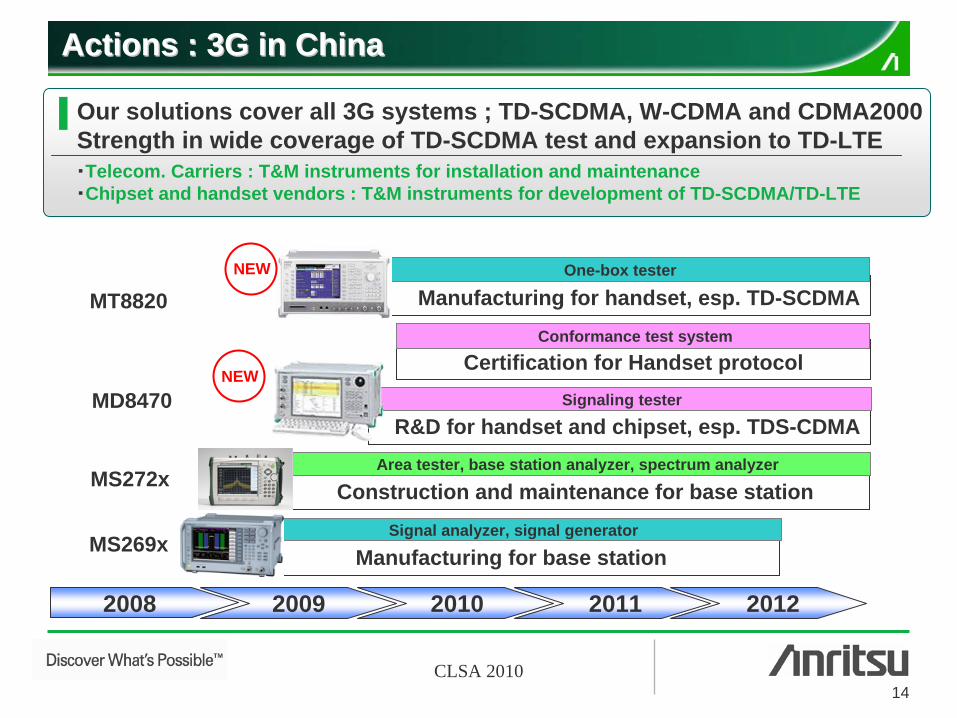
2008 2009 2010 2011 2012
Manufacturing for base station
Manufacturing for handset, esp. TD-SCDMA
Construction and maintenance for base station
One-box tester
Area tester, base station analyzer, spectrum analyzer
Signal analyzer, signal generator
Our solutions cover all 3G systems ; TD-SCDMA, W-CDMA and CDMA2000Strength in wide coverage of TD-SCDMA test and expansion to TD-LTE・Telecom. Carriers : T&M instruments for installation and maintenance・Chipset and handset vendors : T&M instruments for development of TD-SCDMA/TD-LTE
Actions Actions :: 3G in China3G in China
R&D for handset and chipset, esp. TDS-CDMASignaling tester
NEWCertification for Handset protocol
Conformance test system
NEW
MT8820
MD8470
MS272x
MS269x
15CLSA 2010
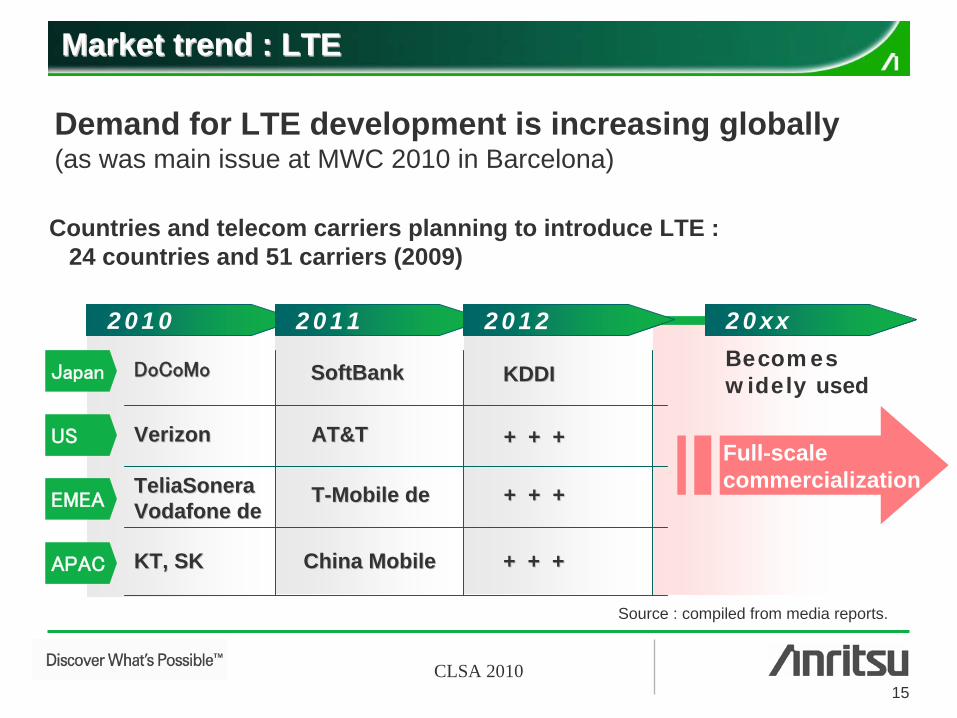
Market trendMarket trend : : LTELTE
Demand for LTE development is increasing globally(as was main issue at MWC 2010 in Barcelona)
Countries and telecom carriers planning to introduce LTE : 24 countries and 51 carriers (2009)
Source : compiled from media reports.
2010 2011 2012 20xx
DoCoMoDoCoMo
VerizonVerizon
TeliaSoneraTeliaSoneraVodafone deVodafone de
KT, SKKT, SK
SoftBankSoftBank
AT&TAT&T
China MobileChina Mobile
TT--Mobile deMobile de
KDDIKDDI
+ + ++ + +
+ + ++ + +
+ + ++ + +
Becomes widely usedJapan
US
EMEA
APAC
Full-scale commercialization
16CLSA 2010
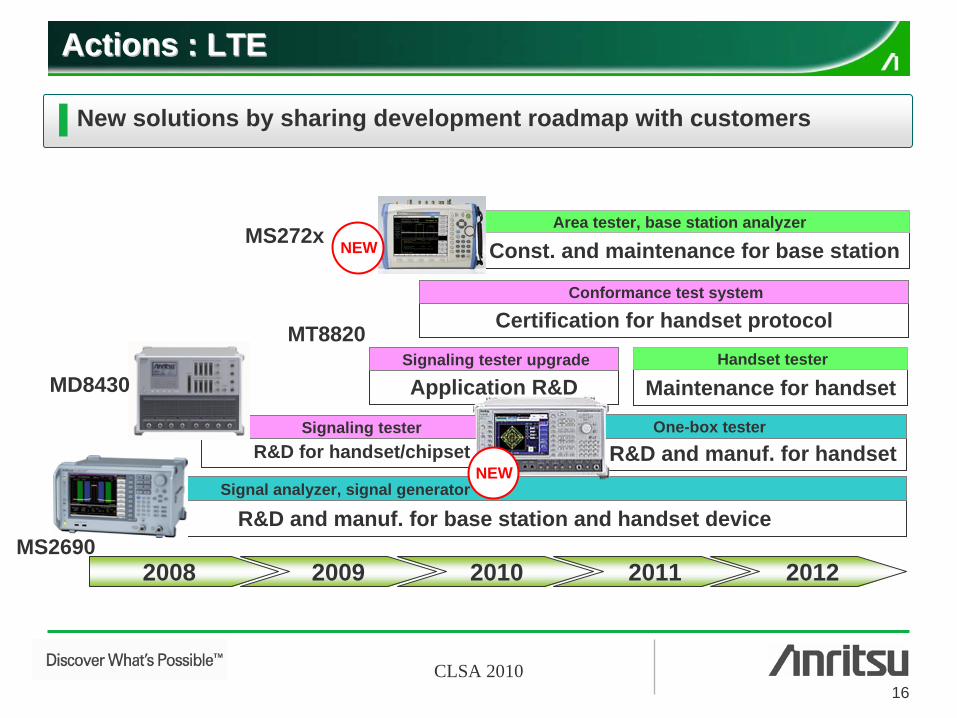
Actions Actions :: LTELTE
2008 2009 2010 2011 2012
R&D and manuf. for base station and handset device
R&D for handset/chipset R&D and manuf. for handset
Const. and maintenance for base station
One-box tester
Certification for handset protocol
Application R&D Maintenance for handset
Conformance test system
Signaling tester upgrade Handset tester
Area tester, base station analyzer
Signaling tester
Signal analyzer, signal generator
NEW
New solutions by sharing development roadmap with customers
NEW
MD8430
MS2690
MS272x
MT8820
17CLSA 2010
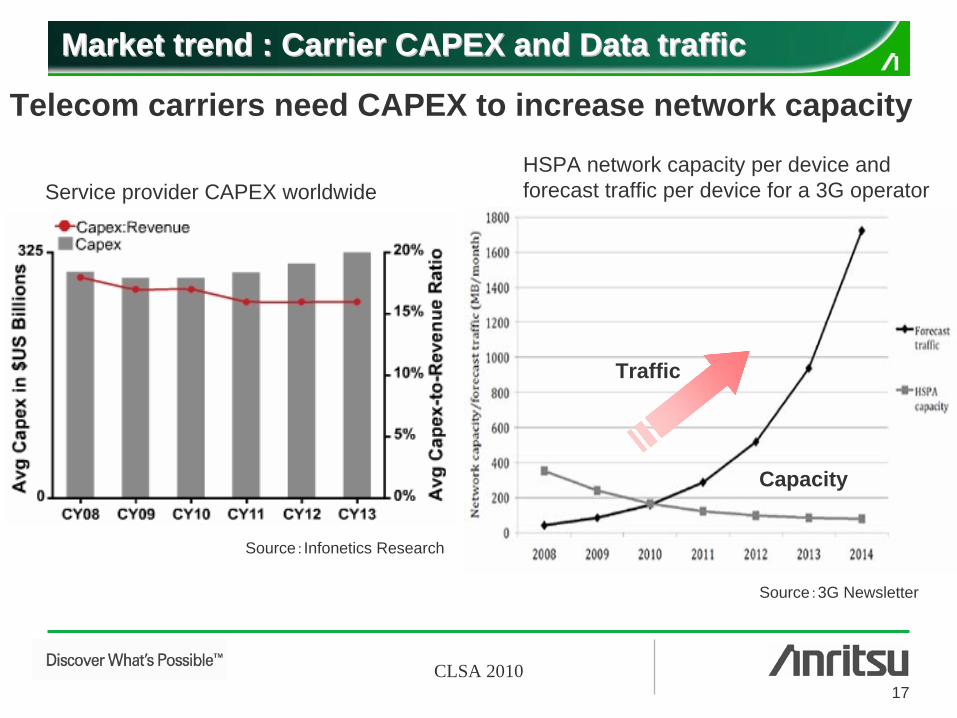
MMarket trendarket trend : Carrier CAPEX and Data traffic: Carrier CAPEX and Data traffic
Telecom carriers need CAPEX to increase network capacity
Source:3G Newsletter
Traffic
Capacity
HSPA network capacity per device and forecast traffic per device for a 3G operator
Source:Infonetics Research
Service provider CAPEX worldwide
18CLSA 2010
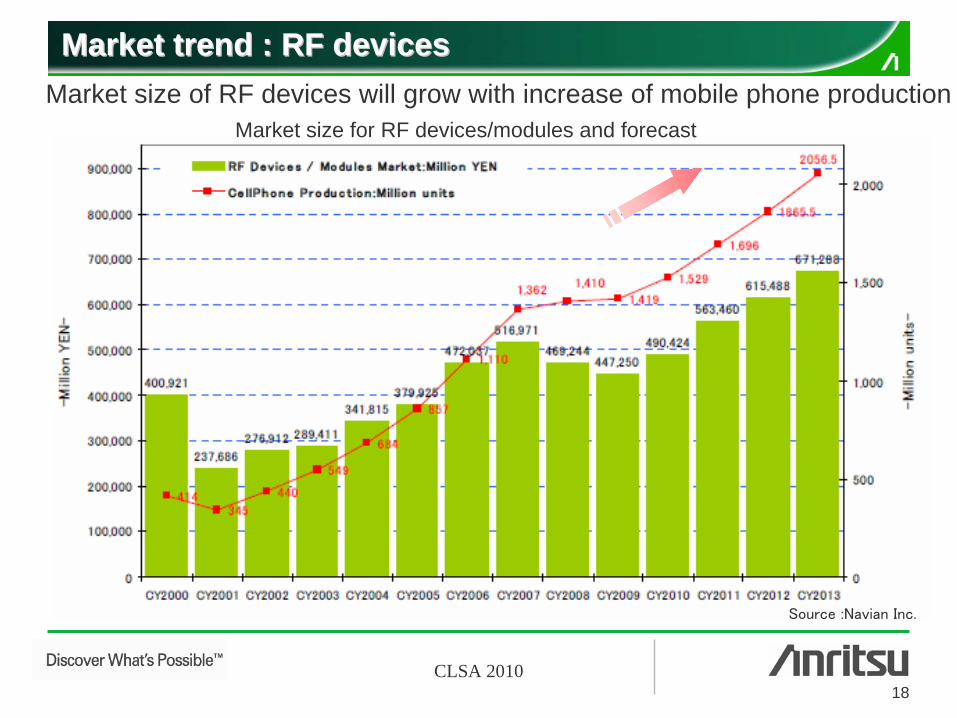
MMarket trendarket trend : RF devices: RF devices
Source :Navian Inc.
Market size for RF devices/modules and forecastMarket size of RF devices will grow with increase of mobile phone production
19CLSA 2010
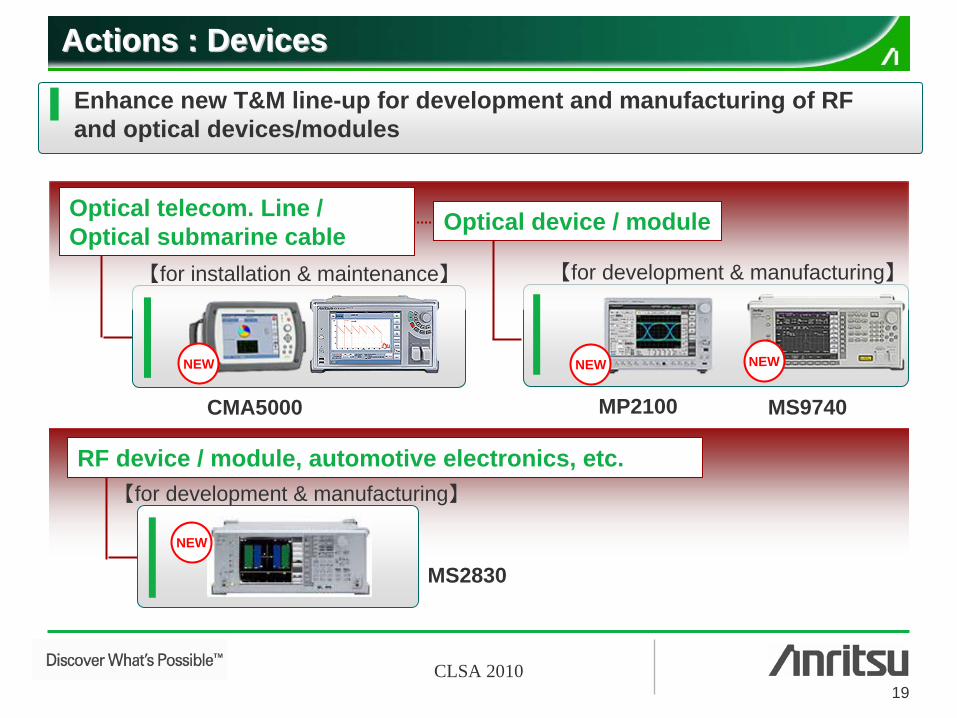
Optical telecom. Line / Optical submarine cable Optical device / module
NEW NEWNEW
【for development & manufacturing】【for installation & maintenance】
AActions : Devicesctions : Devices
【for development & manufacturing】
NEW
RF device / module, automotive electronics, etc.
Enhance new T&M line-up for development and manufacturing of RF and optical devices/modules
MS2830
MP2100 MS9740CMA5000

Appendix
21CLSA 2010
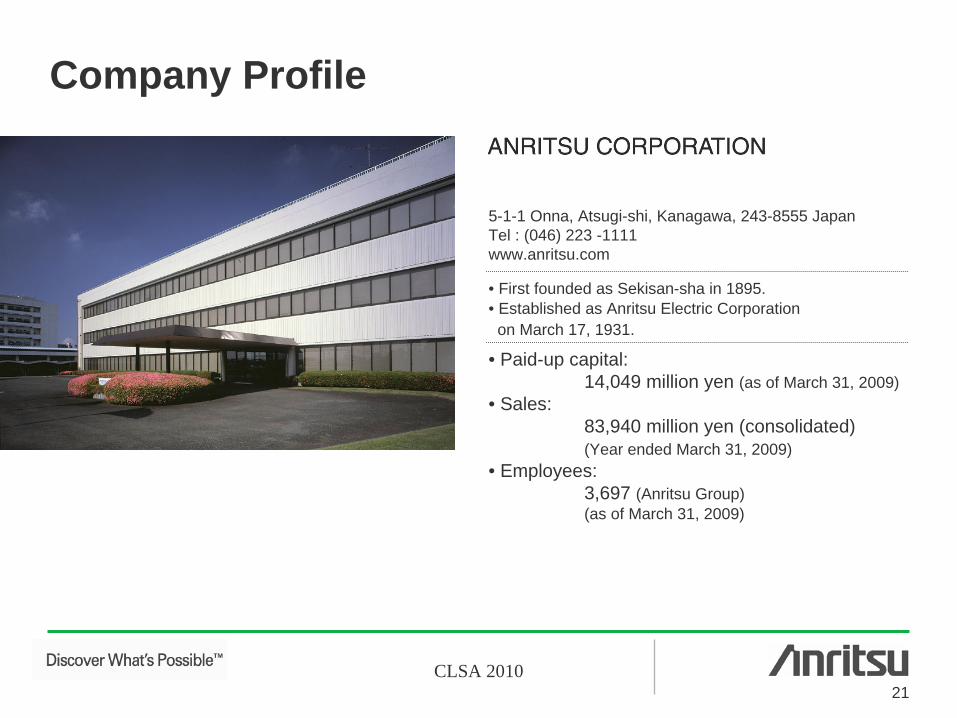
Company Profile
• Paid-up capital:14,049 million yen (as of March 31, 2009)
• Sales:83,940 million yen (consolidated)(Year ended March 31, 2009)
• Employees:3,697 (Anritsu Group)(as of March 31, 2009)
5-1-1 Onna, Atsugi-shi, Kanagawa, 243-8555 JapanTel : (046) 223 -1111www.anritsu.com
• First founded as Sekisan-sha in 1895.• Established as Anritsu Electric Corporation
on March 17, 1931.
22CLSA 2010
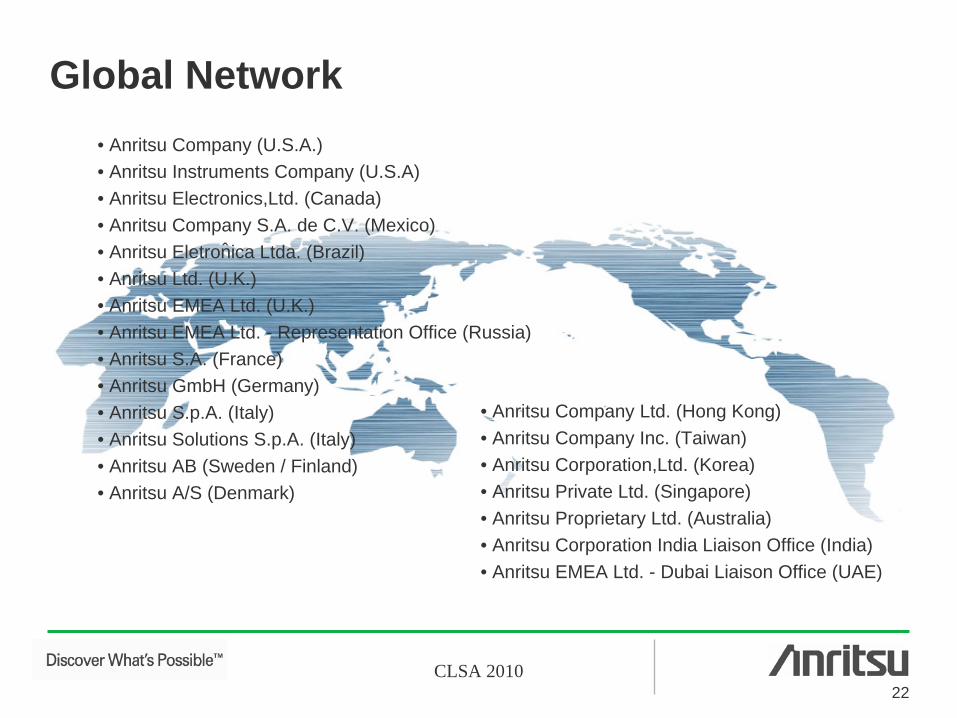
Global Network
• Anritsu Company Ltd. (Hong Kong)• Anritsu Company Inc. (Taiwan)• Anritsu Corporation,Ltd. (Korea)• Anritsu Private Ltd. (Singapore)• Anritsu Proprietary Ltd. (Australia)• Anritsu Corporation India Liaison Office (India)• Anritsu EMEA Ltd. - Dubai Liaison Office (UAE)
ˆ
• Anritsu Company (U.S.A.)• Anritsu Instruments Company (U.S.A)• Anritsu Electronics,Ltd. (Canada)• Anritsu Company S.A. de C.V. (Mexico)• Anritsu Eletronica Ltda. (Brazil)• Anritsu Ltd. (U.K.)• Anritsu EMEA Ltd. (U.K.)• Anritsu EMEA Ltd. - Representation Office (Russia)• Anritsu S.A. (France)• Anritsu GmbH (Germany)• Anritsu S.p.A. (Italy)• Anritsu Solutions S.p.A. (Italy)• Anritsu AB (Sweden / Finland)• Anritsu A/S (Denmark)
23CLSA 2010
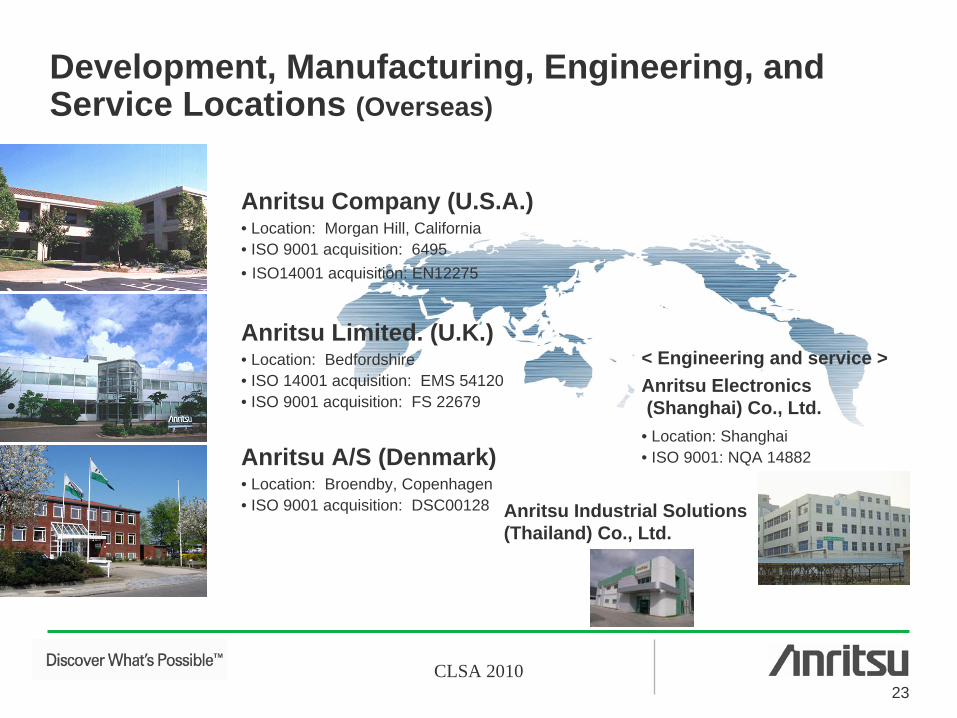
Anritsu Electronics(Shanghai) Co., Ltd.
• Location: Shanghai• ISO 9001: NQA 14882
< Engineering and service >
Development, Manufacturing, Engineering, and Service Locations (Overseas)
Anritsu Company (U.S.A.)• Location: Morgan Hill, California• ISO 9001 acquisition: 6495• ISO14001 acquisition: EN12275
Anritsu Limited. (U.K.)• Location: Bedfordshire• ISO 14001 acquisition: EMS 54120• ISO 9001 acquisition: FS 22679
Anritsu A/S (Denmark)• Location: Broendby, Copenhagen• ISO 9001 acquisition: DSC00128 Anritsu Industrial Solutions
(Thailand) Co., Ltd.
24CLSA 2010
24
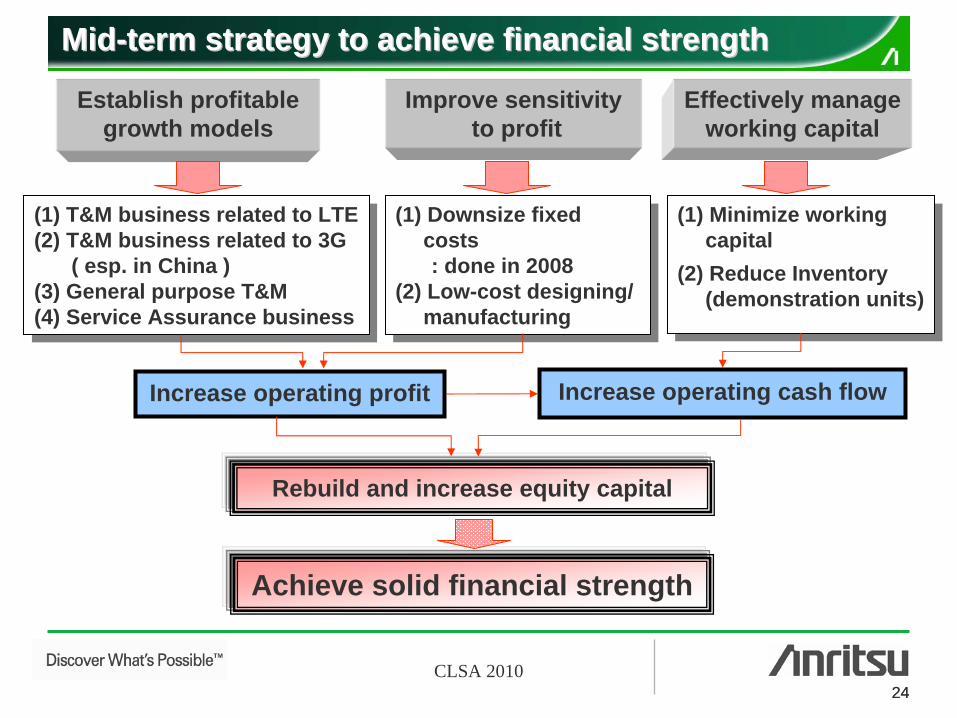
(1) T&M business related to LTE(2) T&M business related to 3G
( esp. in China ) (3) General purpose T&M (4) Service Assurance business
(1) T&M business related to LTE(2) T&M business related to 3G
( esp. in China )(3) General purpose T&M (4) Service Assurance business
(1) Downsize fixed costs : done in 2008
(2) Low-cost designing/ manufacturing
(1) Downsize fixed costs: done in 2008
(2) Low-cost designing/ manufacturing
(1) Minimize working capital
(2) Reduce Inventory (demonstration units)
(1) Minimize working capital
(2) Reduce Inventory (demonstration units)
Increase operating profit Increase operating cash flow
Rebuild and increase equity capital
Achieve solid financial strength
Establish profitable growth models
Improve sensitivityto profit
Effectively manage working capital
MidMid--term strategyterm strategy to achieve financial strengthto achieve financial strength
25CLSA 2010
2.11.6
2.31.9
2.21.70.3
1.7
2.4
(0.1) (0.9)
-2.0
-1.0
0.0
1.0
2.0
3.0
4.0
5.0
1Q 2Q 3Q 4Q 1Q 2Q 3Q 4Q 1Q 2Q 3Q
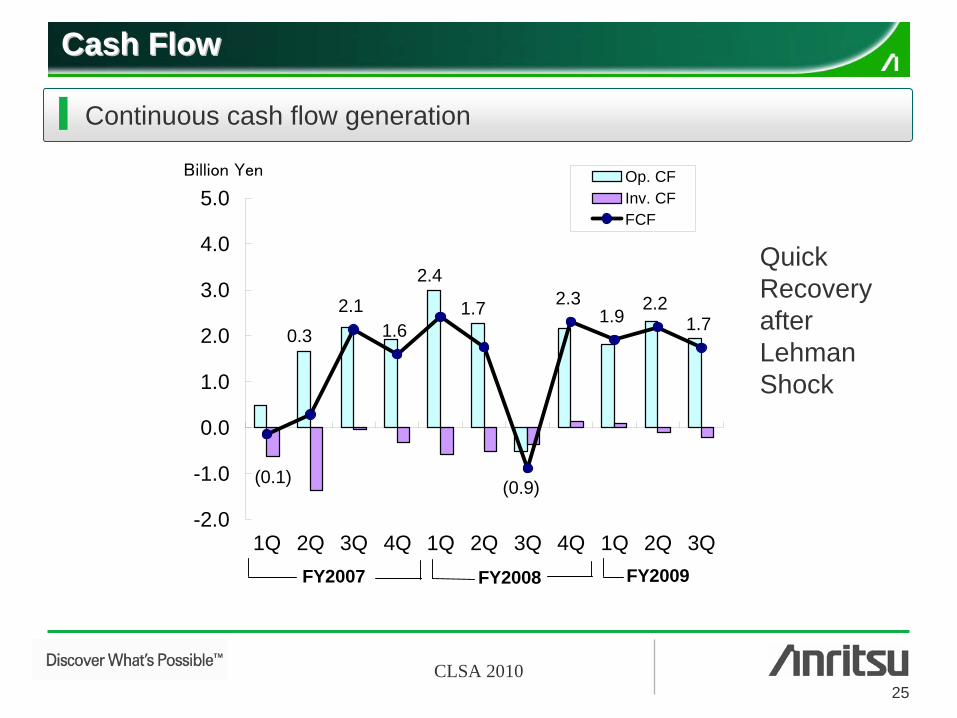
Op. CFInv. CFFCF
Billion Yen
FY2008 FY2009FY2007
Cash FlowCash Flow
Continuous cash flow generation
QuickRecoveryafterLehmanShock
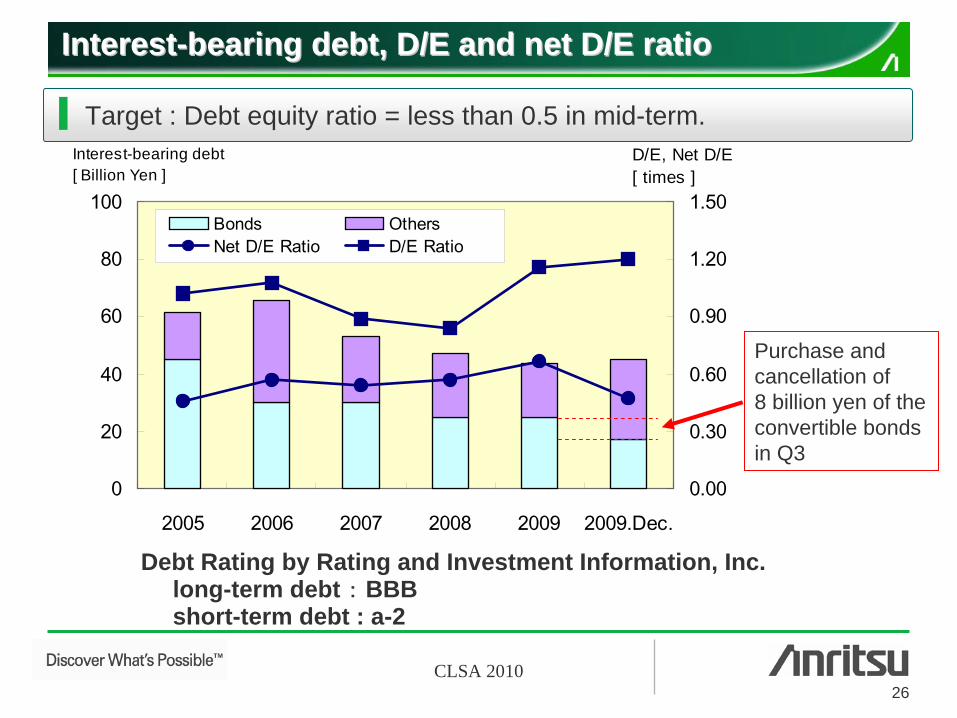
26CLSA 2010
InterestInterest--bearing debt, D/E and net D/E ratiobearing debt, D/E and net D/E ratio
Debt Rating by Rating and Investment Information, Inc.long-term debt :
BBB
short-term debt : a-2
Target : Debt equity ratio = less than 0.5 in mid-term.
0
20
40
60
80
100
2005 2006 2007 2008 2009 2009.Dec.0.00
0.30
0.60
0.90
1.20
1.50Bonds OthersNet D/E Ratio D/E Ratio
Interest-bearing debt[ Billion Yen ]
D/E, Net D/E[ times ]
Purchase and cancellation of 8 billion yen of the convertible bonds in Q3