challenges in designing appropriate scaffolding to improve
TRANSCRIPT
Challenges in designing appropriate scaffolding to improve students’representational consistency: The case of a Gauss’s law problem
Alexandru Maries,1 Shih-Yin Lin,2 and Chandralekha Singh31Department of Physics, University of Cincinnati, Cincinnati, Ohio 45221, USA
2Department of Physics, National Changhua University of Education, Changhua 500, Taiwan3Department of Physics and Astronomy, University of Pittsburgh, Pittsburgh, Pennsylvania 15260, USA
(Received 25 October 2016; published 2 August 2017)
Prior research suggests that introductory physics students have difficulty with graphing and interpretinggraphs. Here, we discuss an investigation of student difficulties in translating between mathematical andgraphical representations for a problem in electrostatics and the effect of increasing levels of scaffolding onstudents’ representational consistency. Students in calculus-based introductory physics were given a typicalproblem that can be solved using Gauss’s law involving a spherically symmetric charge distribution inwhich they were asked to write a mathematical expression for the electric field in various regions and thenplot the electric field. In study 1, we found that students had great difficulty in plotting the electric field as afunction of the distance from the center of the sphere consistent with the mathematical expressions invarious regions, and interviews with students suggested possible reasons which may account for thisdifficulty. Therefore, in study 2, we designed two scaffolding interventions with levels of support whichbuilt on each other (i.e., the second scaffolding level built on the first) in order to help students plot theirexpressions consistently and compared the performance of students provided with scaffolding with acomparison group which was not given any scaffolding support. Analysis of student performance withdifferent levels of scaffolding reveals that scaffolding from an expert perspective beyond a certain level maysometimes hinder student performance and students may not even discern the relevance of the additionalsupport. We provide possible interpretations for these findings based on in-depth, think-aloud studentinterviews.
DOI: 10.1103/PhysRevPhysEducRes.13.020103
I. INTRODUCTION
Physics is a challenging subject to learn and it is difficultfor introductory students to associate the abstract conceptsthey study in physics with more concrete representationsthat facilitate understandingwithout an explicit instructionalstrategy aimed to aid them in this regard. Without guidance,introductory students often employ formula orientedproblem-solving strategies instead of developing a solidgrasp of physical principles and concepts [1]. There aremany reasons to hypothesize thatmultiple representations ofconcepts along with the ability to construct, interpret, andtransform between different representations that correspondto the same physical system or process play a positive role inlearning physics. First, physics experts often use multiplerepresentations as a first step in a problem-solving process[1–4], anddiagrammatic representations have been shown tobe superior to exclusively employing verbal representationswhen solving problems [5–7]. Second, students who are
taught explicit problem-solving strategies emphasizingthe use of different representations of knowledge atvarious stages of problem solving construct higher-qualityand more complete representations and perform betterthan students who learn traditional problem-solving strat-egies [8]. Third, multiple representations are very usefulin translating the initial, mostly verbal description of aproblem into a representation more suitable to mathemati-cal manipulation [9,10], partly because the process ofconstructing a representation of a problem makes it easierto generate appropriate decisions about the solution proc-ess. Also, getting students to represent a problem indifferent ways helps shift their focus from merely manipu-lating equations toward understanding physics [11].Some researchers have argued that in order to understanda physical concept thoroughly, one must be able torecognize and manipulate the concept in a variety ofrepresentations [10,12]. As Meltzer puts it [12], a rangeof diverse representations is required to “span” the con-ceptual space associated with an idea. Since traditionalcourses that do not emphasize multiple representationslead to low gains on the Force Concept Inventory [13,14]and on other assessments in the domain of electricityand magnetism [15], in order to improve students’ under-standing of physics concepts, many researchers have
Published by the American Physical Society under the terms ofthe Creative Commons Attribution 4.0 International license.Further distribution of this work must maintain attribution tothe author(s) and the published article’s title, journal citation,and DOI.
PHYSICAL REVIEW PHYSICS EDUCATION RESEARCH 13, 020103 (2017)
2469-9896=17=13(2)=020103(17) 020103-1 Published by the American Physical Society
developed instructional strategies that place explicitemphasis on multiple representations [1,9,16–18] whileother researchers have developed other strategies withimplicit focus on multiple representations [19–21]. VanHeuvelen’s approach [9], for example, starts by ensuringthat students explore the qualitative nature of concepts byusing a variety of representations of a concept in a familiarsetting before adding the complexities of mathematics.Many other researchers have emphasized the importance ofstudents becoming facile in translating between differentrepresentations of knowledge [22,23] and that significantpositive learning occurs when students develop facility inthe use of multiple forms of representation [24]. However,careful attentionmust be paid to instructional use of diverserepresentational modes since specific learning difficultiesmay arise as a consequence [12] because students canapproach the same problem posed in different representa-tions differently without support [12,25].This paper is focused on students’ ability to transform
between mathematical and graphical representations of apiecewise function in different regions in the context of anelectrostatics problem with spherically symmetric chargedistribution and the effect of different scaffolding supportsdesigned to aid them in this regard. Student difficulties ininterpreting graphical representations have been exten-sively researched in kinematics [26–30]. Instructionalstrategies have also been developed to reduce studentdifficulties [31–33]. Other researchers have investigatedstudent understanding of P-V (pressure versus volume)diagrams both in upper-level thermodynamics courses [34]as well as in introductory calculus-based physics courses[35]. In a later study, Christensen and Thompson [36]investigated student difficulties with the concept of slopeand derivative in a mathematical (graphical) context.Student difficulties with the concept of a function have
been researched by mathematics education researchers[37–39]. Hitt [39] found that even secondary mathematicsteachers cannot always articulate between the varioussystems of representation involved in the concept of afunction. Vinner and Dreyfus [40] distinguished between aconcept image and a concept definition because they sawstudents repeatedly misuse and misapply terms like func-tion, limit, tangent, and derivative. For many students, theimage evoked by the term “function” is of two expressionsseparated by an equal sign. Thompson found [41] thatmany students who had successfully passed a calculus anda modern algebra course saw no problem with a definitionlike fðxÞ ¼ nðnþ 1Þð2nþ 1Þ=6 because it fits their con-cept image of a function. Also, students in introductoryphysics courses often have an action conception of afunction because a function is seen as a command tocalculate, and therefore they must actually apply it to anumber before the “recipe” will produce anything. Withoutguidance, the way many introductory physics studentsmanage equations in solving physics problems is often
very predictable: they plug numbers into an equationand figure out an unknown, which can in turn be pluggedinto another equation. This “plug and chug” process iscontinued until the target variable is found. When numbersare not given or when students run into a situation with twoequations and two unknowns, they have much more diffi-culty solving the problem. As evidenced by these examplesand others [41], while students’ concept images are often notconsistent with concept definitions, for mathematics experts,the concept images become tuned over time so that they areconsistent with the conventionally accepted concept defi-nitions. One proposed instructional method of overcomingsome of these difficulties involves real-world investigationsthat use realistic data and scenarios [42–44]. Mathematicseducation researchers have also investigated student diffi-culties in connecting various representations of functions, inparticular, graphical and algebraic representations [45,46].Some researchers have emphasized that this process oftranslating between the graphical and algebraic representa-tions of functions presents one of the central difficulties forstudents in constructing an appropriate mental image of afunction [47]. Other mathematics education researchers haveinvestigated the intertwining between the flexibility of mov-ing from one representation of a function to another and otheraspects of knowledge and understanding [48–50] as well asstudents’ abilities to extract meaningful information fromgraphs [51].In physics, there is the added difficulty of understanding
the relevance of certain mathematical knowledge and pro-cedures to the solution of physical problems. Students mayhave the requisite mathematical knowledge that needs to beapplied to a physical situation, but theymay fail to invoke it atthe appropriate time because they are unaware of its useful-ness. This is supported by Hammer’s observation that high-school students take little out of an initial mathematicalreview of procedures divorced from physics [52] and byresearch on difficulties of transferring mathematical knowl-edge across disciplines [53–55]. Also, the physics contexttypically requires additional information processing, whichmay lead to an increased cognitive load [56] and deterioratedperformance.Here, we explore the facility of students in a calculus-
based introductory physics course in transforming a prob-lem solution involving the electric field for spherical chargesymmetry from a mathematical to a graphical representa-tion, and the effect of different scaffolding supports onstudents’ ability to carry out the transformation consis-tently. This study is primarily focused on students’ abilityto transform electric field from one representation toanother and not on their ability to correctly use Gauss’slaw to find the electric field. However, many previousstudies have documented students’ difficulties withE&M (electricity and magnetism) concepts [57–71]. Instudy 1, we investigated the extent to which students wereable to transform from one representation to another
MARIES, LIN, and SINGH PHYS. REV. PHYS. EDUC. RES. 13, 020103 (2017)
020103-2
consistently, and we conducted think-aloud interviewswith students to identify common difficulties. In study 2,we designed two scaffolding support levels that built oneach other based on the findings of study 1, and inves-tigated their impact on improving students’ representationalconsistency.
II. STUDY 1
A. Methodology and research questions
Since being able to transform between different repre-sentations of knowledge is a hallmark of expertise, weinvestigated the extent to which students in a calculus-based introductory physics course could transform theelectric field in each region for the situation depicted inFig. 1 from a mathematical to a graphical representation.We selected this problem which is relatively straightfor-ward from an expert point of view [since the electric field isno-zero only in region (ii)]. Despite its simplicity forexperts, our past experience with this problem indicatedthat students have great difficulty with this problem. Inparticular, roughly 70% of the students in this study founda nonzero expression for the electric field in at least oneregion in which it is zero. Moreover, many students(including those who found correct expressions for theelectric field in each region) had difficulty in transformingthe electric field in each region from a mathematical to agraphical representation.Study 1 was designed to investigate the extent to which
students have difficulty in transforming the piecewiseelectric field in this problem from a mathematical to agraphical representation, and to identify possible reasonsthat could account for the common difficulties theyexhibit when they engage in the task. In this phase ofthe investigation, the problem was administered as a quiz toan introductory calculus-based class of 65 students. Thiswas one of the weekly quizzes students took at the end ofrecitation which was counted for a certain (small) percent-age of their final grade. In addition, in order to identify
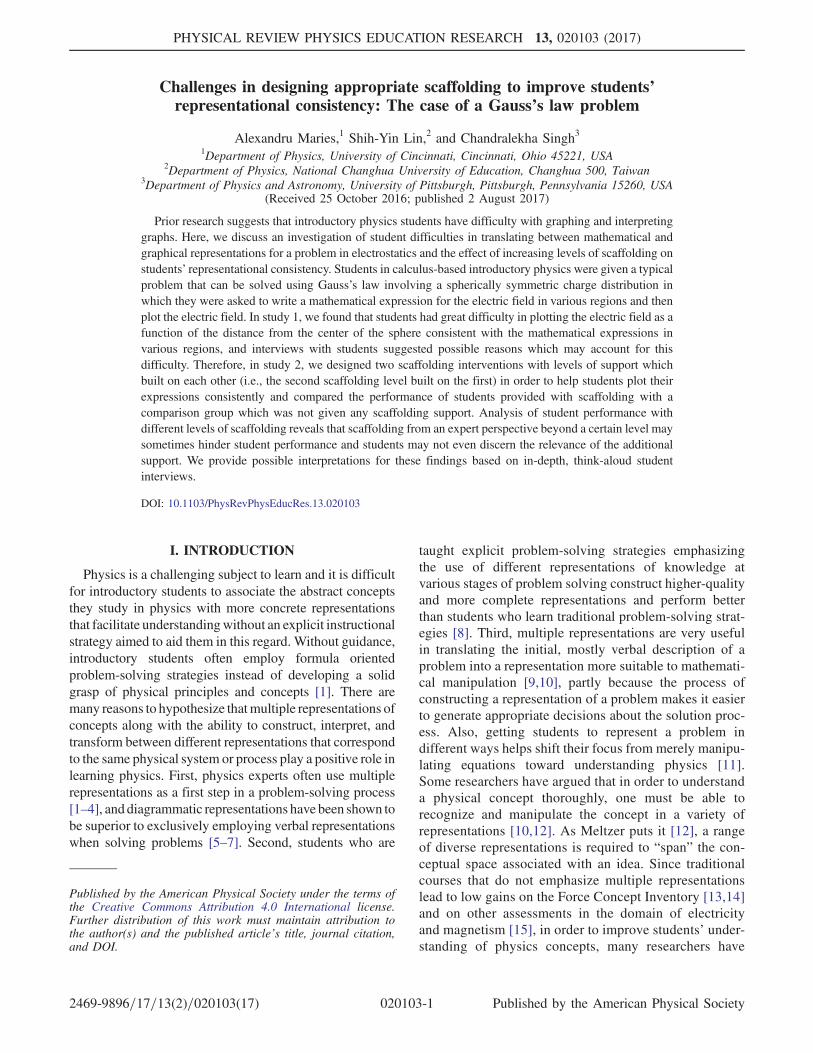
possible difficulties students have in plotting the electricfield in this situation, think-aloud interviews [72] wereconducted with eight students individually. The interviewssuggested possible student difficulties. The quantitativedata were then used to estimate the prevalence of eachtype of difficulty identified. Then, these findings inspiredstudy 2, in which two levels of scaffolding support that builton each other (i.e., the second level builds on the first)were designed to help reduce the most common difficultyobserved and guide students to make better connectionbetween the mathematical and the graphical representationsof the electric field.Problem used in this study.—“A solid conductor of
radius a is inside a solid conducting spherical shell ofinner radius b and outer radius c. The net charge on thesolid conductor is þQ and the net charge on the concentricspherical shell is −Q (see Fig. 1).(a) Write an expression for the electric field in each
region.(i) r < a(ii) a < r < b(iii) b < r < c(iv) r > c
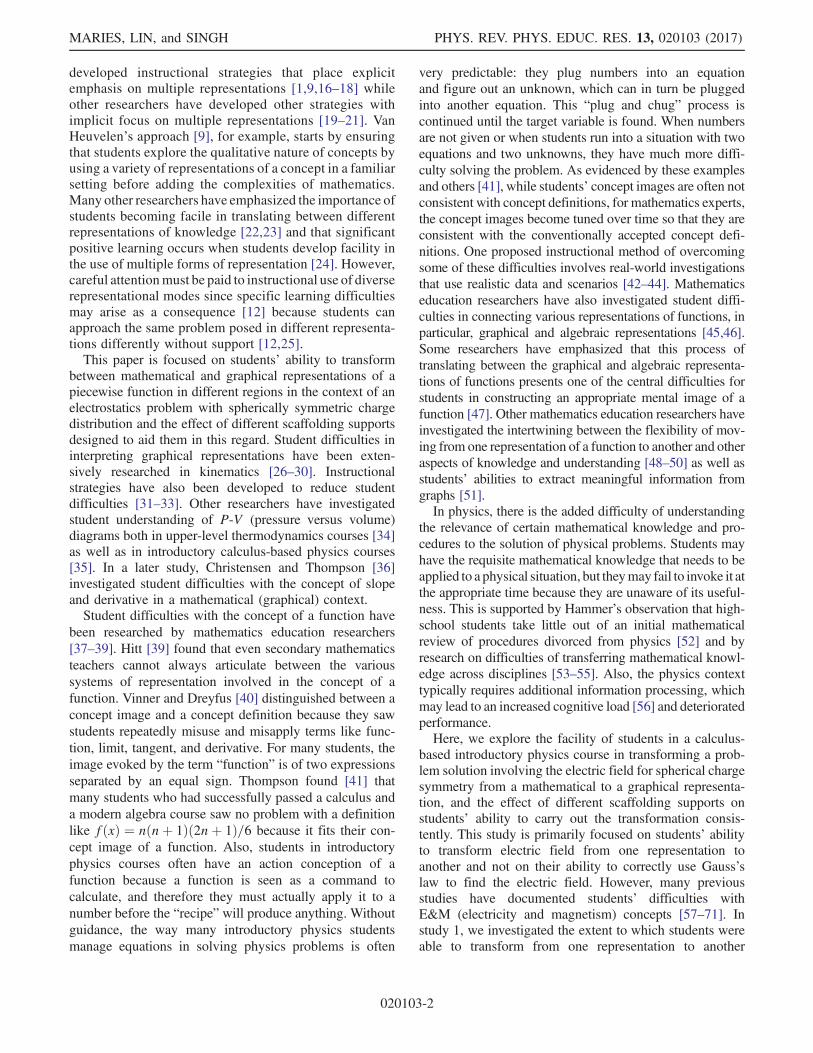
(b) On the figure below (see Fig. 2), plot EðrÞ (which isthe electric field at a distance r from the center of thesphere) in all regions for the problem in (a).
We investigated the following research questions:RQ1: Without any scaffolding support, to what
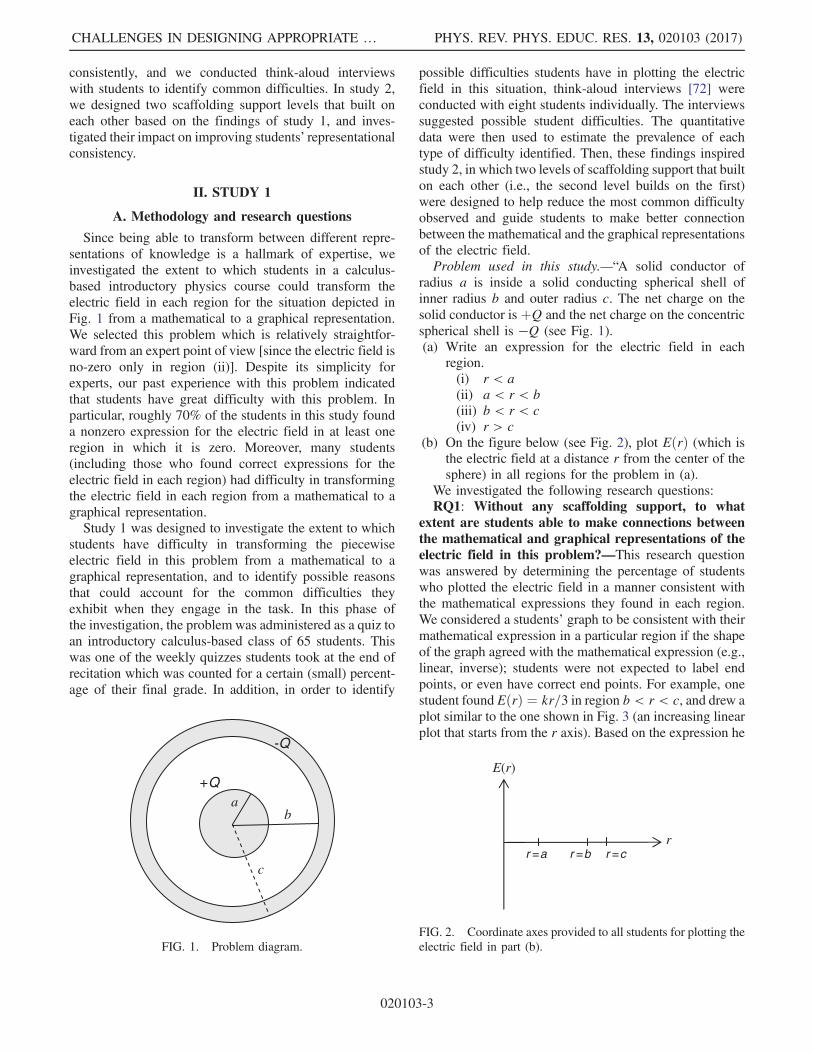
extent are students able to make connections betweenthe mathematical and graphical representations of theelectric field in this problem?—This research questionwas answered by determining the percentage of studentswho plotted the electric field in a manner consistent withthe mathematical expressions they found in each region.We considered a students’ graph to be consistent with theirmathematical expression in a particular region if the shapeof the graph agreed with the mathematical expression (e.g.,linear, inverse); students were not expected to label endpoints, or even have correct end points. For example, onestudent foundEðrÞ ¼ kr=3 in region b < r < c, and drew aplot similar to the one shown in Fig. 3 (an increasing linearplot that starts from the r axis). Based on the expression he
- Q
c
b
+ Qa
FIG. 1. Problem diagram.
r = cr = b
E(r)
r r = a
FIG. 2. Coordinate axes provided to all students for plotting theelectric field in part (b).
CHALLENGES IN DESIGNING APPROPRIATE … PHYS. REV. PHYS. EDUC. RES. 13, 020103 (2017)
020103-3
wrote down [EðrÞ ¼ kr=3], the left end point, Eðr ¼ bÞ,should be kb=3. However, according to his plot in this region(see Fig. 3), the left end point was drawn as Eðr ¼ bÞ ¼ 0.Even though the student did not draw the left end pointcorrectly, this student was still considered to be consistent inplotting by the researchers because he drew the correct typeof plot (linear) consistent with the expression in that region.RQ2: What common difficulties do students have in
transforming the electric field in this problem from themathematical to the graphical representation and howcommon are these difficulties?—To answer this researchquestion, we conducted think-aloud interviews duringwhich students solved the problem while verbalizing theirthought process. After the students had solved the physicsproblem to the best of their ability, they were asked forclarification on points they had not made clear earlier whilethinking out loud. We identified several difficulties afterwhich we analyzed our quantitative data to determine howcommon the difficulties are.Student volunteers were recruited after instructors who
were teaching a separate section of the second semestercalculus-based introductory physics course sent emailannouncements to their students with details about thestudy. The interviews were conducted after students weretested on the relevant topics (Gauss’s law) via a midtermexam by one of the authors (A. M.) who was not affiliatedwith any of the courses. All students had also completedthe study of Calculus I and most of them were takingCalculus II at the time. They also completed the firstsemester of introductory physics, which includes a fairamount of mathematics. The interviewer ensured thatstudents had not solved the problem prior to the interview(or at least did not recognize the problem when presentedwith it), so during the interviews students solved theproblem for the first time while thinking out loud. Theinterviews were audio recorded, and during the interviews,A. M. took notes about key points in the interview to listento carefully later. Students’ work was also collected, andlater, based on the notes, certain key points in the interviewwere transcribed. Two researchers looked at the importanttranscribed parts of the interviews and discussed thedifficulties. There was some disagreement in the beginningin the interpretation of the data, but through discussions,
any disagreements were resolved. We should point out thatthe research presented here used mixed methods and themain purpose of the think-aloud interviews was to help theresearchers interpret the quantitative data.
B. Results
RQ1: Without any scaffolding support, to whatextent are students able to make connections betweenthe mathematical and graphical representations of theelectric field in this problem?—We found that only 26%of students plotted the electric field consistent with themathematical expressions they found in all regions. Manystudents plotted the electric field consistently in someregions and inconsistently in others. It appeared from theplots that many students did not recognize that theirexpressions in different regions were showing a piecewisedefined electric field. Therefore, we carried out think-aloudinterviews to better understand the common difficultiesstudents have in plotting the electric field for this problem.RQ2: What common difficulties do students have in
transforming the electric field in this problem from themathematical to the graphical representation and howcommon are these difficulties?—Eight students who hadcompleted the study of electrostatics were interviewed one-on-one using a think-aloud protocol. The interviews sug-gested two common difficulties students have in plottingthe electric field in this problem: (1) not contemplating thebehavior of the electric field in each region separately whenplotting and globally plotting the electric field in all regionsat once and (2) contemplating the behavior of the electricfield in each region separately but plotting the “expected”behavior based upon qualitative reasoning rather than themathematical expressions found.We describe each difficulty in more detail and provide
examples below.Student difficulty 1: Not contemplating the behavior
of the electric field in each region separately whenplotting and globally plotting the electric field in allregions at once.—This difficulty was observed in inter-views in which students insisted on plotting a continuouselectric field without carefully contemplating what thebehavior of the field is in each region or noticing thediscontinuity in the electric field at the boundaries betweenregions. For example, one interviewed student, Alex, foundthe following expressions for the electric field:
r < a∶ E ¼ kQ=r2;
a < r < b∶ E ¼ −2kQ=r2;
b < r < c∶ E ¼ −kQ=r2;
r > c∶ E ¼ −kQ=r2:
Then, he mainly focused on the sign of the expression forthe electric field in each region and the fact that the fieldmust be continuous throughout to make his plot. He did not
r = a
E (r)
r r = b r = c
FIG. 3. Reproduction of a plot by a student in region b < r < c.His plots in other regions have been excluded for clarity.
MARIES, LIN, and SINGH PHYS. REV. PHYS. EDUC. RES. 13, 020103 (2017)
020103-4
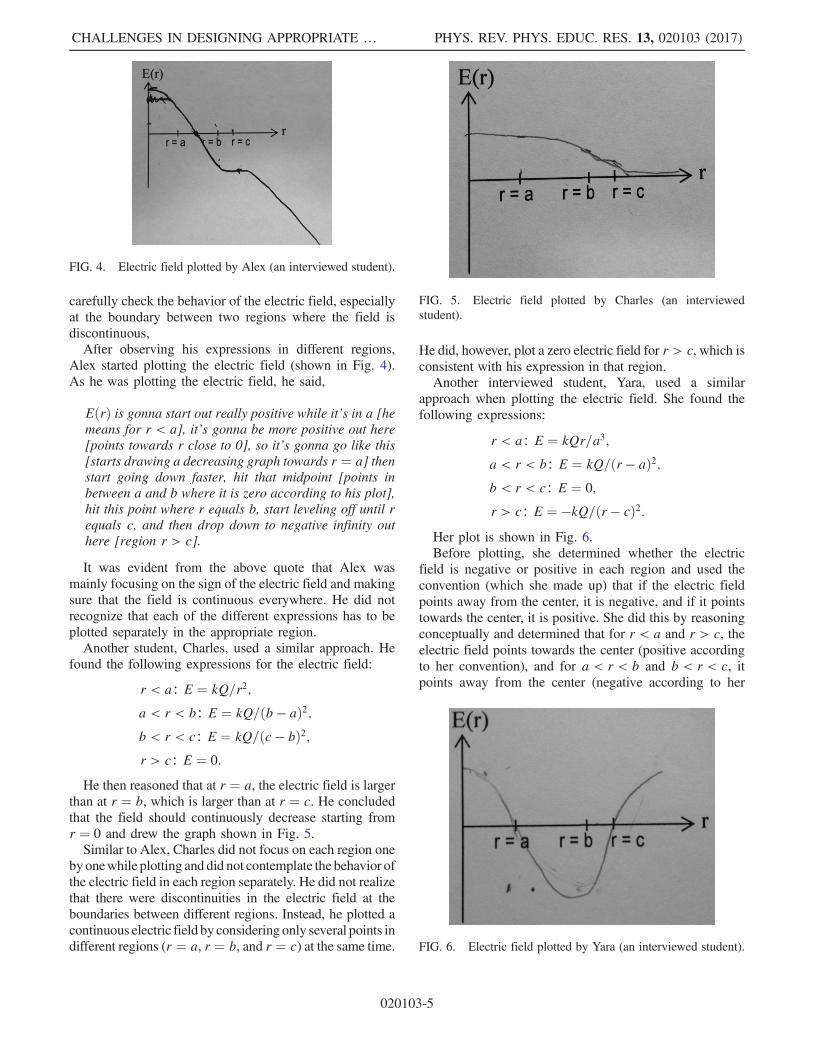
carefully check the behavior of the electric field, especiallyat the boundary between two regions where the field isdiscontinuous,After observing his expressions in different regions,
Alex started plotting the electric field (shown in Fig. 4).As he was plotting the electric field, he said,
EðrÞ is gonna start out really positive while it’s in a [hemeans for r < a], it’s gonna be more positive out here[points towards r close to 0], so it’s gonna go like this[starts drawing a decreasing graph towards r ¼ a] thenstart going down faster, hit that midpoint [points inbetween a and b where it is zero according to his plot],hit this point where r equals b, start leveling off until requals c, and then drop down to negative infinity outhere [region r > c].
It was evident from the above quote that Alex wasmainly focusing on the sign of the electric field and makingsure that the field is continuous everywhere. He did notrecognize that each of the different expressions has to beplotted separately in the appropriate region.Another student, Charles, used a similar approach. He
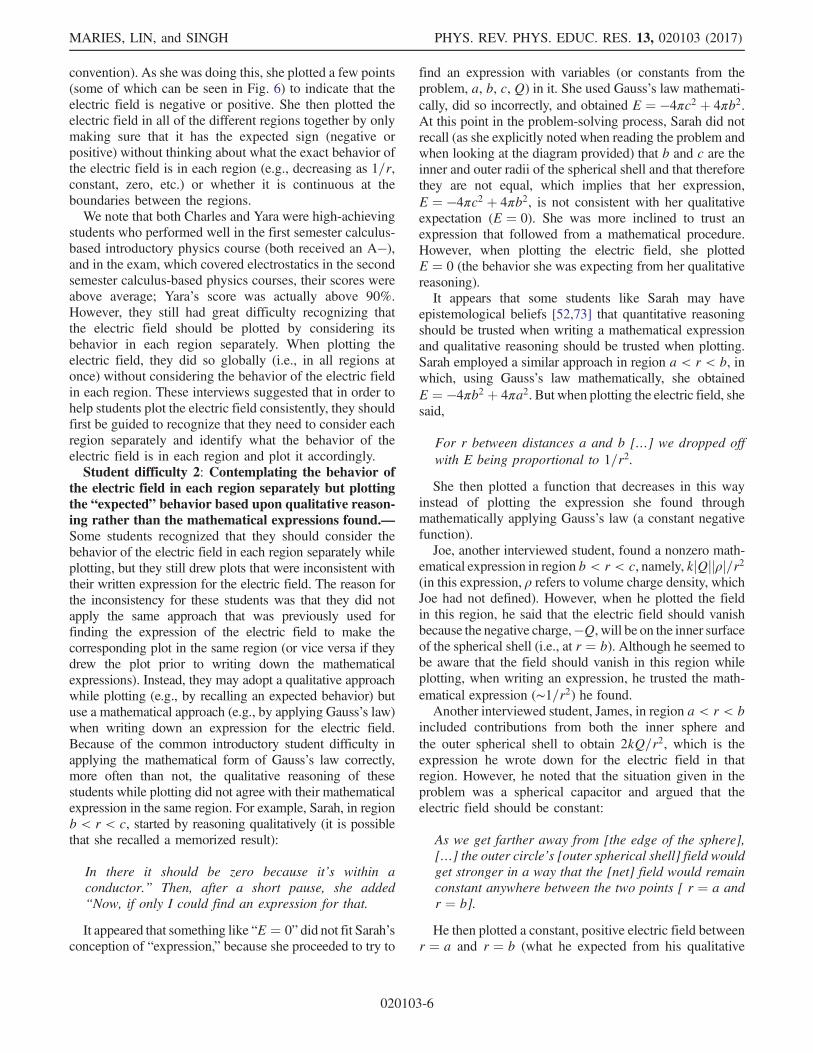
found the following expressions for the electric field:
r < a∶ E ¼ kQ=r2;
a < r < b∶ E ¼ kQ=ðb − aÞ2;b < r < c∶ E ¼ kQ=ðc − bÞ2;r > c∶ E ¼ 0:
He then reasoned that at r ¼ a, the electric field is largerthan at r ¼ b, which is larger than at r ¼ c. He concludedthat the field should continuously decrease starting fromr ¼ 0 and drew the graph shown in Fig. 5.Similar to Alex, Charles did not focus on each region one
by onewhile plotting and did not contemplate the behavior ofthe electric field in each region separately. He did not realizethat there were discontinuities in the electric field at theboundaries between different regions. Instead, he plotted acontinuous electric field by considering only several points indifferent regions (r ¼ a, r ¼ b, and r ¼ c) at the same time.
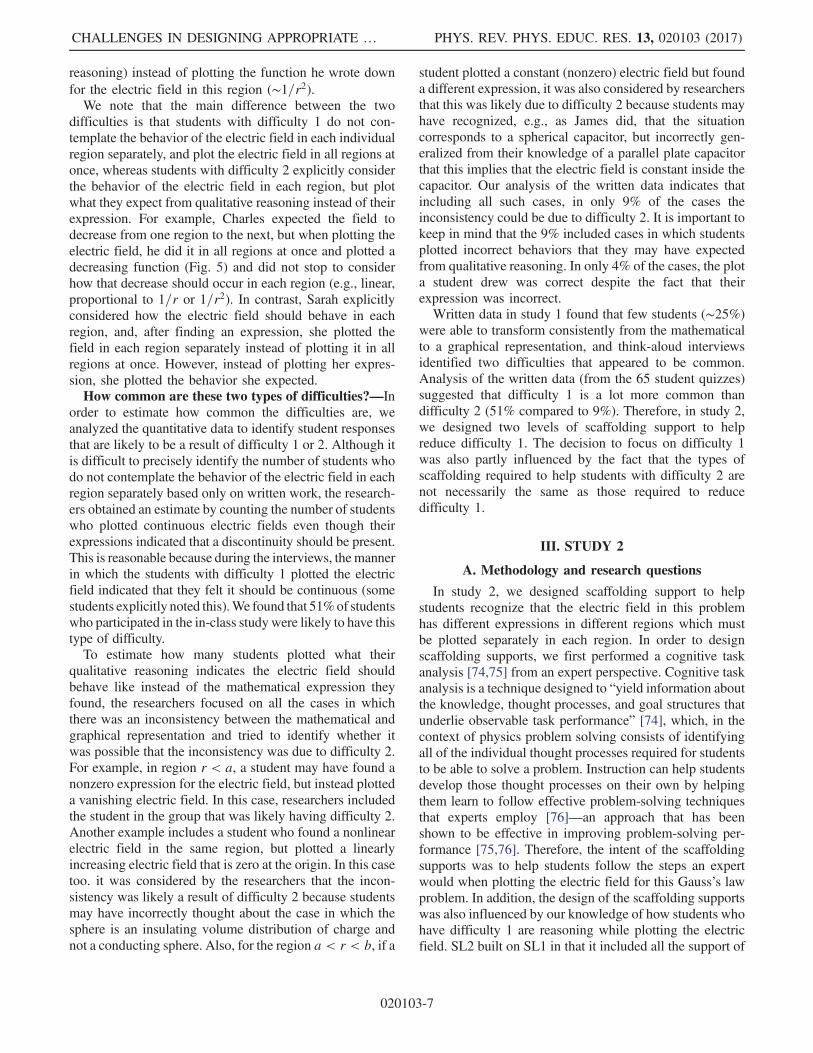
He did, however, plot a zero electric field for r > c, which isconsistent with his expression in that region.Another interviewed student, Yara, used a similar
approach when plotting the electric field. She found thefollowing expressions:
r < a∶ E ¼ kQr=a3;
a < r < b∶ E ¼ kQ=ðr − aÞ2;b < r < c∶ E ¼ 0;
r > c∶ E ¼ −kQ=ðr − cÞ2:Her plot is shown in Fig. 6.Before plotting, she determined whether the electric
field is negative or positive in each region and used theconvention (which she made up) that if the electric fieldpoints away from the center, it is negative, and if it pointstowards the center, it is positive. She did this by reasoningconceptually and determined that for r < a and r > c, theelectric field points towards the center (positive accordingto her convention), and for a < r < b and b < r < c, itpoints away from the center (negative according to her
FIG. 4. Electric field plotted by Alex (an interviewed student).
FIG. 5. Electric field plotted by Charles (an interviewedstudent).
FIG. 6. Electric field plotted by Yara (an interviewed student).
CHALLENGES IN DESIGNING APPROPRIATE … PHYS. REV. PHYS. EDUC. RES. 13, 020103 (2017)
020103-5
convention). As she was doing this, she plotted a few points(some of which can be seen in Fig. 6) to indicate that theelectric field is negative or positive. She then plotted theelectric field in all of the different regions together by onlymaking sure that it has the expected sign (negative orpositive) without thinking about what the exact behavior ofthe electric field is in each region (e.g., decreasing as 1=r,constant, zero, etc.) or whether it is continuous at theboundaries between the regions.We note that both Charles and Yara were high-achieving
students who performed well in the first semester calculus-based introductory physics course (both received an A−),and in the exam, which covered electrostatics in the secondsemester calculus-based physics courses, their scores wereabove average; Yara’s score was actually above 90%.However, they still had great difficulty recognizing thatthe electric field should be plotted by considering itsbehavior in each region separately. When plotting theelectric field, they did so globally (i.e., in all regions atonce) without considering the behavior of the electric fieldin each region. These interviews suggested that in order tohelp students plot the electric field consistently, they shouldfirst be guided to recognize that they need to consider eachregion separately and identify what the behavior of theelectric field is in each region and plot it accordingly.Student difficulty 2: Contemplating the behavior of
the electric field in each region separately but plottingthe “expected” behavior based upon qualitative reason-ing rather than the mathematical expressions found.—Some students recognized that they should consider thebehavior of the electric field in each region separately whileplotting, but they still drew plots that were inconsistent withtheir written expression for the electric field. The reason forthe inconsistency for these students was that they did notapply the same approach that was previously used forfinding the expression of the electric field to make thecorresponding plot in the same region (or vice versa if theydrew the plot prior to writing down the mathematicalexpressions). Instead, they may adopt a qualitative approachwhile plotting (e.g., by recalling an expected behavior) butuse a mathematical approach (e.g., by applying Gauss’s law)when writing down an expression for the electric field.Because of the common introductory student difficulty inapplying the mathematical form of Gauss’s law correctly,more often than not, the qualitative reasoning of thesestudents while plotting did not agree with their mathematicalexpression in the same region. For example, Sarah, in regionb < r < c, started by reasoning qualitatively (it is possiblethat she recalled a memorized result):
In there it should be zero because it’s within aconductor.” Then, after a short pause, she added“Now, if only I could find an expression for that.
It appeared that something like “E ¼ 0” did not fit Sarah’sconception of “expression,” because she proceeded to try to
find an expression with variables (or constants from theproblem, a, b, c, Q) in it. She used Gauss’s law mathemati-cally, did so incorrectly, and obtained E ¼ −4πc2 þ 4πb2.At this point in the problem-solving process, Sarah did notrecall (as she explicitly noted when reading the problem andwhen looking at the diagram provided) that b and c are theinner and outer radii of the spherical shell and that thereforethey are not equal, which implies that her expression,E ¼ −4πc2 þ 4πb2, is not consistent with her qualitativeexpectation (E ¼ 0). She was more inclined to trust anexpression that followed from a mathematical procedure.However, when plotting the electric field, she plottedE ¼ 0 (the behavior she was expecting from her qualitativereasoning).It appears that some students like Sarah may have
epistemological beliefs [52,73] that quantitative reasoningshould be trusted when writing a mathematical expressionand qualitative reasoning should be trusted when plotting.Sarah employed a similar approach in region a < r < b, inwhich, using Gauss’s law mathematically, she obtainedE ¼ −4πb2 þ 4πa2. But when plotting the electric field, shesaid,
For r between distances a and b […] we dropped offwith E being proportional to 1=r2.
She then plotted a function that decreases in this wayinstead of plotting the expression she found throughmathematically applying Gauss’s law (a constant negativefunction).Joe, another interviewed student, found a nonzero math-
ematical expression in region b < r < c, namely, kjQjjρj=r2(in this expression, ρ refers to volume charge density, whichJoe had not defined). However, when he plotted the fieldin this region, he said that the electric field should vanishbecause the negative charge,−Q, will be on the inner surfaceof the spherical shell (i.e., at r ¼ b). Although he seemed tobe aware that the field should vanish in this region whileplotting, when writing an expression, he trusted the math-ematical expression (∼1=r2) he found.Another interviewed student, James, in region a < r < b
included contributions from both the inner sphere andthe outer spherical shell to obtain 2kQ=r2, which is theexpression he wrote down for the electric field in thatregion. However, he noted that the situation given in theproblem was a spherical capacitor and argued that theelectric field should be constant:
As we get farther away from [the edge of the sphere],[…] the outer circle’s [outer spherical shell] field wouldget stronger in a way that the [net] field would remainconstant anywhere between the two points [ r ¼ a andr ¼ b].
He then plotted a constant, positive electric field betweenr ¼ a and r ¼ b (what he expected from his qualitative
MARIES, LIN, and SINGH PHYS. REV. PHYS. EDUC. RES. 13, 020103 (2017)
020103-6
reasoning) instead of plotting the function he wrote downfor the electric field in this region (∼1=r2).We note that the main difference between the two
difficulties is that students with difficulty 1 do not con-template the behavior of the electric field in each individualregion separately, and plot the electric field in all regions atonce, whereas students with difficulty 2 explicitly considerthe behavior of the electric field in each region, but plotwhat they expect from qualitative reasoning instead of theirexpression. For example, Charles expected the field todecrease from one region to the next, but when plotting theelectric field, he did it in all regions at once and plotted adecreasing function (Fig. 5) and did not stop to considerhow that decrease should occur in each region (e.g., linear,proportional to 1=r or 1=r2). In contrast, Sarah explicitlyconsidered how the electric field should behave in eachregion, and, after finding an expression, she plotted thefield in each region separately instead of plotting it in allregions at once. However, instead of plotting her expres-sion, she plotted the behavior she expected.How common are these two types of difficulties?—In
order to estimate how common the difficulties are, weanalyzed the quantitative data to identify student responsesthat are likely to be a result of difficulty 1 or 2. Although itis difficult to precisely identify the number of students whodo not contemplate the behavior of the electric field in eachregion separately based only on written work, the research-ers obtained an estimate by counting the number of studentswho plotted continuous electric fields even though theirexpressions indicated that a discontinuity should be present.This is reasonable because during the interviews, themannerin which the students with difficulty 1 plotted the electricfield indicated that they felt it should be continuous (somestudents explicitly noted this).We found that 51%of studentswho participated in the in-class studywere likely to have thistype of difficulty.To estimate how many students plotted what their
qualitative reasoning indicates the electric field shouldbehave like instead of the mathematical expression theyfound, the researchers focused on all the cases in whichthere was an inconsistency between the mathematical andgraphical representation and tried to identify whether itwas possible that the inconsistency was due to difficulty 2.For example, in region r < a, a student may have found anonzero expression for the electric field, but instead plotteda vanishing electric field. In this case, researchers includedthe student in the group that was likely having difficulty 2.Another example includes a student who found a nonlinearelectric field in the same region, but plotted a linearlyincreasing electric field that is zero at the origin. In this casetoo. it was considered by the researchers that the incon-sistency was likely a result of difficulty 2 because studentsmay have incorrectly thought about the case in which thesphere is an insulating volume distribution of charge andnot a conducting sphere. Also, for the region a < r < b, if a
student plotted a constant (nonzero) electric field but founda different expression, it was also considered by researchersthat this was likely due to difficulty 2 because students mayhave recognized, e.g., as James did, that the situationcorresponds to a spherical capacitor, but incorrectly gen-eralized from their knowledge of a parallel plate capacitorthat this implies that the electric field is constant inside thecapacitor. Our analysis of the written data indicates thatincluding all such cases, in only 9% of the cases theinconsistency could be due to difficulty 2. It is important tokeep in mind that the 9% included cases in which studentsplotted incorrect behaviors that they may have expectedfrom qualitative reasoning. In only 4% of the cases, the plota student drew was correct despite the fact that theirexpression was incorrect.Written data in study 1 found that few students (∼25%)
were able to transform consistently from the mathematicalto a graphical representation, and think-aloud interviewsidentified two difficulties that appeared to be common.Analysis of the written data (from the 65 student quizzes)suggested that difficulty 1 is a lot more common thandifficulty 2 (51% compared to 9%). Therefore, in study 2,we designed two levels of scaffolding support to helpreduce difficulty 1. The decision to focus on difficulty 1was also partly influenced by the fact that the types ofscaffolding required to help students with difficulty 2 arenot necessarily the same as those required to reducedifficulty 1.
III. STUDY 2
A. Methodology and research questions
In study 2, we designed scaffolding support to helpstudents recognize that the electric field in this problemhas different expressions in different regions which mustbe plotted separately in each region. In order to designscaffolding supports, we first performed a cognitive taskanalysis [74,75] from an expert perspective. Cognitive taskanalysis is a technique designed to “yield information aboutthe knowledge, thought processes, and goal structures thatunderlie observable task performance” [74], which, in thecontext of physics problem solving consists of identifyingall of the individual thought processes required for studentsto be able to solve a problem. Instruction can help studentsdevelop those thought processes on their own by helpingthem learn to follow effective problem-solving techniquesthat experts employ [76]—an approach that has beenshown to be effective in improving problem-solving per-formance [75,76]. Therefore, the intent of the scaffoldingsupports was to help students follow the steps an expertwould when plotting the electric field for this Gauss’s lawproblem. In addition, the design of the scaffolding supportswas also influenced by our knowledge of how students whohave difficulty 1 are reasoning while plotting the electricfield. SL2 built on SL1 in that it included all the support of
CHALLENGES IN DESIGNING APPROPRIATE … PHYS. REV. PHYS. EDUC. RES. 13, 020103 (2017)
020103-7
SL1 (plus additional support). We refer to the version ofthe problem used in study 1 as “scaffolding level 0” (SL0)because it did not involve any scaffolding.Scaffolding level 1 (SL1) design.—Cognitive task
analysis indicates that, when plotting the electric fieldfor this problem situation, an expert would recognize thateach expression for the electric field should be plotted inthe appropriate region. Students with difficulty 1 plotted theelectric field globally in all regions at once, which suggeststhan in order to help reduce this difficulty, scaffoldingsupport should guide students to focus on one region at atime. This kind of support can have two benefits: (1) helpstudents recognize that the behavior of the electric fieldshould be considered in each region separately, and(2) reduce the cognitive load [56] associated with consid-ering four regions at the same time.Therefore, the first level of scaffolding (SL1) asked
students to plot the electric field in each region separatelybefore plotting it in part (b) for the problem situation shownin Fig. 1. The instructions provided to them in part (a) of thequestion were as follows:(a) Write an expression for the electric field in each
region and plot the electric field in that region on thecoordinate axes shown (in the shaded regions, please donot draw).For each region (r < a, a < r < b, etc.), right after
calculating the expression for the electric field in that region,students were given coordinate axes with the irrelevantregions shaded out, as shown in Table I. This scaffoldinglevel was designed to help students contemplate the electricfield behavior in each region separately instead of in allregions at one time and, therefore, help reduce difficulty 1.Scaffolding level 2 (SL2) design.—In addition to
recognizing that each expression for the electric fieldshould be plotted in the appropriate region, an expert isalso likely to contemplate the end points of each expressionin each region because this type of analysis providesexplicit information about each expression (which is usefulfor plotting it). The plotting approaches of students withdifficulty 1 suggested that they assumed that the electricfield in this problem is continuous (some students explicitlysaid this). Therefore, providing scaffolding that helpsstudents consider end points of different expressions indifferent regions can be beneficial, primarily in helpingstudents recognize that the electric field is not continuousand plot it accordingly.Students who received the second level of scaffolding
(SL2) were provided all the support of SL1, and, inaddition, they were asked to evaluate the electric field atthe beginning, midpoint, and end point of each regionimmediately before plotting it in that region (see Table I).In addition to helping students recognize a discontinuityin the electric field, another potential benefit of SL2 is tohelp students make a consistent plot. For example, if astudent is unsure about how a 1=r expression should be
plotted, he or she could plug in values for several different rto determine what the graph looks like. A student couldpotentially recognize how the plot should look like aftercalculating the function explicitly at three points, begin-ning, midpoint, and end point of the respective region.We note that interviews with students who were thinking
aloud while solving the SL1 and SL2 versions of theproblem indicated that they were not confused by theinstructions in the two scaffolded versions of the problem(i.e., it was clear to students where to plot the electric field,what the additional instructions meant, etc.). In addition,physics graduate students solved the two scaffolded ver-sions of this problem and commented on the scaffoldingprovided (i.e., to what extent they expected it to be usefulfor introductory students). Some physics faculty memberswho had taught introductory physics recently were alsoshown the interventions and were asked to predict theeffectiveness of the interventions. Both graduate studentsand faculty predicted that the interventions will helpstudents connect their expressions with their plots betterthan students in the comparison group, with the majoritypredicting that students in the SL2 group will performbetter in this regard than students in the SL1 group.Sometimes they specifically mentioned that the additionalinstructions would certainly be helpful for introductorystudents.The scaffolded versions of the problem were given to 95
students in a traditionally taught calculus-based introduc-tory physics course who were enrolled in three differentrecitation sections. The three recitation sections formed thecomparison group and two scaffolding intervention groupsfor this investigation. All recitation sections were taught ina traditional manner by the same teaching assistant whoworked out problems similar to the homework problemsand then gave students a 20-minute quiz at the end ofrecitation. Students in all recitations attended the samelectures, were assigned the same homework, and had thesame exams and quizzes.Below, we delineate the research questions developed
for the purposes of investigating the impact of differentlevels of scaffolding support on students’ representationalconsistency and the connection between representationalconsistency and performance on this problem.RQ1: What is the impact of the medium level of
scaffolding support on students’ representational con-sistency on this problem?—This research question wasinvestigated by comparing the percentages of students whoplotted the mathematical expressions they found consis-tently in the SL1 group with the SL0 group.RQ2: What are some mechanisms which may
account for the impact of the medium level of scaffold-ing on students’ representational consistency on thisproblem?—In order to shed light on the possible mech-anisms for how students are affected by the medium levelof scaffolding on this problem, interviews were conducted
MARIES, LIN, and SINGH PHYS. REV. PHYS. EDUC. RES. 13, 020103 (2017)
020103-8
using a think-aloud protocol [72]. As mentioned earlier,eight interviews were conducted as part of study 1 withstudents who solved the problem with no scaffolding.Eight interviews were conducted with students whosolved the SL1 version of the problem and theirapproaches to plotting the electric field were comparedto the students provided with no scaffolding.RQ3: How does the additional scaffolding (SL2)
compare to the medium level of scaffolding (SL1) interms of students’ representational consistency on thisproblem?—This research question was investigated bycomparing the percentages of students who plotted themathematical expressions they found consistently in theSL2 group with the SL1 group. Since these students had toplot the electric field twice, once in each individual regionseparately (with irrelevant regions shaded out) and oncein all regions combined, we did both comparisons (seeTables V and VI). (Note that it may seem unnecessary toperform the second comparison, but we should note thatwhile an expert is likely to put together the plots he or she
drew in each region when plotting the electric field in allregions, students often do not do this. They sometimes havea final plot that is different from putting together theindividual plots they have in each region.)RQ4: What mechanisms may be useful in explaining
the impact of the additional scaffolding in SL2 com-pared to SL1 on introductory students’ representa-tional consistency on this problem?—This question wasinvestigated by conducting think-aloud interviews withseven students who solved the SL2 version of the problemand comparing their approaches to those of students whosolved the SL1 of the problem while thinking aloud.RQ5: Do students who exhibit representational con-
sistency perform better on this problem than studentswho do not?—Previous research has found that students’representational consistency correlates with learning gainsin mechanics [77] and that students who display superiorskills in representing a physical problem exhibit improvedproblem-solving performance [78]. Motivated by thesefindings, we investigated whether students who were
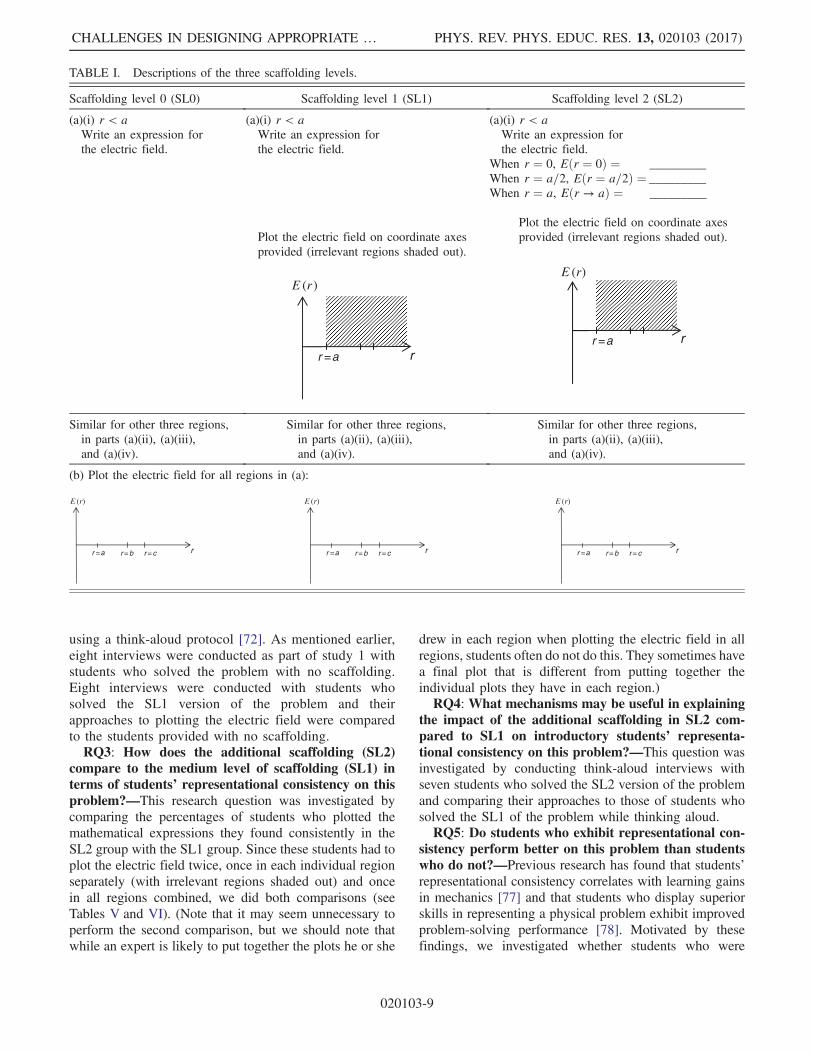
TABLE I. Descriptions of the three scaffolding levels.
Scaffolding level 0 (SL0) Scaffolding level 1 (SL1) Scaffolding level 2 (SL2)
(a)(i) r < aWrite an expression forthe electric field.
(a)(i) r < aWrite an expression forthe electric field.
(a)(i) r < aWrite an expression forthe electric field.
When r ¼ 0, Eðr ¼ 0Þ ¼ _________When r ¼ a=2, Eðr ¼ a=2Þ ¼ _________When r ¼ a, Eðr → aÞ ¼ _________
Plot the electric field on coordinate axesprovided (irrelevant regions shaded out).
r = a
E ( )r
r
Plot the electric field on coordinate axesprovided (irrelevant regions shaded out).
r = a
E ( )r
r
Similar for other three regions,in parts (a)(ii), (a)(iii),and (a)(iv).
Similar for other three regions,in parts (a)(ii), (a)(iii),and (a)(iv).
Similar for other three regions,in parts (a)(ii), (a)(iii),and (a)(iv).
(b) Plot the electric field for all regions in (a):
r = a
E (r)
r r =b r =c r = a
E (r)
r r =b r =c r = a
E (r)
r r =b r =c
CHALLENGES IN DESIGNING APPROPRIATE … PHYS. REV. PHYS. EDUC. RES. 13, 020103 (2017)
020103-9
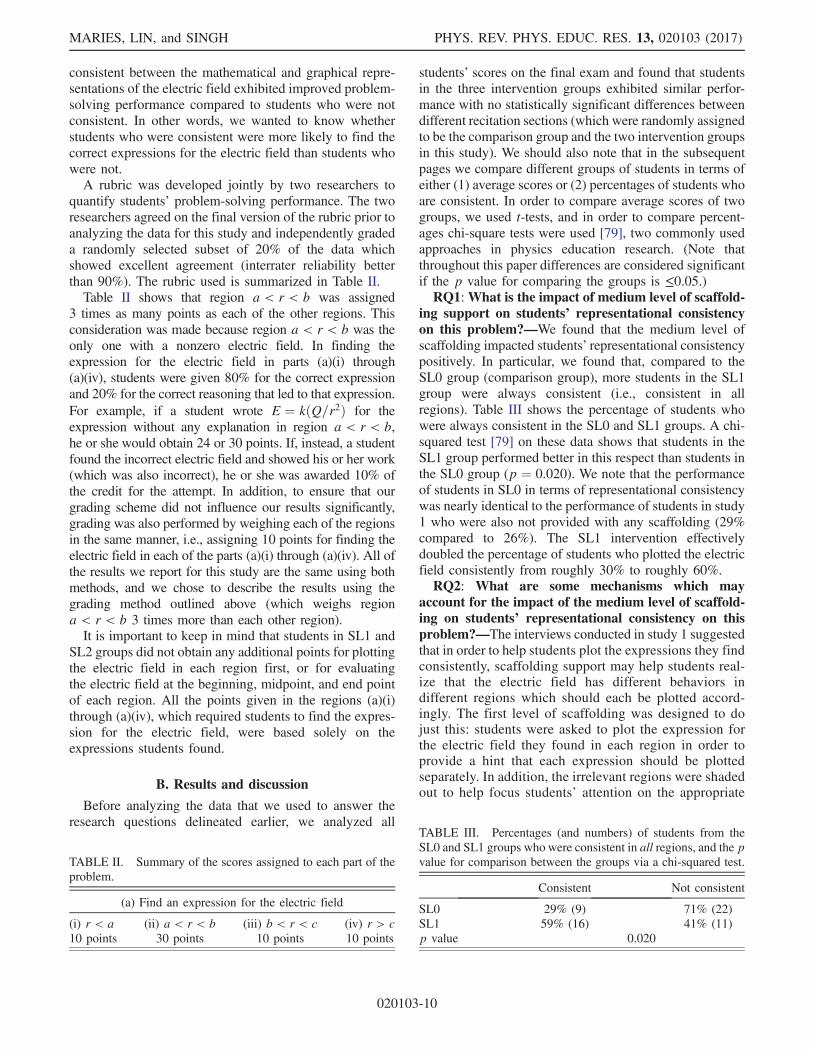
consistent between the mathematical and graphical repre-sentations of the electric field exhibited improved problem-solving performance compared to students who were notconsistent. In other words, we wanted to know whetherstudents who were consistent were more likely to find thecorrect expressions for the electric field than students whowere not.A rubric was developed jointly by two researchers to
quantify students’ problem-solving performance. The tworesearchers agreed on the final version of the rubric prior toanalyzing the data for this study and independently gradeda randomly selected subset of 20% of the data whichshowed excellent agreement (interrater reliability betterthan 90%). The rubric used is summarized in Table II.Table II shows that region a < r < b was assigned
3 times as many points as each of the other regions. Thisconsideration was made because region a < r < b was theonly one with a nonzero electric field. In finding theexpression for the electric field in parts (a)(i) through(a)(iv), students were given 80% for the correct expressionand 20% for the correct reasoning that led to that expression.For example, if a student wrote E ¼ kðQ=r2Þ for theexpression without any explanation in region a < r < b,he or she would obtain 24 or 30 points. If, instead, a studentfound the incorrect electric field and showed his or her work(which was also incorrect), he or she was awarded 10% ofthe credit for the attempt. In addition, to ensure that ourgrading scheme did not influence our results significantly,grading was also performed by weighing each of the regionsin the same manner, i.e., assigning 10 points for finding theelectric field in each of the parts (a)(i) through (a)(iv). All ofthe results we report for this study are the same using bothmethods, and we chose to describe the results using thegrading method outlined above (which weighs regiona < r < b 3 times more than each other region).It is important to keep in mind that students in SL1 and
SL2 groups did not obtain any additional points for plottingthe electric field in each region first, or for evaluatingthe electric field at the beginning, midpoint, and end pointof each region. All the points given in the regions (a)(i)through (a)(iv), which required students to find the expres-sion for the electric field, were based solely on theexpressions students found.
B. Results and discussion
Before analyzing the data that we used to answer theresearch questions delineated earlier, we analyzed all
students’ scores on the final exam and found that studentsin the three intervention groups exhibited similar perfor-mance with no statistically significant differences betweendifferent recitation sections (which were randomly assignedto be the comparison group and the two intervention groupsin this study). We should also note that in the subsequentpages we compare different groups of students in terms ofeither (1) average scores or (2) percentages of students whoare consistent. In order to compare average scores of twogroups, we used t-tests, and in order to compare percent-ages chi-square tests were used [79], two commonly usedapproaches in physics education research. (Note thatthroughout this paper differences are considered significantif the p value for comparing the groups is ≤0.05.)RQ1:What is the impact of medium level of scaffold-
ing support on students’ representational consistencyon this problem?—We found that the medium level ofscaffolding impacted students’ representational consistencypositively. In particular, we found that, compared to theSL0 group (comparison group), more students in the SL1group were always consistent (i.e., consistent in allregions). Table III shows the percentage of students whowere always consistent in the SL0 and SL1 groups. A chi-squared test [79] on these data shows that students in theSL1 group performed better in this respect than students inthe SL0 group (p ¼ 0.020). We note that the performanceof students in SL0 in terms of representational consistencywas nearly identical to the performance of students in study1 who were also not provided with any scaffolding (29%compared to 26%). The SL1 intervention effectivelydoubled the percentage of students who plotted the electricfield consistently from roughly 30% to roughly 60%.RQ2: What are some mechanisms which may
account for the impact of the medium level of scaffold-ing on students’ representational consistency on thisproblem?—The interviews conducted in study 1 suggestedthat in order to help students plot the expressions they findconsistently, scaffolding support may help students real-ize that the electric field has different behaviors indifferent regions which should each be plotted accord-ingly. The first level of scaffolding was designed to dojust this: students were asked to plot the expression forthe electric field they found in each region in order toprovide a hint that each expression should be plottedseparately. In addition, the irrelevant regions were shadedout to help focus students’ attention on the appropriate
TABLE II. Summary of the scores assigned to each part of theproblem.
(a) Find an expression for the electric field
(i) r < a (ii) a < r < b (iii) b < r < c (iv) r > c10 points 30 points 10 points 10 points
TABLE III. Percentages (and numbers) of students from theSL0 and SL1 groups who were consistent in all regions, and the pvalue for comparison between the groups via a chi-squared test.
Consistent Not consistent
SL0 29% (9) 71% (22)SL1 59% (16) 41% (11)p value 0.020
MARIES, LIN, and SINGH PHYS. REV. PHYS. EDUC. RES. 13, 020103 (2017)
020103-10
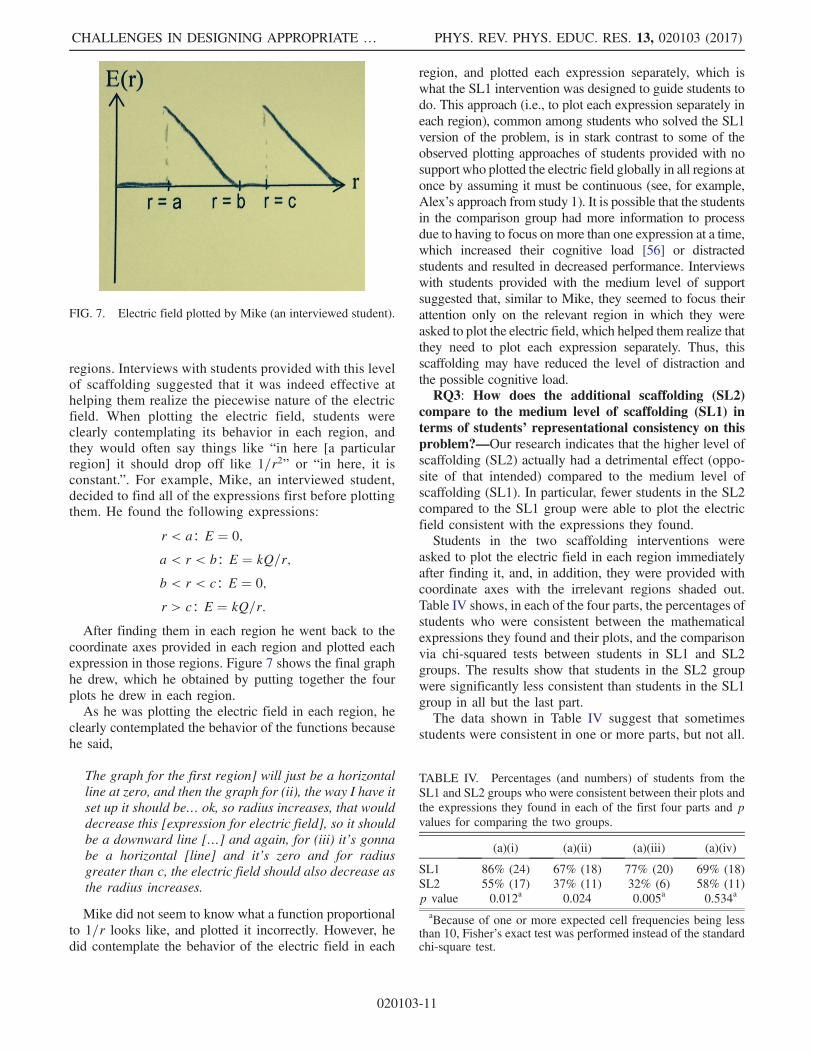
regions. Interviews with students provided with this levelof scaffolding suggested that it was indeed effective athelping them realize the piecewise nature of the electricfield. When plotting the electric field, students wereclearly contemplating its behavior in each region, andthey would often say things like “in here [a particularregion] it should drop off like 1=r2” or “in here, it isconstant.”. For example, Mike, an interviewed student,decided to find all of the expressions first before plottingthem. He found the following expressions:
r < a∶ E ¼ 0;
a < r < b∶ E ¼ kQ=r;
b < r < c∶ E ¼ 0;
r > c∶ E ¼ kQ=r:
After finding them in each region he went back to thecoordinate axes provided in each region and plotted eachexpression in those regions. Figure 7 shows the final graphhe drew, which he obtained by putting together the fourplots he drew in each region.As he was plotting the electric field in each region, he
clearly contemplated the behavior of the functions becausehe said,
The graph for the first region] will just be a horizontalline at zero, and then the graph for (ii), the way I have itset up it should be… ok, so radius increases, that woulddecrease this [expression for electric field], so it shouldbe a downward line […] and again, for (iii) it’s gonnabe a horizontal [line] and it’s zero and for radiusgreater than c, the electric field should also decrease asthe radius increases.
Mike did not seem to know what a function proportionalto 1=r looks like, and plotted it incorrectly. However, hedid contemplate the behavior of the electric field in each
region, and plotted each expression separately, which iswhat the SL1 intervention was designed to guide students todo. This approach (i.e., to plot each expression separately ineach region), common among students who solved the SL1version of the problem, is in stark contrast to some of theobserved plotting approaches of students provided with nosupport who plotted the electric field globally in all regions atonce by assuming it must be continuous (see, for example,Alex’s approach from study 1). It is possible that the studentsin the comparison group had more information to processdue to having to focus on more than one expression at a time,which increased their cognitive load [56] or distractedstudents and resulted in decreased performance. Interviewswith students provided with the medium level of supportsuggested that, similar to Mike, they seemed to focus theirattention only on the relevant region in which they wereasked to plot the electric field, which helped them realize thatthey need to plot each expression separately. Thus, thisscaffolding may have reduced the level of distraction andthe possible cognitive load.RQ3: How does the additional scaffolding (SL2)
compare to the medium level of scaffolding (SL1) interms of students’ representational consistency on thisproblem?—Our research indicates that the higher level ofscaffolding (SL2) actually had a detrimental effect (oppo-site of that intended) compared to the medium level ofscaffolding (SL1). In particular, fewer students in the SL2compared to the SL1 group were able to plot the electricfield consistent with the expressions they found.Students in the two scaffolding interventions were
asked to plot the electric field in each region immediatelyafter finding it, and, in addition, they were provided withcoordinate axes with the irrelevant regions shaded out.Table IV shows, in each of the four parts, the percentages ofstudents who were consistent between the mathematicalexpressions they found and their plots, and the comparisonvia chi-squared tests between students in SL1 and SL2groups. The results show that students in the SL2 groupwere significantly less consistent than students in the SL1group in all but the last part.The data shown in Table IV suggest that sometimes
students were consistent in one or more parts, but not all.
FIG. 7. Electric field plotted by Mike (an interviewed student).
TABLE IV. Percentages (and numbers) of students from theSL1 and SL2 groups who were consistent between their plots andthe expressions they found in each of the first four parts and pvalues for comparing the two groups.
(a)(i) (a)(ii) (a)(iii) (a)(iv)
SL1 86% (24) 67% (18) 77% (20) 69% (18)SL2 55% (17) 37% (11) 32% (6) 58% (11)p value 0.012a 0.024 0.005a 0.534a
aBecause of one or more expected cell frequencies being lessthan 10, Fisher’s exact test was performed instead of the standardchi-square test.
CHALLENGES IN DESIGNING APPROPRIATE … PHYS. REV. PHYS. EDUC. RES. 13, 020103 (2017)
020103-11
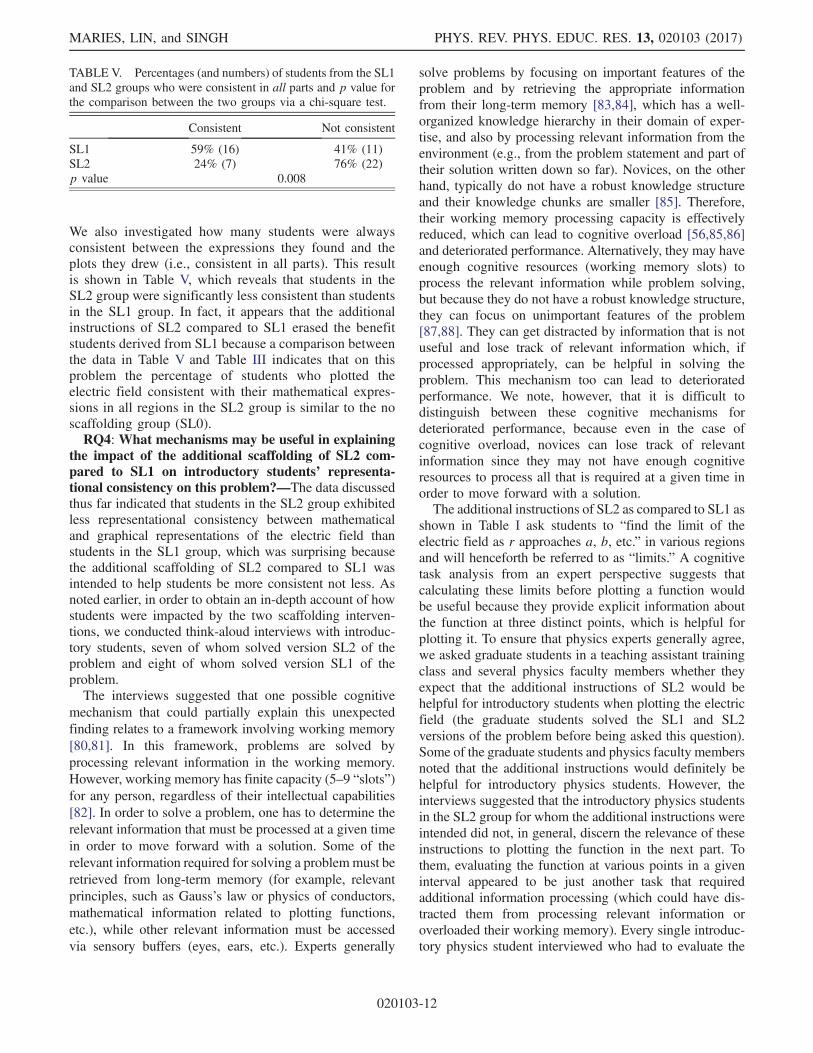
We also investigated how many students were alwaysconsistent between the expressions they found and theplots they drew (i.e., consistent in all parts). This resultis shown in Table V, which reveals that students in theSL2 group were significantly less consistent than studentsin the SL1 group. In fact, it appears that the additionalinstructions of SL2 compared to SL1 erased the benefitstudents derived from SL1 because a comparison betweenthe data in Table V and Table III indicates that on thisproblem the percentage of students who plotted theelectric field consistent with their mathematical expres-sions in all regions in the SL2 group is similar to the noscaffolding group (SL0).RQ4: What mechanisms may be useful in explaining
the impact of the additional scaffolding of SL2 com-pared to SL1 on introductory students’ representa-tional consistency on this problem?—The data discussedthus far indicated that students in the SL2 group exhibitedless representational consistency between mathematicaland graphical representations of the electric field thanstudents in the SL1 group, which was surprising becausethe additional scaffolding of SL2 compared to SL1 wasintended to help students be more consistent not less. Asnoted earlier, in order to obtain an in-depth account of howstudents were impacted by the two scaffolding interven-tions, we conducted think-aloud interviews with introduc-tory students, seven of whom solved version SL2 of theproblem and eight of whom solved version SL1 of theproblem.The interviews suggested that one possible cognitive
mechanism that could partially explain this unexpectedfinding relates to a framework involving working memory[80,81]. In this framework, problems are solved byprocessing relevant information in the working memory.However, working memory has finite capacity (5–9 “slots”)for any person, regardless of their intellectual capabilities[82]. In order to solve a problem, one has to determine therelevant information that must be processed at a given timein order to move forward with a solution. Some of therelevant information required for solving a problemmust beretrieved from long-term memory (for example, relevantprinciples, such as Gauss’s law or physics of conductors,mathematical information related to plotting functions,etc.), while other relevant information must be accessedvia sensory buffers (eyes, ears, etc.). Experts generally
solve problems by focusing on important features of theproblem and by retrieving the appropriate informationfrom their long-term memory [83,84], which has a well-organized knowledge hierarchy in their domain of exper-tise, and also by processing relevant information from theenvironment (e.g., from the problem statement and part oftheir solution written down so far). Novices, on the otherhand, typically do not have a robust knowledge structureand their knowledge chunks are smaller [85]. Therefore,their working memory processing capacity is effectivelyreduced, which can lead to cognitive overload [56,85,86]and deteriorated performance. Alternatively, they may haveenough cognitive resources (working memory slots) toprocess the relevant information while problem solving,but because they do not have a robust knowledge structure,they can focus on unimportant features of the problem[87,88]. They can get distracted by information that is notuseful and lose track of relevant information which, ifprocessed appropriately, can be helpful in solving theproblem. This mechanism too can lead to deterioratedperformance. We note, however, that it is difficult todistinguish between these cognitive mechanisms fordeteriorated performance, because even in the case ofcognitive overload, novices can lose track of relevantinformation since they may not have enough cognitiveresources to process all that is required at a given time inorder to move forward with a solution.The additional instructions of SL2 as compared to SL1 as
shown in Table I ask students to “find the limit of theelectric field as r approaches a, b, etc.” in various regionsand will henceforth be referred to as “limits.” A cognitivetask analysis from an expert perspective suggests thatcalculating these limits before plotting a function wouldbe useful because they provide explicit information aboutthe function at three distinct points, which is helpful forplotting it. To ensure that physics experts generally agree,we asked graduate students in a teaching assistant trainingclass and several physics faculty members whether theyexpect that the additional instructions of SL2 would behelpful for introductory students when plotting the electricfield (the graduate students solved the SL1 and SL2versions of the problem before being asked this question).Some of the graduate students and physics faculty membersnoted that the additional instructions would definitely behelpful for introductory physics students. However, theinterviews suggested that the introductory physics studentsin the SL2 group for whom the additional instructions wereintended did not, in general, discern the relevance of theseinstructions to plotting the function in the next part. Tothem, evaluating the function at various points in a giveninterval appeared to be just another task that requiredadditional information processing (which could have dis-tracted them from processing relevant information oroverloaded their working memory). Every single introduc-tory physics student interviewed who had to evaluate the
TABLE V. Percentages (and numbers) of students from the SL1and SL2 groups who were consistent in all parts and p value forthe comparison between the two groups via a chi-square test.
Consistent Not consistent
SL1 59% (16) 41% (11)SL2 24% (7) 76% (22)p value 0.008
MARIES, LIN, and SINGH PHYS. REV. PHYS. EDUC. RES. 13, 020103 (2017)
020103-12
electric field at three points in each interval before plottingit lost track of some important information at one point oranother: some students forgot to plot the electric field ina particular region, and some students went straight toevaluating the limits even before finding an expression forthe electric field in that region. An example of losing trackof important information comes from an interview withJohn. In finding the limits of the function in regions r < aand a < r < b, John did not substitute the correspondingvalues for r. For example, he wrote Eðr → aÞ ¼ kQ=r2
without substituting r ¼ a into the expression. But thenwhen he got to the first limit in region b < r < c[Eðr → bÞ], after writing down an initial expression inwhich he did not substitute r ¼ b, he suddenly realized onhis own that he should substitute r ¼ b:
John: “Oh, should I plug in […] ‘cause it’s r approach-ing b?”Researcher: “I can’t tell you that. […] What do youthink?”John (after a short pause): “I’ll just write it to be safe.”
He then went back and changed all the previous limitswhere he had not substituted the corresponding values for r.Discussions with John suggested that the piece of infor-mation “when you find a limit of a function, you shouldsubstitute the value of the variable in that function” waspresent in his long-term memory, but he did not retrieve ituntil a particular point. For a while, he appeared to befocusing on and processing other information in theproblem that was not helpful for figuring out the limitscorrectly. It is possible that part of the reason why Johnwent back to his previous answers for the limits andchanged them is that he was solving the problem whilethinking aloud in an interview session, and in a quizsituation he would have moved on without stopping toquestion the correctness of his work.Every single student interviewed who had to evaluate the
expression at various points immediately before plottingoverlooked something in a somewhat similar manner toJohn while solving the different parts of the problem, andthe intended scaffolding involving explicit evaluation ofthe function at the three points was not discerned by the
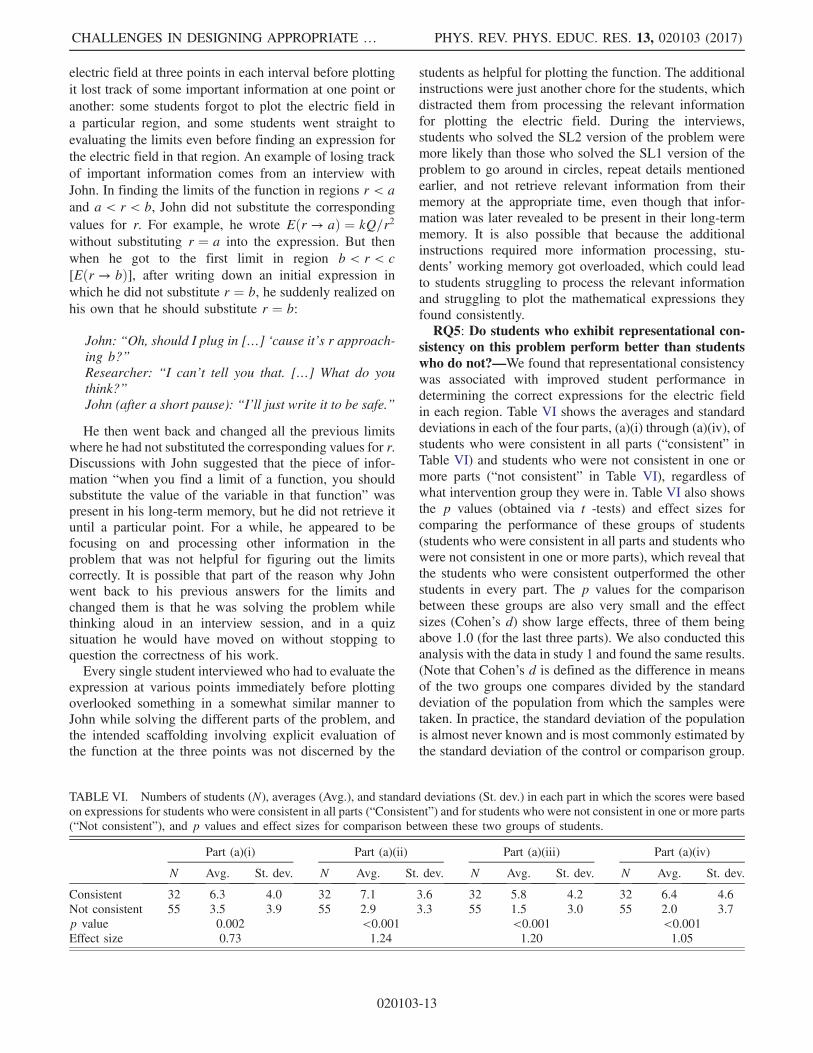
students as helpful for plotting the function. The additionalinstructions were just another chore for the students, whichdistracted them from processing the relevant informationfor plotting the electric field. During the interviews,students who solved the SL2 version of the problem weremore likely than those who solved the SL1 version of theproblem to go around in circles, repeat details mentionedearlier, and not retrieve relevant information from theirmemory at the appropriate time, even though that infor-mation was later revealed to be present in their long-termmemory. It is also possible that because the additionalinstructions required more information processing, stu-dents’ working memory got overloaded, which could leadto students struggling to process the relevant informationand struggling to plot the mathematical expressions theyfound consistently.RQ5: Do students who exhibit representational con-
sistency on this problem perform better than studentswho do not?—We found that representational consistencywas associated with improved student performance indetermining the correct expressions for the electric fieldin each region. Table VI shows the averages and standarddeviations in each of the four parts, (a)(i) through (a)(iv), ofstudents who were consistent in all parts (“consistent” inTable VI) and students who were not consistent in one ormore parts (“not consistent” in Table VI), regardless ofwhat intervention group they were in. Table VI also showsthe p values (obtained via t -tests) and effect sizes forcomparing the performance of these groups of students(students who were consistent in all parts and students whowere not consistent in one or more parts), which reveal thatthe students who were consistent outperformed the otherstudents in every part. The p values for the comparisonbetween these groups are also very small and the effectsizes (Cohen’s d) show large effects, three of them beingabove 1.0 (for the last three parts). We also conducted thisanalysis with the data in study 1 and found the same results.(Note that Cohen’s d is defined as the difference in meansof the two groups one compares divided by the standarddeviation of the population from which the samples weretaken. In practice, the standard deviation of the populationis almost never known and is most commonly estimated bythe standard deviation of the control or comparison group.
TABLE VI. Numbers of students (N), averages (Avg.), and standard deviations (St. dev.) in each part in which the scores were basedon expressions for students who were consistent in all parts (“Consistent”) and for students who were not consistent in one or more parts(“Not consistent”), and p values and effect sizes for comparison between these two groups of students.
Part (a)(i) Part (a)(ii) Part (a)(iii) Part (a)(iv)
N Avg. St. dev. N Avg. St. dev. N Avg. St. dev. N Avg. St. dev.
Consistent 32 6.3 4.0 32 7.1 3.6 32 5.8 4.2 32 6.4 4.6Not consistent 55 3.5 3.9 55 2.9 3.3 55 1.5 3.0 55 2.0 3.7p value 0.002 <0.001 <0.001 <0.001Effect size 0.73 1.24 1.20 1.05
CHALLENGES IN DESIGNING APPROPRIATE … PHYS. REV. PHYS. EDUC. RES. 13, 020103 (2017)
020103-13
For the two treatment groups we compare here, one canestimate the population standard deviation by using apooled standard deviation based on the two standarddeviations of the samples being compared. This pooledstandard deviation is defined as σpooled ¼
ffiffiffiffiffiffiffiffiffiffiffiffiffiffiffiffiffiffiffiffiffiffiffiffi
ðσ21 þ σ22Þ=2p
and was used as an estimation of the population standarddeviation [79].)
IV. SUMMARY
We found that calculus-based introductory physicsstudents have great difficulty translating from a mathemati-cal to a graphical representation—only about one-quarterof the students without support plotted electric fields thatwere consistent with their expressions in all regions for theproblem investigated here. Via think-aloud interviews,we also identified possible reasons for the poor studentperformance in translating the electric field from themathematical to the corresponding graphical representa-tion. Their difficulties were twofold: (1) students often didnot contemplate the behavior of the electric field in eachregion separately and plotted a continuous function by onlythinking about some vague global characteristics of how theelectric field changes in different regions, e.g., the electricfield is larger in one region than in another, the electricfield is positive in some regions, negative in others etc. (thisdifficulty was most common among students provided withno support), and (2) students realized that the electric fieldhas different behaviors in different regions; however, theyplotted what their qualitative analysis indicated the electricfield should be in a region instead of plotting the math-ematical functions they found. Our written data in study 1indicated that the first difficulty was significantly moreprevalent than the second one.Based on these findings, we developed two scaffolding
support levels with the intention of reducing the number ofstudents who have difficulty 1, or in other words, to helpstudents recognize that the electric field is a piecewisedefined function that must separately be plotted in eachregion. We found that providing additional scaffolding (byasking students to evaluate the electric field at the begin-ning, midpoint, and end point of each interval), althoughintended to help students be more consistent in plotting the
electric field, had an adverse effect on their representationalconsistency for the problem in electrostatics with sphericalsymmetry discussed here that can be solved using Gauss’slaw. Physics graduate students and physics faculty mem-bers (experts for this study) remarked that they expected theadditional scaffolding to be helpful. However, think-aloudinterviews conducted with introductory physics studentssuggested that they did not discern the relevance of theseadditional instructions in the SL2 version and often gotdistracted by this additional task that they treated as a chore(or they may have had cognitive overload due to the need toattend to additional instructions provided while engaged insolving the problem). An important instructional implica-tion of this finding is that, although cognitive task analysisfrom an expert perspective can be valuable and provideinsight into the scaffolding support that might be beneficialin a given situation, it is important to assess how studentsperceive the scaffolding support designed, for example, byobserving how students solve the problem with scaffoldingsupport in think-aloud interviews. As we found in ourinvestigation, a high level of scaffolding support from anexpert perspective may not always benefit students and itcan even lead to deteriorated performance.We also found that asking introductory students to plot
the electric field in each region immediately after findingan expression for it in that region (the SL1 intervention)impacted students positively, resulting in improved perfor-mance in translating between mathematical and graphicalrepresentations for the Gauss’s law problem analyzed.Interviews suggested that the improved representationalconsistency was partly due to students recognizing that theelectric field behaves differently in different regions andplotting it accordingly.
ACKNOWLEDGMENTS
We would like to thank the National Science Foundationfor Award No. DUE-1524575. Also, we are extremelygrateful to Professor F. Reif, Professor J. Levy, andProfessor R. P. Devaty, and all the members of thePhysics Education Research group at University ofPittsburgh for very helpful discussions and/or feedbackon the manuscript.
[1] F. Reif, Millikan Lecture 1994: Understanding and teach-ing important scientific thought processes, Am. J. Phys. 63,17 (1995); C. Singh, Assessing Student Expertise inIntroductory Physics with Isomorphic Problems. I. Perfor-mance on a non-intuitive problem pair from introductoryphysics, Phys. Rev. ST Phys. Educ. Res. 4, 010104 (2008);Assessing Student Expertise in Introductory Physics with
Isomorphic Problems. II. Effect of some potential factorson problem solving and transfer, Phys. Rev. ST Phys.Educ. Res. 4, 010105 (2008); When physical intuitionfails, Am. J. Phys. 70, 1103 (2002); B. Brown, A. Mason,and C. Singh, Improving performance in quantum me-chanics with explicit incentives to correct mistakes, Phys.Rev. Phys. Educ. Res. 12, 010121 (2016); A. Mason and
MARIES, LIN, and SINGH PHYS. REV. PHYS. EDUC. RES. 13, 020103 (2017)
020103-14
C. Singh, Do advanced students learn from their mistakeswithout explicit intervention? Am. J. Phys. 78, 760 (2010).
[2] J. Larkin, The role of problem representation in physics,in Mental Models, edited by D. Gentner and A. Stevens(Erlbaum, Hillsdale, NJ, 1983).
[3] Y. Qin and H. Simon, AAAI Technical Report No. SS-92-02, 1992.
[4] P. Kohl and N. Finkelstein, Patterns of multiple represen-tation use by experts and novices during physics problemsolving, Phys. Rev. ST Phys. Educ. Res. 4, 010111 (2008).
[5] J. Larkin and F. Reif, Understanding and teaching problemsolving in physics, Eur. J. Sci. Ed. 1, 191 (1979).
[6] J. Larkin and H. Simon, Why a diagram is (sometimes)worth ten thousand words, Cogn. Sci. 11, 65 (1987).
[7] J. Zhang, The nature of external representations in problemsolving, Cogn. Sci. 21, 179 (1997).
[8] D. Huffman, Effect of explicit problem solving strategieson high school students’ problem-solving performance andconceptual understanding of physics, J. Res. Sci. Teach.34, 551 (1997).
[9] A. Van Heuvelen, Overview, case study physics, Am. J.Phys. 59, 898 (1991).
[10] L. C. McDermott, in Toward a Scientific Practice ofScience Education, edited by M. Gardner, J. G. Greeno,F. Reif, A. H. Schoenfeld, A. diSessa, and E. Stage(Lawrence Erlbaum, Hillsdale, NJ, 1990), pp. 3–30.
[11] R. J. Dufresne, W. J. Gerace, and W. J. Leonard, Solvingphysics problems with multiple representations, Phys.Teach. 35, 270 (1997); S. Y. Lin and C. Singh, Challengesin using analogies, Phys. Teach. 49, 512 (2011); Usingisomorphic problems to learn introductory physics, Phys.Rev. ST Phys. Educ. Res. 7, 020104 (2011); Using anisomorphic problem pair to learn introductory physics:Transferring from a two-step problem to a three-stepproblem, Phys. Rev. ST Phys. Educ. Res. 9, 020114 (2013).
[12] D. Meltzer, Relation between students’ problem solvingperformance and representational mode, Am. J. Phys. 73,463 (2005).
[13] D. Hestenes, M. Wells, and G. Swackhammer, ForceConcept Inventory, Phys. Teach. 30, 141 (1992).
[14] R. R. Hake, Interactive-engagement versus traditionalmethods: A six-thousand-student survey of mechanics testdata for introductory physics courses, Am. J. Phys. 66, 64(1998).
[15] L. Ding, R. Chabay, B. Sherwood, and R. Beichner,Evaluating an electricity and magnetism assessment tool:Brief electricity and magnetism assessment, Phys. Rev. STPhys. Educ. Res. 2, 010105 (2006).
[16] M. S. Sabella and S. A. Barr, Implementing research–basedinstructional materials to promote coherence in physicsknowledge for the urban STEM student, in Proceedings ofthe American Society for Engineering Education, 2008(Pittsburgh, PA, 2008), pp. 395–409.
[17] P. Kohl, D. Rosengrant, and N. Finkelstein, Strongly andweakly directed approaches to teaching multiple represen-tation use in physics, Phys. Rev. ST Phys. Educ. Res. 3,010108 (2007).
[18] P. Kohl and N. Finkelstein, Effect of instructional envi-ronment on physics students’ representational skills, Phys.Rev. ST Phys. Educ. Res. 2, 010102 (2006).
[19] Z. Hrepic, N. S. Rebello, and D. A. Zollman, Remedyingshortcomings of lecture-based physics instruction throughpen-based, wireless computing and DyKnow software, inReading: Assessment, Comprehension, and Teaching,edited by N. H. Salas and D. D. Peyton (Nova SciencePublishers, 2009), pp. 97–129.
[20] Z. Chen, T. Stelzer, and G. Gladding, Using multimediamodules to better prepare students for introductoryphysics lecture, Phys. Rev. ST Phys. Educ. Res. 6, 010108(2010).
[21] S. Aalie and D. Demaree, Toward meaning and scientificthinking in the traditional Freshman laboratory: Openingthe “idea space”, AIP Conf. Proc. 1289, 1 (2010).
[22] R. K. Thornton and D. R. Sokoloff, Assessing studentlearning of Newton’s laws: The Force and MotionConceptual Evaluation and the evaluation of active learn-ing laboratory and lecture curricula, Am. J. Phys. 66, 338(1998).
[23] R. Beichner, R. Chabay, and R. Sherwood, Labs for theMatter & Interactions curriculum, Am. J. Phys. 78, 456(2010).
[24] R. Lesh, T. Post, and M. Behr, Representations andtranslating between representations in mathematics learn-ing and problem solving, in Problems of Representationsin the Teaching and Learning of Mathematics, edited byC. Janvier (Lawrence Erlbaum Hillsdale, New Jersey,1987), pp. 33–40.
[25] B. Ibrahim and N. S. Rebello, Representational task for-mats and problem solving strategies in kinematics andwork, Phys. Rev. ST Phys. Educ. Res. 8, 010126 (2012).
[26] L. C. McDermott, M. L. Rosenquist, and E. H. van Zee,Student difficulties in connecting graphs and physics:Examples from kinematics, Am. J. Phys. 55, 503 (1987).
[27] F. M. Goldberg and J. H. Anderson, Student difficultieswith graphical representations of negative velocity, Phys.Teach. 27, 254 (1989).
[28] I. Testa, G. Muoroy, and E. Sassi, Students’ reading imagesin kinematics: The case of real-time graphs, Int. J. Sci.Educ. 24, 235 (2002).
[29] T. Graham and J. Sharp, An investigation into ablestudents’ understanding of motion graphs, TeachingMathematics and Its Applications 18, 128 (1999).
[30] D. H. Nguyen and N. S. Rebello, Students’ understandingand application of the area under the curve concept in physicsproblems, Phys. Rev. ST Phys. Educ. Res. 7, 010112 (2011).
[31] M. L. Rosenquist and L. C. McDermott, Kinematics(ASUW Publishing, University of Washington, Seattle,WA, 1985).
[32] R. K. Thornton, Tools for scientific thinking:Microcomputer-based laboratories for physics teachers,Phys. Educ. 22, 230 (1987).
[33] L. K. Wilkinson, J. Risley, J. Gastineau, P. V. Engelhardt,and S. F. Schultz, Graphs and tracks impresses as akinematics teaching tool, Comput. Phys. 8, 696 (1994).
[34] E. B. Pollock, J. R. Thompson, and D. B. Mountcastle,Student understanding of the physics and mathematics ofprocess variables in P-V diagrams, AIP Conf. Proc. 951,168 (2007).
[35] D. E. Meltzer, Investigation of students’ reasoning regard-ing heat, work, and the first law of thermodynamics in an
CHALLENGES IN DESIGNING APPROPRIATE … PHYS. REV. PHYS. EDUC. RES. 13, 020103 (2017)
020103-15
introductory calculus-based general physics course, Am. J.Phys. 72, 1432 (2004).
[36] W. M. Christensen and J. R. Thompson, Investigatinggraphical representations of slope and derivative withouta physics context, Phys. Rev. ST Phys. Educ. Res. 8,023101 (2012).
[37] T. A. Romberg, E. Fennema, and T. P. Carpenter, Integrat-ing Research on the Graphical Representation of Func-tions (Erlbaum, Hillsdale, NJ 1993).
[38] G.Harel and E.Dubinsky,TheConcept of Function: Aspectsof Epistemology and Pedagogy, in MAA Notes Vol. 25(Mathematical Association of America, Washington, DC,1991).
[39] F. Hitt, Difficulties in the articulation of different repre-sentations linked to the concept of function, J. Math.Behav. 17, 123 (1998).
[40] S. Vinner and T. Dreyfus, Images and definitions for theconcept of function, J. Res. Math. Educ. 20, 356 (1989).
[41] P. W. Thompson, Students, functions, and the undergradu-ate curriculum, in Research in Collegiate MathematicsEducation, edited by E. Dubinsky, A. H. Schoenfeld, andJ. J. Kaput (American Mathematical Society, Providence,RI, 1994), Vol. 1, pp. 21–44.
[42] S. Arnold, Investigating functions using real-world data,Aust. Sen. Math. J. 20, 44 (2006).
[43] M. Borenstein, Mathematics in the real world, Learn. Lead.Technol. 24, 34 (1997).
[44] R. Hershkowitz and B. B. Schwartz, Unifying cognitiveand sociocultural aspects in research on learning thefunction concept, in Proceedings of the Conference ofthe International Group for the Psychology of MathematicsEducation, edited by E. Pehkkonnen (Gummerus, Lathi,Finland, 1997), Vol. 1.
[45] G. Leinhardt, O. Zaslavsky, and M. K. Stein, Functions,graphs, and graphing: Tasks, learning, and teaching, Rev.Educ. Res. 60, 1 (1990).
[46] H. Brasell and M. B. Rowe, Graphing skills among high-school physics students, Sch. Sci. Math. 93, 63 (1993).
[47] T. Dreyfus and T. Halevi, QuadFun: A case study of pupilcomputer interaction, J. Comput. Math. Sci. Teach. 10,43 (1991).
[48] R. Even, Factors involved in linking representations offunctions, J. Math. Behav. 17, 105 (1998).
[49] A. Acevedo Nistal, W. Van Dooren, G. Clarebout, J. Elen,and L. Verschaffel, Conceptualising, investigating andstimulating representational flexibility in mathematicalproblem solving and learning: A critical review, ZDMMathematics Education 41, 627 (2009).
[50] D. De Bock, W. Van Dooren, and L. Verschaffel, Students’understanding of proportional, inverse proportional andaffine functions: Two studies on the role of externalrepresentations, Int. J. Sci. Math. Educ. 13, 47 (2015).
[51] A. Bell and C. Janvier, The interpretations of graphsrepresenting situations, Learn. Math. 2, 34 (1981).
[52] D. Hammer, Epistemological considerations in teachingintroductory physics, Sci. Educ. 79, 393 (1995).
[53] J. F. Wagner, A transfer-in-pieces consideration of theperception of structure in the transfer of learning, J. Learn.Sci. 19, 443 (2010).
[54] M. Planinic, L. Ivanjek, A. Susak, and Z. Milin-Sipus,Comparison of university students’ understanding ofgraphs in different contexts, Phys. Rev. ST Phys. Educ.Res. 9, 020103 (2013).
[55] M. Planinic, Z. Milin-Sipus, and H. Katic, Comparison ofstudent understanding of line graph slope in physics andmathematics, Int. J. Sci. Math. Educ. 10, 1393 (2012).
[56] J. Sweller, Cognitive load during problem solving: Effectson learning, Cogn. Sci. 12, 257 (1988).
[57] B. Eylon and U. Ganiel, Macro-micro relationships: Themissing link between electrostatics and electrodynamics instudents’ reasoning, Int. J. Sci. Educ. 12 79 (1990).
[58] K. Zuza, J. Guisasola, M. Michelini, and L. Santi,Rethinking Faraday’s law for teaching motional electro-motive force, Eur. J. Phys. 33, 397 (2012); C. Singh,Student understanding of symmetry and Gauss’s law ofelectricity, Am. J. Phys. 74, 923 (2006).
[59] K. Zuza, M. De Cock, P. van Kampen, and L. Bollen,University students’ understanding of the electromotiveforce concept in the context of electromagnetic induction,Eur. J. Phys. 37, 065709 (2016).
[60] B. Thacker, U. Ganiel, and D. Boys, Macroscopic phe-nomena and microscopic processes: Student understandingof transients in direct current electric circuits, Am. J. Phys.67, S25 (1999).
[61] J. Li and C. Singh, Students’ difficulties with equationsinvolving circuit elements, AIP Conf. Proc. 1413, 243(2012).
[62] J. Li and C. Singh, Students’ common difficulties andapproaches while solving conceptual problems with non-identical light bulbs in series and parallel, Eur. J. Phys. 37,065708 (2016).
[63] J. Bilak and C. Singh, Improving students’ conceptualunderstanding of conductors and insulators, AIP Conf.Proc. 951, 49 (2007).
[64] Z. Isvan and C. Singh, Improving student understanding ofCoulomb’s law and Gauss’s law, AIP Conf. Proc. 883, 181(2007).
[65] A. Maries and C. Singh, Should students be provideddiagrams or asked to draw them while solving introductoryphysics problems?, AIP Conf. Proc. 1413, 263 (2012).
[66] A. Maries and C. Singh, To use or not to use diagrams: Theeffect of drawing a diagram in solving introductory physicsproblems, AIP Conf. Proc. 1513, 282 (2013).
[67] C. Singh, Impact of peer interaction on conceptual testperformance, Am. J. Phys. 73, 446 (2005); J. Li and C.Singh, Investigating and improving introductory physicsstudents’ understanding of the electric field and super-position principle, Euro. J. Phys. 38, 055702 (2017).
[68] J. Li and C. Singh, Developing a magnetism conce-ptual survey and assessing gender differences in studentunderstanding of magnetism, AIP Conf. Proc. 1413, 43(2012); J. Li and C. Singh, Developing and validating aconceptual survey to assess introductory physics students’understanding of magnetism, Euro. J. Phys. 38, 025702(2017).
[69] D. Maloney, T. O’Kuma, C. Hieggelke, and A. VanHeuvelen, Surveying students’ conceptual knowledge ofelectricity and magnetism, Am. J. Phys. 69, S12 (2001).
MARIES, LIN, and SINGH PHYS. REV. PHYS. EDUC. RES. 13, 020103 (2017)
020103-16
[70] L. Ding, R. Chabay, B. Sherwood, and R. Beichner,Valuating an assessment tool: Brief electricity and magnet-ism assessment, Phys. Rev. ST Phys. Educ. Res. 2, 010105(2006).
[71] P. Engelhardt and R. Beichner, Students’ understanding ofdirect current resistive electrical circuits, Am. J. Phys. 72,98 (2004).
[72] K. Ericsson and H. Simon, Verbal reports as data, Psychol.Rev. 87, 215 (1980).
[73] E. F. Redish, R. N. Steinberg, and J. M. Saul, Studentexpectations in introductory physics, Am. J. Phys. 66,212 (1998).
[74] S. F. Chipman, J. M. Schraagen, and V. L. Shalin, Intro-duction to cognitive task analysis, in Cognitive TaskAnalysis, edited by J. M. Schraagen, S. F. Chipman, andV. J. Shute (Lawrence Erlbaum Associates Mahwah, NJ,2000), pp. 3–23.
[75] R. E. Clark and F. Estes, Cognitive task analysis, Int. J.Educ. Res. 25, 403 (1996).
[76] J. Heller and F. Reif, Prescribing effective human problemsolving processes: Problem description in physics, Cognit.Instr. 1, 177 (1984).
[77] P. Nieminen, A. Savinainen, and J Viiri, Relations betweenrepresentational consistency, conceptual understanding ofthe force concept, and scientific reasoning, Phys. Rev. STPhys. Educ. Res. 8, 010123 (2012).
[78] D. Rosengrant, Ph.D. Dissertation, Rutgers University, 2007.[79] G. V. Glass and K. D. Hopkins, Statistical Methods in
Education & Psychology (Allyn & Bacon, Boston, 1996).[80] J. R. Anderson, Learning and Memory (Wiley, New York,
1995).[81] A. Newell and H. A. Simon, Human Problem Solving
(Prentice-Hall, Englewood Cliffs, NJ, 1972).
[82] G. Miller, The magical number seven, plus or minus two:Some limits on our capacity for processing information,Psychol. Rev. 63, 81 (1956).
[83] M. T. H. Chi, P. J. Feltovich, and R. Glaser, Categorizationand representation of physics knowledge by experts andnovices, Cogn. Sci. 5, 121 (1981).
[84] J. L. Docktor, J. P. Mestre, and B. H. Ross, Impact of ashort intervention on novices’ categorization criteria, Phys.Rev. ST Phys. Educ. Res. 8, 020102 (2012); A. J. Masonand C. Singh, Assessing expertise in introductory physicsusing categorization task, Phys. Rev. ST Phys. Educ. Res.7, 020110 (2011); Using categorization of problems as aninstructional tool to help introductory students learnphysics, Phys. Educ. 51, 025009 (2016); S. Lin and C.Singh, Categorization of quantum mechanics problems byprofessors and students, Eur. J. Phys. 31, 57 (2010); C.Singh, Categorization of problems to assess and improveproficiency as teacher and learner, Am. J. Phys. 77, 73(2009).
[85] W. G. Chase and H. Simon, Perception in chess, Cogn.Psychol. 4, 55 (1973).
[86] F. Paas, A. Renkel, and J. Sweller, Cognitive load theory:Instructional implications of the interaction between in-formation structures and cognitive architecture, Instr. Sci.32, 1 (2004).
[87] A. Schoenfeld and D. J. Herrmann, Problem perceptionand knowledge structure in expert novice mathematicalproblem solvers, J. Exp. Psychol. Learn. Mem. Cogn. 8,484 (1982).
[88] M. S. Sabella and E. F. Redish, Knowledge organizationand activation in physics problem solving, Am. J. Phys. 75,1017 (2007).
CHALLENGES IN DESIGNING APPROPRIATE … PHYS. REV. PHYS. EDUC. RES. 13, 020103 (2017)
020103-17