changes in end-user petroleum product prices -...
TRANSCRIPT

Extractive Industries and Development Series #2February 2009
Changes in End-User Petroleum Product Prices
A Comparison of
48 Countries
Masami Kojima
The World Bank1818 H Street, N.W.Washington, D.C. 20433USA
www.worldbank.org/ogmc (OR /oil OR /gas OR /mining)www.ifc.org/ogmc (OR /oil OR /gas OR /mining)

Extractive Industries and Development Series #2February 2009
Changes in End-User Petroleum Product Prices
A Comparison of
48 Countries
Masami Kojima
E x t r a c t i v e I n d u s t r i e s f o r D e v e l o p m e n t S e r i e s

World Bank Group’s Oil, Gas, and Mining Policy DivisionOil, Gas, Mining, and Chemicals Department
A joint service of the World Bank and the International Finance Corporation
The Oil, Gas, and Mining Policy Division series publishes reviews and analyses of sector experience from around the world as well as new findings from analytical work. It places particular emphasis on how the experience and knowledge gained relates to developing country policy makers, communities affected by extractive industries, extractive industry enterprises, and civil society organizations. We hope to see this series inform a wide range of interested parties on the opportunities as well as the risks presented by the sector.
The findings, interpretations, and conclusions expressed in this paper are entirely those of the authors and should not be attributed in any manner to the World Bank or its affiliated organizations, or to members of its Board of Executive Directors or the countries they represent. The World Bank does not guarantee the accuracy of the data included in this publication and accepts no responsibility whatsoever for any consequence of their use.

Copyright ©2009www.worldbank.org/ogmc (OR /oil OR /gas OR /mining)www.ifc.org/ogmc (OR /oil OR /gas OR /mining) Cover Photos: Oil rig, hematite-banded ironstone, LNG tanker
iiiE x t r a c t i v e I n d u s t r i e s f o r D e v e l o p m e n t S e r i e s
Table of Contents
v Acknowledgments
vi Abbreviations
1 Executive Summary
5 Changes in End-User Petroleum Product Prices
5 Background
7 Snapshot of Fuel Prices: August 2008
12 Passing through of Gasoline and Diesel Price Increases
13 Pass-through Coefficients
19 Conclusions
25 Appendix 1: Sources of Data and Prices
33 Appendix 2: Pass-through Coefficients and Regression Analysis
37 References


vE x t r a c t i v e I n d u s t r i e s f o r D e v e l o p m e n t S e r i e s
Acknowledgments
This paper was prepared by Masami Kojima of the Oil, Gas, and Mining Policy Division. The paper benefited from helpful comments provided by Sudeshna Ghosh Banerjee, Linda Van Gelder, Ejaz Ghani, Varun Kshirsagar, and Hassan Zaman, all of the World Bank. The author is grateful to the following World Bank staff who helped collect local retail prices:
Veasna Bun for Cambodia•
Mohab Awad Mokhtar Hallouda for the Arab Republic of Egypt•
Mesfin Girma Bezawagaw for Ethiopia•
Hania Sahnoun for Iraq•
Ilyas Sarsenov for Kazakhstan•
Kheungthong Vongsaya for the Lao People’s Democratic Republic•
Roshan Darshan Bajracharya and Sunita Kumari Yadav for Nepal•
Utkirdjan Umarov for Tajikistan •
Nita Congress edited and laid out the document, and Esther Petrilli-Massey of the Oil, Gas, and Mining Policy Division oversaw its production.

c h a n g E S I n E n D - U S E r P E t r o l E U m P r o D U c t P r I c E Svi
Abbreviations
GDP gross domestic productLPG liquefied petroleum gasOECD Organisation for Economic Co-operation and DevelopmentRON research octane number

1E x t r a c t i v e I n d u s t r i e s f o r D e v e l o p m e n t S e r i e s
Executive Summary
Monthly average world gasoline prices increased from US$0.26 a liter in January 2004 to US$0.37 in January 2007 and to US$0.73 by August 2008. Diesel prices were US$0.25 a liter in January 2004, US$0.42 in January 2007, and US$0.84 in August 2008. During this period, some developing countries experienced a large currency appreciation which partially helped offset oil price increases. Other countries experienced currency depreciation, exacerbating the impact of steep oil price rises.
This paper presents retail prices of four petroleum products in August 2008 in up to 56 countries, and examines the degree of pass-through to consumers of increases in world gasoline and diesel prices since January 2004 in 48 countries. For all but three developing countries, the study further divides the time period into two subperiods: January 2004–January 2007 and January 2007–August 2008. January 2007 marked the lowest price level in more than a year and a half, helping those governments that intervene in domestic fuel price–setting to adjust to higher world oil prices. Not passing through world oil price increases fully can result in direct fiscal costs (from fuel price subsidies funded by the budget or fuel tax reductions); indirect fiscal costs (such as through contingent liabilities incurred by national oil companies accumulating debts); and adverse effects on the level of competition and efficiency in the oil sector if firms are forced to carry some of the cost of price subsidies, making it more difficult to attract investment to the sector.
Retail fuel prices of gasoline and diesel in August 2008 were, on average, about 50 percent higher in industrial countries than in developing countries. Gasoline, diesel, and household kerosene prices in oil-importing developing countries were twice as high as those in oil-exporting countries. By region, Sub-Saharan Africa had the highest gasoline and diesel prices in the developing world, a consequence of the landlocked nature of some of its countries, inadequate economies of scale in small markets, inadequate infrastructure for transporting fuels, rising demand for diesel to offset power shortages, and relatively high rates of taxation. Retail prices in Asia and Latin America were comparable. Kerosene prices were lower than diesel prices in two-thirds of the countries for which price data were obtained. Retail prices of liquefied petroleum gas, used in household cooking, were low in

c h a n g E S I n E n D - U S E r P E t r o l E U m P r o D U c t P r I c E S2
relation to world prices, reflecting the tendency of governments to subsidize this fuel.
Pass-through coefficients—expressed as the ratio of the increase in the retail price to the increase in the international price, both measured in local currency—exceeded 2 on average for gasoline in developing countries and were higher than in industrial countries in the first subperiod (table E.1). In the remaining five cases—gasoline in the second subperiod and in the full period, and diesel in both subperiods and the full period—the extent of pass-through was higher in the eight industrial countries examined. However, when averaged across oil-importing developing countries, pass-through coefficients were higher in developing countries than in the industrial countries except during the second subperiod. Sub-Saharan Africa registered higher average pass-through coefficients than industrial countries in each of the three time intervals for both fuels. Despite higher degrees of pass-through, retail price levels were higher in industrial countries than in developing oil-importing countries and in Sub-Saharan Africa in August 2008, reflecting the lower levels from which prices were raised in the latter two categories.
Developing countries as a whole did not pass through oil price increases fully during the second subperiod, which lasted about half as long as the first subperiod but had three times the price increases of that subperiod. For diesel, only industrial countries and Sub-Saharan Africa recorded
Table E.1 Gasoline and Diesel Pass-through Coefficients
Country category Gasoline Diesel
2004–07
2007–08
2004–08
2004–07
2007–08
2004–08
All 2.3 1.0 1.3 1.3 0.9 1.1
Developing countries 2.4 0.9 1.3 1.3 0.9 1.1
Oil importing 2.9 1.2 1.6 1.7 1.1 1.3
Oil exporting 1.4 0.4 0.6 0.7 0.5 0.6
Sub-Saharan Africa 3.3 1.6 2.0 1.7 1.5 1.6
Asia 2.8 1.1 1.5 1.5 0.9 1.1
Latin America 2.0 0.5 0.8 1.1 0.6 0.9
Middle East and North Africa 1.5 0.4 0.7 0.8 0.5 0.6
Industrial countries 1.7 1.3 1.4 1.4 1.1 1.2
Source: Author’s calculations.
Note: There are 10, 12, 9, and 8 countries in Sub-Saharan Africa, Asia, Latin America, and the Middle East and North Africa, respectively, in the full period; and 8, 12, 8, and 8 countries, respectively, in each subpe-riod. For a complete list of the countries in the sample, see table A2.1.

3E x t r a c t i v e I n d u s t r i e s f o r D e v e l o p m e n t S e r i e s
pass-through coefficients greater than 1. A failure to pass through price increases fully interferes with the market response to high oil prices and potentially keeps demand higher than otherwise, thereby contributing to oil price volatility. In several countries, the policy of limiting domestic retail price increases was yielding extensive negative fiscal effects by mid-2008.
Correlation coefficients with macroeconomic parameters suggests that the degree of pass-through increased with increasing currency appreciation as expected. The extent of pass-through was also higher in countries with high initial price levels—that is, countries that had kept domestic prices low to begin with were less likely to increase prices in response to rising world oil prices—and decreased with increasing per capita income. Regression analysis suggests that during 2004–07, a period marked by large price increases, the gasoline pass-through coefficient decreased by about 0.4 to 0.5 percentage points for every percentage point increase in gross domestic product per capita measured at purchasing power parity.

5E x t r a c t i v e I n d u s t r i e s f o r D e v e l o p m e n t S e r i e s
Changes in End-User Petroleum Product Prices
Background
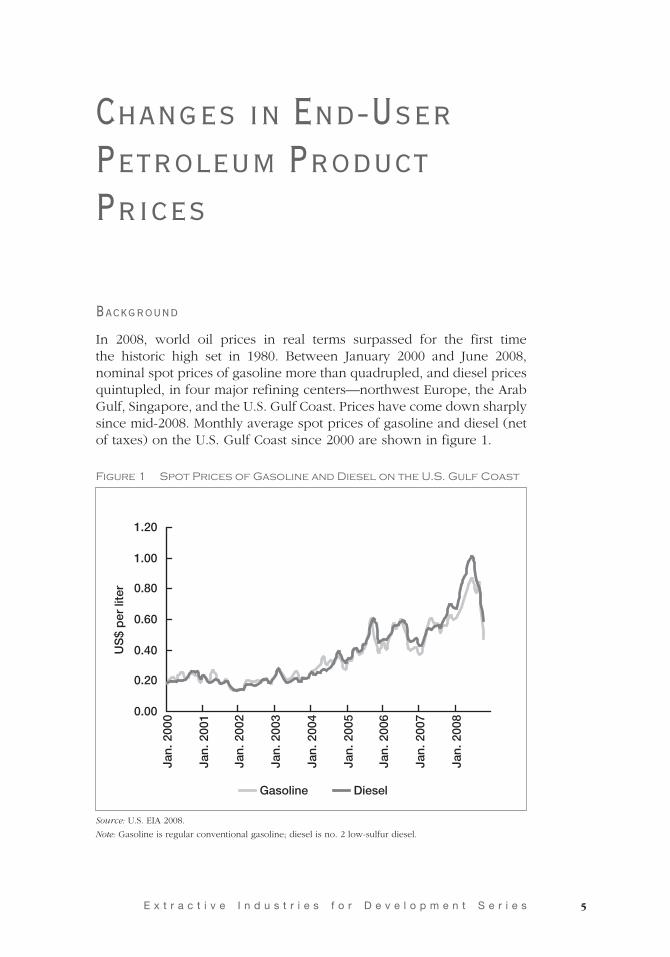
In 2008, world oil prices in real terms surpassed for the first time the historic high set in 1980. Between January 2000 and June 2008, nominal spot prices of gasoline more than quadrupled, and diesel prices quintupled, in four major refining centers—northwest Europe, the Arab Gulf, Singapore, and the U.S. Gulf Coast. Prices have come down sharply since mid-2008. Monthly average spot prices of gasoline and diesel (net of taxes) on the U.S. Gulf Coast since 2000 are shown in figure 1.
0.00
0.20
0.40
0.60
0.80
1.00
1.20
Jan.
200
0
Jan.
200
1
Jan.
200
2
Jan.
200
3
Jan.
200
4
Jan.
200
5
Jan.
200
6
Jan.
200
7
Jan.
200
8
US
$ p
er li
ter
Gasoline Diesel
Figure 1 Spot Prices of Gasoline and Diesel on the U.S. Gulf Coast
Source: U.S. EIA 2008.
Note: Gasoline is regular conventional gasoline; diesel is no. 2 low-sulfur diesel.

c h a n g E S I n E n D - U S E r P E t r o l E U m P r o D U c t P r I c E S6
The pace of price increases since 2004 is unprecedented. Even in countries that have long since liberalized petroleum product prices, there have been calls for government intervention to cushion the impact of steep price rises on consumers and the economy. Many developing country governments are involved in setting domestic prices. Some, such as Ghana, set price ceilings. Others, Mozambique among them, have formulas in place that are intended to be used regularly to adjust domestic prices in line with international price movements. A number of countries—including Bangladesh, China, Egypt, Ethiopia, India, Indonesia, the Islamic Republic of Iran, Malaysia, Nepal, Nigeria, Sri Lanka, the Syrian Arab Republic, the República Bolivariana de Venezuela, and the Republic of Yemen—set fuel prices in an ad hoc manner, and most have seen growing price subsidies in recent years.
This is the second paper in a series summarizing work undertaken to assess the implications of higher oil prices on fuel use, the downstream petroleum sector, and household fuel consumption in the developing world. It follows a recent publication on a decomposition analysis of vulnerability to oil price increases, where vulnerability is defined as the percentage of gross domestic product (GDP) spent on net imports of crude oil and petroleum products (Bacon and Kojima 2008). This paper focuses on the extent to which international petroleum product price increases have been passed on to consumers. An earlier report computed pass-through coefficients for gasoline and diesel between January 2004 and April 2006 in 31 developing countries and 4 members of the Organisation for Economic Co-operation and Development (OECD) (Bacon and Kojima 2006); this study expands the sample to 40 developing countries and 8 OECD countries, and extends the period from January 2004 to August 2008. For all but three developing countries, the study period is split into two subperiods, the first covering January 2004–January 2007 and the second covering January 2007–August 2008.
The International Monetary Fund recently compared the extent of pass-through of gasoline, kerosene, and diesel price increases in 2006 and 2007 in several developing countries (24 to 42 countries, depending on the fuel). Although specific details are not given, the price survey reports that the number of countries fully passing through price increases declined markedly between 2006 and 2007 (Mati 2008). A World Bank paper on oil intensities and oil prices in Latin America (Alaimo and Lopez 2008) found that, between January 2005 and December 2007, net oil exporters did not pass through international oil price increases. In importing countries, a 1 percent increase in crude oil price would, on average, translate into domestic gasoline and diesel price increases of 0.50 to 0.65 percent. The authors observe that world oil price increases

7E x t r a c t i v e I n d u s t r i e s f o r D e v e l o p m e n t S e r i e s
did not lead to declining energy intensity of the economy in the region, and posit government limits placed on oil price increases on the domestic market as a possible explanation.
This paper begins by giving a snapshot of retail fuel prices in developing countries. It then presents the results of pass-through calculations.
Snapshot of Fuel Prices: August 2008
August 2008 retail prices of gasoline and diesel in 48 developing countries, of kerosene in 33 countries, and of liquefied petroleum gas (LPG) in 29 countries were collected. Where governments control domestic fuel prices, a portion of a fuel may be sold in some countries at the controlled price and the rest at higher or market prices. This happens particularly with gasoline: most countries have more than one grade, and where gasoline prices are controlled, prices of one or two (typically lower) grades may be controlled and the rest sold at markedly higher (as in the Islamic Republic of Iran) or market (as in Iraq) prices. In such countries, the study used government-controlled prices. Regular gasoline prices were used unless the octane number was notably lower than those prevailing on the international market. The sources of data, gasoline grades, the rationale for selecting specific grades, and the existence of other price levels not used in this study are described in appendix 1. As the appendix explains, the actual prices paid by consumers could have been higher or lower than the prices used. Consequently, the results here should be taken as indicative, and not firm, findings.
Gasoline and diesel prices are shown figure 2, which also includes prices from 8 OECD countries for comparison. For both fuels, Zambia recorded the highest retail prices in the sample. Among developing countries, the 10 highest gasoline and 11 highest diesel prices were found in Sub-Saharan Africa. This in part reflects disruptions and other supply problems in some countries in the region, especially those that are landlocked. For example, countries that import through Kenya have frequently encountered supply problems in recent years and have experienced many instances of serious shortages accompanied by sharp price hikes. In Zambia, demand for diesel in particular reached all-time highs in the middle of 2008, as many copper mines and other users turned to diesel-based electricity generation in response to domestic power outages (Global Insight Daily Analysis 2008).
Retail prices of kerosene for household use in 33 developing countries are shown in figure 3. Kerosene is used by the poor in developing countries for cooking and, among households that are not connected to

c h a n g E S I n E n D - U S E r P E t r o l E U m P r o D U c t P r I c E S8
Figure 2 Retail Prices of Gasoline and Diesel, August 2008
0.00 0.50 1.00 1.50 2.00 2.50 3.00
US$ per liter of gasoline
0.00 0.50 1.00 1.50 2.00 2.50
US$ per liter of diesel
ZambiaUnited Kingdom
GermanyItaly
FranceSenegalGuinea
MadagascarMalawi
SpainMozambique
UgandaJapan
RwandaKenya
TanzaniaMoroccoSri Lanka
NepalCambodia
TogoCameroon
South AfricaBangladesh
ChileLao PDR
PhilippinesGuatemalaNicaragua
CanadaIndia
PeruPakistan
HondurasJordan
VietnamThailand
TunisiaColombia
GhanaUnited States
EthiopiaTajikistan
ChinaArgentina
KazakhstanSyrian Arab Rep.
MalaysiaMexico
IndonesiaNigeria
IraqEgypt, Arab Rep. of
Yemen, Rep. ofIran, Islamic Rep. ofVenezuela, R. B. de
ZambiaUnited Kingdom
SenegalItaly
GermanyMadagascar
TanzaniaRwandaUgandaFranceGuineaMalawi
SpainJapanKenya
MozambiqueSouth Africa
CambodiaTogoChile
MoroccoCanadaNigeria
Lao PDRGuatemalaCameroonNicaragua
PhilippinesHondurasTajikistan
United StatesPeru
GhanaJordan
Sri LankaNepal
ThailandVietnam
ChinaColombiaPakistan
KazakhstanIndia
BangladeshTunisia
MalaysiaEthiopia
ArgentinaMexico
IndonesiaSyrian Arab Rep.
IraqEgypt, Arab Rep. of
Yemen, Rep. ofVenezuela, R. B. deIran, Islamic Rep. of
Source: See appendix 1.

9E x t r a c t i v e I n d u s t r i e s f o r D e v e l o p m e n t S e r i e s
Figure 3 Retail Prices of Kerosene, August 2008
0.00
0.50
1.00
1.50
2.00
2.50C
amb
od
iaZ
amb
iaS
eneg
alK
enya
Phi
lipp
ines
Gu
atem
ala
Chi
leT
hai
lan
dS
ou
th A
fric
aN
icar
agu
aM
oza
mb
iqu
eM
adag
asca
rM
alaw
iV
ietn
amJo
rdan
Gh
ana
Tajik
ista
nN
epal
Ho
ndur
asC
amer
oo
nTo
go
Ban
gla
des
hP
akis
tan
Sri
Lan
kaTu
nis
iaA
rgen
tina
Eth
iop
iaS
yria
Nig
eria
Ind
one
sia
Ind
iaE
gyp
t, A
rab
Rep
. of
Iraq
US
$ p
er li
ter
Source: See appendix 1.
electricity, for lighting; amounts consumed for lighting are considerably smaller than those for cooking unless a household is using multiple cooking fuels. In cold-climate countries, kerosene may also be used for heating.
Given the widespread use of kerosene by the poor, many governments attempt to keep kerosene prices low. But because kerosene and diesel are nearly perfect motor fuel substitutes, a large price disparity in favor of kerosene typically leads to its illegal diversion to the automotive diesel sector. The ratio of kerosene and diesel prices should ideally be close to unity to avoid this form of commercial malpractice. If the ratio is smaller than 1, there is an opportunity to exploit the price difference and adulterate diesel with kerosene. This price ratio was computed, and a histogram based on the results is shown in figure 4. The ratio was less than 1 in 23 countries, less than 0.9 in 18, and less than 0.8 in 12.
Figure 5 shows retail prices of LPG. Except in middle-income countries, LPG is consumed much more by middle- and upper-income households than by the poor. The international price of LPG in August 2008 was about US$0.85–0.90 per kilogram. Thirteen countries sold LPG at retail prices lower than the international price, which does not include the cost of transport, bottling, cylinder management, distribution, retailing, margins, and taxes. This suggests that at least half the countries in the sample, and probably many more, were effectively subsidizing LPG.

c h a n g E S I n E n D - U S E r P E t r o l E U m P r o D U c t P r I c E S10
Retail fuel prices in August 2008 showed large variation across different categories of countries, with OECD countries continuing to follow the historical trend of high fuel taxation and charging consumers more than developing countries (table 1). More stringent fuel specifications in
Figure 4 Ratio of Kerosene to Diesel Prices, August 2008
0
2
4
6
8
10
12
14
0–0.5 0.5–0.75 0.75–1.0 1.0–1.25 1.25–1.5
Ratio of kerosene to diesel prices
Nu
mb
er o
f co
untr
ies
Source: Author’s calculations.
Figure 5 Retail Prices of LPG, August 2008
0.00
0.50
1.00
1.50
2.00
2.50
Mad
agas
car
Ch
ileE
thio
pia
Gu
atem
ala
Cam
bo
dia
Nic
arag
ua
Phi
lipp
ines
Sri
Lan
kaN
epal
Tajik
ista
nB
ang
lad
esh
Mex
ico
Co
lom
bia
Pak
ista
nG
han
aS
eneg
alJo
rdan
Ho
nd
ura
sTo
go
Ind
on
esia
Th
aila
nd
Ind
iaTu
nis
iaM
oro
cco
Syr
ian
Ara
b R
ep.
Ch
ina
Iraq
Ven
ezu
ela
, R. B
. de
Eg
ypt,
Ara
b R
ep. o
f
US
$ p
er k
ilog
ram
Source: See appendix 1.

11E x t r a c t i v e I n d u s t r i e s f o r D e v e l o p m e n t S e r i e s
these OECD countries—which call for “sulfur-free” gasoline and diesel—would account for only a small portion of the differences observed. Developing countries that were net oil exporters tended to charge half (and even less in the case of gasoline and diesel) as much as net importers, although there was considerably greater variation among oil exporters than importers. For gasoline and diesel, Sub-Saharan Africa had much higher prices than other regions of the world, although still below OECD prices on average. For kerosene, regional differences were
Table 1 Retail Fuel Prices in US$, August 2008
Fuel and country category Price Standard deviation
Gasoline, all countries, per liter 1.26 0.54
Gasoline, developing countries, per liter 1.17 0.50
Oil importing 1.37 0.38
Oil exporting 0.66 0.39
Sub-Saharan Africa (16 countries) 1.56 0.48
Asia (13) 1.15 0.25
Latin America (9) 0.97 0.40
Middle East and North Africa (8) 0.69 0.50
Gasoline, OECD countries, per liter 1.80 0.47
Diesel, all countries, per liter 1.15 0.50
Diesel, developing countries, per liter 1.08 0.49
Oil importing 1.27 0.39
Oil exporting 0.61 0.42
Sub-Saharan Africa (16 countries) 1.53 0.37
Asia (13) 0.98 0.23
Latin America (9) 0.92 0.42
Middle East and North Africa (8) 0.55 0.46
Diesel, OECD countries, per liter 1.60 0.30
Kerosene, developing countries, per liter 0.95 0.44
Oil importing 1.05 0.40
Oil exporting 0.55 0.36
Sub-Saharan Africa (12 countries) 1.09 0.37
Asia (10) 0.94 0.51
Latin America (5) 1.06 1.06
Middle East and North Africa (5) 0.50 0.36
LPG, developing countries, per kilogram 0.92 0.55
Source: See appendix 1.

c h a n g E S I n E n D - U S E r P E t r o l E U m P r o D U c t P r I c E S12
small except in the Middle East and North Africa where prices were about half of those in other regions.
Passing through of Gasoline and Diesel Price Increases
This paper defines the pass-through coefficient in the same manner as the earlier study on coping with higher oil prices (Bacon and Kojima 2006) and sets it as the ratio of the change in domestic retail prices over the relevant period, measured in local currency, to the change in the appropriate international product price during the same period, converted to local currency. International prices are on a free-on-board basis, net of taxes and transportation costs. Petroleum product prices quoted in northwest Europe, the Arab Gulf, Singapore, and the U.S. Gulf Coast were used for different regions of the world. Again, the sources of price data, reference international prices used for individual countries, gasoline grades selected, other items of information, and the limitations in the data and methodology are discussed in appendix 1. The monthly international gasoline and diesel prices averaged across the four global refining centers are shown in table 2.
Table 2 International Prices of Gasoline and Diesel
Parameter Gasoline Diesel
Jan. 2004
Jan. 2007
Aug. 2008
Jan. 2004
Jan. 2007
Aug. 2008
Price in US$/liter 0.26 0.37 0.73 0.25 0.42 0.84
Percent increase over previous date n.a. 43 98 n.a. 70 100
Source: See appendix 1.
Note: n.a. = not applicable.
The coefficients were computed for three time periods:
January 2004 to January 2007 (first subperiod)•
January 2007 to August 2008 (second subperiod)•
January 2004 to August 2008 (full period)•
January 2007 was selected because oil prices reached the lowest level since May 2005 in that month. Crude oil prices declined by US$20 a barrel between July 2006 and January 2007, providing opportunities for aligning domestic and international fuel prices to governments subsidizing fuels. The price increases in the first subperiod were less than half of those in the second subperiod, despite the first subperiod being nearly twice as long as the second.

13E x t r a c t i v e I n d u s t r i e s f o r D e v e l o p m e n t S e r i e s
As an illustration of how the coefficients were calculated, the gasoline pass-through coefficient in China in the first subperiod would equal
(retail gasoline price in 1/07 in yuan − retail gasoline price in 1/04 in yuan)(Singapore gasoline price in 1/07 in yuan − Singapore gasoline price in 1/04 in yuan)
During the study period, some countries—Egypt, Indonesia, the Islamic Republic of Iran, Iraq, Malaysia, Nigeria, Syria, the República Bolivariana de Venezuela, and the Republic of Yemen, among them—made infrequent and large price adjustments. For these countries, the dates selected for computing pass-through coefficients have a significant effect on the magnitude of the coefficients: if the terminal date is just before a large price increase, the coefficient would be much smaller than right after the price increase. Venezuela did not adjust prices during the study period; others adjusted prices twice or more. Thus, the coefficients reported in this paper broadly reflect price trends.
For full pass-through, the pass-through coefficient as defined above should generally be higher than 1, because, in addition to the increase in the cost of procuring the fuel itself, other costs would have gone up as well, including the cost of transporting the fuel to the market. In addition, fuels carry various taxes, and some—such as a general consumption tax—are levied as a percentage of the fuel price, increasing in absolute terms with increasing commodity price. That said, retail prices do not adjust immediately to international spot prices, especially in small markets with slow inventory turnover. January 2007 was unusual in that international prices in the preceding (and following) months were markedly higher. Retail prices in the early part of January may have reflected higher world prices from the month before, increasing the apparent degree of pass-through.
A pass-through coefficient much greater than 1 does not imply that domestic prices are fully in line with international prices. If the initial price is very low, as in some (mostly oil-exporting) countries, then passing through 200 percent of world oil price increases may still be inadequate, as shown below.
Pass-through Coefficients
Full results for pass-through coefficients are given in appendix 2. The pass-through coefficients for the first subperiod are shown in figures 6 and 7. Figure 6 plots the coefficients against the vulnerability index in 2006, which was reported in a previous issue of this series (Bacon and Kojima 2008) and defined as the percentage of GDP spent on importing crude oil and petroleum products. A net exporter of oil and petroleum products

c h a n g E S I n E n D - U S E r P E t r o l E U m P r o D U c t P r I c E S14
Figure 6 Pass-through Coefficients (January 2004–January 2007)
0
1
2
3
4
5
6
7
8
−50
−40
−30
−20 −1
0 0 10 20
Percent vulnerability in 2006
Pas
s-th
roug
h co
effic
ient
Gasoline Diesel
Sources: Bacon and Kojima 2008, author’s calculations.
Note: Iraq is omitted because vulnerability in 2006 is not available.
Figure 7 Distribution of Pass-through Coefficients (January 2004–January 2007)
0
2
4
6
8
10
12
14
16
18
0–0
.25
0.25
–0.5
0.5
–0.7
5
0.75
–1.0
1.0
–1.5
1.5
–2.0
2.0
–3.0
3.0
–4.0
4.0
–5.0
5.0
–6.0
6.0
–7.0
7.0
–8.0
Pass-through coefficient
Nu
mb
er o
f co
untr
ies
Gasoline Diesel
Source: Author’s calculations.

15E x t r a c t i v e I n d u s t r i e s f o r D e v e l o p m e n t S e r i e s
has a negative vulnerability index. Large pass-through coefficients were mostly accompanied by currency appreciation; Bangladesh, Malawi, and Tanzania were notable exceptions. The coefficients for both fuels in the first subperiod were the largest among the three time intervals studied. Gasoline pass-through coefficients averaged 2.3, almost twice the diesel average of 1.3.
Figures 8 and 9 show the results for the second subperiod. Predictably, the coefficients for both fuels were the smallest of the three time intervals, with both fuels averaging 0.9 across the 45 countries studied.
The results for the full period are shown in figures 10 and 11. Gasoline pass-through coefficients averaged 1.3, and diesel averaged 1.1.
The coefficients can also be computed in U.S. dollars, and if there is no movement in the local currency with respect to the dollar, the coefficients will be the same. Large exchange rate fluctuations can lead to large differences between the two calculation procedures. In the sample countries, the ratio of the pass-through coefficient computed in local currency to that computed in U.S. dollars ranged from −0.39 to 3.1.
In countries where governments set prices, local currency appreciation would have made it easier to keep up with price rises on the world market. Exchange rate movements varied across the sample countries. Figure 12 shows the percentage increase in the exchange rate between the beginning and the end of each time interval. In every time period, more countries benefited from currency appreciation than saw their currencies depreciate against the dollar.
To assess what factors might explain the degree of pass-through, unsquared correlations between the pass-through coefficients and several macroeconomic parameters were calculated. The parameters were
fuel price at the beginning of the time interval;•
vulnerability index in 2006 given in Bacon and Kojima (2008);•
a dummy for a country’s import status based on the vulnerability •index, where the import status is 1 if the vulnerability index is positive and 0 otherwise;
currency appreciation during the time interval;•
per capita GDP at purchasing power parity and market-based •exchange rates at the beginning of the time interval;
lagged pass-through coefficient (that is, the first subperiod coefficient •for the second subperiod).

c h a n g E S I n E n D - U S E r P E t r o l E U m P r o D U c t P r I c E S16
Figure 9 Distribution of Pass-through Coefficients (January 2007–August 2008)
Gasoline Diesel
0
2
4
6
8
10
12
14
16
18
0–0
.25
0.25
–0.5
0.5
–0.7
5
0.75
–1.0
1.0
–1.5
1.5
–2.0
2.0
–3.0
3.0
–4.0
Pass-through coefficient
Num
ber
of c
oun
trie
s
Source: Author’s calculations.
Figure 8 Pass-through Coefficients (January 2007–August 2008)
Gasoline Diesel
0
1
2
3
4
−50
−40
−30
−20 −1
0 0 10 20
Percent vulnerability in 2006
Pas
s-th
roug
h co
effic
ient
Sources: Bacon and Kojima 2008; author’s calculations.
Note: Iraq is omitted because vulnerability in 2006 is not available.

17E x t r a c t i v e I n d u s t r i e s f o r D e v e l o p m e n t S e r i e s
Figure 10 Pass-through Coefficients (January 2004–August 2008)
Gasoline Diesel
0
1
2
3
4
5−
50
−40
−30
−20 −1
0 0 10 20
Percent vulnerability in 2006
Pas
s-th
roug
h co
effic
ient
Sources: Bacon and Kojima 2008; author’s calculations.
Note: Iraq is omitted because vulnerability in 2006 is not available.
Figure 11 Distribution of Pass-through Coefficients (January 2004–August 2008)
Gasoline Diesel
0
5
10
15
20
25
0–0
.25
0.25
–0.5
0.5
–0.7
5
0.75
–1.0
1.0
–1.5
1.5
–2.0
2.0
–3.0
3.0
–4.0
4.0
–5.0
Pass-through coefficient
Nu
mb
er o
f co
untr
ies
Source: Author’s calculations.

c h a n g E S I n E n D - U S E r P E t r o l E U m P r o D U c t P r I c E S18
The results are shown in table 3. The sample included both developing and OECD countries. Those countries in which prices were already high were more likely to increase prices further than those that had kept prices low. As in the previous study (Bacon and Kojima 2006), a country’s import status was an important determinant of the degree of pass-through, with net oil importers more likely to pass on price increases to domestic consumers. GDP per capita was negatively correlated with pass-through coefficients in every case. This suggests that low-income countries are less likely to be in a position to limit passing through of world price increases. Not surprisingly, those countries that enjoyed currency appreciation were more likely to pass through world price increases, especially during the first subperiod.
To examine whether pass-through is correlated with combinations of factors, multiple regressions of the coefficient of pass-through for gasoline and for diesel were carried out. The results are discussed in appendix 2. During the second subperiod, when world oil prices rose sharply, the only statistically significant explanatory variable was the retail fuel price at the beginning of the period. During the first subperiod, when international fuel price increases were modest compared to the second subperiod, currency appreciation helped keep up with price increases on the world market.
Figure 12 Exchange Rate Appreciation
0
5
10
15
20
25
–20
to –
30
–10
to –
20
0 to
–10
0 to
10
10 t
o 2
0
20 t
o 3
0
30 t
o 4
0
40 t
o 5
0
50 t
o 8
0
Appreciation in percent
Nu
mb
er o
f co
untr
ies
Jan. 2004–Jan. 2007
Jan. 2007–Aug. 2008
Jan. 2004–Aug. 2008
Source: Author’s calculations.

19E x t r a c t i v e I n d u s t r i e s f o r D e v e l o p m e n t S e r i e s
Conclusions
Retail gasoline and diesel prices in August 2008 reflected generally lower taxes in developing countries than in OECD countries. Among the former, Sub-Saharan Africa had the highest retail prices. As Bacon and Kojima (2006) note, the lowest fuel prices were again consistently found in oil-exporting developing countries. On the world market, diesel is in short supply and is more expensive than gasoline, but retail diesel prices tend to be lower, reflecting differential fuel taxation in favor of diesel. For kerosene, Latin American and Sub-Saharan African countries in the sample had comparable average prices, which were slightly higher than those in Asian countries. Two-thirds of the developing countries surveyed priced kerosene below diesel. For the three fuels, the Middle East and North Africa had the lowest retail prices, reflecting disproportional concentration of oil exporters in the region. About half of the countries in the sample subsidized LPG.
Pass-through coefficients were higher in OECD than in developing countries, with the exception of gasoline in the first subperiod. Every OECD country in the sample achieved a pass-through coefficient exceeding 1 in every time period. The extent of pass-through was highest in the first subperiod, with only a handful of countries having
Table 3 Unsquared Correlations between Pass-through Coefficients and Macroeconomic Variables
Parameter Gasoline Diesel
2004–07
2007–08
2004–08
2004–07
2007–08
2004–08
Logarithm of price in 2004 0.25 0.49 0.56 0.51 0.54 0.63
Logarithm of price in 2007 0.45 0.53 0.56 0.66 0.52 0.67
Vulnerability in 2006 0.33 0.43 0.42 0.50 0.27 0.42
Import status in 2006 0.43 0.47 0.50 0.56 0.40 0.54
Logarithm of p.c. GDP in 2004 at PPP −0.38 −0.20 −0.33 −0.20 −0.14 −0.19
Logarithm of p.c. GDP in 2004 −0.36 −0.14 −0.27 −0.16 −0.09 −0.13
Logarithm of p.c. GDP in 2007 at PPP −0.37 −0.20 −0.33 −0.19 −0.15 −0.19
Logarithm of p.c. GDP in 2007 −0.36 −0.15 −0.28 −0.16 −0.11 −0.14
Currency appreciation in 2004–07 0.46 n.a. n.a. 0.45 n.a. n.a.
Currency appreciation in 2007–08 n.a. 0.08 n.a. n.a. 0.05 n.a.
Currency appreciation in 2004–08 n.a. n.a. 0.11 n.a. n.a. 0.19
Pass-through coefficient in 2004–07 1.00 0.51 n.a. 1.00 0.43 n.a.
Source: Author’s calculations.
Note: n.a. = not applicable; p.c. = per capita; PPP = purchasing power parity.

c h a n g E S I n E n D - U S E r P E t r o l E U m P r o D U c t P r I c E S20
coefficients less than 1. (As mentioned earlier, a pass-through coefficient of 1 should not be used as the criterion for determining whether international oil price increases have been fully passed through; the coefficient should generally be larger than 1.) January 2007 recorded the lowest crude oil prices in 19 months. This fall in world oil prices did not prompt some countries—which had earlier overcome political difficulties and raised prices—to lower retail prices. Indonesia and Malaysia, which increased fuel prices by large margins in October 2005 and February 2006, respectively, did not lower prices in January 2007 (although Malaysia did do so in August 2008 as world oil prices began to fall). For countries that are trying to phase out fuel price subsidies, falling oil prices provide a means of reducing subsidies without having to raise retail prices markedly, if at all. It is important that governments carrying fuel subsidies not be tempted to respond to headlines about falling world oil prices by reducing end-user prices, but remain focused on removing price subsidies.
During the second subperiod, even oil-importing countries were, on average, barely keeping up with oil price increases—this despite the fact that international gasoline and diesel prices fell for the second month in a row in August 2008. Gasoline price increases were larger than those for diesel in 40 out of 45 countries in the first subperiod, in 26 out of 45 in the second, and in 36 out of 48 in the full period. These observations suggest stickiness in fuel prices. The findings are broadly in agreement with those reported by the International Monetary Fund in March 2008 (Mati 2008). Comparison with Alaimo and Lopez (2008) is not possible because the extent of pass-through was quantified differently in that paper.
The pass-through coefficients in the first subperiod were large in part because the increase in world prices was relatively small: only 31 percent of the gasoline price increase and 41 percent of the diesel price increase in the second subperiod in U.S. dollars. A domestic price increase that is US$0.01 a liter higher than the international price increase would have given a pass-through coefficient, computed in U.S. dollars, of 1.09 during the first subperiod but 1.03 during the second subperiod for gasoline, and 1.06 and 1.02, respectively, for diesel. Similarly, diesel price increases were larger than gasoline price increases in every one of the three time intervals: by 57 percent in the first subperiod, 17 percent in the second, and 26 percent in the full period. This may partially explain diesel’s lower pass-through coefficients in more than half the cases.
The degree of pass-through in net oil exporters was half or less of that in importers for all six cases. The significance of a country’s import

21E x t r a c t i v e I n d u s t r i e s f o r D e v e l o p m e n t S e r i e s
status in influencing the degree of pass-through was further supported by statistical analysis. During the second subperiod, countries that had already raised prices significantly were likely to pass through a greater proportion of world oil price increases. By region, Sub-Saharan Africa had the highest degree of pass-through, followed by Asia, Latin America, and the Middle East and North Africa.
Policy reasons for, and the implications of, not passing through world price increases fully have been widely discussed elsewhere (for example, Bacon and Kojima 2006; IMF 2008), but bear repeating. Countries that control prices, and especially those that adjust prices on an ad hoc basis, often do not pass oil price increases fully to consumers. As mentioned above, net oil exporters tend to fall under this category. Lower prices are maintained through various forms of government subsidies—either universally or to select consumers such as electric power producers, transport operators, farmers, fishermen, and households—and a number of other mechanisms—reducing oil product taxes, taxing crude exports heavily, requiring oil companies to subsidize consumers (sometimes accumulating large debts for national oil companies). These measures distort the downstream petroleum sector, lead to commercial malpractice, disproportionately benefit the better-off in the case of universal price subsidies, and divert limited government resources in developing countries away from meeting such essential needs as primary health care and education.
Fuel prices are kept low to limit inflation, protect the poor, or both. But fuel price subsidies have been demonstrated time and again to be a weak instrument for protecting the poor because benefits go mostly to the better-off (Coady and others 2006). It could even be argued that these subsidies amplify oil price volatility by obstructing the route to weaken demand through higher prices. Governments should look for opportunities to move away from the policy of incomplete pass-through of world oil price increases and replace subsidies with targeted assistance to the poor.


APPENDIXES


25E x t r a c t i v e I n d u s t r i e s f o r D e v e l o p m e n t S e r i e s
Appendix 1: Sources of Data and Prices
For price information, wherever retail prices are posted on a government Web site, those prices were used. In countries where fuel prices are liberalized, tabulation of average monthly prices would require extensive spatial and temporal surveys. Several government agencies report average prices in the capital and several other important cities or districts but not necessarily for the entire country. In those cases, this study tracked prices in the capital city. In the remaining cases, prices reported in the media during the month were used.
Gasoline and diesel prices depend on fuel quality. This study did not attempt to adjust prices to account for varying octane or cetane numbers, sulfur levels, aromatics contents, and other fuel parameters that affect prices, because there are no precise correlations and doing so would introduce large uncertainties. Furthermore, fuel quality changed between January 2004 and August 2008 in many regions, including Europe and the United States. In high-income countries, the primary change was the level of sulfur in gasoline and diesel. In the European Union, for example, the diesel sulfur level was 0.035 percent in January 2004, but by August 2008 a significant portion of diesel sold contained only 0.001 percent sulfur and the rest had 0.005 percent sulfur. Sulfur removal adds to the cost of refining, so that comparison of diesel prices in Europe between 2004 and 2008 reflects more than oil price increases during the intervening months. In some developing countries, gasoline in January 2004 was still leaded, but by August 2008 lead had been phased out in nearly all countries. Phasing lead out of gasoline also adds to the cost of refining, so that even in the absence of any increase in world oil prices, gasoline prices might have risen. Some countries changed the octane numbers of gasoline between the two periods. For these and other reasons, comparison of price levels and pass-through coefficients should be treated with caution. However, because the calculation of the coefficient involves taking price differences rather than looking at absolute price levels, the effect of varying fuel quality is unlikely to change the order of magnitude of the results reported here or the qualitative conclusions.

c h a n g E S I n E n D - U S E r P E t r o l E U m P r o D U c t P r I c E S26
In North America, Canada, and Colombia, an octane index rather than a research octane number (RON) is reported. An octane index is the average of research and motor octane numbers, and is usually about 4 to 5 points lower than RON for the same grade of gasoline. For example, regular gasoline with an octane index of 87 would have a RON of about 91–92.
Whenever it was reasonable to do so, this study used regular gasoline prices. In some countries, however, the octane number of regular gasoline was notably lower than that on the international market and in other countries. In those cases, prices of higher octane gasoline were selected. For example, Bangladesh has two grades of gasoline: regular gasoline with a RON of only 80, and premium gasoline with 95 RON. Because 80 RON is exceptionally low, 95 RON gasoline prices were chosen.
For international prices of gasoline and diesel, grades for which prices were available for all three dates—January 2004, January 2007, and August 2008—were selected. In Europe, the price of diesel with 0.035 percent sulfur was available only for January 2004. For January 2007 and August 2008, automotive diesel sulfur levels fell to 0.005 and 0.001 percent, much lower than anything seen in the developing countries that import from Europe. For this reason, diesel with 0.2 percent sulfur was selected. In the Arab Gulf, only prices of 95 RON gasoline were available. Elsewhere, the octane number of the gasoline grade chosen was about 91–92 RON.
Assignment of reference international prices was based on proximity to the four refining centers chosen, and is not necessarily consistent with the basis for pricing in individual countries. For example, South Africa bases its determination of prices of imported petroleum products on prices quoted in the Arab Gulf, Singapore, and the Mediterranean. For simplicity, Arab Gulf prices were used in this study.
The actual prices paid by consumers may be higher (and, on some occasions, lower) than the prices used in this report for a number of reasons.
Low prices can result in fuel shortages and higher prices on the black •market, as in Iraq and Nigeria.
Some countries keep the price of one grade of gasoline (typically low •in octane) low and let prices of other grades correspond to world prices. In the Islamic Republic of Iran, where subsidized gasoline is rationed, the government in March 2008 began allowing gasoline

27E x t r a c t i v e I n d u s t r i e s f o r D e v e l o p m e n t S e r i e s
outside of the quota to be sold at four times the subsidized price. In Iraq, premium gasoline is now handled entirely by the private sector charging market prices, but regular gasoline is channeled through state-owned companies and sold at a much lower price.
Several countries sell fuel to public transport companies and to the •fishing industry at discounted prices.
Smuggled fuels from neighboring countries that subsidize fuel prices •may be sold at below-market prices.
It is not possible to compute the volume-weighted average of different prices on the market for each fuel, and reliable data do not exist for black market and smuggled fuel prices. Again, this points to viewing pass-through coefficients as being indicative rather than firm.
The sources of information and prices of gasoline and diesel in local currency units are shown in tables A1.1 and A1.2, respectively. Table A1.1 also shows, under the heading reference price, the refining center from which international prices were taken for each country. Gasoline octane and LPG cylinder sizes are noted where this information was available.

c h a n g E S I n E n D - U S E r P E t r o l E U m P r o D U c t P r I c E S28
Table A1.1 Data Sources and Descriptions
Country or region Source
Reference price Notes
Arab Gulf Platts Oilgram Price Report, price average supplement
— 95 RON unleaded gasoline, gasoil with 0.05 percent sulfur
Argentina http://energia.mecon.gov.ar/downstream/DS_PJur.asp
U.S. Gulf Prices in the federal capital district; RON 93 gasoline
Bangladesh Local newspaper articles Arab Gulf 95 RON gasoline; LPG in 12.5-kg cylinder
Brazil www.anp.gov.br/petro/precos_de_produtores.asp
U.S. Gulf Prices exclude state-level sales tax; gasoline prices are for gasolina A, which is pure gasoline used for blending with ethanol; pure gasoline is not sold in Brazil
Cambodia Local newspaper articles; World Bank Country Office, Phnom Penh
— 92 RON gasoline; LPG in 15-kg cylinder
Cameroon Local newspaper articles — 95 RON gasoline
Canada www.iea.org/Textbase/stats/surveys/mps.pdf
U.S. Gulf Regular unleaded gasoline with an octane index of 87
Chile www.cne.cl/estadisticas/nacionales/petroleo/f_hidrocarburos.html
U.S. Gulf Prices in the metropolitan region; RON 93 gasoline, LPG in 15-kg cylinder; diesel for truckers is cheaper
China http://china.huanqiu.com/roll/2008-06/144380.html, local newspaper articles
Singapore Beijing; 93 RON gasoline, no. 0 diesel; subsidized LPG in 15-kg cylinders; market-based prices of LPG in a 15-kg cylinder are more than double the subsidized price
Colombia www.sipg.gov.co/Default.aspx?PageContentID=23&tabid=97, www.aciem.org/bancoconocimiento/i/indicessaucedo2007/indicessaucedo2007.asp
U.S. Gulf Prices in Bogotá; gasolina motor corriente, which has an octane index of 81, and LPG in 20-pound cylinder; prices of gasoline with an octane index of 87, which is the same as the reference gasoline on the U.S. Gulf Coast, are not consistently available on the government ministry Web site
Egypt, Arab Republic of
Local newspaper articles Arab Gulf 90 RON gasoline; LPG in 12.5-kg cylinder
Ethiopia World Bank Country Office, Addis Ababa Arab Gulf 91 RON gasoline; LPG in 12.5-kg cylinder
Europe Platts Oilgram Price Report, price average supplement
— Cargoes FPB Northwest Europe, regular unleaded gasoline (91–92 RON), gasoil with 0.2 percent sulfur
France www.iea.org/Textbase/stats/surveys/mps.pdf
Europe 95 RON unleaded gasoline
Germany www.iea.org/Textbase/stats/surveys/mps.pdf
Europe 95 RON unleaded gasoline
Ghana www.npa.gov.gh/petroleum-prices/ Europe Price ceilings; only one grade of gasoline sold
Guatemala www.sieca.org.gt/site/Enlaces.aspx?ID=006005, www.mem.gob.gt/Portal/Home.aspx?secid=17
U.S. Gulf Regular 88 RON gasoline; LPG in 25-pound cylinder

29E x t r a c t i v e I n d u s t r i e s f o r D e v e l o p m e n t S e r i e s
Country or region Source
Reference price Notes
Guinea Bissau Local newspaper articles —
Honduras www.cap.gob.hn/portal/historiales/ U.S. Gulf Prices in Tegucigalpa; regular gasoline with 87–88 RON; LPG in 25-pound cylinder
India www.bharatpetroleum.com/general/gen_petroprices.asp?from=corp
Arab Gulf Prices in New Delhi; motor spirit (88 RON in January 2004 and 91 RON in January 2007 and August 2008) and high speed diesel; LPG sold in 14.2-kg cylinders; kerosene is rationed, subsidized kerosene distributed through the public distribution system
Indonesia Local newspaper articles Singapore 88 RON gasoline; prices of higher grades of gasoline and diesel and diesel for industrial use are not subsidized by the government; shortages of subsidized kerosene for households have historically led to much higher actual prices paid on occasion
Iran, Islamic Rep. of
Local newspaper articles Arab Gulf Regular gasoline; subsidized gasoline is rationed; in March 2008, the government began offering gasoline outside of the quota at four times the subsidized price
Iraq www.imf.org/external/pubs/ft/scr/2008/cr0817.pdf, World Bank staff
Arab Gulf The price of higher-octane gasoline was liberalized in 2007; shortages leading to much higher black market prices have been historically observed and were common in the earlier years
Italy www.iea.org/Textbase/stats/surveys/mps.pdf
Europe 95 RON unleaded gasoline
Japan www.iea.org/Textbase/stats/surveys/mps.pdf
Singapore Regular unleaded gasoline (90 RON)
Jordan Local newspaper articles Arab Gulf Unleaded 92 RON gasoline in 2004 and 2007, 90 RON unleaded gasoline in 2008; LPG in 12.5-kg cylinder
Kazakhstan www.stat.kz/Pages/default.aspx Europe 92 RON gasoline
Kenya Local newspaper articles —
Lao PDR World Bank Country Office, Vientiane Singapore
Madagascar Local newspaper articles — 91 RON gasoline; LPG in 9-kg cylinder
Malawi Local newspaper articles Arab Gulf
Malaysia Local newspaper articles Singapore August 2008 prices are after the price decrease of August 23; diesel and gasoline are sold at a discount to fishing boats and diesel to certain transport companies
Mexico www.pemex.com/files/dcpe/epublico_ing.pdf, www.hidrosur.com.mx/15-1-Lista+de+precios.html
U.S. Gulf Gasolina pemex magna, which has an octane index of 87, and diesel pemex
Table A1.1 Data Sources and Descriptions, continued

c h a n g E S I n E n D - U S E r P E t r o l E U m P r o D U c t P r I c E S30
Country or region Source
Reference price Notes
Morocco Local newspaper articles Europe Super gasolinea LPG in 3-kg cylinder
Mozambique Local newspaper articles Arab Gulf
Nepal World Bank Country Office, Kathmandu Arab Gulf 88 RON gasoline; LPG sold in 14.2-kg cylinders
Nicaragua www.ine.gob.ni/hidrocarburos.html U.S. Gulf Prices in Managua; regular gasoline with a minimum RON of 87–88; LPG in 25-pound cylinder; in May, government agreed to a diesel price subsidy for taxis and buses
Nigeria World Bank Country Office, Abuja Europe A sizable portion of petroleum products is sold at black market prices
Pakistan www.ogra.org.pk/cats_disp.php?cat=86, www.psopk.com/
Arab Gulf
Peru www.motorglpperu.com/ahorro5.htm — 90 RON gasoline
Philippines www.doe.gov.ph/OPM/ArchivesHistorical.htm
Singapore Prices in metro Manila; 93 RON gasoline; LPG in 11-kg cylinder
Rwanda Local newspaper articles Arab Gulf
Senegal Local newspaper articles — Super unleaded gasoline (regular gasoline price in August not available); LPG in 2.7 kg cylinder
Singapore Platts Oilgram Price Report, price average supplement
— 92 RON unleaded gasoline and gasoil with 0.05 percent sulfur
South Africa www.dme.gov.za/energy/ liquid_prices.stm#3
Arab Gulf Inland prices; 93 RON unleaded gasoline; LPG in 12.5-kg cylinder
Spain www.iea.org/Textbase/stats/surveys/mps.pdf
Europe 95 RON unleaded gasoline
Sri Lanka Local newspaper articles Arab Gulf 90 RON gasoline
Syrian Arab Rep.
Local newspaper articles Arab Gulf
Tajikistan Local newspaper articles; World Bank Country Office, Bishkent
— 92 RON gasoline
Tanzania Local newspaper articles Arab Gulf
Thailand www.eppo.go.th/info/index_prices.html Singapore Bangkok; 91 RON unleaded with no ethanol; gasoline containing ethanol and diesel containing biodiesel are heavily discounted
Togo Local newspaper articles — LPG in 12.5-kg cylinder
Tunisia Local newspaper articles Europe Super unleaded gasoline with 95 RON
Uganda Local newspaper articles Arab Gulf
United States http://tonto.eia.doe.gov/dnav/pet/pet_pri_gnd_dcus_nus_w.htm, retail prices
U.S. Gulf Regular conventional gasoline and no. 2 low-sulfur diesel (0.05 percent or lower)
Table A1.1 Data Sources and Descriptions, continued

31E x t r a c t i v e I n d u s t r i e s f o r D e v e l o p m e n t S e r i e s
Country or region Source
Reference price Notes
http://tonto.eia.doe.gov/dnav/pet/pet_pri_spt_s1_d.htm, international prices
US Gulf Coast, regular conventional gasoline and no. 2 low-sulfur diesel
Venezuela, R. B. de
Local newspaper articles U.S. Gulf 91 RON gasoline; LPG in 10-kg cylinder
Vietnam www.petrolimex.com.vn/Desktop.aspx/Home-En/
Singapore 92 RON gasoline
Yemen, Rep. of Local newspaper articles Arab Gulf
Zambia Local newspaper articles Arab Gulf 91 RON gasoline
Note: — Not applicable.
a. Regular gasoline phased out in July 2005.
Table A1.1 Data Sources and Descriptions, continued

c h a n g E S I n E n D - U S E r P E t r o l E U m P r o D U c t P r I c E S32
Table A1.2 Gasoline and Diesel Prices per Liter in Local Currency
Country Gasoline Diesel
Jan. 2004 Jan. 2007 Aug. 2008 Jan. 2004 Jan. 2007 Aug. 2008
Argentina 1.85 1.88 2.60 1.32 1.46 2.02Bangladesh 33.00 58.00 90.00 20.00 33.00 55.00Brazil 1.23 1.54 1.54 0.96 1.36 1.51Chile 417 562 648 274 428 691China 3.20 5.09 6.20 3.05 4.83 6.23Colombia 1,160 1,637 1,945 810 1,298 1,620Egypt, Arab Republic of 1.00 1.30 1.75 0.60 0.75 1.10Ethiopia 4.40 8.17 9.61 2.72 5.44 6.90Ghana 4,444 7,913 11,853 3,889 7,708 12,000Guatemala 4.00 — 9.19 2.95 — 9.26Honduras 12.46 14.57 21.71 9.20 13.22 22.53India 33.70 43.49 50.56 21.73 33.07 34.80Indonesia 1,810 4,500 6,000 1,650 4,300 5,500Iran, Islamic Republic of 650 800 1,000 160 165 165Iraq 20.00 250.00 400.00 10.00 150.00 400.00Jordan 0.45 0.64 0.80 0.13 0.32 0.73Kazakhstan 50.19 75.00 103.00 34.13 59.98 103.93Lao PDR 4,315.50 7,627.87 10,768.23 3,848.75 6,866.55 10,988.03Malawi 86.85 160.80 251.20 78.42 125.90 234.50Malaysia 1.31 1.92 2.55 0.76 1.58 2.50Mexico 6.05 6.76 7.31 5.02 5.72 6.26Morocco 8.17 10.25 11.25 5.27 9.13 10.13Mozambique 15.38 27.18 41.62 13.20 24.81 35.35Nepal 56 67 100 33.50 52.50 70Nicaragua 9.56 14.01 24.15 8.14 12.73 23.94Nigeria 40.50 65.00 70.00 59.83 75.44 150.00Pakistan 34.63 57.70 96.08 23.32 38.73 86.66Philippines 21.83 35.75 55.73 17.53 31.75 54.60Rwanda 471.00 — 924.00 482.00 — 927.00South Africa 3.78 5.78 10.20 3.35 5.68 11.27Sri Lanka 53 97 157 32 60 110Syrian Arab Rep. 24.35 30.00 40.00 7.00 7.00 25.00Tanzania 700 — 1,830 680 — 2,000Thailand 16.31 24.91 36.84 14.55 22.76 34.37Tunisia 0.77 1.10 1.32 0.44 0.74 0.96Uganda 1,640 1,920 2,790 1,390 1,660 2,740Venezuela, R. B. de 0.07 0.07 0.07 0.05 0.05 0.05Vietnam 5,400 10,100 18,000 4,400 8,600 15,950Yemen, Rep. of 35 60 60 17 35 35Zambia 3,931 6,095 9,458 3,341 5,377 8,190Canada 0.74 0.88 1.29 0.69 0.96 1.36 France 1.00 1.17 1.42 0.67 0.85 1.12 Germany 1.07 1.20 1.46 0.74 0.90 1.17 Italy 1.05 1.21 1.46 0.73 0.92 1.20 Japan 105 133 185 85 113 167Spain 0.80 0.94 1.18 0.60 0.75 1.04 UK 0.75 0.86 1.13 0.65 0.77 1.07 US 0.41 0.58 0.99 0.41 0.66 1.11
Source: Author’s calculations.
Notes: — = not available. December 2006 prices instead of January 2007 prices in Ghana and South Africa, and the Febru-ary 2007 diesel price instead of January 2007 in Nigeria were used.

33E x t r a c t i v e I n d u s t r i e s f o r D e v e l o p m e n t S e r i e s
Appendix 2: Pass-through Coefficients and Regression Analysis
Table A2.1 shows calculated pass-through coefficients based on the local prices given in table A1.2.
The pass-through coefficients in table A2.1 were set as dependent variables in linear regression analysis. Explanatory variables were fuel prices at the beginning of the period; a country’s vulnerability index in 2006; a dummy for the country’s import status (1 if the vulnerability index is positive and 0 otherwise); local currency appreciation against the U.S. dollar between the beginning and the end of the period; the logarithm of GDP per capita at the beginning of the period at purchasing power parity as well as based on market exchange rates; and, in the case of the pass-through in the second subperiod, the pass-through coefficient in the first subperiod. Regressions were iterated until the coefficients for explanatory variables were statistically significant at 5 percent and the equation specification gave the highest predictive power based on R-squared or F-statistics. The vulnerability index and per capita GDP were not available for Iraq, so that when either one of these explanatory variables was entered, the sample size decreased by one.
When the entire sample was used, the regression residuals rejected the null hypothesis that there was no skewness or kurtosis at 5 percent in all cases except diesel pass-through in the second subperiod. Removing Brazil in the case of gasoline in 2004–07 and Zambia for all cases except diesel in 2007–08—two countries with very high pass-through coefficients—corrected the problem. The results using ordinary least squares are shown in table A2.2.
To test the robustness against the possibility that the distribution of errors may not be normal, regressions were run using two other methods. The first used least-absolute value models. The second was a version of robust regression, performing an initial screening based on Cook’s distance greater than 1 to eliminate gross outliers prior to calculating

c h a n g E S I n E n D - U S E r P E t r o l E U m P r o D U c t P r I c E S34
starting values and then Huber iterations followed by biweight iterations (referred to as Huber iterations hereafter). If these give the same qualitative results as ordinary least squares—the same variables are statistically significant, the same equation specification gives the highest predictive power, and coefficients are similar in magnitude—then such findings validate the results of ordinary least squares.
For gasoline, all three methods gave the same equation specification during the first subperiod. During the second subperiod, the least-absolute value model gave statistically significant results with higher R-squared when the logarithm of GDP per capita in 2007 at purchasing power parity was included among explanatory variables. For the full period, the coefficient in front of the per capita GDP variable was not statistically significant and had to be removed. Hubert iterations gave statistically significant results with a country’s vulnerability index rather than its import status. For diesel, all three methods again gave the same equation specification during the first subperiod. For the second subperiod, the least-absolute value model gave higher R-squared when the logarithms of prices were taken. For the full period, an equation with only the logarithm of diesel price in 2004 gave the highest R-squared or F-statistics for the latter two methods.

35E x t r a c t i v e I n d u s t r i e s f o r D e v e l o p m e n t S e r i e s
Table A2.1 Pass-through Coefficients Based on Local Currency Units
Country Gasoline Diesel
2004–07 2007–08 2004–08 2004–07 2007–08 2004–08
Argentina 0.1 0.6 0.5 0.2 0.4 0.4Bangladesh 2.5 1.4 1.8 0.9 0.8 0.9Brazil 5.6 0.0 0.6 2.1 0.3 0.8Chile 2.8 0.4 0.9 1.8 1.3 1.4China 2.7 0.6 1.1 1.5 0.6 0.9Colombia 4.0 0.5 1.1 1.9 0.5 0.9Egypt, Arab Republic of 0.7 0.3 0.4 0.2 0.2 0.2Ethiopia 4.0 0.4 1.1 1.7 0.3 0.7Ghana 2.2 0.8 1.2 1.8 0.8 1.0Guatemala — — 1.4 — — 1.5Honduras 0.9 0.9 0.9 1.1 1.2 1.2India 2.3 0.5 0.9 1.5 0.1 0.6Indonesia 2.3 0.5 1.0 1.5 0.3 0.7Iran, Islamic Rep. of 0.1 0.1 0.1 0.0 0.0 0.0Iraq 2.6 0.4 0.9 0.7 0.6 0.6Jordan 2.6 0.7 1.1 1.5 1.5 1.5Kazakhstan 2.1 0.7 1.0 1.4 0.9 1.0Lao PDR 3.9 1.3 1.9 2.1 1.3 1.5Malawi 3.3 1.9 2.3 1.5 1.9 1.8Malaysia 2.1 0.6 0.9 1.6 0.7 0.9Mexico 0.6 0.1 0.3 0.4 0.1 0.2Morocco 2.1 0.4 0.9 2.7 0.3 1.1Mozambique 3.6 2.0 2.5 2.2 1.2 1.6Nepal 1.7 1.5 1.5 1.6 0.7 1.0Nicaragua 1.7 1.2 1.3 1.2 1.3 1.3Nigeria 1.8 0.1 0.6 0.6 1.7 1.3Pakistan 3.2 1.3 1.7 1.3 1.4 1.4Philippines 4.0 1.5 2.0 2.2 1.3 1.6Rwanda — — 2.0 — — 1.5South Africa 1.9 1.8 1.8 1.8 1.7 1.8Sri Lanka 3.2 1.7 2.1 1.3 1.2 1.2Syrian Arab Rep. 0.9 0.6 0.7 0.0 0.9 0.6Tanzania — — 2.1 — — 2.0Thailand 2.9 1.1 1.5 1.6 0.9 1.1Tunisia 1.8 0.5 0.9 1.2 0.4 0.7Uganda 1.9 1.8 1.8 1.0 1.9 1.6Venezuela, R. B. de 0.0 0.0 0.0 0.0 0.0 0.0Vietnam 2.6 1.4 1.7 1.5 1.0 1.2Yemen, Rep. of 1.0 0.0 0.3 0.5 0.0 0.2Zambia 7.6 3.8 4.8 3.4 2.7 3.0Canada 1.4 1.1 1.1 1.6 1.0 1.2France 1.9 1.2 1.4 1.4 1.1 1.2Germany 1.5 1.3 1.3 1.2 1.0 1.1Italy 1.8 1.2 1.4 1.4 1.1 1.2Japan 1.7 1.6 1.6 1.2 1.3 1.3Spain 1.6 1.2 1.3 1.2 1.1 1.2United Kingdom 2.1 1.5 1.6 1.5 1.3 1.4United States 1.5 1.0 1.1 1.4 1.1 1.2
Source: Author’s calculations.
Note: — = not available. The midpoint is December 2006 instead of January 2007 in Ghana and South Africa, and February 2007 for diesel in Nigeria.

c h a n g E S I n E n D - U S E r P E t r o l E U m P r o D U c t P r I c E S36
Table A2.2 Results of Ordinary Least Squares Regression for Pass-through Coefficients
Fuel Gasoline Diesel Gasoline Diesel Gasoline Diesel
Start date Jan. 2004 Jan. 2004 Jan. 2007 Jan. 2007 Jan. 2004 Jan. 2004
End date Jan. 2007 Jan. 2007 Aug. 2008 Aug. 2008 Aug. 2008 Aug. 2008
Observations 42 44 44 45 46 46
R-squared 0.53 0.54 0.33 0.31 0.43 0.50
Constant 4.8 (5.4)
0.72 (6.1)
0.17 (1.0)
0.25 (1.5)
1.7 (3.4)
2.2 (6.0)
Import 1.0 (4.0)
0.83 (5.9)
Insig. Insig. 0.73 (4.9)
Insig.
Fuel price at start Insig. Insig. 0.90 (4.6)
1.0 (4.4)
Insig. n.a.
Logarithm of fuel price at start n.a. n.a. n.a. n.a. n.a. 0.40 (6.4)
Currency appreciation between start and end
0.048 (38)
0.025 (4.1)
Insig. Insig. Insig. Insig.
Logarithm of GDP p.c. in start year at purchasing power parity
−0.40 (−4.0)
Insig. Insig. Insig. −0.12 (−2.2)
−0.085 (−2.0)
Logarithm of GDP p.c. in start year at market exchange rate
n.a. n.a. n.a. n.a. n.a. n.a.
Source: Author’s calculations.
Note: Insig. = coefficient statistically insignificant; n.a. = not applicable; p.c. per capita. T-statistics shown in parentheses.

37E x t r a c t i v e I n d u s t r i e s f o r D e v e l o p m e n t S e r i e s
References
Alaimo, Veronica, and Humberto Lopez. 2008. “Oil Intensities and Oil Prices: Evidence from Latin America.” Policy Research Working Paper 4640. Washington, DC: World Bank. http://go.worldbank.org/8LGKDEDPH0.
Bacon, Robert, and Masami Kojima. 2006. Coping with Higher Oil Prices. ESMAP Report 323/06. Washington DC: World Bank. http://esmap.org/fi lez/pubs/8142008101202_coping_oil_ price.pdf.
—. 2008. Vulnerability to Oil Price Increases: A Decomposition Analysis of 161 Countries. Extractive Industries for Development Series #1. Washington, DC: World Bank.
Coady, David, Moataz El-Said, Robert Gillingham, Kangni Kpodar, Paulo Medas, and David Newhouse. 2006. “The Magnitude and Distribution of Fuel Subsidies: Evidence from Bolivia, Ghana, Jordan, Mali, and Sri Lanka.” IMF Working Paper No. 06/247. Washington, DC: International Monetary Fund. www.imf.org/external/pubs/ft/wp/2006/wp06247.pdf.
Global Insight Daily Analysis. 2008. “Fuel Shortages in Zambia Push Prices Higher.” August 12.
Mati, Amine. 2008. “Managing Surging Oil Prices in the Developing World.” IMF Survey Magazine. www.imf.org/external/pubs/ft/survey/so/2008/POL032008A.htm.
IMF (International Monetary Fund). 2008. “Fuel and Food Price Subsidies: Issues and Reform Options.” www.imf.org/external/np/pp/eng/ 2008/090808a.pdf.
U.S. EIA (Energy Information Administration). 2008. Petroleum Navigator – Spot Prices. http://tonto.eia.doe.gov/dnav/pet/ pet_pri_spt_s1_d.htm.


THE WORLD BANK OIL, GAS, AND MINING POLICY DIVISION
The World Bank Group's role in the oil, gas, and mining sectors focuses on ensuring that its current interventions facilitate the extractive industries' contribution to poverty alleviation and economic growth through the pro-motion of good governance and sustainable development.
The Oil, Gas, and Mining Policy Division serves as the Bank's global sector management unit on extractive industries and related issues for all the regions of the world. It is part of the Oil, Gas, Mining, and Chemicals Department, a joint World Bank/International Finance Corporation department.
Through loans, technical assistance, policy dialogue, and analytical work, the Division leads a work program with multiple sector activities in more than 70 countries, of which almost half are in Sub-Saharan Africa. More specifically, the Division:
Advises governments on legal, fiscal, and contractual issues and •on institutional arrangements as they relate to natural resources, as well as on good governance practices
Assists governments in setting up environmental and social •safeguards in projects in order to promote the sustainable development of extractive industries
Helps governments formulate policies that promote private sector •growth and foreign direct investments
Advises governments on how to increase the access of the poor to •clean commercial energy and to assess options for protecting the poor from high fuel prices
The Oil, Gas, and Mining Policy Division serves as a global technical advi sor that supports sustainable development by building capacity and provid ing extractive industry sector-related advisory services to resource-rich gov ernments. The Division also carries out an advocacy role through its man agement of the following global programs:
The Extractive Industries Transparency Initiative (EITI) multidonor •trust fund, which supports countries in implementing EITI programs
The Global Gas Flaring Reduction (GGFR) Public-Private •Partnership, which brings governments and oil companies together to reduce gas flaring
The Communities and Small-Scale Mining (CASM) Partnership, •which promotes an integrated approach to addressing issues faced by artisanal and small-scale miners
The Gender and Extractive Industries Program, which addresses •gender issues in extractive industries
The Petroleum Governance Initiative (PGI), which promotes good •governance


Extractive Industries and Development Series #2February 2009
Changes in End-User Petroleum Product Prices
A Comparison of
48 Countries
Masami Kojima
The World Bank1818 H Street, N.W.Washington, D.C. 20433USA
www.worldbank.org/ogmc (OR /oil OR /gas OR /mining)www.ifc.org/ogmc (OR /oil OR /gas OR /mining)