changing a ‘culture’ of corruption: evidence from an ... · changing a ‘culture’ of...
TRANSCRIPT

Changing a ‘culture’ of corruption:
Evidence from an economic experiment in Italy
Nan Zhang
European University Institute, Italy
March 12, 2015
Abstract
Empirical evidence demonstrates that bribery, extortion and graft are often the outgrowths ofa deeper ‘culture of corruption’ which has proved disconcertingly resilient in the face of publicsector reforms. This article investigates whether changing collective beliefs about how ‘mostpeople in society’ will behave can reform prevailing cultural practices. Employing an economicexperiment involving Northern and Southern Italian university students, this study shows that(costly) honest behavior can be sustained by conditional beliefs about the honesty of others. Ialso hypothesize that, given Southern Italians’ reputation for corruption, informing participantsthat they are interacting with Southerners should increase the level of bribery in the experiment.However, surprisingly, I find the opposite effect: when exposed to information about the identityof their fellow participants, Southern Italians are not only less corrupt, but they are also morelikely to believe that their counterparts are less corrupt. I discuss several explanations whichmay account for these unexpected findings. Overall, the paper provides theoretical foundationsand experimental support for how new cultural practices might emerge.
Keywords
Corruption, culture, experiment, social norms, Italy
Corresponding Author:Nan Zhang, Department of Political and Social Sciences, European University Institute, Via deiRoccettini 9, I-50014 San Domenico di Fiesole (FI), Italy
Introduction
Political scientists, economists and legal scholars have traditionally attributed the causes of endemic
corruption to weak legal enforcement and misaligned bureaucratic incentives (Klitgaard, 1988; Rose-
Ackerman, 1999). However, in recent years, a growing body of evidence has demonstrated that
bribery, extortion and graft are often the outgrowths of a deeper ‘culture of corruption’ which has
proved disconcertingly resilient in the face of public sector reforms (Barr & Serra, 2010; Fisman
& Miguel, 2007; Husted, 1999; Licht et al., 2007). The case of Italy demonstrates this point
powerfully: although largely sharing a unified legal structure and formal institutions, Italian regions
exhibit enormous diversity in the honesty and effectiveness of local government (Charron et al.,
2013a,b; Golden & Chang, 2001; Golden & Picci, 2005; Putnam, 1993). While the ‘civic’ North
is characterized by high levels of social trust that enable citizens to place their common welfare
above the pursuit of narrow particularist interests, behavior in the South is exemplified by the ethos
of ‘amoral familism’: ‘maximize the material, short-run advantage of the nuclear family: assume
that all others will do likewise’ (Banfield, 1958: 83). Putnam (1993) has famously traced these
cultural patterns to differences in political and social organization arising from the Middle Ages.
The cultural roots of the Questione Meridionale run deep indeed.
This paper contributes to the literature on anti-corruption reform by analyzing this notion of
culture from the perspective of formal, rational-choice theory. Rather than conceptualizing corrupt
practices as arising from a set of deeply-ingrained values which are held in some societies, but
not in others (see Ekeh, 1975; Lipset & Lenz, 2000; Husted, 1999; Olivier De Sardan, 1999; Price,
1974), the rational-choice approach treats cultural differences as a contingent outcome of individual
choices which, in equilibrium, are sustained through shared, mutually-enforcing beliefs about the
consequences of deviating from the norm (Laitin & Zhang, 2012). For example, while corruption is
generally condemned across societies (Rothstein & Torsello, 2014), an individual may be more likely
to engage in corrupt practices when she believes that her fellow citizens are doing the same. In this
context, bribery appears socially appropriate, and honesty achieves nothing except to leave her as
the only ‘sucker’ (Persson et al., 2013). By contrast, if an individual believes that her peers are
honest, she may refrain from taking advantage of corrupt opportunities in order to avoid triggering
social disapproval. In this sense, the Italian South’s ‘culture of corruption’ and the North’s ‘civic
culture’ can be reformulated as conditional choices, sustained by common knowledge beliefs about
how other citizens will behave.
The equilibrium approach not only helps us to understand how cultural practices are maintained
and reproduced over time, but also opens up vistas on the processes facilitating cultural change.
Laitin (1998) shows how, in the context of Estonian language policy, changes in the economic
calculus of educating children in Estonian rather than in Russian led to early moves toward national
1

assimilation amongst the formerly monolingual Russian-speaking minority. Once parents started
to believe that most other parents would choose Estonian over Russian education (lowering the
relative payoff to learning Russian), they too made the shift, setting off a cultural cascade towards
an all-Estonian equilibrium. Can a similar dynamic work in the corruption context? That is, if
we change collective beliefs about whether ‘most people in society’ are corrupt or honest, can we
reform the culture of corruption?
To address this question, I first present a game theoretic model of cultural choice. Based closely
on the tipping games popularized by Laitin (2007), Mackie (1996) and Schelling (1978), the model
helps to illustrate the dynamics through which individual decisions produce continuity and change
in cultural practices. To test the implications of the model, I report results from a laboratory
experiment involving Italian university students in a stylized Corruption Game, in which I attempt
to induce a change in cultural practices by activating stereotypes about other participants. In
particular, if it is common knowledge that ‘All Southerners are corrupt,’ then informing partici-
pants about whether they are playing with Southerners should change both (a) beliefs how much
corruption is likely to prevail within the group, and (b) participants’ own behavior.
I report some unexpected results: in the absence of information about their fellow participants
in the Corruption Game, Southerners are indeed more likely than Northerners to accept bribes.
Moreover, the likelihood of bribe-taking is significantly predicted by beliefs about the honesty of
other participants. Yet, surprisingly, when informed that they are interacting with other South-
erners, Southern participants are not only less corrupt, but they are also more likely to believe
that their counterparts are less corrupt. In other words, the experiment confirms the dynamics
illustrated in the tipping model, but the cultural equilibrium tips in the opposite direction to that
hypothesized. I discuss several explanations that may account for these counter-intuitive findings,
before concluding with some suggestions for future research.
An equilibrium approach to culture
Given that corrupt transactions are often extremely lucrative for the participants involved (or their
immediate family or friendship circle), does it make sense to think of corruption as a collective
choice? Why would individuals not take advantage of all corrupt opportunities that come their
way, at least in cases where they will neither be easily detected nor harshly punished?
The obvious answer (at least to non-economists) is that we are often restrained from self-interested
behavior not by the fear of legal sanctions, but rather by our sense of right and wrong. As Ariely
(2013) shows, many individuals do not cheat (very much) when given the opportunity, even when it
is common knowledge that the probability of detection is zero. Moreover, while sometimes our sense
of justice is innately driven - for example, our private morality prevents most of us from killing1 -
2
in many other cases we define right and wrong according to our beliefs about how others think we
ought to behave. There is nothing innately immoral about wearing shorts to the opera, or running
a red light at a deserted intersection at three in the morning, but injunctive norms spell out rules
of appropriateness in these situations (Cialdini et al., 1990). Behavioral conformity to normative
prescriptions/proscriptions is ensured not through appeal to material costs and benefits, but rather
through social rewards and sanctions: praise for following the rules, shame or ostracism for norms
transgressions, and guilt at the thought of violating others’ expectations (Bicchieri, 2005; Elster,
1989; Sunstein, 1996). Once we introduce social rewards and punishments into the standard utility
function, we can easily see how normative compliance leads individuals to take actions counter to
their material self-interest.
Recent research shows that individuals in most societies do not internalize corruption as a legitimate
part of their cultural repertoire (Rothstein & Torsello, 2014). Rather, even societies at the very
bottom of cross-national corruption rankings possess injunctive norms against corruption (Miller,
2006; Persson et al., 2013). However, the force of these injunctions depends upon the underlying
extent of normative violations: by observing the compliance/transgressions of others, individuals
update their beliefs about the likelihood that their own actions will trigger social sanctions. For
instance, if I see that most others cheat, I am likely to infer that they will not really mind if I cheat
as well.2 Indeed, to single me out in this environment would seem overly scrupulous, unfair, or
even hypocritical. Applied to the corruption context, individuals act as conditional norm compliers
(Bicchieri, 2005): the more corruption they believe exists in society, the less reluctant they become
to engage in corruption themselves.3 This leads to my first hypothesis:
H1: Although individuals understand that corruption is wrong, they will not abide by
injunctive norms if they believe that such norms are commonly violated.
Economists have long recognized that corruption outcomes constitute frequency dependent equi-
libria. However, their explanations have tended to focus on the material mechanisms underlying
individuals’ desires to coordinate with others (Andvig & Moene, 1990; Bardhan, 1997). For exam-
ple, in societies where corruption is rampant, it is easier to find a corrupt partner since more people
have the ‘skills’ to participate in corruption (Della Porta & Vannucci, 1999), there are more mid-
dlemen around to help match potential partners (Englebert, 2009), and there may exist informal
institutions (e.g. the mafia) capable of enforcing illicit contracts (Gambetta, 2013). At the same
time, law enforcement agencies may themselves be corruptible (Cadot, 1987), or prosecutors may
be overwhelmed by the sheer number of corruption cases to try, leading to a lower probability that
any one individual will be caught and punished (Lui, 1986).
The mechanism posited here - conditional norm compliance - represents a complement to these
approaches.4 However, individual conformity to the modal behavior of society, rather than arising
from an economic cost-benefit calculus, is sustained by the desire to receive social praise, or to
3

Figure 1: Tipping game for corruption decision
avoid shame and social exclusion. This mechanism is depicted in Figure 1, which represents an
individual’s decision to behave corruptly or honestly as a function of social costs. There exist two
stable equilibria in which all are honest (H) or all are corrupt (C), along with a tipping point
τ . At any point to the left of τ , because many others are corrupt, an individual does better by
entering into corrupt transactions since there is likely to be little social stigma associated with the
realization of illicit gains. By contrast, at any point to the right of τ , an individual is better off
behaving honestly because many others are honest themselves, and are therefore likely to police
corrupt behavior. In this case, violations of the integrity norm trigger social shame and feelings
of guilt, while honest individuals are lauded as positive role models instead of ridiculed as suckers.
These social rewards and sanctions lead to the second hypothesis:
H2: Independently of the material costs and benefits, the likelihood that an individual
behaves honestly is directly proportional to his belief that his peers are also honest.
The tipping game neatly captures an important social dilemma: while better collective outcomes can
be achieved by coordinating on H, people face strong individual incentives to engage in corruption
when all others are doing so. Figure 1 thus illustrates how a ‘culture of corruption’ (represented by
C) is sustained over time: individuals find it irrational to change their behavior unless they can be
sure that others will switch as well. But since everyone believes that ‘society’ is corrupt, everyone
behaves in a way that confirms these collective priors. Thus we can see how a so-called cultural
predisposition towards corruption, while appearing natural and permanent ex post, is actually the
product of complex inter-dependent choices ex ante.
By opening up the box of cultural (re)production, the tipping game also sheds light on the dynamics
of cultural change. Suppose that at time t, society is at the all-corrupt equilibrium C. Now consider
an individual i who (for whatever reason) believes that the population of honest people lies to the
4

right of τ . Given this belief, i will choose to act honestly (represented by point h), and thereby
shift society closer to τ at time t+1. However, once i realizes that h < C, this shift is not sustained
in equilibrium, and society eventually falls back to C.
But suppose instead that, in addition to i, individuals j through N also believe that society lies to
the right of τ , and N > τ . In this case, each individual’s best course of action is to choose honesty
over corruption, and since N individuals make this choice simultaneously, initial beliefs become
self-fulfilling. As a consequence, cultural practice ‘tips’ from C to H.
The key to precipitating such a cultural shift lies in coordinating a collective revision of beliefs
about the likely behavior of others in society. In what follows, I consider the possibility that
a cultural tip may be set off by mixing two populations (Northern and Southern Italians) with
different reputations for honesty. In particular, Southern Italians are often stereotyped as amoral
and opportunistic (Banfield, 1958), while their Northern compatriots are perceived as more virtuous
and civic-minded. Furthermore, public opinion data show that these characterizations do not
merely embody Northern prejudice, but actually reflect how Southerners think about themselves.
As shown in Table 1, when locally-representative samples of Italians are asked to rank how often
other citizens in their own region engage in bribery, the average standardized score for Southern
regions is -1.04, as opposed to +0.36 for Northern regions (with positive scores denoting greater
honesty).
In light of these stereotypes, it may be possible to change beliefs about whether ‘society’ lies to
the right or left of τ by manipulating the proportions of Northerners and Southerners in a group.
Furthermore, if the choice between corruption and honesty is conditional upon beliefs about the
likely behavior of others, then as the probability of interacting with Southerners increases, so should
the propensity to engage in illicit behavior. This leads us to our final two hypotheses:
H3: Informing Italians that they are interacting with individuals from the South strength-
ens the belief that others are dishonest.
H4: Informing Italians that they are interacting with individuals from the South in-
creases the likelihood of corrupt behavior.
In the following section, I describe an experiment designed to test these four hypotheses.
Methodology
Experiments have gained increasing currency in applied social science as a tool to help researchers
understand the dynamics underlying individual decision-making. They have proven particularly
useful when real-world data are scarce or difficult to observe directly. For this reason, experiments
represent valuable research tools in the study of corruption, as such behavior is usually hidden due
5

Table 1: Perceptions of corruption across Italian regions
Northern Regions Bribe Central Regions Bribe Southern Regions Bribe
Bolzano 0.89 Marche -0.04 Abruzzo -0.44Trentino Alto-Adige 0.87 Umbria -0.16 Basilicata -0.88Friuli-Venezia-Giulia 0.83 Lazio -0.54 Molise -0.9Valle d’Aosta 0.55 Average -0.25 Sicilia -1.05Toscana 0.42 Puglia -1.18Veneto 0.37 Calabria -1.21Emilia-Romagna 0.07 Campania -1.63Piemonte -0.02 Average -1.04Liguria -0.09Lombardia -0.31Average 0.36
Data from the 2013 European Quality of Governance Index (Charron et al., 2013a,b). Scores arebased on survey responses about the amount of perceived bribery committed by others in respondents’area. All ratings have been standardized.
to its illicit nature (Abbink & Serra, 2012; Armantier & Boly, 2013). Secondly, experiments can
help us to disentangle multiple mechanisms that produce equivalent results in observational data.
As noted in the previous section, both economic incentives and social rewards and punishments are
frequency dependent: by simply observing that individuals are more prone to engage in corruption
in highly corrupt environments, we cannot be sure which mechanism is at work. Scholars employing
experimental methods can gain analytical leverage over these issues by holding economic incentives
constant, thereby isolating the effects of normative constraints. Finally, experimental techniques
can directly illustrate the mechanisms represented in Figure 1 by measuring agents’ beliefs, and
mapping such beliefs to individual actions.
Description of experimental tasks
The experiment described in this section embeds participants in a framed hospital setting where
they are given the opportunity to offer and accept bribes, and also to report corrupt behavior on the
part of other individuals.5 In each session of the Corruption Game, a maximum of 24 participants
are randomly assigned to one of three roles: {Nurse, Early Patient (PE), Late Patient (PL)}. Both
PE and PL begin each round with an initial endowment of 32 Tokens. Players in both Patient roles
are told to imagine that they are waiting in line at a public hospital to see the doctor. Waiting is
costly for Patients, but because PEs have arrived early at the hospital, they face a very short wait,
and therefore maintain their initial endowment. However, PLs face a very long wait, and will lose
16 Tokens as a result. PLs therefore retain 32 - 16 = 16 Tokens in the round.
6

(a) Nurse Accepts Offer (b) Nurse Rejects Offer
Figure 2: Screenshots of PL and Nurse decisions
However, PLs also have the possibility of skipping the line and avoiding the loss of 16 Tokens. Each
PL is randomly matched to one Nurse, and has the option of offering this Nurse a ‘gift’ worth 6
Tokens, in exchange for being allowed to skip the line. In other words, if the PL makes an offer and
the Nurse accepts, the PL jumps the queue and earns 32 - 6 = 26 Tokens. Although in this case
the PL pays the cost of the gift, he is much better off at the front of the queue (with 26 Tokens)
than at the back (with 16 Tokens). However, as a consequence of the exchange between the PL
and the Nurse, all of the PEs must wait a little longer to see the doctor and, as a consequence,
each suffers a small loss of 3 Tokens.
Notice that offering a gift is a dominant strategy in the game. If the PL chooses not to offer a gift,
he is sure to lose 16 Tokens. The same result obtains if the PL offers a gift, but his offer is rejected
by the Nurse (however, having your offer rejected carries no additional cost). On the other hand,
the PL’s earnings increase from 16 to 26 if his offer is accepted. Therefore, PLs can only gain by
offering.
For their part, Nurses must decide whether to accept gifts from Patients. Nurses begin the game
with 24 Tokens, and retain this amount if they are offered no gifts, or if they refuse to accept PL
offers. On the other hand, if they decide to accept gifts, and in exchange permit PLs to skip the
line, they will receive 6 additional Tokens for each gift they receive. Because PLs and Nurses are
randomly matched, it is possible that Nurses interact with more than one PL in the round, and
also that Nurses interact with no PLs. However, in either case, a Nurse must choose what he/she
would do in case a gift is offered. In this way, I can elicit players’ full strategies while allowing them
to make decisions simultaneously rather than sequentially.
7

Figure 3: Screenshot of the reporting decision
The decisions that can be taken by PLs and Nurses (and the effect of these decisions on all players’
earnings) are shown in Figure 2.6 Note that although skipping the line is mutually beneficial to
both Nurses and PLs, it is harmful to ‘society.’ This is because there are 8 PEs in each round, and
therefore PEs as a group lose 3 × 8 = 24 Tokens for each corrupt transaction, while the total gain
for the other players is only 16 (10 for the PL and 6 for the Nurse).
Another point to note is that, unlike PLs, for whom corruption is a dominant strategy, Nurses must
make their decisions in the shadow of punishment. In particular, the game contains an element
of monitoring and sanctioning, implemented through the role of PEs. PEs are randomly matched
to one Nurse, and are told that they can ‘overhear’ conversations between this Nurse and other
patients, so that they will know if the Nurse has exchanged any favors. PEs then have the option
of reporting the Nurse to the hospital administration, which may or may not act on the report (see
Figure 3).
The report is effective 50% of the time, in which case the Nurse forfeits any gifts he has received,
and also pays a fine of 9 Tokens, so that he retains only 24 - 9 = 15 Tokens at the end of the round.
But the other 50% of the time, the report is ignored and the Nurse is not sanctioned.7 However, no
matter what happens to the Nurse, reporting is costly to the PE, who must pay a reporting ‘fee’ of
3 Tokens. In fact, from the PE’s perspective, reporting is never rational in a one-shot game: even
if the Nurse is punished, PLs who have skipped the line remain at the front. In other words, PEs
still lose Tokens for every PL that skips the line, irrespective of their own actions. If participants
played as perfectly rational payoff maximizers, the one-shot game has a single equilibrium outcome:
all PLs offer gifts, no PEs report corrupt exchanges, and all Nurses accept offers.
8

The Corruption Game is played for 3 rounds. In each round, players are randomly assigned to
a (new) role, so that by the end of the game players have had the chance to play in all 3 roles.
Players are only shown the results of each round at the end of the session. This feature, coupled
with the fact that players are randomly rematched in each period, means that behavior in the game
should not be influenced by concerns about reputation or retaliation. Finally, since the rules are
somewhat complex and the payoffs hard to keep track of, at the moment they make their decision,
players are shown a summary of their choices and the possible consequences for themselves and for
other participants. In general, self-reported understanding of the game was excellent.8
Next, participants take part in an incentivized belief elicitation task to measure their perceptions of
the relevant injunctive norms prevailing in the Corruption Game, as well as the extent of compliance
with these norms. In particular, participants are first asked whether they personally AGREE with,
DISAGREE with, or have NO OPINION about three statements:
1. ‘A participant in the role of PL should not offer gifts.’
2. ‘A participant in the role of Nurse should refuse gifts that are offered.’
3. ‘A participant in the role of PE should report an exchange of favors.’
Next, participants are asked to guess the total number of individuals in their session who:
• Q1: chose OFFER in the Corruption Game
• Q2: chose ACCEPT in the Corruption Game
• Q3: chose REPORT in the Corruption Game
Finally, participants are asked to guess (separately for each question pair) the total number of
individuals in their session who:
• Q4a and Q4b: AGREE and DISAGREE with the statement: ‘A participant in the role of PL
should not offer gifts.’
• Q5a and Q5b: AGREE and DISAGREE with the statement: ‘A participant in the role of Nurse
should refuse gifts that are offered.’
• Q6a and Q6b: AGREE and DISAGREE with the statement: ‘A participant in the role of PE
should report an exchange of favors.’
In all, players make a total of nine guesses, and earn tokens based on the accuracy of their an-
swers.
Questions Q1 - Q3 are direct measures of the degree of normative compliance. However, opera-
tionalizing the injunctive norm itself is more complicated. First, answers to the separate AGREE
and DISAGREE segments from Q4 - Q6 are converted into percentages by dividing by the total
number of participants in each session. Next, the DISAGREE segment is subtracted from the
AGREE segment, yielding a variable that captures how strongly any particular individual believes
9

that an action would meet with social disapproval. For example, if I answered that 30% of people
agree with the statement ‘A Nurse should refuse gifts’, and also that 30% disagree, my Q5 score
would be 30 - 30 = 0, reflecting the fact that I have no strong beliefs about what constitutes
socially appropriate behavior for Nurses.9 On the other hand, if I believe that most people viewed
the acceptance of gifts as socially inappropriate, then I would be likely to answer that more people
agree with the previous statement than disagree.
After completion of the main experimental tasks, participants take part in a lottery game de-
signed to measure their risk preferences (see Appendix 1). Once players have completed all of the
tasks, they are shown the results for each part of the experiment, as well as their total earnings.
Participants then answer a short debrief questionnaire before receiving payment. In total, each
session lasts about 1 hour and 10 minutes, and participants are paid about e13.50 ($17.50) for
their time.
Participants and treatment manipulation
The experiment was conducted at the University of Bologna’s Laboratory for Experiments in Social
Science (BLESS) in March and April 2013. A total of 93 student participants were recruited to one
of nine sessions at BLESS.10 Overall, 52 participants were female (56%) and 41 were male (44%).
The average age was slightly over 25 years. Column (1) in Table 2 presents basic descriptive
statistics.
Importantly, the University of Bologna enrolls a large student body, and admits students not
only from the surrounding region of Emilia-Romagna, but also from across Italy, including many
students from the South. Since the geographical composition of the BLESS participant pool is
likely to reflect the underlying composition of the student body, I am able to recruit individuals
from diverse regions of Italy with varying reputations for honesty. I then test whether providing
information based on these reputations can induce a ‘shock’ to collective beliefs, and thereby ‘tip’
cultural practices.
Specifically, immediately prior to the Corruption Game, participants are shown one of following
messages:
Primed : ‘Most participants in the session today come from the South of Italy.’
Neutral : ‘Participants in the session today come from all over Italy.’
The messages attempt to manipulate beliefs about the likely behavior of other participants in the
Corruption Game by activating stereotypes that ‘All Southerners are corrupt.’
In order to avoid deceiving participants, the manipulation of the messages could only be accom-
plished by actually controlling the composition of each session. Consequently, invitations to poten-
10
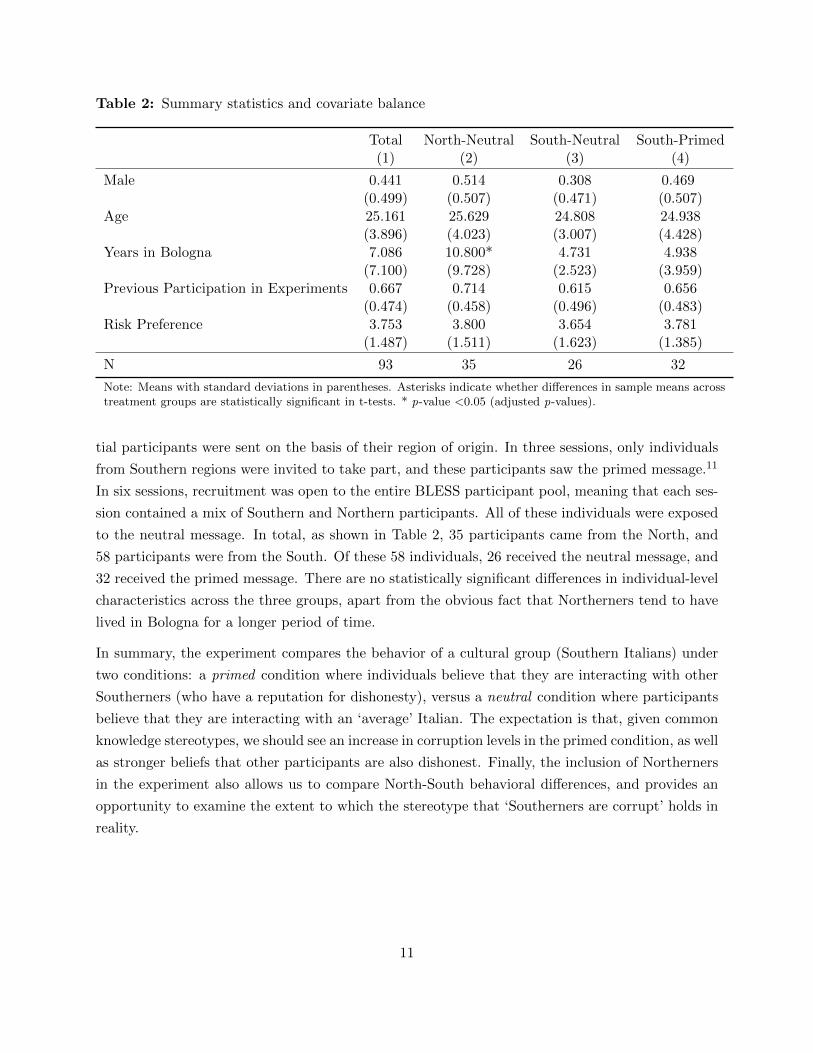
Table 2: Summary statistics and covariate balance
Total North-Neutral South-Neutral South-Primed(1) (2) (3) (4)
Male 0.441 0.514 0.308 0.469(0.499) (0.507) (0.471) (0.507)
Age 25.161 25.629 24.808 24.938(3.896) (4.023) (3.007) (4.428)
Years in Bologna 7.086 10.800* 4.731 4.938(7.100) (9.728) (2.523) (3.959)
Previous Participation in Experiments 0.667 0.714 0.615 0.656(0.474) (0.458) (0.496) (0.483)
Risk Preference 3.753 3.800 3.654 3.781(1.487) (1.511) (1.623) (1.385)
N 93 35 26 32
Note: Means with standard deviations in parentheses. Asterisks indicate whether differences in sample means acrosstreatment groups are statistically significant in t-tests. * p-value <0.05 (adjusted p-values).
tial participants were sent on the basis of their region of origin. In three sessions, only individuals
from Southern regions were invited to take part, and these participants saw the primed message.11
In six sessions, recruitment was open to the entire BLESS participant pool, meaning that each ses-
sion contained a mix of Southern and Northern participants. All of these individuals were exposed
to the neutral message. In total, as shown in Table 2, 35 participants came from the North, and
58 participants were from the South. Of these 58 individuals, 26 received the neutral message, and
32 received the primed message. There are no statistically significant differences in individual-level
characteristics across the three groups, apart from the obvious fact that Northerners tend to have
lived in Bologna for a longer period of time.
In summary, the experiment compares the behavior of a cultural group (Southern Italians) under
two conditions: a primed condition where individuals believe that they are interacting with other
Southerners (who have a reputation for dishonesty), versus a neutral condition where participants
believe that they are interacting with an ‘average’ Italian. The expectation is that, given common
knowledge stereotypes, we should see an increase in corruption levels in the primed condition, as well
as stronger beliefs that other participants are also dishonest. Finally, the inclusion of Northerners
in the experiment also allows us to compare North-South behavioral differences, and provides an
opportunity to examine the extent to which the stereotype that ‘Southerners are corrupt’ holds in
reality.
11
Results
Overall, 73% of PLs offered gifts, 34% of Nurses accepted, and 45% of PEs reported corrupt
exchanges. Clearly, outcomes in the Corruption Game differ from what we would expect under
the assumption that players are completely rational payoff maximizers. Can we attribute this
divergence to concerns about complying with anti-corruption norms? And if so, how do normative
beliefs and behavior change between the message treatments?
To address these questions, I first consider behavioral differences between Northerners and South-
erners in the mixed sessions. This will allow me to build a case for the validity of common stereo-
types. Next, I examine the extent to which behavior tracks social beliefs and expectations as
predicted by the tipping model. Finally, I compare the play of Southerners in the mixed sessions
who received the neutral message to Southerners who received the primed message.
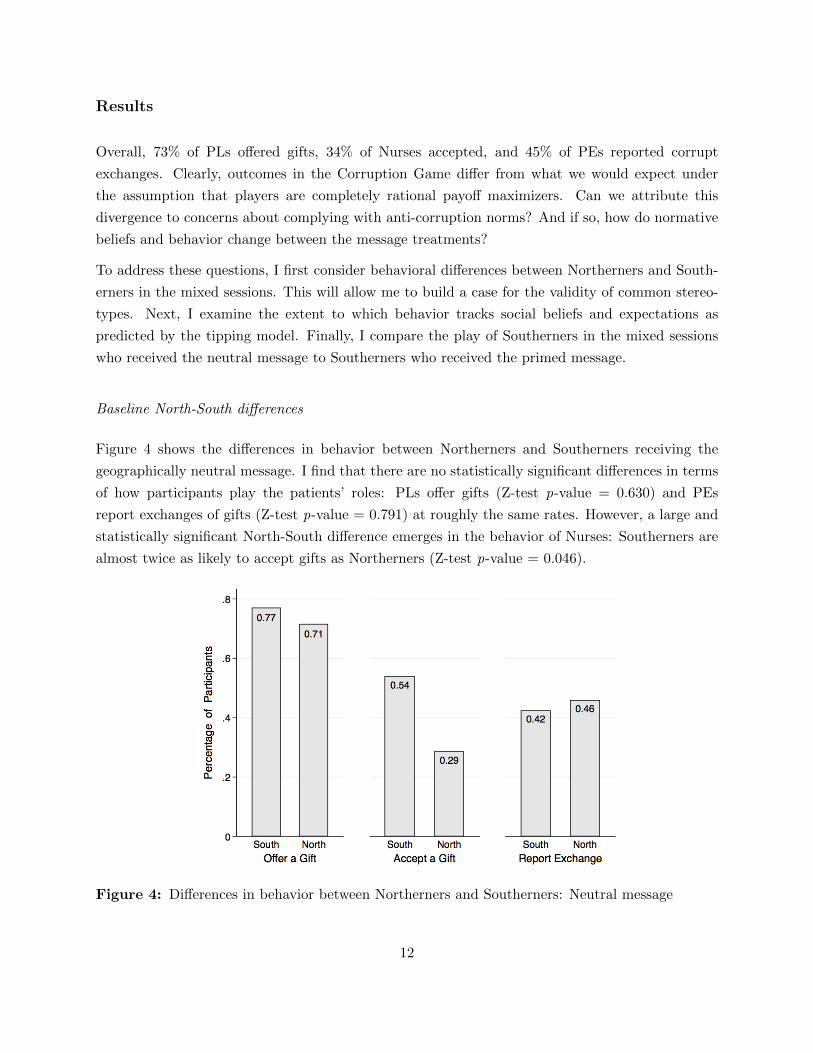
Baseline North-South differences
Figure 4 shows the differences in behavior between Northerners and Southerners receiving the
geographically neutral message. I find that there are no statistically significant differences in terms
of how participants play the patients’ roles: PLs offer gifts (Z-test p-value = 0.630) and PEs
report exchanges of gifts (Z-test p-value = 0.791) at roughly the same rates. However, a large and
statistically significant North-South difference emerges in the behavior of Nurses: Southerners are
almost twice as likely to accept gifts as Northerners (Z-test p-value = 0.046).
Figure 4: Differences in behavior between Northerners and Southerners: Neutral message
12

These results give us some confidence that observations and perceptions about the level of corruption
in real-world groups can be replicated, at least partially, in the lab (see Barr & Serra, 2010).
Moreover, the fact that a North-South gap only appears in the behavior of Nurses may reflect a
specific definition of corruption in the Italian context: simply, it may not be considered an act of
corruption for an individual in his private capacity to offer a gift in order to circumvent the formal
rules, but it would be corrupt and improper for a person in a position of public responsibility (in
this case, the Nurse) to accept one. As one participant stated in a debrief questionnaire:
It is normal that PLs try to jump the line by offering gifts to Nurses, but it is then up to the
Nurse to do the right thing for the other patients...(my emphasis)
This distinction between appropriate public and private responsibilities highlights the fact that
a corrupt transaction is a two-sided affair, and its success depends upon the willingness of the
bribe-taker to circumvent official rules. The South’s ‘culture of corruption,’ and the North’s ‘civic
culture,’ may in fact characterize only a narrowly professional, rather than a widespread popular,
ethos.12
Social appropriateness and illicit behavior
To what extent is the behavior of Nurses linked to individuals’ perceptions of the social appro-
priateness of accepting a gift? We can address this question using data from the belief elicitation
task. As noted above, cross-national survey evidence has shown that people in almost all societies
view corruption as wrong. This result is replicated amongst the experimental participants. Figure
5 shows the distribution of answers to BeliefDisapprove, which measures the difference in the par-
ticipants’ guesses about the number of individuals who agreed versus disagreed with the statement
‘A participant in the role of Nurse should refuse gifts that are offered’ (converted into percentage
terms). We see that the vast majority of participants (more than 80%) score > 0 on this question,
meaning they understand bribe-taking to violate injunctive norms.
However, is knowledge of injunctive norms alone sufficient to ensure honest behavior? Column (1)
in Table 3 presents estimation results from the following basic logit model:
Accepti = β1BeliefDisapprovei + εi
where Accepti is a dummy outcome variable denoting whether participant i accepted a gift,
BeliefDisapprovei is a measure of i ’s understanding that bribe-taking violates an injunctive norm,
and εi represents an individual-specific error term. We see that the coefficient, while correctly
signed, is not significant at traditional levels.
13

Figure 5: Distribution of beliefs about the social acceptability of corruption: Neutral message
In column (2), I estimate instead:
Accepti = β1BeliefAccepti + εi
where BeliefAccept measures a participant’s best guess about the percentage of other participants
who accepted a gift. We see now that the coefficient of interest is highly significant. Since
smaller values of BeliefAccept represent expectations of greater honesty, the positive association
with Accepti indicates that individuals will be more likely to engage in corruption themselves if
they believe others are doing likewise.
This result is exactly what we would predict from H1 and H2 , which hold that even though
corruption is understood to be wrong, illicit behavior in the context of widespread normative
violations are likely to generate little social disapproval. Rather, individuals behave as conditional
norm compliers, choosing honesty only when they believe that others are also honest. As shown in
columns (3) and (4), these results are robust to the inclusion of individual-level controls for gender,
age, and risk-preferences as measured in the lottery task.
The relationship between an individual’s own behavior and her expectations concerning others’
behavior is also substantively meaningful: on average, participants believe that 61% of their coun-
terparts would accept gifts (SD = 22%). Moving from half a standard deviation below this mean to
half a standard deviation above the mean is associated with a 37% increase in the likelihood that
any individual will accept a gift. This is a large effect, considering that the average gift-acceptance
rate is only 33%.
14

Table 3: Logit results: Beliefs and Nurses’ behavior
Dependent Variable: Accepting a Gift
(1) (2) (3) (4)
BeliefDisapprove -1.407 -1.780(0.129) (0.089)
BeliefAccept 8.423∗∗∗ 8.864∗∗∗
(0.000) (0.000)
Male -0.199 0.347(0.788) (0.715)
Age -0.0950 -0.0195(0.350) (0.893)
Lotto 1.056 1.099(0.149) (0.113)
Constant 0.116 -6.003∗∗∗ 2.525 -6.150(0.727) (0.000) (0.321) (0.079)
Observations 61 61 61 61Pseudo R2 0.049 0.275 0.088 0.302
All standard errors clustered within sessions. p-values (in parentheses).∗ p < 0.05, ∗∗ p < 0.01, ∗∗∗ p < 0.001
In summary, we see from Table 3 that it is not so much an understanding that ‘one ought not to
be corrupt’ that predicts honest behavior, but rather a belief that few others are corrupt. Figure
6 presents a graphical illustration of the relationship between social beliefs and individual corrupt
behavior. The key point to note is that, amongst those participants who understood accepting a
gift to be wrong (represented by points on the righthand side of the plot), many were nonetheless
willing to take bribes if they expected illicit behavior on the part of others (represented by dots in
the upper-righthand corner of the plot).
Messaging effects
So far, we have seen that behavior in the Corruption Game follows the predictions of the tipping
model. Next, I investigate whether a message about the proportion of Southerners in the room
can tip behavior even further towards the all-corrupt equilibrium. In particular, given the common
knowledge belief that ‘Southerners are corrupt,’ exposure to the primed message should lead to
an increase in the perceived social acceptability of corruption, and also to a higher level of gift-
acceptance in the Corruption Game.
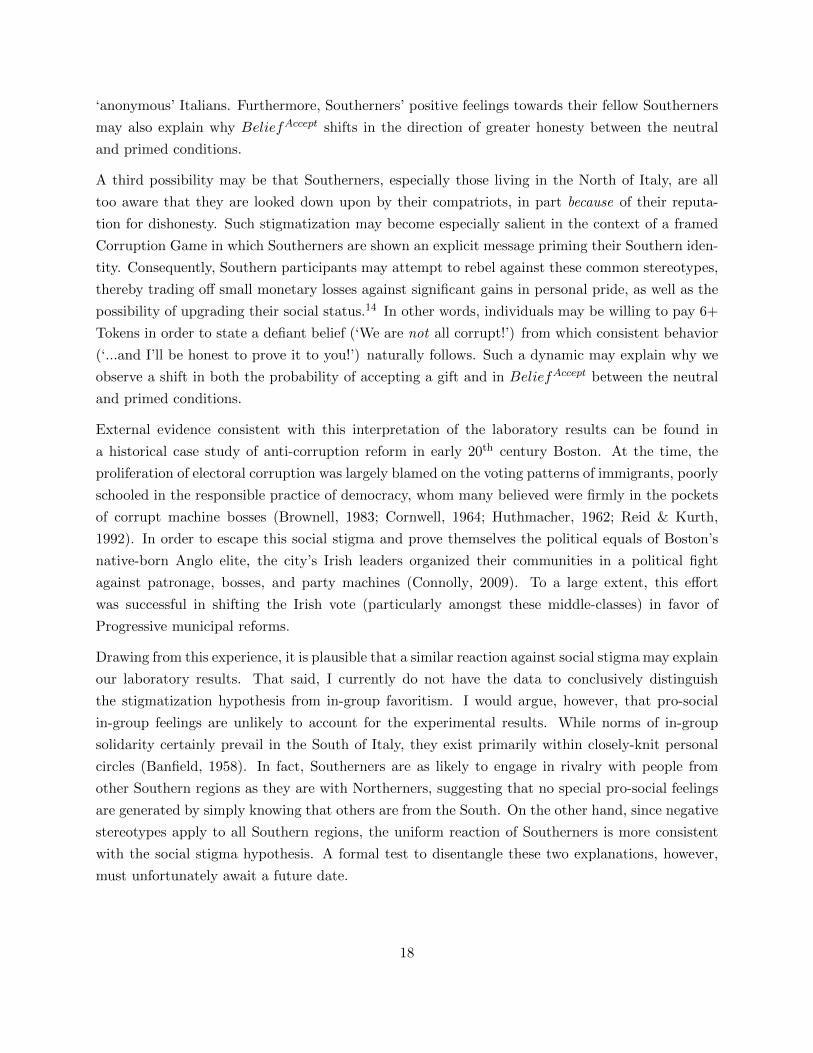
Figure 7 shows the differences in Nurses’ behavior between Northerners, Southerners who received a
neutral message, and Southerners under the Southern prime. Surprisingly, we see that the likelihood
15
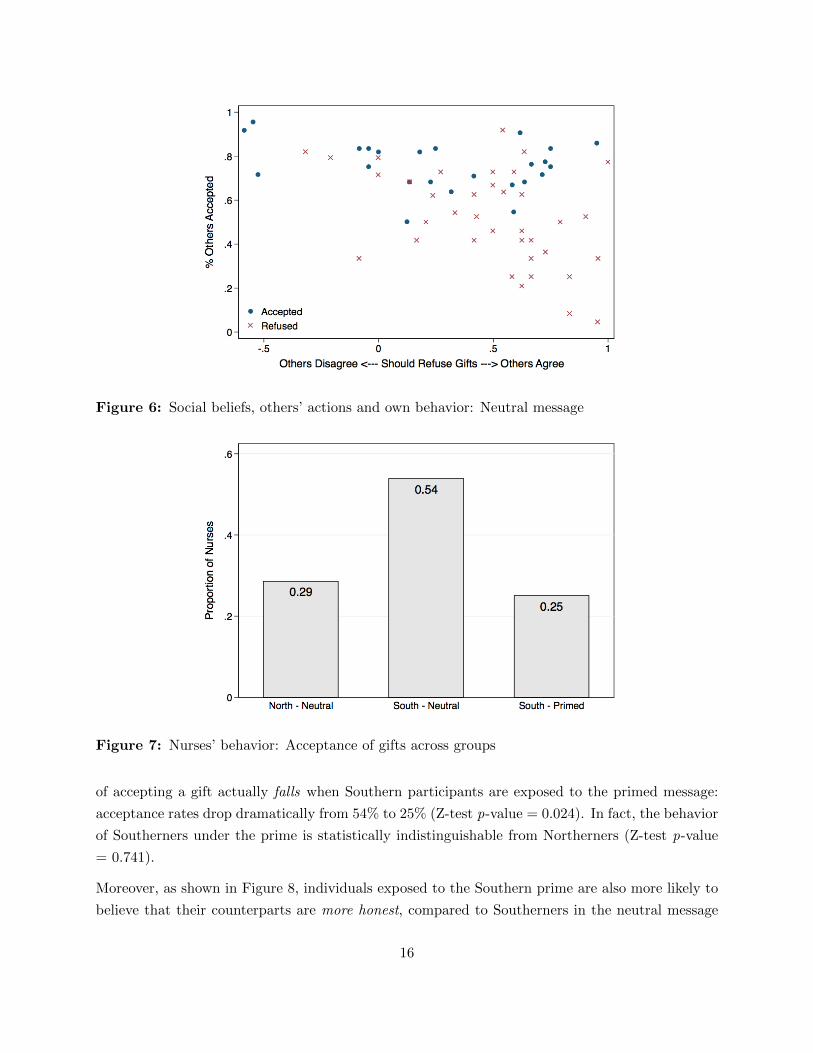
Figure 6: Social beliefs, others’ actions and own behavior: Neutral message
Figure 7: Nurses’ behavior: Acceptance of gifts across groups
of accepting a gift actually falls when Southern participants are exposed to the primed message:
acceptance rates drop dramatically from 54% to 25% (Z-test p-value = 0.024). In fact, the behavior
of Southerners under the prime is statistically indistinguishable from Northerners (Z-test p-value
= 0.741).
Moreover, as shown in Figure 8, individuals exposed to the Southern prime are also more likely to
believe that their counterparts are more honest, compared to Southerners in the neutral message
16

Figure 8: Change in BeliefAccepti across message conditions
condition. A Wilcoxon Rank-Sum test confirms that this difference is statistically significant around
the 5% level (p-value = 0.054). In summary, it appears that exposure to the primed message does
indeed alter collective beliefs and ‘tip’ group behavior, but these effects go in the opposite direction
to that predicted by H3 and H4 . In the next section, I present several conjectures that may
account for these counter-intuitive results.
Discussion
What social mechanisms may produce the surprising results we observe in response to the primed
message that ‘Most participants are from the South of Italy?’ Here, I consider three possible
explanations: (i) selection, (ii) in-group favoritism and (iii) social stigma. First, it may be the case
that the Southerners in this experiment constituted a self-selected sample: perhaps only Southerners
who are frustrated with corruption in their home regions migrate to the North. In response to the
Southern prime, these individuals then become especially scrupulous in their behavior. However, the
fact that Southern participants in the non-primed sessions behaved more corruptly than any group
in the experiment suggests that selection is unlikely to drive the messaging effects we observe.
A second possibility is that the messaging effects are attributable to in-group favoritism.13 Recall
that the structure of the corruption game represents a social dilemma: bribe-taking is individually
beneficial, but harmful to the group as a whole. Thus, when informed that they are interacting with
other members of their in-group, Southern participants may be more willing to engage in pro-social
behavior (here: not taking a bribe) as compared to a situation where they are interacting with
17
‘anonymous’ Italians. Furthermore, Southerners’ positive feelings towards their fellow Southerners
may also explain why BeliefAccept shifts in the direction of greater honesty between the neutral
and primed conditions.
A third possibility may be that Southerners, especially those living in the North of Italy, are all
too aware that they are looked down upon by their compatriots, in part because of their reputa-
tion for dishonesty. Such stigmatization may become especially salient in the context of a framed
Corruption Game in which Southerners are shown an explicit message priming their Southern iden-
tity. Consequently, Southern participants may attempt to rebel against these common stereotypes,
thereby trading off small monetary losses against significant gains in personal pride, as well as the
possibility of upgrading their social status.14 In other words, individuals may be willing to pay 6+
Tokens in order to state a defiant belief (‘We are not all corrupt!’) from which consistent behavior
(‘...and I’ll be honest to prove it to you!’) naturally follows. Such a dynamic may explain why we
observe a shift in both the probability of accepting a gift and in BeliefAccept between the neutral
and primed conditions.
External evidence consistent with this interpretation of the laboratory results can be found in
a historical case study of anti-corruption reform in early 20th century Boston. At the time, the
proliferation of electoral corruption was largely blamed on the voting patterns of immigrants, poorly
schooled in the responsible practice of democracy, whom many believed were firmly in the pockets
of corrupt machine bosses (Brownell, 1983; Cornwell, 1964; Huthmacher, 1962; Reid & Kurth,
1992). In order to escape this social stigma and prove themselves the political equals of Boston’s
native-born Anglo elite, the city’s Irish leaders organized their communities in a political fight
against patronage, bosses, and party machines (Connolly, 2009). To a large extent, this effort
was successful in shifting the Irish vote (particularly amongst these middle-classes) in favor of
Progressive municipal reforms.
Drawing from this experience, it is plausible that a similar reaction against social stigma may explain
our laboratory results. That said, I currently do not have the data to conclusively distinguish
the stigmatization hypothesis from in-group favoritism. I would argue, however, that pro-social
in-group feelings are unlikely to account for the experimental results. While norms of in-group
solidarity certainly prevail in the South of Italy, they exist primarily within closely-knit personal
circles (Banfield, 1958). In fact, Southerners are as likely to engage in rivalry with people from
other Southern regions as they are with Northerners, suggesting that no special pro-social feelings
are generated by simply knowing that others are from the South. On the other hand, since negative
stereotypes apply to all Southern regions, the uniform reaction of Southerners is more consistent
with the social stigma hypothesis. A formal test to disentangle these two explanations, however,
must unfortunately await a future date.
18
Conclusion
The general failure of formal, institutional-design-based approaches to reduce corruption has en-
gendered an updated understanding of corruption as primarily a cultural phenomenon (Andrews,
2013). This article, through the lens of a tipping model, provides a new perspective on the pro-
cesses underlying cultural stability and change. Rather than painting corrupt practices as legitimate
components of specific cultural repertoires, formal equilibrium theory understands cultures of cor-
ruption and honesty as the products of conditional choices, formulated in the shadow of shared
beliefs about the likely behavior of others. This approach implies that cultures are not static, im-
mutable, or hard-coded. Instead, when the collective beliefs of a society change, that society may
tip towards a new set of culturally-prescribed behaviors.
The experiments reported in this paper provide support for the behavioral mechanisms underlying
this tipping model. They also show that attempts to revise collective beliefs can produce some
surprising results: when informed that they are interacting with other Southern Italians, Southern
participants are not only more likely to believe that their counterparts are honest, but they are also
more likely to behave honestly themselves. I have discussed three possibilities that may explain
these counter-intuitive findings, although clearly more work needs to be done to understand the
mechanisms at work. Nevertheless, the fact that we can reduce levels of malfeasance by changing
beliefs suggests some exciting new possibilities for tackling entrenched cultures of corruption.
Appendix: Lottery task
Participants take part in a lottery game designed to measure their risk preferences (Eckel & Gross-
man, 2002, 2008). They are told that they must select one out of the 6 lotteries displayed in Table
4. Then the computer flips a fair coin. If the coin comes up heads, participants receive the high
payoff listed in the lefthand column. However, if the coin comes up tails, then participants receive
the low payoff listed in the righthand column. The average expected payoff increases as one moves
from lotteries 1 to 5, but the consequences of losing become more painful as well. Finally, there
is no difference in expected earnings between lotteries 5 and 6: the only difference is the variance
between high and low outcomes.
19

Table 4: Lottery game payoffs
Earnings if Earnings ifCoin = HEADS Coin = TAILS
Lotto I 17.5 17.5Lotto II 22.5 15.0Lotto III 27.5 12.5Lotto IV 32.5 10.0Lotto V 37.5 7.5Lotto VI 44.0 1.0
Table 5 gives the distribution of lotto choices by message condition. None of the differences is
statistically significant.
Table 5: Distribution of lottery choices
North-Neutral South-Neutral South-Primed TotalLottery Choice No. Percent No. Percent No. Percent No. Percent
Lotto I 2 5.7% 2 7.7% 2 6.2% 6 6.5%Lotto II 5 14.3% 6 23.1% 4 12.5% 15 16.1%Lotto III 9 25.7% 4 15.4% 5 15.6% 18 19.4%Lotto IV 8 22.9% 6 23.1% 14 43.8% 28 30.1%Lotto V 4 11.4% 3 11.5% 2 6.2% 9 9.7%Lotto VI 7 20.0% 5 19.2% 5 15.6% 17 18.3%
Total 35 100% 26 100% 32 100% 93 100%
Acknowledgements:
Many thanks to Giulia Andrighetto, Maria Bigoni, Stefania Bortolotti, Marco Casari, Diego Gam-
betta, Johanna Gereke, Judith Goldstein, Stephen Krasner, David Laitin, Hayagreeva Rao, and
participants at the SONIC, BEELab and UPenn PPE meetings for helpful suggestions and com-
ments. I also thank Gianandrea Lanzara and Stefano Rizzo for outstanding research assistance.
Finally, I gratefully acknowledge the generosity of Professor Marco Casari in allowing me access to
the Bologna Laboratory for Experiments in Social Science (BLESS). This work was supported by
the Stanford University Vice Provost for Graduate Education’s Graduate Research Opportunity
(GRO) Fund; and the Stanford University Freeman Spogli Institute (FSI) Global Underdevelop-
ment Action Fund.
20

Notes
1Even in the case of killing, the fact that homicide is permissible in a variety of situations - war, judicially-sanctioned
death penalties, honor killings - points to a formidable social component to our private morality.
2Although, as Heckathorn (1989) notes, there might exist a significant number of hypocritical punishers in society who
themselves cheat, but nonetheless police cheating on the part of others.
3For discussions of this phenomenon in other contexts, see Bicchieri & Xiao (2009); Fehr & Fischbacher (2005) and
Nannestad et al. (2014).
4Recent evidence from cognitive science supports our treating social rewards as complements to material benefits: fMRI
studies show that when individuals conform to injunctive norms (such as altruistic punishment or social cooperation),
this activates the same primary reward centers in the brain that are also triggered by the enjoyment of material benefits
(food, drink, money) (Mazar et al., 2008).
5The experiment was programmed in z-Tree (Fischbacher, 2007). All interactions take place via computer, and
participants sit in partitioned computer terminals to preserve their anonymity.
6This is the screen that participants see when the rules of the game are explained to them.
7The purpose of this feature is to simulate highly corrupt environments in real life where oversight agencies are often
ineffective.
870% of participants rated their understanding of the rules as 10 out of 10, and 95% rated their understanding as at
least 7 out of 10.
9There is no restriction that the answers to the A and B parts of each question add up to 100%, meaning participants
could have answered 100% for Agree and 100% for Disagree. In this case, the difference is again 0.
10Each session was actually designed for 24 individuals. However, half of these individuals were randomly chosen
to receive an experimental manipulation which is not relevant to this paper, but which caused them to play the
subsequent games differently (in other words, there is an interaction effect between the manipulation they received
and the treatment effects this paper examines). Therefore, I report only the results for the 12 individuals in each
session who did not receive this manipulation. However, in the description of the Corruption Game below, the
payoffs are designed with the full session of 24 individuals in mind. In addition, some participants were dropped from
this analysis because they were not Italian. Recruitment was conducted electronically through ORSEE (Greiner,
2004).
11I defined the ‘South’ to include the regions of Abruzzo, Basilicata, Calabria, Campania, Molise, Puglia and Sicilia.
All other regions are defined as ‘North.’ Definitions of South and North are extremely fluid in Italy, and often depend
on the group to which one makes a comparison. For example, Romans would consider their region ‘North-Central’
when interacting with Neapolitans, but few Milanese would consider Rome as belonging to the North. I chose my
list of Southern regions to include only those that can be classified incontrovertibly as being in the South.
12Another explanation for why we see no North-South gap in patients’ behavior may be that the roles of ‘early arriving’
and ‘late arriving’ patients were randomly assigned, and therefore held no emotional significance for participants.
By contrast, in a situation where participants believe that PEs actually deserve to be at the front of the line (for
example, imagine that PE and PL roles were assigned on the basis of performance in a real effort task), Northerners
may be more reluctant to try and skip the queue.
21
13Many thanks to Ryan Muldoon for alerting me to this possibility.
14For a discussion of this phenomenon in the context of military enlistment, see Petersen (1989).
References
Abbink K and Serra D (2012), Anticorruption Policies: Lessons from the Lab. In: Serra D &
Wantchekon L (eds) New Advances in Experimental Research on Corruption. Bingly: Emerald
Group Publishing, pp. 77–115.
Andrews M (2013), The Limits of Institutional Reform in Development. New York: Cambridge
University Press.
Andvig J and Moene K (1990), How Corruption May Corrupt. Journal of Economic Behavior &
Organization 13(1):63–76.
Ariely D (2013), The Honest Truth about Dishonesty: How We Lie to Everyone–Especially Our-
selves. New York: Harper.
Armantier O and Boly A (2013), Comparing Corruption in the Lab and in the Field in Burk-
ina Faso and in Canada. The Economic Journal. Epub ahead of print 2 April 2013. DOI:
10.1111/ecoj.12019.
Banfield E (1958), The Moral Basis of a Backward Society. Glencoe: Free Press.
Bardhan P (1997), Corruption and Development: A Review of Issues. Journal of Economic Liter-
ature 35(3):1320–1346.
Barr A and Serra D (2010), Corruption and Culture: An Experimental Analysis. Journal of Public
Economics 94(11):862–869.
Bicchieri C (2005), The Grammar of Society: The Nature and Dynamics of Social Norms. New
York: Cambridge University Press.
Bicchieri C and Xiao E (2009), Do the Right Thing: But Only if Others Do So. Journal of
Behavioral Decision Making 22(2):191–208.
Brownell B (1983), Interpretations of Twentieth-Century Urban Progressive Reform. In: Col-
burn DR & Pozzetta GE (eds) Reform and Reformers in the Progressive Era. Westport, Conn.:
Greenwood Press.
Cadot O (1987), Corruption as a Gamble. Journal of Public Economics 33(2):223–244.
22

Charron N, Dijkstra L and Lapuente V (2013a), Mapping the Regional Divide in Europe: A Measure
for Assessing Quality of Government in 206 European Regions. Social Indicators Research doi:
10.1007/s11205-014-0702-y.
Charron N, Dijkstra L and Lapuente V (2013b), Regional Governance Matters: Quality of Gov-
ernment within European Union Member States. Regional Studies 48(1):68–90.
Cialdini R, Reno R and Kallgren C (1990), A Focus Theory of Normative Conduct: Recycling
the Concept of Norms to Reduce Littering in Public Places. Journal of Personality and Social
Psychology 58(6):1015–1026.
Connolly J (2009), The Triumph of Ethnic Progressivism: Urban Political Culture in Boston, 1900-
1925. Cambridge, Mass.: Harvard University Press.
Cornwell E (1964), Bosses, Machines, and Ethnic Groups. The Annals of the American Academy
of Political and Social Science 353(1):27–39.
Della Porta D and Vannucci A (1999), Corrupt Exchanges: Actors, Resources, and Mechanisms of
Political Corruption. New York: Aldine de Gruyter.
Eckel C and Grossman P (2002), Sex Differences and Statistical Stereotyping in Attitudes Toward
Financial Risk. Evolution and Human Behavior 23(4):281–295.
Eckel C and Grossman P (2008), Forecasting Risk Attitudes: An Experimental Study using Actual
and Forecast Gamble Choices. Journal of Economic Behavior & Organization 68(1):1–17.
Ekeh P (1975), Colonialism and the Two Publics in Africa: A Theoretical Statement. Comparative
Studies in Society and History 17(1):91–112.
Elster J (1989), Nuts and Bolts for the Social Sciences. New York: Cambridge University Press.
Englebert P (2009), Africa: Unity, Sovereignty, and Sorrow. Boulder, Colorado: Lynne Rienner
Publishers.
Fehr E and Fischbacher U (2005), The Economics of Strong Reciprocity. In: Gintis H, Bowles S,
& Fehr E (eds) Moral Sentiments and Material Interests. The Foundations for Cooperation in
Economic Life. Cambridge, Mass.: The MIT Press, pp. 151–193.
Fischbacher U (2007), z-Tree: Zurich Toolbox for Ready-made Economic Experiments. Experimen-
tal Economics 10(2):171–178.
Fisman R and Miguel E (2007), Corruption, Norms, and Legal Enforcement: Evidence from Diplo-
matic Parking Tickets. Journal of Political Economy 115(6):1020–1048.
23
Gambetta D (2013), Why is Italy so Disproportionately Corrupt? A Conjecture. Keynote Address
delivered at the second Anticorrp General Meeting: European University Institute, San Domenico
di Fiesole, Italy, 8 May 2013.
Golden M and Chang E (2001), Competitive Corruption: Factional Conflict and Political Malfea-
sance in Postwar Italian Christian Democracy. World Politics 53:588–622.
Golden M and Picci L (2005), Proposal for a New Measure of Corruption, Illustrated with Italian
Data. Economics & Politics 17(1):37–75.
Greiner B (2004), The Online Recruitment System ORSEE 2.0 - A Guide for the Organization of
Experiments in Economics. University of Cologne Working Paper Series in Economics 10(23):63–
104.
Heckathorn D (1989), Collective Action and the Second-Order Free-Rider Problem. Rationality
and Society 1(1):78–100.
Husted B (1999), Wealth, Culture, and Corruption. Journal of International Business Studies
30(2):339–359.
Huthmacher J (1962), Urban Liberalism and the Age of Reform. The Mississippi Valley Historical
Review 49(2):231–241.
Klitgaard R (1988), Controlling Corruption. Berkeley, CA: University of California Press.
Laitin D (1998), Identity in Formation: The Russian-speaking Populations in the Near Abroad.
Ithaca, NY: Cornell University Press.
Laitin D (2007), Nations, States, and Violence. New York: Oxford University Press.
Laitin D and Zhang N (2012), Political Culture. In: Krieger J (ed) The Oxford Companion to
Comparative Politics. Oxford University Press, pp. 223–227.
Licht A, Goldschmidt C and Schwartz S (2007), Culture Rules: The Foundations of the Rule of
Law and Other Norms of Governance. Journal of Comparative Economics 35(4):659–688.
Lipset SM and Lenz GS (2000), Corruption, Culture, and Markets. In: Harrison L & Huntington
S (eds) Culture Matters: How Values Shape Human Progress. New York: Basic Books.
Lui F (1986), A Dynamic Model of Corruption Deterrence. Journal of Public Economics 31(2):215–
236.
Mackie G (1996), Ending Footbinding and Infibulation: A Convention Account. American Socio-
logical Review 61(6):999–1017.
24
Mazar N, Amir O and Ariely D (2008), The Dishonesty of Honest People: A Theory of Self-concept
Maintenance. Journal of Marketing Research 45(6):633–644.
Miller W (2006), Corruption and Corruptibility. World Development 34(2):371–380.
Nannestad P, Svendsen GT, Dinesen PT and Sønderskov KM (2014), Do Institutions or Culture
Determine the Level of Social Trust? The Natural Experiment of Migration from Non-Western
to Western Countries. Journal of Ethnic and Migration Studies 40(4):544–565.
Olivier De Sardan JP (1999), A Moral Economy of Corruption in Africa? The Journal of Modern
African Studies 37(1):25–52.
Persson A, Rothstein B and Teorell J (2013), Why Anticorruption Reforms Fail: Systemic Corrup-
tion as a Collective Action Problem. Governance 26(3):449–471.
Petersen R (1989), Rationality, Ethnicity and Military Enlistment. Social Science Information
28(3):563–598.
Price R (1974), Politics and Culture in Contemporary Ghana: The Big-Man Small-Boy Syndrome.
Journal of African Studies 1(2):173–204.
Putnam R (1993), Making Democracy Work: Civic Traditions in Modern Italy. Princeton: Prince-
ton University Press.
Reid J and Kurth M (1992), The Rise and Fall of Urban Political Patronage Machines. In: Goldin
C & Rockoff H (eds) Strategic Factors in Nineteenth Century American Economic History: A
Volume to Honor Robert W. Fogel. University of Chicago Press, pp. 427–445.
Rose-Ackerman S (1999), Corruption and Government: Causes, Consequences, and Reform. New
York: Cambridge University Press.
Rothstein B and Torsello D (2014), Bribery in Pre-Industrial Societies: Understanding the
Universalism-Particularism Puzzle. Journal of Anthropological Research 70(2):263–288.
Schelling T (1978), Micromotives and Macrobehavior. New York: Norton.
Sunstein C (1996), Social Norms and Social Roles. Columbia Law Review 96(4):903–968.
25