chapter 1 what is statistic
DESCRIPTION
Statistics Techniques in Business and Economics 11 edtionTRANSCRIPT

GoalsWhen you have completedthis chapter, you will beable to:
1 Organize data into a fre-quency distribution.
2 Portray a frequency distribu-tion in a histogram, frequencypolygon, and cumulative fre-quency polygon.
3 Present data using suchgraphical techniques as linecharts, bar charts, and piecharts.FPO
1Learning ObjectivesWhen you have completedthis chapter, you will beable to:
LO1 List ways that statisticsis used.
LO2 Know the differencesbetween descriptive andinferential statistics.
LO3 Understand the differ-ences between a sample and apopulation.
LO4 Explain the differencebetween qualitative and quan-titative variables.
LO5 Compare the differencesbetween discrete and continu-ous variables.
LO6 Recognize the levels ofmeasurement in data.
What Is Statistics?
Barnes & Noble stores recently began selling the Nook. With this
device, you can download over 1,500 books electronically and read
the book on a small monitor instead of purchasing the book. Assume
you have the number of Nooks sold each day for the last month at the
Barnes & Noble store at the Market Commons Mall in Riverside,
California. Describe a condition in which this information could be
considered a sample. Illustrate a second situation in which the same
data would be regarded as a population. (See Exercise 11 and LO3.)
Lin01803_ch01_001-020.qxd 9/17/10 9:16 AM Page 1
2 Chapter 1
1.1 IntroductionMore than 100 years ago, H. G. Wells, an English author and historian, suggestedthat one day quantitative reasoning will be as necessary for effective citizenship asthe ability to read. He made no mention of business because the Industrial Revo-lution was just beginning. Mr. Wells could not have been more correct. While “busi-
ness experience,” some “thoughtful guesswork,” and “intuition” are keyattributes of successful managers, today’s business problems tend tobe too complex for this type of decision making alone.
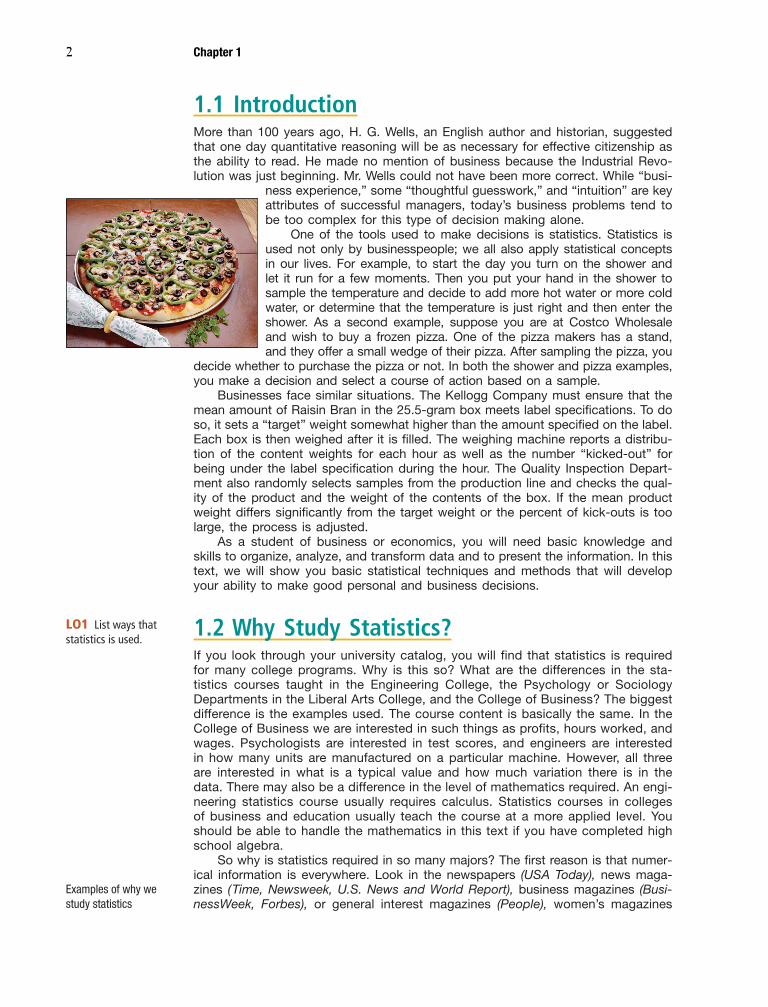
One of the tools used to make decisions is statistics. Statistics isused not only by businesspeople; we all also apply statistical conceptsin our lives. For example, to start the day you turn on the shower andlet it run for a few moments. Then you put your hand in the shower tosample the temperature and decide to add more hot water or more coldwater, or determine that the temperature is just right and then enter theshower. As a second example, suppose you are at Costco Wholesaleand wish to buy a frozen pizza. One of the pizza makers has a stand,and they offer a small wedge of their pizza. After sampling the pizza, you
decide whether to purchase the pizza or not. In both the shower and pizza examples,you make a decision and select a course of action based on a sample.
Businesses face similar situations. The Kellogg Company must ensure that themean amount of Raisin Bran in the 25.5-gram box meets label specifications. To doso, it sets a “target” weight somewhat higher than the amount specified on the label.Each box is then weighed after it is filled. The weighing machine reports a distribu-tion of the content weights for each hour as well as the number “kicked-out” forbeing under the label specification during the hour. The Quality Inspection Depart-ment also randomly selects samples from the production line and checks the qual-ity of the product and the weight of the contents of the box. If the mean productweight differs significantly from the target weight or the percent of kick-outs is toolarge, the process is adjusted.
As a student of business or economics, you will need basic knowledge andskills to organize, analyze, and transform data and to present the information. In thistext, we will show you basic statistical techniques and methods that will developyour ability to make good personal and business decisions.
1.2 Why Study Statistics?If you look through your university catalog, you will find that statistics is requiredfor many college programs. Why is this so? What are the differences in the sta-tistics courses taught in the Engineering College, the Psychology or SociologyDepartments in the Liberal Arts College, and the College of Business? The biggestdifference is the examples used. The course content is basically the same. In theCollege of Business we are interested in such things as profits, hours worked, andwages. Psychologists are interested in test scores, and engineers are interestedin how many units are manufactured on a particular machine. However, all threeare interested in what is a typical value and how much variation there is in thedata. There may also be a difference in the level of mathematics required. An engi-neering statistics course usually requires calculus. Statistics courses in collegesof business and education usually teach the course at a more applied level. Youshould be able to handle the mathematics in this text if you have completed highschool algebra.
So why is statistics required in so many majors? The first reason is that numer-ical information is everywhere. Look in the newspapers (USA Today), news maga-zines (Time, Newsweek, U.S. News and World Report), business magazines (Busi-nessWeek, Forbes), or general interest magazines (People), women’s magazines
Examples of why westudy statistics
LO1 List ways thatstatistics is used.
Lin01803_ch01_001-020.qxd 9/17/10 9:16 AM Page 2
What Is Statistics? 3
(Ladies Home Journal or Elle), or sports magazines (Sports Illustrated, ESPN TheMagazine), and you will be bombarded with numerical information.
Here are some examples:
• The average increase in weekly earnings, in 1982–84 dollars, from January 2009to January 2010 was $8.32.
• In January 2010 the average amount of credit card debt per household was$7,394. This is a decrease from $7,801 in July 2009. A 2010 Federal Reservesurvey found that 75 percent of U.S. households have at least one credit card.
• The following table summarizes the number of commercial aircraft manufacturedby Boeing, Inc. between 2006 and 2009.
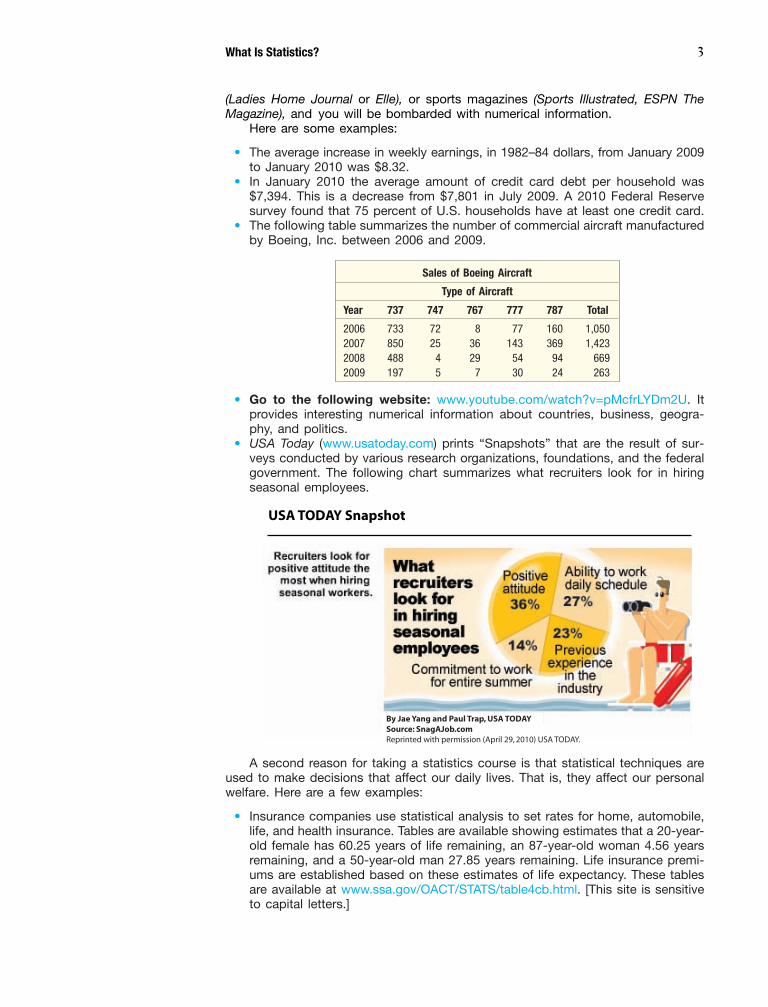
USA TODAY Snapshot
By Jae Yang and Paul Trap, USA TODAY
Source: SnagAJob.com
Reprinted with permission (April 29, 2010) USA TODAY.
Sales of Boeing Aircraft
Type of Aircraft
Year 737 747 767 777 787 Total
2006 733 72 8 77 160 1,0502007 850 25 36 143 369 1,4232008 488 4 29 54 94 6692009 197 5 7 30 24 263
• Go to the following website: www.youtube.com/watch?v=pMcfrLYDm2U. Itprovides interesting numerical information about countries, business, geogra-phy, and politics.
• USA Today (www.usatoday.com) prints “Snapshots” that are the result of sur-veys conducted by various research organizations, foundations, and the federalgovernment. The following chart summarizes what recruiters look for in hiringseasonal employees.
A second reason for taking a statistics course is that statistical techniques areused to make decisions that affect our daily lives. That is, they affect our personalwelfare. Here are a few examples:
• Insurance companies use statistical analysis to set rates for home, automobile,life, and health insurance. Tables are available showing estimates that a 20-year-old female has 60.25 years of life remaining, an 87-year-old woman 4.56 yearsremaining, and a 50-year-old man 27.85 years remaining. Life insurance premi-ums are established based on these estimates of life expectancy. These tablesare available at www.ssa.gov/OACT/STATS/table4cb.html. [This site is sensitiveto capital letters.]
Lin01803_ch01_001-020.qxd 9/24/10 4:42 PM Page 3
• The Environmental Protection Agency is interested in the water quality of LakeErie as well as other lakes. They periodically take water samples to establishthe level of contamination and maintain the level of quality.
• Medical researchers study the cure rates for diseases using different drugs anddifferent forms of treatment. For example, what is the effect of treating a cer-tain type of knee injury surgically or with physical therapy? If you take an aspirineach day, does that reduce your risk of a heart attack?
A third reason for taking a statistics course is that the knowledge of statisticalmethods will help you understand how decisions are made and give you a betterunderstanding of how they affect you.
No matter what line of work you select, you will find yourself faced with deci-sions where an understanding of data analysis is helpful. In order to make aninformed decision, you will need to be able to:
1. Determine whether the existing information is adequate or additional informa-tion is required.
2. Gather additional information, if it is needed, in such a way that it does not pro-vide misleading results.
3. Summarize the information in a useful and informative manner.4. Analyze the available information.5. Draw conclusions and make inferences while assessing the risk of an incorrect
conclusion.
The statistical methods presented in the text will provide you with a frameworkfor the decision-making process.
In summary, there are at least three reasons for studying statistics: (1) data areeverywhere, (2) statistical techniques are used to make many decisions that affectour lives, and (3) no matter what your career, you will make professional decisionsthat involve data. An understanding of statistical methods will help you make thesedecisions more effectively.
1.3 What Is Meant by Statistics?How do we define the word statistics? We encounter it frequently in our everydaylanguage. It really has two meanings. In the more common usage, statistics refersto numerical information. Examples include the average starting salary of collegegraduates, the number of deaths due to alcoholism last year, the change in the DowJones Industrial Average from yesterday to today, and the number of home runs hitby the Chicago Cubs during the 2010 season. In these examples, statistics are avalue or a percentage. Other examples include:
• The typical automobile in the United States travels 11,099 miles per year, thetypical bus 9,353 miles per year, and the typical truck 13,942 miles per year.In Canada, the corresponding information is 10,371 miles for automobiles,19,823 miles for buses, and 7,001 miles for trucks.
• The mean time waiting for technical support is 17 minutes.• The mean length of the business cycle since 1945 is 61 months.
The above are all examples of statistics. A collection of numerical information iscalled statistics (plural).
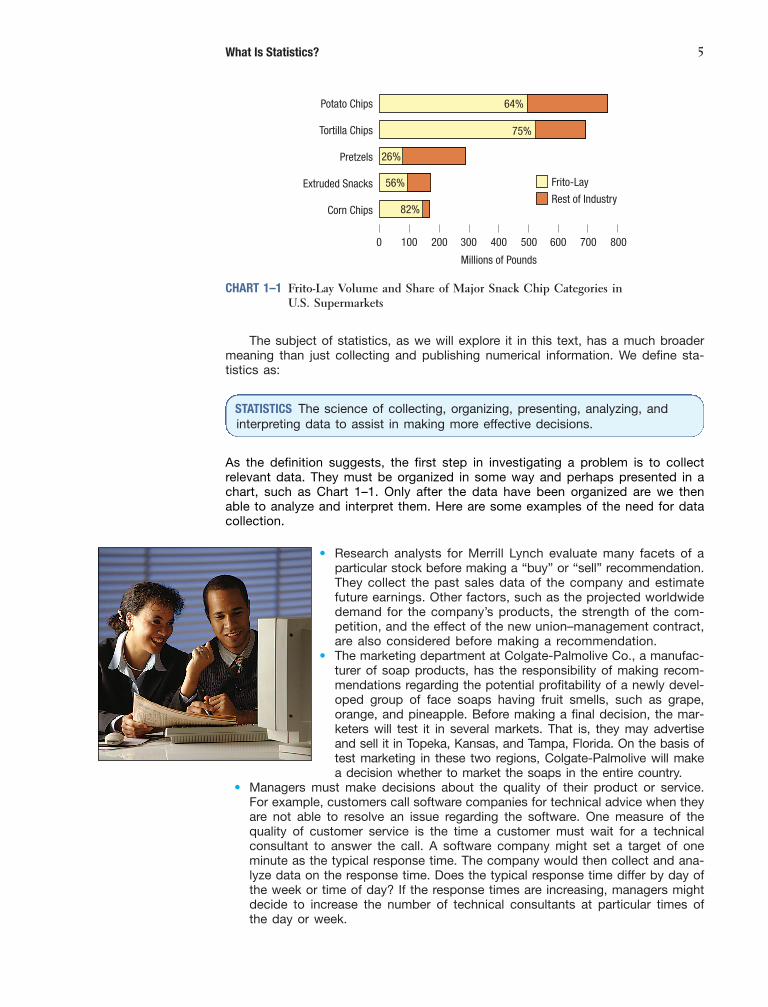
We frequently present statistical information in a graphical form. A graph is oftenuseful for capturing reader attention and to portray a large amount of information.For example, Chart 1–1 shows Frito-Lay volume and market share for the majorsnack and potato chip categories in supermarkets in the United States. It requiresonly a quick glance to discover there were nearly 800 million pounds of potatochips sold and that Frito-Lay sold 64 percent of that total. Also note that Frito-Layhas 82 percent of the corn chip market.
4 Chapter 1
Statistics in Action
We call your atten-tion to a featuretitle—Statistics inAction. Read eachone carefully to getan appreciation ofthe wide applicationof statistics in man-agement, economics,nursing, law enforce-ment, sports, andother disciplines.
• In 2009, Forbespublished a list ofthe richest Ameri-cans. WilliamGates, founder ofMicrosoft Corpo-ration, is the rich-est. His net worthis estimated at$59.0 billion.(www.forbes.com)
• In 2009, the fourlargest Americancompanies, rankedby revenue, wereWalmart, Exxon-Mobil, Chevron,and General Electric. (www.forbes.com)
• In the UnitedStates, a typicalhigh school gradu-ate earns $1.2 mil-lion in his or herlifetime, a typicalcollege graduatewith a bachelor’sdegree earns$2.1 million, anda typical collegegraduate with amaster’s degreeearns $2.5 million.(usgovinfo.about.com/library/weekly/aa072602a.htm)
Lin01803_ch01_001-020.qxd 9/17/10 9:17 AM Page 4
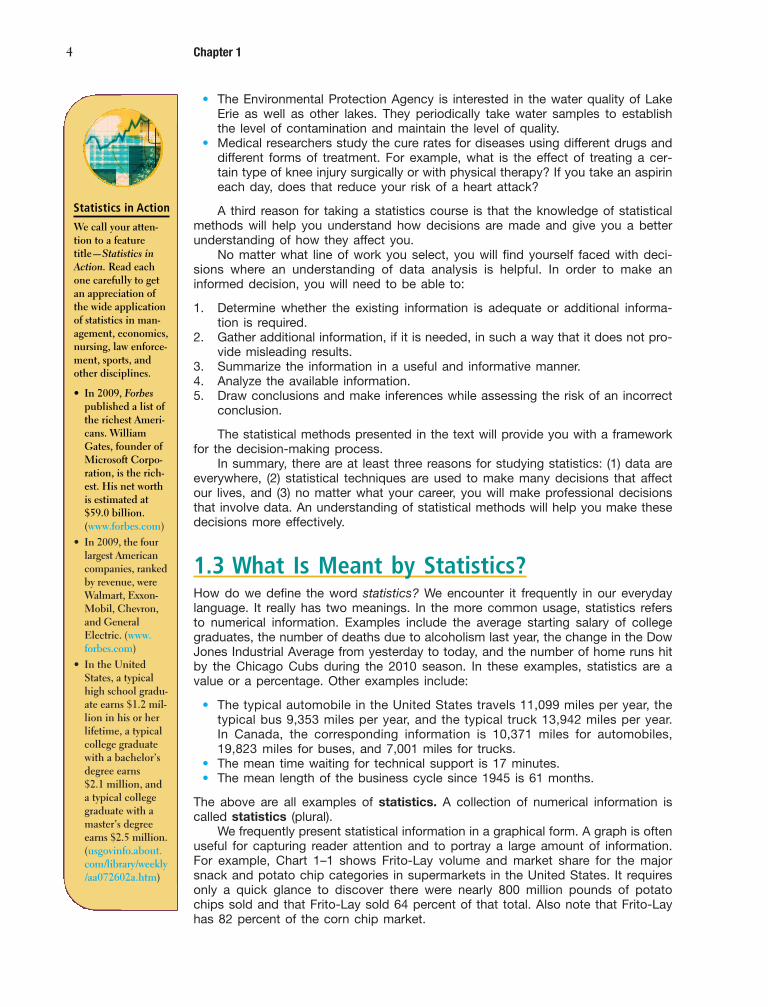
• Research analysts for Merrill Lynch evaluate many facets of aparticular stock before making a “buy” or “sell” recommendation.They collect the past sales data of the company and estimatefuture earnings. Other factors, such as the projected worldwidedemand for the company’s products, the strength of the com-petition, and the effect of the new union–management contract,are also considered before making a recommendation.
• The marketing department at Colgate-Palmolive Co., a manufac-turer of soap products, has the responsibility of making recom-mendations regarding the potential profitability of a newly devel-oped group of face soaps having fruit smells, such as grape,orange, and pineapple. Before making a final decision, the mar-keters will test it in several markets. That is, they may advertiseand sell it in Topeka, Kansas, and Tampa, Florida. On the basis oftest marketing in these two regions, Colgate-Palmolive will makea decision whether to market the soaps in the entire country.
• Managers must make decisions about the quality of their product or service.For example, customers call software companies for technical advice when theyare not able to resolve an issue regarding the software. One measure of thequality of customer service is the time a customer must wait for a technicalconsultant to answer the call. A software company might set a target of oneminute as the typical response time. The company would then collect and ana-lyze data on the response time. Does the typical response time differ by day ofthe week or time of day? If the response times are increasing, managers mightdecide to increase the number of technical consultants at particular times ofthe day or week.
What Is Statistics? 5
STATISTICS The science of collecting, organizing, presenting, analyzing, andinterpreting data to assist in making more effective decisions.
As the definition suggests, the first step in investigating a problem is to collectrelevant data. They must be organized in some way and perhaps presented in achart, such as Chart 1–1. Only after the data have been organized are we thenable to analyze and interpret them. Here are some examples of the need for datacollection.
Frito-Lay
Rest of Industry
0 100 200 300 400
Millions of Pounds
500 600 700 800
Potato Chips
Tortilla Chips
Pretzels
Extruded Snacks
Corn Chips
64%
75%
26%
56%
82%
CHART 1–1 Frito-Lay Volume and Share of Major Snack Chip Categories inU.S. Supermarkets
The subject of statistics, as we will explore it in this text, has a much broadermeaning than just collecting and publishing numerical information. We define sta-tistics as:
Lin01803_ch01_001-020.qxd 8/27/10 2:38 PM Page 5
6 Chapter 1
1.4 Types of StatisticsThe study of statistics is usually divided into two categories: descriptive statisticsand inferential statistics.
Descriptive StatisticsThe definition of statistics given earlier referred to “organizing, presenting, analyz-ing . . . data.” This facet of statistics is usually referred to as descriptive statistics.
DESCRIPTIVE STATISTICS Methods of organizing, summarizing, and presentingdata in an informative way.
For instance, the United States government reports the population of the UnitedStates was 179,323,000 in 1960; 203,302,000 in 1970; 226,542,000 in 1980;248,709,000 in 1990; 265,000,000 in 2000; and 308,400,000 in 2010. This informa-tion is descriptive statistics. It is descriptive statistics if we calculate the percent-age growth from one decade to the next. However, it would not be descriptive sta-tistics if we used these to estimate the population of the United States in the year2020 or the percentage growth from 2010 to 2020. Why? The reason is these sta-tistics are not being used to summarize past populations but to estimate future pop-ulations. The following are some other examples of descriptive statistics.
• There are a total of 46,837 miles of interstate highways in the United States.The interstate system represents only 1 percent of the nation’s total roads butcarries more than 20 percent of the traffic. The longest is I-90, which stretchesfrom Boston to Seattle, a distance of 3,099 miles. The shortest is I-878 in NewYork City, which is 0.70 of a mile in length. Alaska does not have any interstatehighways, Texas has the most interstate miles at 3,232, and New York has themost interstate routes with 28.
• The average person spent $103.00 on traditional Valentine’s Day merchandisein 2010. This is an increase of $0.50 from 2009. As in previous years, men willspend nearly twice the amount women spend on the holiday. The average manspent $135.35 to impress the people in his life while women only spent $72.28.Family pets will also feel the love, the average person spending $3.27 on theirfurry friends, up from $2.17 last year.
Masses of unorganized data—such as the census of population, the weeklyearnings of thousands of computer programmers, and the individual responses of2,000 registered voters regarding their choice for president of the United States—are of little value as is. However, statistical techniques are available to organize thistype of data into a meaningful form. Data can be organized into a frequency dis-tribution. (This procedure is covered in Chapter 2.) Various charts may be used todescribe data; several basic chart forms are also presented in Chapter 4.
Specific measures of central location, such as the mean, describe the centralvalue of a group of numerical data. A number of statistical measures are used todescribe how closely the data cluster about an average. These measures of centraltendency and dispersion are discussed in Chapter 3.
Inferential StatisticsThe second type of statistics is inferential statistics—also called statistical infer-ence. Our main concern regarding inferential statistics is finding something about apopulation from a sample taken from that population. For example, a recent surveyshowed only 46 percent of high school seniors can solve problems involving fractions,
LO2 Know thedifferences betweendescriptive andinferential statistics.
Lin01803_ch01_001-020.qxd 8/26/10 2:08 PM Page 6
What Is Statistics? 7
decimals, and percentages; and only 77 percent of high school seniors correctlytotaled the cost of a salad, burger, fries, and a cola on a restaurant menu. Since theseare inferences about a population (all high school seniors) based on sample data, werefer to them as inferential statistics. You might think of inferential statistics as a “bestguess” of a population value based on sample information.
INFERENTIAL STATISTICS The methods used to estimate a property of a populationon the basis of a sample.
SAMPLE A portion, or part, of the population of interest.
POPULATION The entire set of individuals or objects of interest or the measurements obtained from all individuals or objects of interest.
Note the words population and sample in the definition of inferential statistics. Weoften make reference to the population of 308.8 million people living in the United Statesor the 1,336.1 million people living in China. However, in statistics the word populationhas a broader meaning. A population may consist of individuals—such as all the stu-dents enrolled at Utah State University, all the students in Accounting 201, or all theCEOs from the Fortune 500 companies. A population may also consist of objects, suchas all the Cobra G/T tires produced at Cooper Tire and Rubber Company in the Find-lay, Ohio, plant; the accounts receivable at the end of October for Lorrange Plastics,Inc.; or auto claims filed in the first quarter of 2010 at the Northeast Regional Office ofState Farm Insurance. The measurement of interest might be the scores on the firstexamination of all students in Accounting 201, the tread wear of the Cooper Tires, thedollar amount of Lorrange Plastics’s accounts receivable, or the amount of auto insur-ance claims at State Farm. Thus, a population in the statistical sense does not alwaysrefer to people.
To infer something about a population, we usually take a sample from thepopulation.
Why take a sample instead of studying every member of the population? A sam-ple of registered voters is necessary because of the prohibitive cost of contactingmillions of voters before an election. Testing wheat for moisture content destroysthe wheat, thus making a sample imperative. If the wine tasters tested all the wine,none would be available for sale. It would be physically impossible for a few marinebiologists to capture and tag all the seals in the ocean. (These and other reasonsfor sampling are discussed in Chapter 8.)
As noted, using a sample to learn something about a population is done exten-sively in business, agriculture, politics, and government, as cited in the followingexamples:
• Television networks constantly monitor the popularity of their programs by hir-ing Nielsen and other organizations to sample the preferences of TV viewers.For example, in a sample of 800 prime-time viewers, 320, or 40 percent, indi-cated they watched American Idol on Fox last week. These program ratings areused to set advertising rates or to cancel programs.
• Gamous and Associates, a public accounting firm, is conducting an audit ofPronto Printing Company. To begin, the accounting firm selects a random sam-ple of 100 invoices and checks each invoice for accuracy. There is at least oneerror on five of the invoices; hence the accounting firm estimates that 5 per-cent of the population of invoices contain at least one error.
Reasons for sampling
LO3 Understand thedifferences between asample and apopulation.
Lin01803_ch01_001-020.qxd 9/17/10 9:17 AM Page 7
1.5 Types of VariablesThere are two basic types of variables: (1) qualitative and (2) quantitative (see Chart1–2). When the characteristic being studied is nonnumeric, it is called a qualita-tive variable or an attribute. Examples of qualitative variables are gender, religiousaffiliation, type of automobile owned, state of birth, and eye color. When the dataare qualitative, we are usually interested in how many or what percent fall in eachcategory. For example, what percent of the population has blue eyes? What per-cent of the total number of cars sold last month were SUVs? Qualitative data areoften summarized in charts and bar graphs (Chapter 2).
8 Chapter 1
• A random sample of 1,260 marketing graduates from four-year schoolsshowed their mean starting salary was $42,694. We therefore estimate themean starting salary for all marketing graduates of four-year institutions to be$42,694.
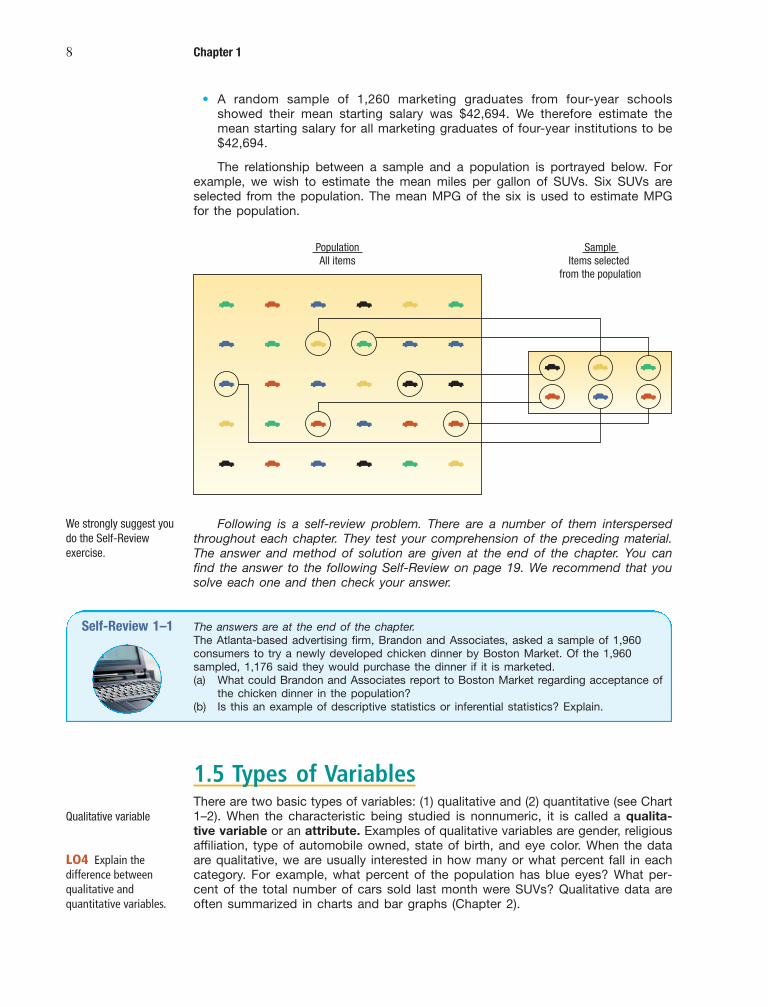
The relationship between a sample and a population is portrayed below. Forexample, we wish to estimate the mean miles per gallon of SUVs. Six SUVs areselected from the population. The mean MPG of the six is used to estimate MPGfor the population.
PopulationAll items
SampleItems selected
from the population
Following is a self-review problem. There are a number of them interspersedthroughout each chapter. They test your comprehension of the preceding material.The answer and method of solution are given at the end of the chapter. You canfind the answer to the following Self-Review on page 19. We recommend that yousolve each one and then check your answer.
We strongly suggest youdo the Self-Reviewexercise.
Self-Review 1–1 The answers are at the end of the chapter.The Atlanta-based advertising firm, Brandon and Associates, asked a sample of 1,960consumers to try a newly developed chicken dinner by Boston Market. Of the 1,960sampled, 1,176 said they would purchase the dinner if it is marketed.(a) What could Brandon and Associates report to Boston Market regarding acceptance of
the chicken dinner in the population?(b) Is this an example of descriptive statistics or inferential statistics? Explain.
Qualitative variable
LO4 Explain thedifference betweenqualitative andquantitative variables.
Lin01803_ch01_001-020.qxd 8/26/10 2:08 PM Page 8

What Is Statistics? 9
Quantitative variable
Types of Variables
Qualitative Quantitative
ContinuousDiscrete• Brand of PC• Marital status• Hair color
• Children in a family• Strokes on a golf hole• TV sets owned
• Amount of income tax paid• Weight of a student• Yearly rainfall in Tampa, FL
CHART 1–2 Summary of the Types of Variables
When the variable studied can be reported numerically, the variable is called aquantitative variable. Examples of quantitative variables are the balance in yourchecking account, the ages of company presidents, the life of an automobile bat-tery (such as 42 months), and the number of children in a family.
Quantitative variables are either discrete or continuous. Discrete variables canassume only certain values, and there are “gaps” between the values. Examples ofdiscrete variables are the number of bedrooms in a house (1, 2, 3, 4, etc.), the num-ber of cars arriving at Exit 25 on I-4 in Florida near Walt Disney World in an hour(326, 421, etc.), and the number of students in each section of a statistics course(25 in section A, 42 in section B, and 18 in section C). We count, for example, thenumber of cars arriving at Exit 25 on I-4, and we count the number of statistics stu-dents in each section. Notice that a home can have 3 or 4 bedrooms, but it can-not have 3.56 bedrooms. Thus, there is a “gap” between possible values. Typically,discrete variables result from counting.
Observations of a continuous variable can assume any value within a specificrange. Examples of continuous variables are the air pressure in a tire and the weightof a shipment of tomatoes. Other examples are the amount of raisin bran in a boxand the duration of flights from Orlando to San Diego. Grade point average (GPA)is a continuous variable. We could report the GPA of a particular student as3.2576952. The usual practice is to round to 3 places—3.258. Typically, continuousvariables result from measuring.
1.6 Levels of MeasurementData can be classified according to levels of measurement. Thelevel of measurement of the data dictates the calculations thatcan be done to summarize and present the data. It will also deter-mine the statistical tests that should be performed. For example,there are six colors of candies in a bag of M&M’s. Suppose weassign brown a value of 1, yellow 2, blue 3, orange 4, green 5,and red 6. From a bag of candies, we add the assigned color val-ues and divide by the number of candies and report that the meancolor is 3.56. Does this mean that the average color is blue ororange? Of course not! As a second example, in a high schooltrack meet there are eight competitors in the 400-meter run. We
LO5 Compare thedifferences betweendiscrete and continuousvariables.
LO6 Recognize thelevels of measurementin data.
Lin01803_ch01_001-020.qxd 9/17/10 9:17 AM Page 9
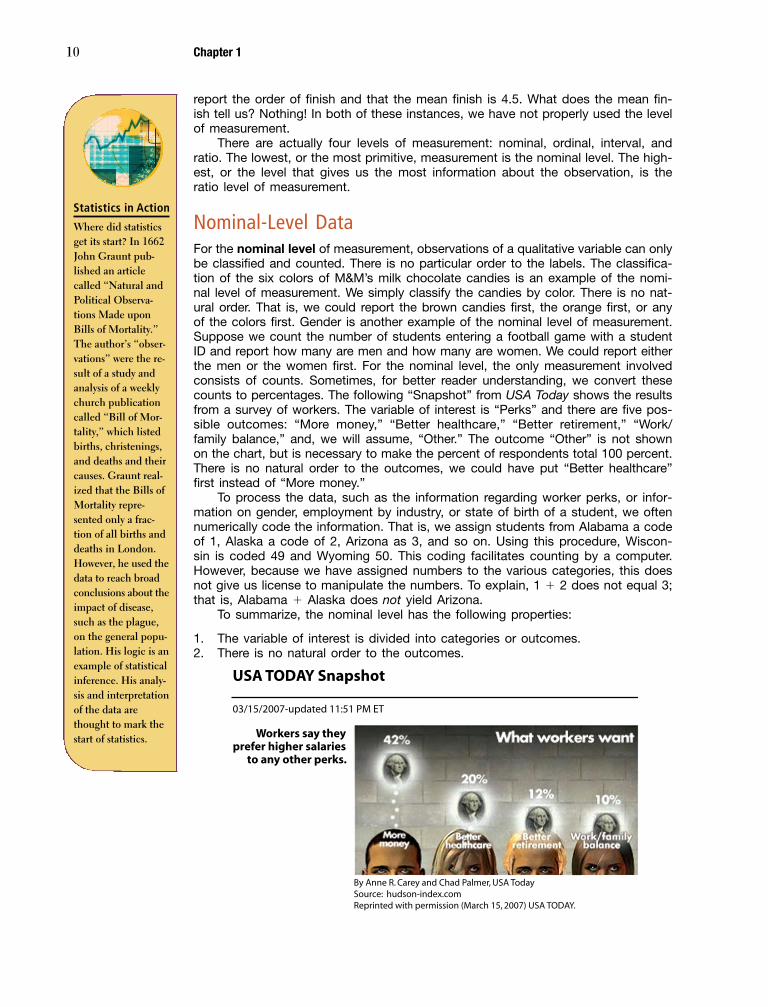
USA TODAY Snapshot
03/15/2007-updated 11:51 PM ET
Workers say theyprefer higher salaries
to any other perks.
By Anne R. Carey and Chad Palmer, USA TodaySource: hudson-index.comReprinted with permission (March 15, 2007) USA TODAY.
10 Chapter 1
report the order of finish and that the mean finish is 4.5. What does the mean fin-ish tell us? Nothing! In both of these instances, we have not properly used the levelof measurement.
There are actually four levels of measurement: nominal, ordinal, interval, andratio. The lowest, or the most primitive, measurement is the nominal level. The high-est, or the level that gives us the most information about the observation, is theratio level of measurement.
Nominal-Level DataFor the nominal level of measurement, observations of a qualitative variable can onlybe classified and counted. There is no particular order to the labels. The classifica-tion of the six colors of M&M’s milk chocolate candies is an example of the nomi-nal level of measurement. We simply classify the candies by color. There is no nat-ural order. That is, we could report the brown candies first, the orange first, or anyof the colors first. Gender is another example of the nominal level of measurement.Suppose we count the number of students entering a football game with a studentID and report how many are men and how many are women. We could report eitherthe men or the women first. For the nominal level, the only measurement involvedconsists of counts. Sometimes, for better reader understanding, we convert thesecounts to percentages. The following “Snapshot” from USA Today shows the resultsfrom a survey of workers. The variable of interest is “Perks” and there are five pos-sible outcomes: “More money,” “Better healthcare,” “Better retirement,” “Work/family balance,” and, we will assume, “Other.” The outcome “Other” is not shownon the chart, but is necessary to make the percent of respondents total 100 percent.There is no natural order to the outcomes, we could have put “Better healthcare”first instead of “More money.”
To process the data, such as the information regarding worker perks, or infor-mation on gender, employment by industry, or state of birth of a student, we oftennumerically code the information. That is, we assign students from Alabama a codeof 1, Alaska a code of 2, Arizona as 3, and so on. Using this procedure, Wiscon-sin is coded 49 and Wyoming 50. This coding facilitates counting by a computer.However, because we have assigned numbers to the various categories, this doesnot give us license to manipulate the numbers. To explain, 1 � 2 does not equal 3;that is, Alabama � Alaska does not yield Arizona.
To summarize, the nominal level has the following properties:
1. The variable of interest is divided into categories or outcomes.2. There is no natural order to the outcomes.
Statistics in Action
Where did statisticsget its start? In 1662John Graunt pub-lished an articlecalled “Natural andPolitical Observa-tions Made uponBills of Mortality.”The author’s “obser-vations” were the re-sult of a study andanalysis of a weeklychurch publicationcalled “Bill of Mor-tality,” which listedbirths, christenings,and deaths and theircauses. Graunt real-ized that the Bills ofMortality repre-sented only a frac-tion of all births anddeaths in London.However, he used thedata to reach broadconclusions about theimpact of disease,such as the plague,on the general popu-lation. His logic is anexample of statisticalinference. His analy-sis and interpretationof the data arethought to mark thestart of statistics.
Lin01803_ch01_001-020.qxd 9/23/10 8:50 PM Page 10
What Is Statistics? 11
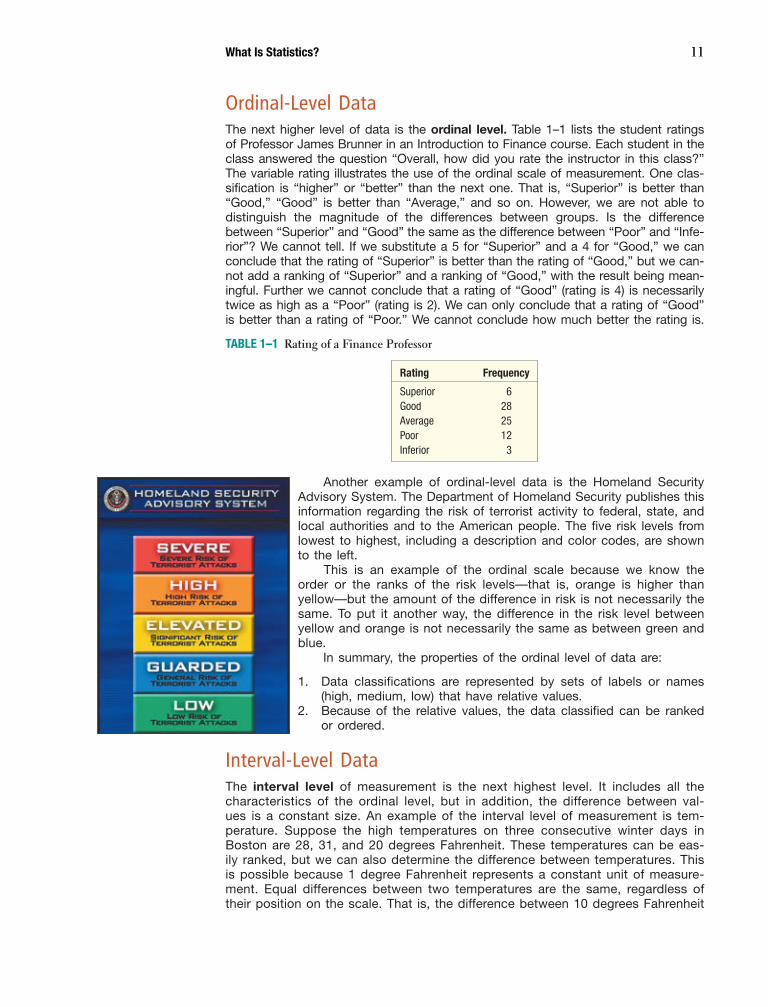
Ordinal-Level DataThe next higher level of data is the ordinal level. Table 1–1 lists the student ratingsof Professor James Brunner in an Introduction to Finance course. Each student in theclass answered the question “Overall, how did you rate the instructor in this class?”The variable rating illustrates the use of the ordinal scale of measurement. One clas-sification is “higher” or “better” than the next one. That is, “Superior” is better than“Good,” “Good” is better than “Average,” and so on. However, we are not able todistinguish the magnitude of the differences between groups. Is the differencebetween “Superior” and “Good” the same as the difference between “Poor” and “Infe-rior”? We cannot tell. If we substitute a 5 for “Superior” and a 4 for “Good,” we canconclude that the rating of “Superior” is better than the rating of “Good,” but we can-not add a ranking of “Superior” and a ranking of “Good,” with the result being mean-ingful. Further we cannot conclude that a rating of “Good” (rating is 4) is necessarilytwice as high as a “Poor” (rating is 2). We can only conclude that a rating of “Good”is better than a rating of “Poor.” We cannot conclude how much better the rating is.
TABLE 1–1 Rating of a Finance Professor
Rating Frequency
Superior 6Good 28Average 25Poor 12Inferior 3
Another example of ordinal-level data is the Homeland SecurityAdvisory System. The Department of Homeland Security publishes thisinformation regarding the risk of terrorist activity to federal, state, andlocal authorities and to the American people. The five risk levels fromlowest to highest, including a description and color codes, are shownto the left.
This is an example of the ordinal scale because we know theorder or the ranks of the risk levels—that is, orange is higher thanyellow—but the amount of the difference in risk is not necessarily thesame. To put it another way, the difference in the risk level betweenyellow and orange is not necessarily the same as between green andblue.
In summary, the properties of the ordinal level of data are:
1. Data classifications are represented by sets of labels or names(high, medium, low) that have relative values.
2. Because of the relative values, the data classified can be rankedor ordered.
Interval-Level DataThe interval level of measurement is the next highest level. It includes all thecharacteristics of the ordinal level, but in addition, the difference between val-ues is a constant size. An example of the interval level of measurement is tem-perature. Suppose the high temperatures on three consecutive winter days inBoston are 28, 31, and 20 degrees Fahrenheit. These temperatures can be eas-ily ranked, but we can also determine the difference between temperatures. Thisis possible because 1 degree Fahrenheit represents a constant unit of measure-ment. Equal differences between two temperatures are the same, regardless oftheir position on the scale. That is, the difference between 10 degrees Fahrenheit
Lin01803_ch01_001-020.qxd 9/17/10 9:17 AM Page 11
12 Chapter 1
and 15 degrees is 5, the difference between 50 and 55 degrees is also 5 degrees.It is also important to note that 0 is just a point on the scale. It does not repre-sent the absence of the condition. Zero degrees Fahrenheit does not representthe absence of heat, just that it is cold! In fact 0 degrees Fahrenheit is about �18degrees on the Celsius scale.
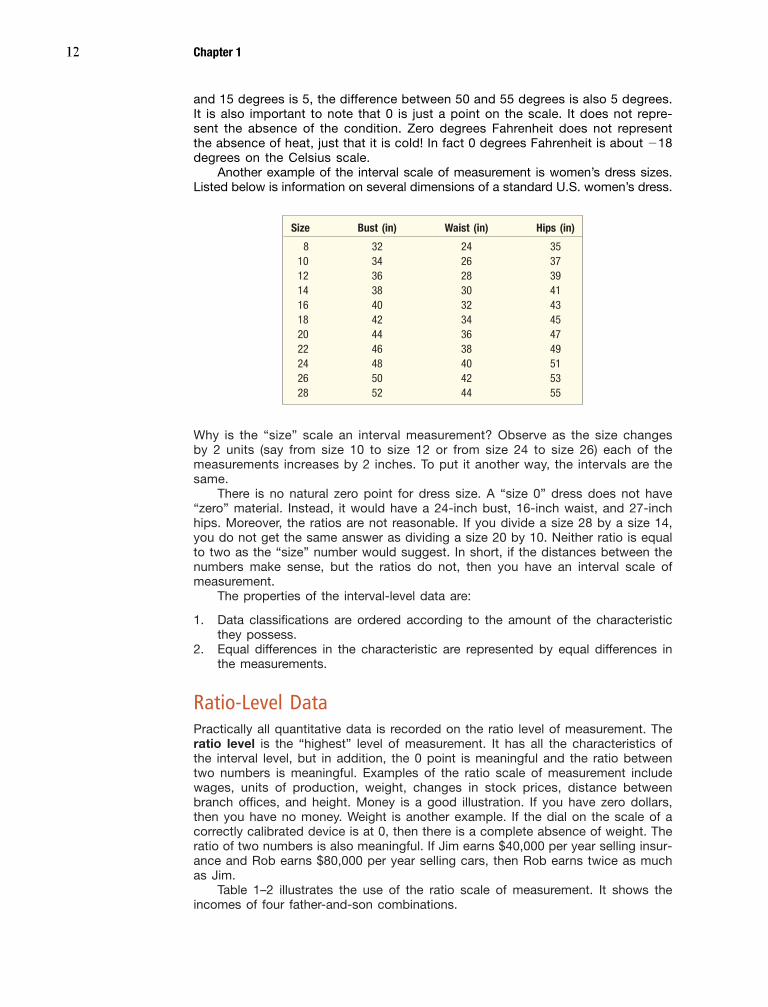
Another example of the interval scale of measurement is women’s dress sizes.Listed below is information on several dimensions of a standard U.S. women’s dress.
Size Bust (in) Waist (in) Hips (in)
8 32 24 3510 34 26 3712 36 28 3914 38 30 4116 40 32 4318 42 34 4520 44 36 4722 46 38 4924 48 40 5126 50 42 5328 52 44 55
Why is the “size” scale an interval measurement? Observe as the size changesby 2 units (say from size 10 to size 12 or from size 24 to size 26) each of themeasurements increases by 2 inches. To put it another way, the intervals are thesame.
There is no natural zero point for dress size. A “size 0” dress does not have“zero” material. Instead, it would have a 24-inch bust, 16-inch waist, and 27-inchhips. Moreover, the ratios are not reasonable. If you divide a size 28 by a size 14,you do not get the same answer as dividing a size 20 by 10. Neither ratio is equalto two as the “size” number would suggest. In short, if the distances between thenumbers make sense, but the ratios do not, then you have an interval scale ofmeasurement.
The properties of the interval-level data are:
1. Data classifications are ordered according to the amount of the characteristicthey possess.
2. Equal differences in the characteristic are represented by equal differences inthe measurements.
Ratio-Level DataPractically all quantitative data is recorded on the ratio level of measurement. Theratio level is the “highest” level of measurement. It has all the characteristics ofthe interval level, but in addition, the 0 point is meaningful and the ratio betweentwo numbers is meaningful. Examples of the ratio scale of measurement includewages, units of production, weight, changes in stock prices, distance betweenbranch offices, and height. Money is a good illustration. If you have zero dollars,then you have no money. Weight is another example. If the dial on the scale of acorrectly calibrated device is at 0, then there is a complete absence of weight. Theratio of two numbers is also meaningful. If Jim earns $40,000 per year selling insur-ance and Rob earns $80,000 per year selling cars, then Rob earns twice as muchas Jim.
Table 1–2 illustrates the use of the ratio scale of measurement. It shows theincomes of four father-and-son combinations.
Lin01803_ch01_001-020.qxd 9/17/10 9:17 AM Page 12
What Is Statistics? 13
TABLE 1–2 Father–Son Income Combinations
Name Father Son
Lahey $80,000 $ 40,000Nale 90,000 30,000Rho 60,000 120,000Steele 75,000 130,000
Observe that the senior Lahey earns twice as much as his son. In the Rho fam-ily, the son makes twice as much as the father.
In summary, the properties of the ratio-level data are:
1. Data classifications are ordered according to the amount of the characteristicsthey possess.
2. Equal differences in the characteristic are represented by equal differences inthe numbers assigned to the classifications.
3. The zero point is the absence of the characteristic and the ratio between twonumbers is meaningful.
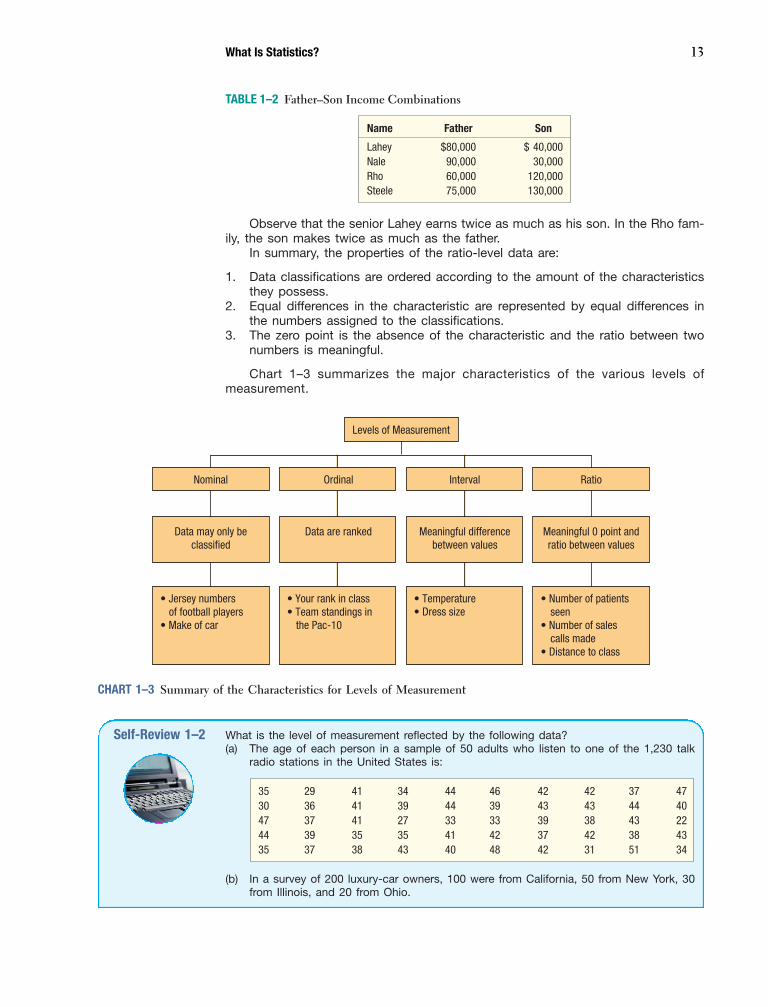
Chart 1–3 summarizes the major characteristics of the various levels ofmeasurement.
Levels of Measurement
RatioNominal Ordinal Interval
Meaningful 0 point andratio between values
Data may only beclassified
Data are ranked Meaningful differencebetween values
• Jersey numbers of football players• Make of car
• Your rank in class• Team standings in the Pac-10
• Temperature• Dress size
• Number of patients seen• Number of sales calls made• Distance to class
CHART 1–3 Summary of the Characteristics for Levels of Measurement
Self-Review 1–2 What is the level of measurement reflected by the following data?(a) The age of each person in a sample of 50 adults who listen to one of the 1,230 talk
radio stations in the United States is:
35 29 41 34 44 46 42 42 37 4730 36 41 39 44 39 43 43 44 4047 37 41 27 33 33 39 38 43 2244 39 35 35 41 42 37 42 38 4335 37 38 43 40 48 42 31 51 34
(b) In a survey of 200 luxury-car owners, 100 were from California, 50 from New York, 30from Illinois, and 20 from Ohio.
Lin01803_ch01_001-020.qxd 9/17/10 9:17 AM Page 13
ExercisesThe answers to the odd-numbered exercises are at the end of the book.
1. What is the level of measurement for each of the following variables?a. Student IQ ratings.b. Distance students travel to class.c. The jersey numbers of a sorority soccer team.d. A classification of students by state of birth.e. A summary of students by academic class—that is, freshman, sophomore, junior, and
senior.f. Number of hours students study per week.
2. What is the level of measurement for these items related to the newspaper business?a. The number of papers sold each Sunday during 2011.b. The departments, such as editorial, advertising, sports, etc.c. A summary of the number of papers sold by county.d. The number of years with the paper for each employee.
3. Look in the latest edition of USA Today or your local newspaper and find examples ofeach level of measurement. Write a brief memo summarizing your findings.
4. For each of the following, determine whether the group is a sample or a population.a. The participants in a study of a new cholesterol drug.b. The drivers who received a speeding ticket in Kansas City last month.c. Those on welfare in Cook County (Chicago), Illinois.d. The 30 stocks reported as a part of the Dow Jones Industrial Average.
1.7 Ethics and StatisticsFollowing events such as Wall Street money manager Bernie Madoff’s Ponzi scheme,which swindled billions from investors, and financial misrepresentations by Enron andTyco, business students need to understand that these events were based on themisrepresentation of business and financial data. In each case, people within eachorganization reported financial information to investors that indicated the companieswere performing much better than the actual situation. When the true financial infor-mation was reported, the companies were worth much less than advertised. The resultwas many investors lost all or nearly all of the money they put into these companies.
The article “Statistics and Ethics: Some Advice for Young Statisticians,” in TheAmerican Statistician 57, no. 1 (2003), offers guidance. The authors advise us to prac-tice statistics with integrity and honesty, and urge us to “do the right thing” whencollecting, organizing, summarizing, analyzing, and interpreting numerical information.The real contribution of statistics to society is a moral one. Financial analysts needto provide information that truly reflects a company’s performance so as not to mis-lead individual investors. Information regarding product defects that may be harmfulto people must be analyzed and reported with integrity and honesty. The authors ofThe American Statistician article further indicate that when we practice statistics, weneed to maintain “an independent and principled point-of-view.”
As you progress through this text, we will highlight ethical issues in the collec-tion, analysis, presentation, and interpretation of statistical information. We also hopethat, as you learn about using statistics, you will become a more informed consumerof information. For example, you will question a report based on data that do notfairly represent the population, a report that does not include all relevant statistics,one that includes an incorrect choice of statistical measures, or a presentation thatintroduces the writer’s bias in a deliberate attempt to mislead or misrepresent.
1.8 Computer ApplicationsComputers are now available to students at most colleges and universities.Spreadsheets, such as Microsoft Excel, and statistical software packages, suchas Minitab, are available in most computer labs. The Microsoft Excel package is
14 Chapter 1
Lin01803_ch01_001-020.qxd 9/17/10 9:17 AM Page 14
What Is Statistics? 15
bundled with many home computers. In this text, we use both Excel and Minitabfor the applications. We also use an Excel add-in called MegaStat. This add-ingives Excel the capability to produce additional statistical reports.
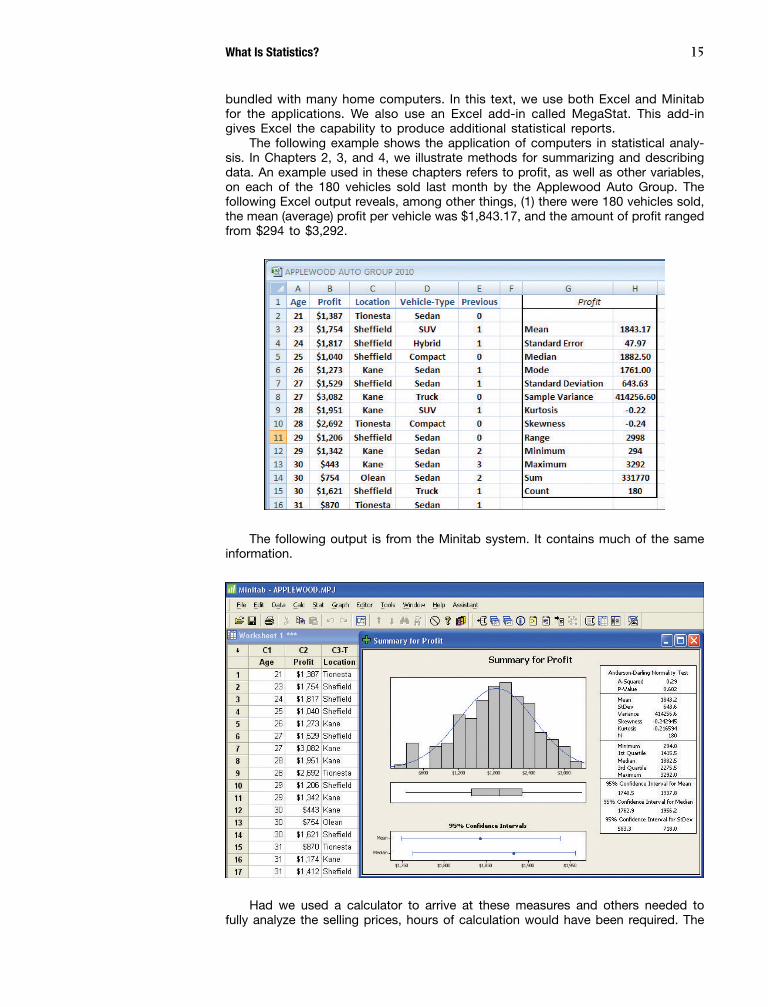
The following example shows the application of computers in statistical analy-sis. In Chapters 2, 3, and 4, we illustrate methods for summarizing and describingdata. An example used in these chapters refers to profit, as well as other variables,on each of the 180 vehicles sold last month by the Applewood Auto Group. Thefollowing Excel output reveals, among other things, (1) there were 180 vehicles sold,the mean (average) profit per vehicle was $1,843.17, and the amount of profit rangedfrom $294 to $3,292.
The following output is from the Minitab system. It contains much of the sameinformation.
Had we used a calculator to arrive at these measures and others needed tofully analyze the selling prices, hours of calculation would have been required. The
Lin01803_ch01_001-020.qxd 9/17/10 9:17 AM Page 15
16 Chapter 1
likelihood of an error in arithmetic is high when a large number of values are con-cerned. On the other hand, statistical software packages and spreadsheets canprovide accurate information in seconds.
At the option of your instructor, and depending on the software system avail-able, we urge you to apply a computer package to the exercises in the Data SetExercises section in each chapter. It will relieve you of the tedious calculations andallow you to concentrate on data analysis.
Chapter SummaryI. Statistics is the science of collecting, organizing, presenting, analyzing, and interpreting
data to assist in making more effective decisions.II. There are two types of statistics.
A. Descriptive statistics are procedures used to organize and summarize data.B. Inferential statistics involve taking a sample from a population and making estimates
about a population based on the sample results.1. A population is an entire set of individuals or objects of interest or the measure-
ments obtained from all individuals or objects of interest.2. A sample is a part of the population.
III. There are two types of variables.A. A qualitative variable is nonnumeric.
1. Usually we are interested in the number or percent of the observations in eachcategory.
2. Qualitative data are usually summarized in graphs and bar charts.B. There are two types of quantitative variables and they are usually reported numerically.
1. Discrete variables can assume only certain values, and there are usually gapsbetween values.
2. A continuous variable can assume any value within a specified range.IV. There are four levels of measurement.
A. With the nominal level, the data are sorted into categories with no particular order tothe categories.
B. The ordinal level of measurement presumes that one classification is ranked higher thananother.
C. The interval level of measurement has the ranking characteristic of the ordinal levelof measurement plus the characteristic that the distance between values is a con-stant size.
D. The ratio level of measurement has all the characteristics of the interval level, plus thereis a 0 point and the ratio of two values is meaningful.
Chapter Exercises5. Explain the difference between qualitative and quantitative variables. Give an example of
qualitative and quantitative variables.6. Explain the difference between a sample and a population.7. Explain the difference between a discrete and a continuous variable. Give an example of
each not included in the text.8. For the following questions, would you collect information using a sample or a popula-
tion? Why?a. Statistics 201 is a course taught at a university. Professor A. Verage has taught nearly
1,500 students in the course over the past 5 years. You would like to know the aver-age grade for the course.
b. As part of a research project, you need to report the average profitability of the num-ber one corporation in the Fortune 500 for the past 10 years.
c. You are looking forward to graduation and your first job as a salesperson for one offive large pharmaceutical corporations. Planning for your interviews, you will need toknow about each company’s mission, profitability, products, and markets.
Lin01803_ch01_001-020.qxd 10/13/10 2:06 PM Page 16
What Is Statistics? 17
d. You are shopping for a new MP3 music player such as the Apple iPod. The manu-facturers advertise the number of music tracks that can be stored in the memory. Usu-ally, the advertisers assume relatively short, popular music to estimate the number oftracks that can be stored. You, however, like Broadway musical tunes and they aremuch longer. You would like to estimate how many Broadway tunes will fit on yourMP3 player.
9. Exits along interstate highways were formerly numbered successively from the western orsouthern edge of a state. However, the Department of Transportation has recently changedmost of them to agree with the numbers on the mile markers along the highway.a. What level of measurement were data on the consecutive exit numbers?b. What level of measurement are data on the milepost numbers?c. Discuss the advantages of the newer system.
10. A poll solicits a large number of college undergraduates for information on the followingvariables: the name of their cell phone provider (AT&T, Verizon, and so on), the numbersof minutes used last month (200, 400, for example), and their satisfaction with the ser-vice (Terrible, Adequate, Excellent, and so forth). What is the data scale for each of thesethree variables?
11. Barnes & Noble stores recently began selling the Nook. With this device, you candownload over 1,500 books electronically and read the book on a small monitor insteadof purchasing the book. Assume you have the number of Nooks sold each day for thelast month at the Barnes & Noble store at the Market Commons Mall in Riverside,California. Describe a condition in which this information could be considered a sample.Illustrate a second situation in which the same data would be regarded as a population.
12. Utilize the concepts of sample and population to describe how a presidential election isunlike an “exit” poll of the electorate.
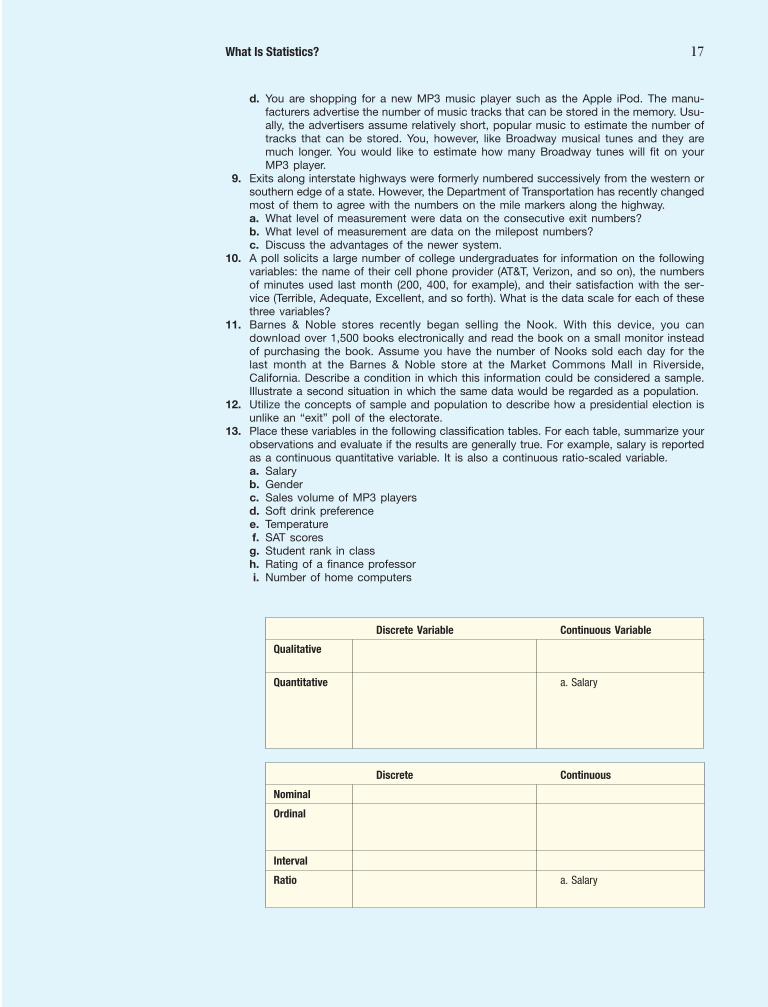
13. Place these variables in the following classification tables. For each table, summarize yourobservations and evaluate if the results are generally true. For example, salary is reportedas a continuous quantitative variable. It is also a continuous ratio-scaled variable.a. Salaryb. Genderc. Sales volume of MP3 playersd. Soft drink preferencee. Temperaturef. SAT scoresg. Student rank in classh. Rating of a finance professori. Number of home computers
Discrete Variable Continuous Variable
Qualitative
Quantitative a. Salary
Discrete Continuous
Nominal
Ordinal
Interval
Ratio a. Salary
Lin01803_ch01_001-020.qxd 9/24/10 4:42 PM Page 17
18 Chapter 1
Year-to-Date Sales
Through February Through February
Manufacturer 2010 2009
General Motors Corp. 287,242 252,701Ford Motor Company 249,514 185,825Chrysler LLC 141,592 146,207Toyota Motor Sales USA Inc. 198,823 226,870American Honda Motor Co. Inc. 148,150 142,606Nissan North America Inc. 132,761 108,133Hyundai Motor America 64,507 55,133Mazda Motor of America Inc. 32,748 31,821
a. Compare the total sales for the eight automakers. Has there been an increase or adecrease in sales for 2010 compared to the same period in 2009?
b. Compute the market share for each of the companies. Has there been a large changein the market share for any of the companies?
c. Compare the percentage increases for each of the eight companies. What significantchanges are there from 2009 to 2010 for each of the companies?
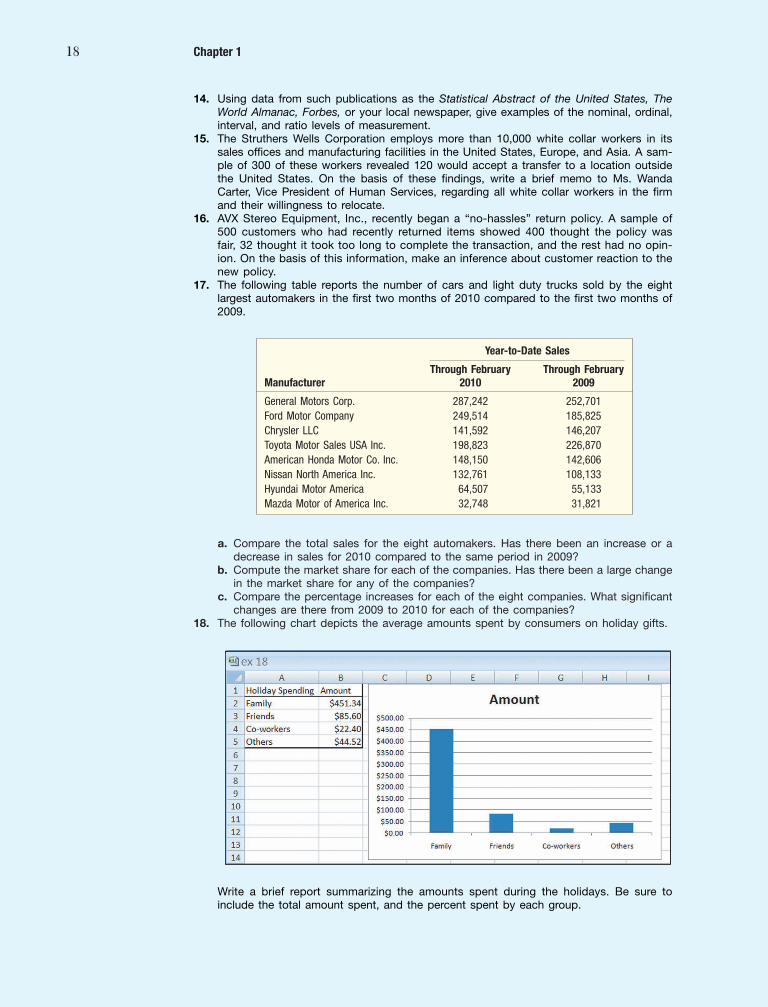
18. The following chart depicts the average amounts spent by consumers on holiday gifts.
14. Using data from such publications as the Statistical Abstract of the United States, TheWorld Almanac, Forbes, or your local newspaper, give examples of the nominal, ordinal,interval, and ratio levels of measurement.
15. The Struthers Wells Corporation employs more than 10,000 white collar workers in itssales offices and manufacturing facilities in the United States, Europe, and Asia. A sam-ple of 300 of these workers revealed 120 would accept a transfer to a location outsidethe United States. On the basis of these findings, write a brief memo to Ms. WandaCarter, Vice President of Human Services, regarding all white collar workers in the firmand their willingness to relocate.
16. AVX Stereo Equipment, Inc., recently began a “no-hassles” return policy. A sample of500 customers who had recently returned items showed 400 thought the policy wasfair, 32 thought it took too long to complete the transaction, and the rest had no opin-ion. On the basis of this information, make an inference about customer reaction to thenew policy.
17. The following table reports the number of cars and light duty trucks sold by the eightlargest automakers in the first two months of 2010 compared to the first two months of2009.
Write a brief report summarizing the amounts spent during the holidays. Be sure toinclude the total amount spent, and the percent spent by each group.
Lin01803_ch01_001-020.qxd 9/24/10 4:42 PM Page 18
What Is Statistics? 19
Data Set Exercises20. Refer to the Real Estate data at the back of the text, which report information on homes
sold in the Goodyear, Arizona, area last year. Consider the following variables: sellingprice, number of bedrooms, township, and distance from the center of the city.a. Which of the variables are qualitative and which are quantitative?b. Determine the level of measurement for each of the variables.
21. Refer to the Baseball 2009 data, which report information on the 30 Major League Base-ball teams for the 2009 season. Consider the following variables: number of wins, teamsalary, season attendance, whether the team is in the American or National League, andthe number of home runs hit.a. Which of these variables are quantitative and which are qualitative?b. Determine the level of measurement for each of the variables.
22. Refer to the Buena School District bus data, which report information on the school dis-trict’s bus fleet.a. Which of the variables are qualitative and which are quantitative?b. Determine the level of measurement for each variable.
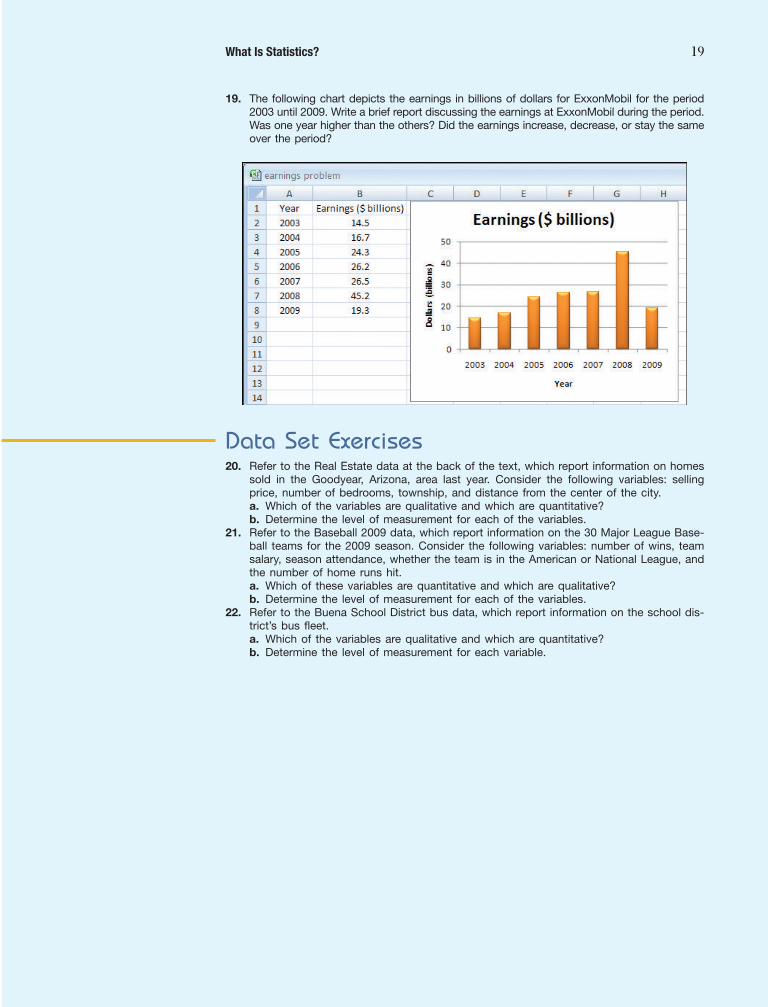
19. The following chart depicts the earnings in billions of dollars for ExxonMobil for the period2003 until 2009. Write a brief report discussing the earnings at ExxonMobil during the period.Was one year higher than the others? Did the earnings increase, decrease, or stay the sameover the period?
Lin01803_ch01_001-020.qxd 9/24/10 4:42 PM Page 19

20 Chapter 1
Chapter 1 Answers to Self-Review
1–1 a. On the basis of the sample of 1,960 consumers,we estimate that, if it is marketed, 60 percent ofall consumers will purchase the chicken dinner(1,176/1,960) � 100 � 60 percent.
b. Inferential statistics, because a sample wasused to draw a conclusion about how allconsumers in the population would react if thechicken dinner were marketed.
1–2 a. Age is a ratio-scale variable. A 40-year-old istwice as old as someone 20 years old.
b. Nominal scale. We could arrange the states inany order.
Lin01803_ch01_001-020.qxd 8/26/10 2:08 PM Page 20