chapter 10 - california state university, northridgehcbus012/docs/230 solution fall...
TRANSCRIPT
Chapter 10Standard Costs and the Balanced Scorecard
Solutions to Questions
10-1 A quantity standard indicates how much of an input should be used to make a unit of output. A price standard indicates how much the input should cost.
10-2 Ideal standards assume perfection and do not allow for any inefficiency. Thus, ideal standards are rarely, if ever, attained. Practical standards can be attained by employees working at a reasonable, though efficient pace and allow for normal breaks and work interruptions.
10-3 Chronic inability to meet a standard is likely to be demoralizing and may result in decreased productivity.
10-4 A budget is usually expressed in terms of total dollars, whereas a standard is expressed on a per unit basis. A standard might be viewed as the budgeted cost for one unit.
10-5 A variance is the difference between what was planned or expected and what was actually accomplished. A standard cost system has at least two types of variances. A price variance focuses on the difference between the standard price and the actual price of an input. A quantity variance is concerned with the difference between the standard quantity of the input allowed for the actual output and the actual amount of the input used.
10-6 Under management by exception, managers focus their attention on results that deviate from expectations. It is
assumed that results that meet expectations do not require investigation.
10-7 Separating an overall variance into a price variance and a quantity variance provides more information. Moreover, price and quantity variances are usually the responsibilities of different managers.
10-8 The materials price variance is usually the responsibility of the purchasing manager. The materials quantity and labor efficiency variances are usually the responsibility of production managers and supervisors.
10-9 The materials price variance can be computed either when materials are purchased or when they are placed into production. It is usually better to compute the variance when materials are purchased since that is when the purchasing manager, who has responsibility for this variance, has completed his or her work. In addition, recognizing the price variance when materials are purchased allows the company to carry its raw materials in the inventory accounts at standard cost, which greatly simplifies bookkeeping.
10-10 This combination of variances may indicate that inferior quality materials were purchased at a discounted price, but the low-quality materials created production problems.
10-11 If standards are used to find who to blame for problems, they can breed resentment and undermine morale.
© The McGraw-Hill Companies, Inc., 2008. All rights reserved.Solutions Manual, Chapter 10 505
Standards should not be used to find someone to blame for problems.
10-12 Several factors other than the contractual rate paid to workers can cause a labor rate variance. For example, skilled workers with high hourly rates of pay can be given duties that require little skill and that call for low hourly rates of pay, resulting in an unfavorable rate variance. Or unskilled or untrained workers can be assigned to tasks that should be filled by more skilled workers with higher rates of pay, resulting in a favorable rate variance. Unfavorable rate variances can also arise from overtime work at premium rates.
10-13 If poor quality materials create production problems, a result could be excessive labor time and therefore an unfavorable labor efficiency variance. Poor quality materials would not ordinarily affect the labor rate variance.
10-14 If overhead is applied on the basis of direct labor-hours, then the variable overhead efficiency variance and the direct labor efficiency variance will always be favorable or unfavorable together. Both variances are computed by comparing the number of direct labor-hours actually worked to the standard hours allowed. That is, in each case the formula is:
Efficiency Variance = SR(AH – SH)Only the “SR” part of the formula, the standard rate, differs between the two variances.
10-15 A statistical control chart is a graphical aid that helps workers identify variances that should be investigated. Upper and lower limits are set on the control chart. Any variances falling between those limits are considered to be normal. Any variances falling outside of those limits are considered abnormal and are investigated.
10-16 If labor is a fixed cost and standards are tight, then the only way to generate favorable labor efficiency variances is for every workstation to produce at capacity. However, the output
of the entire system is limited by the capacity of the bottleneck. If workstations before the bottleneck in the production process produce at capacity, the bottleneck will be unable to process all of the work in process. In general, if every workstation is attempting to produce at capacity, then work in process inventory will build up in front of the workstations with the least capacity.
10-17 A company’s balanced scorecard should be derived from and support its strategy. Since different companies have different strategies, their balanced scorecards should be different.
10-18 The balanced scorecard is constructed to support the company’s strategy, which is a theory about what actions will further the company’s goals. Assuming that the company has financial goals, measures of financial performance must be included in the balanced scorecard as a check on the reality of the theory. If the internal business processes improve, but the financial outcomes do not improve, the theory may be flawed and the strategy should be changed.
10-19 The difference between delivery cycle time and throughput time is the waiting period between when an order is received and when production on the order is started. Throughput time is made up of process time, inspection time, move time, and queue time. These four elements can be classified into value-added time (process time) and non-value-added time (inspection time, move time, and queue time).
10-20 An MCE of less than 1 means that the production process includes non-value-added time. An MCE of 0.40, for example, means that 40% of throughput time consists of actual processing, and that the other 60% consists of moving, inspection, and other non-value-added activities.
10-21 Formal entry tends to give variances more emphasis than off-the-record computations. And, the use of standard costs in the journals simplifies
© The McGraw-Hill Companies, Inc., 2008506 Managerial Accounting, 12th Edition

the bookkeeping process by allowing all inventories to be carried at standard, rather than actual, cost.
© The McGraw-Hill Companies, Inc., 2008. All rights reserved.Solutions Manual, Chapter 10 507
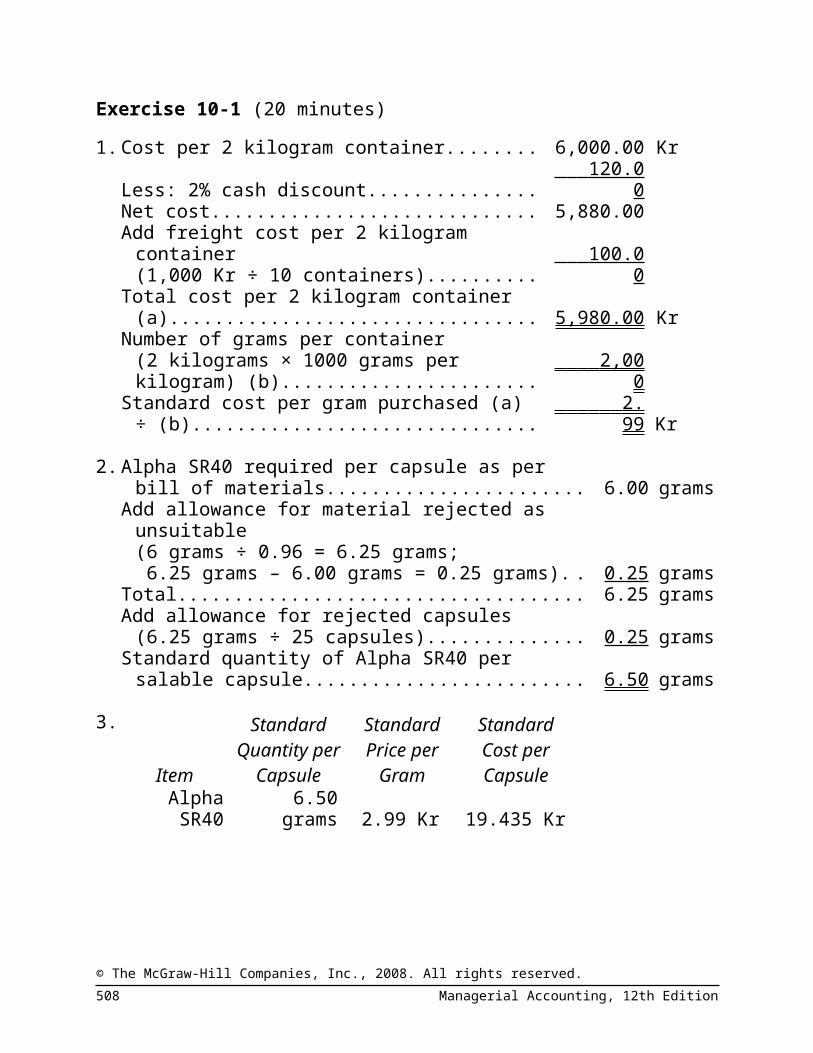
Exercise 10-1 (20 minutes)1. Cost per 2 kilogram container....................... 6,000.00 Kr
Less: 2% cash discount................................. 120.00 Net cost......................................................... 5,880.00Add freight cost per 2 kilogram container
(1,000 Kr ÷ 10 containers).......................... 100.00 Total cost per 2 kilogram container (a).......... 5,980.00 KrNumber of grams per container
(2 kilograms × 1000 grams per kilogram) (b)............................................................... 2,000
Standard cost per gram purchased (a) ÷ (b). 2.99 Kr
2. Alpha SR40 required per capsule as per bill of materials............................................................. 6.00 grams
Add allowance for material rejected as unsuit-able (6 grams ÷ 0.96 = 6.25 grams; 6.25 grams – 6.00 grams = 0.25 grams)........... 0.25 grams
Total....................................................................... 6.25 gramsAdd allowance for rejected capsules
(6.25 grams ÷ 25 capsules)................................ 0.25 gramsStandard quantity of Alpha SR40 per salable cap-
sule..................................................................... 6.50 grams
3.
Item
Standard Quantity per Cap-
sule
Standard Price per
Gram
Standard Cost per Capsule
Alpha SR40 6.50 grams 2.99 Kr 19.435 Kr
© The McGraw-Hill Companies, Inc., 2008. All rights reserved.508 Managerial Accounting, 12th Edition

Exercise 10-2 (20 minutes)1. Number of chopping blocks........................... 4,000
Number of board feet per chopping block..... × 2.5 Standard board feet allowed......................... 10,000Standard cost per board foot......................... × $1.80 Total standard cost........................................ $18,000Actual cost incurred....................................... $18,700Standard cost above...................................... 18,000 Total variance—unfavorable.......................... $ 700
2. Actual Quantity of Inputs, at
Actual Price
Actual Quantity of Inputs, at
Standard Price
Standard Quantity Allowed for Out-put, at Standard
Price(AQ × AP) (AQ × SP) (SQ × SP)$18,700 11,000 board feet
× $1.80 per board foot
10,000 board feet × $1.80 per board
foot= $19,800 = $18,000
Price Variance,
$1,100 FQuantity Variance,
$1,800 U
Total Variance, $700 U
Alternatively:Materials Price Variance = AQ (AP – SP) 11,000 board feet ($1.70 per board foot* – $1.80 per board
foot) = $1,100 F
*$18,700 ÷ 11,000 board feet = $1.70 per board foot.Materials Quantity Variance = SP (AQ – SQ)$1.80 per board foot (11,000 board feet – 10,000 board feet)
= $1,800 U
© The McGraw-Hill Companies, Inc., 2008. All rights reserved.Solutions Manual, Chapter 10 509

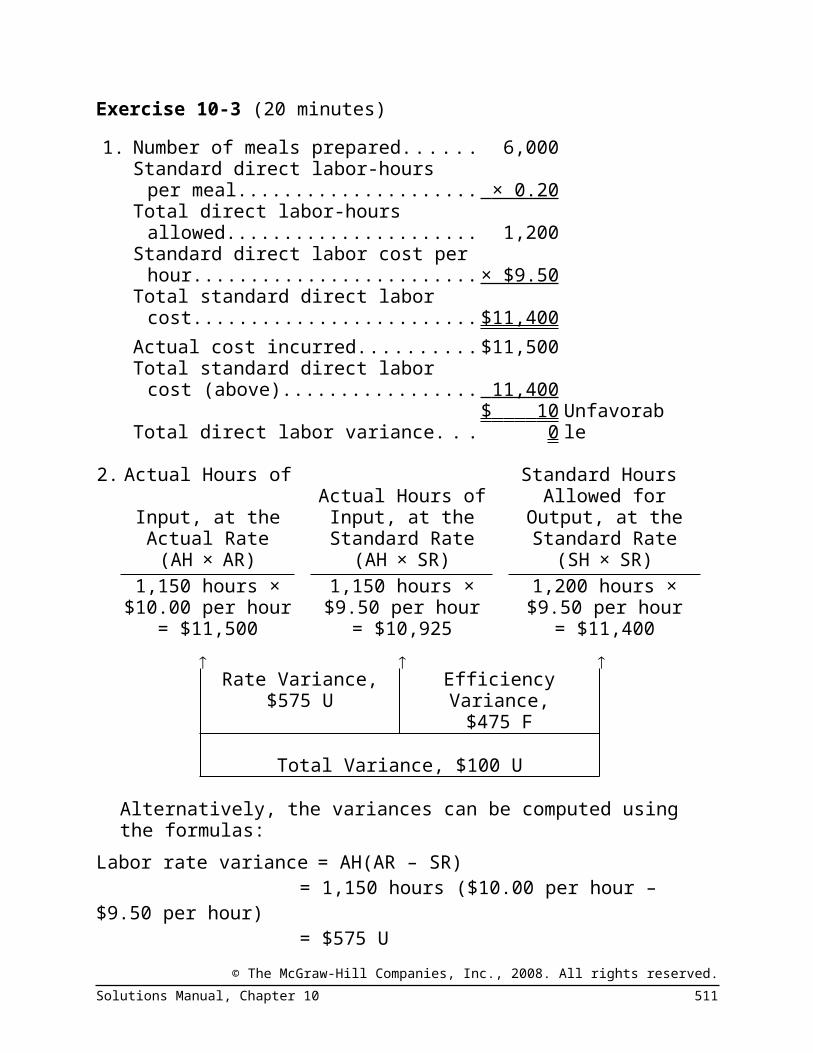
Exercise 10-3 (20 minutes)1. Number of meals prepared............... 6,000
Standard direct labor-hours per meal................................................ × 0.20
Total direct labor-hours allowed........ 1,200Standard direct labor cost per hour. . × $9.50Total standard direct labor cost........ $11,400Actual cost incurred.......................... $11,500Total standard direct labor cost
(above)........................................... 11,400
Total direct labor variance................ $ 100 Unfavor-able
2.Actual Hours of Input, at the Ac-
tual Rate
Actual Hours of In-put, at the Stan-
dard Rate
Standard Hours Allowed for Output,
at the Standard Rate
(AH×AR) (AH×SR) (SH×SR)1,150 hours ×
$10.00 per hour1,150 hours ×$9.50 per hour
1,200 hours ×$9.50 per hour
= $11,500 = $10,925 = $11,400
Rate Variance, $575 U
Efficiency Variance, $475 F
Total Variance, $100 U
Alternatively, the variances can be computed using the formulas:
Labor rate variance = AH(AR – SR)= 1,150 hours ($10.00 per hour – $9.50 per
hour)= $575 U
Labor efficiency variance = SR(AH – SH)= $9.50 per hour (1,150 hours – 1,200
hours)= $475 F
© The McGraw-Hill Companies, Inc., 2008. All rights reserved.510 Managerial Accounting, 12th Edition
Exercise 10-4 (20 minutes)1. Number of items shipped.......................... 140,000
Standard direct labor-hours per item........ × 0.04 Total direct labor-hours allowed................ 5,600Standard variable overhead cost per
hour........................................................ × $2.80Total standard variable overhead cost...... $15,680Actual variable overhead cost incurred..... $15,950Total standard variable overhead cost
(above)................................................... 15,680
Total variable overhead variance.............. $ 270 Unfavor-able
2.Actual Hours of Input, at the Ac-
tual Rate
Actual Hours of In-put, at the Stan-
dard Rate
Standard Hours Allowed for Output,
at the Standard Rate
(AH×AR) (AH×SR) (SH×SR)5,800 hours ×
$2.75 per hour*5,800 hours ×$2.80 per hour
5,600 hours ×$2.80 per hour
= $15,950 = $16,240 = $15,680
Variable overhead spending variance,
$290 F
Variable overhead efficiency variance,
$560 U
Total variance, $270 U *$15,950÷ 5,800 hours =$2.75 per hour
Alternatively, the variances can be computed using the formulas:
Variable overhead spending variance:AH(AR – SR) = 5,800 hours ($2.75 per hour – $2.80 per
hour)= $290 F
Variable overhead efficiency variance:SR(AH – SH) = $2.80 per hour (5,800 hours – 5,600 hours)
© The McGraw-Hill Companies, Inc., 2008. All rights reserved.Solutions Manual, Chapter 10 511

= $560 U
© The McGraw-Hill Companies, Inc., 2008. All rights reserved.512 Managerial Accounting, 12th Edition

Exercise 10-5 (45 minutes)1. MPC’s previous manufacturing strategy was focused on high-
volume production of a limited range of paper grades. The goal of this strategy was to keep the machines running constantly to maximize the number of tons produced. Changeovers were avoided because they lowered equipment utilization. Maximizing tons produced and minimizing changeovers helped spread the high fixed costs of paper manufacturing across more units of output. The new manufacturing strategy is focused on low-volume production of a wide range of products. The goals of this strategy are to increase the number of paper grades manufactured, decrease changeover times, and increase yields across non-standard grades. While MPC realizes that its new strategy will decrease its equipment utilization, it will still strive to optimize the utilization of its high fixed cost resources within the confines of flexible production. In an economist’s terms the old strategy focused on economies of scale while the new strategy focuses on economies of scope.
2. Employees focus on improving those measures that are used to evaluate their performance. Therefore, strategically-aligned performance measures will channel employee effort towards improving those aspects of performance that are most important to obtaining strategic objectives. If a company changes its strategy but continues to evaluate employee performance using measures that do not support the new strategy, it will be motivating its employees to make decisions that promote the old strategy, not the new strategy. And if employees make decisions that promote the new strategy, their performance measures will suffer.
Some performance measures that would be appropriate for MPC’s old strategy include: equipment utilization percentage, number of tons of paper produced, and cost per ton produced. These performance measures would not support MPC’s new strategy because they would discourage increasing the range of paper grades produced, increasing the number of changeovers performed, and decreasing the batch size produced per run.
© The McGraw-Hill Companies, Inc., 2008. All rights reserved.Solutions Manual, Chapter 10 513

Exercise 10-5 (continued)3. Students’ answers may differ in some details from this solution.
© The McGraw-Hill Companies, Inc., 2008. All rights reserved.514 Managerial Accounting, 12th Edition
Sales Contribution margin per
ton
Finan-cial
Time to fill an order
Customer satisfaction with breadth of product offerings
Number of new customers acquired
Customer
Average change-over time
Number of different paper grades pro-
ducedAverage manu-facturing yield
InternalBusi-nessProcess
Number of employ-ees trained to sup-port the flexibility
strategy
Learningand Growth +
– +
+
– +
+
+ +

Exercise 10-5 (continued)4. The hypotheses underlying the balanced scorecard are
indicated by the arrows in the diagram. Reading from the bottom of the balanced scorecard, the hypotheses are:° If the number of employees trained to support the flexibility
strategy increases, then the average changeover time will decrease and the number of different paper grades produced and the average manufacturing yield will increase.
° If the average changeover time decreases, then the time to fill an order will decrease.
° If the number of different paper grades produced increases, then the customer satisfaction with breadth of product offerings will increase.
° If the average manufacturing yield increases, then the contribution margin per ton will increase.
° If the time to fill an order decreases, then the number of new customers acquired, sales, and the contribution margin per ton will increase.
° If the customer satisfaction with breadth of product offerings increases, then the number of new customers acquired, sales, and the contribution margin per ton will increase.
° If the number of new customers acquired increases, then sales will increase.
Each of these hypotheses can be questioned. For example, the time to fill an order is a function of additional factors above and beyond changeover times. Thus, MPC’s average changeover time could decrease while its time to fill an order increases if, for example, the shipping department proves to be incapable of efficiently handling greater product diversity, smaller batch sizes, and more frequent shipments. The fact that each of the hypotheses mentioned above can be questioned does not invalidate the balanced scorecard. If the scorecard is used correctly, management will be able to identify which, if any, of the hypotheses are invalid and modify the balanced scorecard accordingly.
© The McGraw-Hill Companies, Inc., 2008. All rights reserved.Solutions Manual, Chapter 10 515

Exercise 10-6 (20 minutes)1. Throughput
time= Process time + Inspection time + Move
time + Queue time
=2.8 days + 0.5 days + 0.7 days + 4.0
days= 8.0 days
2. Only process time is value-added time; therefore the manufacturing cycle efficiency (MCE) is:
3. If the MCE is 35%, then the complement of this figure, or 65% of the time, was spent in non-value-added activities.
4.Delivery cycle
time = Wait time + Throughput time= 16.0 days + 8.0 days= 24.0 days
5. If all queue time in production is eliminated, then the throughput time drops to only 4 days (0.5 + 2.8 + 0.7). The MCE becomes:
Thus, the MCE increases to 70%. This exercise shows quite dramatically how the lean production approach can improve operations and reduce throughput time.
© The McGraw-Hill Companies, Inc., 2008. All rights reserved.516 Managerial Accounting, 12th Edition

Exercise 10-7 (20 minutes)1. The general ledger entry to record the purchase of materials
for the month is:Raw Materials
(15,000 meters at $5.40 per meter)........... 81,000Materials Price Variance
(15,000 meters at $0.20 per meter U)........ 3,000Accounts Payable
(15,000 meters at $5.60 per meter)...... 84,000
2. The general ledger entry to record the use of materials for the month is:
Work in Process (12,000 meters at $5.40 per meter)........... 64,800
Materials Quantity Variance(100 meters at $5.40 per meter F)......... 540
Raw Materials (11,900 meters at $5.40 per meter)...... 64,260
3. The general ledger entry to record the incurrence of direct labor cost for the month is:
Work in Process (2,000 hours at $14.00 per hour)........................................................... 28,000
Labor Rate Variance (1,950 hours at $0.20 per hour U).............. 390
Labor Efficiency Variance (50 hours at $14.00 per hour F)............. 700
Wages Payable (1,950 hours at $14.20 per hour)........... 27,690
© The McGraw-Hill Companies, Inc., 2008. All rights reserved.Solutions Manual, Chapter 10 517

Exercise 10-8 (20 minutes)1. The standard price of a kilogram of white chocolate is
determined as follows:Purchase price, finest grade white chocolate.............. £9.00Less purchase discount, 5% of the purchase price of
£9.00......................................................................... (0.45)Shipping cost from the supplier in Belgium................. 0.20Receiving and handling cost........................................ 0.05 Standard price per kilogram of white chocolate.......... £8.80
2. The standard quantity, in kilograms, of white chocolate in a dozen truffles is computed as follows:Material requirements....................... 0.80Allowance for waste.......................... 0.02Allowance for rejects......................... 0.03Standard quantity of white chocolate 0.85
3. The standard cost of the white chocolate in a dozen truffles is determined as follows:Standard quantity of white chocolate
(a)....................................................... 0.85kilogram
Standard price of white chocolate (b). . . £8.80 per kilogramStandard cost of white chocolate (a) ×
(b)....................................................... £7.48
© The McGraw-Hill Companies, Inc., 2008. All rights reserved.518 Managerial Accounting, 12th Edition

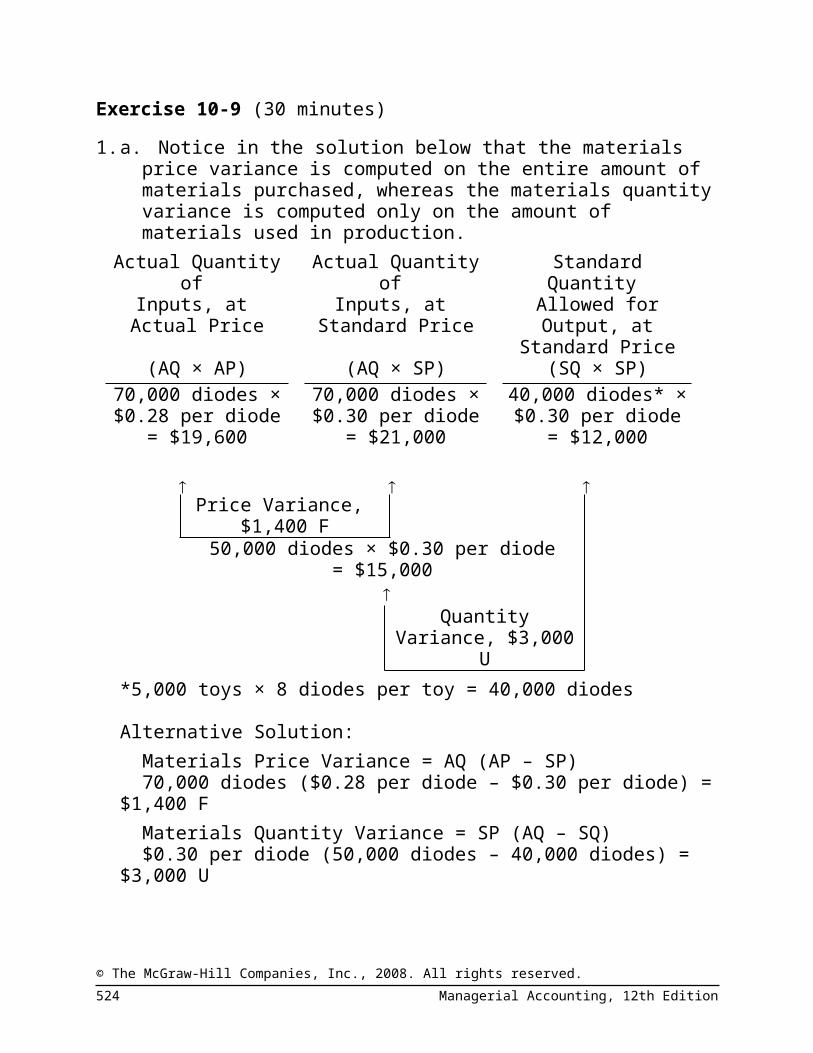
Exercise 10-9 (30 minutes)1. a. Notice in the solution below that the materials price variance
is computed on the entire amount of materials purchased, whereas the materials quantity variance is computed only on the amount of materials used in production.
Actual Quantity of Inputs, at
Actual Price
Actual Quantity of Inputs, at
Standard Price
Standard Quantity Allowed for Output, at Standard Price
(AQ × AP) (AQ × SP) (SQ × SP)70,000 diodes × $0.28 per diode
70,000 diodes × $0.30 per diode
40,000 diodes* × $0.30 per diode
= $19,600 = $21,000 = $12,000
Price Variance,
$1,400 F50,000 diodes × $0.30 per diode
= $15,000
Quantity Variance, $3,000 U
*5,000 toys × 8 diodes per toy = 40,000 diodes
Alternative Solution:Materials Price Variance = AQ (AP – SP)70,000 diodes ($0.28 per diode – $0.30 per diode) = $1,400
FMaterials Quantity Variance = SP (AQ – SQ)$0.30 per diode (50,000 diodes – 40,000 diodes) = $3,000 U
© The McGraw-Hill Companies, Inc., 2008. All rights reserved.Solutions Manual, Chapter 10 519

Exercise 10-9 (continued)b. Direct labor variances:
Actual Hours of Input, at the Ac-
tual Rate
Actual Hours of Input, at the
Standard Rate
Standard Hours Allowed for Out-put, at the Stan-
dard Rate(AH × AR) (AH × SR) (SH × SR)$48,000 6,400 hours ×
$7 per hour6,000 hours* ×
$7 per hour= $44,800 = $42,000
Rate Variance,
$3,200 UEfficiency Variance,
$2,800 U
Total Variance, $6,000 U
*5,000 toys × 1.2 hours per toy = 6,000 hours
Alternative Solution:Labor Rate Variance = AH (AR – SR)6,400 hours ($7.50* per hour – $7.00 per hour) = $3,200 U
*$48,000 ÷ 6,400 hours = $7.50 per hourLabor Efficiency Variance = SR (AH – SH)$7 per hour (6,400 hours – 6,000 hours) = $2,800 U
© The McGraw-Hill Companies, Inc., 2008. All rights reserved.520 Managerial Accounting, 12th Edition
Exercise 10-9 (continued)2. A variance usually has many possible explanations. In
particular, we should always keep in mind that the standards themselves may be incorrect. Some of the other possible explanations for the variances observed at Topper Toys appear below:Materials Price Variance Since this variance is favorable, the actual price paid per unit for the material was less than the standard price. This could occur for a variety of reasons including the purchase of a lower grade material at a discount, buying in an unusually large quantity to take advantage of quantity discounts, a change in the market price of the material, and particularly sharp bargaining by the purchasing department.Materials Quantity Variance Since this variance is unfavorable, more materials were used to produce the actual output than were called for by the standard. This could also occur for a variety of reasons. Some of the possibilities include poorly trained or supervised workers, improperly adjusted machines, and defective materials.Labor Rate Variance Since this variance is unfavorable, the actual average wage rate was higher than the standard wage rate. Some of the possible explanations include an increase in wages that has not been reflected in the standards, unanticipated overtime, and a shift toward more highly paid workers.Labor Efficiency Variance Since this variance is unfavorable, the actual number of labor hours was greater than the standard labor hours allowed for the actual output. As with the other variances, this variance could have been caused by any of a number of factors. Some of the possible explanations include poor supervision, poorly trained workers, low-quality materials requiring more labor time to process, and machine breakdowns. In addition, if the direct labor force is essentially fixed, an unfavorable labor efficiency variance could be caused by a reduction in output due to decreased demand for the company’s products.
© The McGraw-Hill Companies, Inc., 2008. All rights reserved.Solutions Manual, Chapter 10 521

Exercise 10-10 (20 minutes)1. Actual Quantity
of Inputs, at Actual Price
Actual Quantity of Inputs, at
Standard Price
Standard Quan-tity Allowed for Output, at Stan-
dard Price(AQ × AP) (AQ × SP) (SQ × SP)
20,000 ounces × $2.40 per ounce
20,000 ounces × $2.50 per ounce
18,000 ounces* × $2.50 per ounce
= $48,000 = $50,000 = $45,000
Price Variance,
$2,000 FQuantity Variance,
$5,000 U
Total Variance, $3,000 U
*2,500 units × 7.2 ounces per unit = 18,000 ounces
Alternatively:Materials Price Variance = AQ (AP – SP) 20,000 ounces ($2.40 per ounce – $2.50 per ounce) =
$2,000 FMaterials Quantity Variance = SP (AQ – SQ)$2.50 per ounce (20,000 ounces – 18,000 ounces) = $5,000
U
© The McGraw-Hill Companies, Inc., 2008. All rights reserved.522 Managerial Accounting, 12th Edition

Exercise 10-10 (continued)2. Actual Hours of
Input, at the Actual Rate
Actual Hours of Input, at the
Standard Rate
Standard Hours Allowed for Out-put, at the Stan-
dard Rate(AH × AR) (AH × SR) (SH × SR)$10,800 900 hours ×
$10 per hour1,000 hours* ×
$10 per hour= $9,000 = $10,000
Rate Variance,
$1,800 UEfficiency Variance,
$1,000 F
Total Variance, $800 U
*2,500 units × 0.4 hour per unit = 1,000 hours
Alternatively:Labor Rate Variance = AH (AR – SR)900 hours ($12 per hour* – $10 per hour) = $1,800 U*10,800 ÷ 900 hours = $12 per hourLabor Efficiency Variance = SR (AH – SH)$10 per hour (900 hours – 1,000 hours) = 1,000 F
© The McGraw-Hill Companies, Inc., 2008. All rights reserved.Solutions Manual, Chapter 10 523
Exercise 10-11 (15 minutes)Notice in the solution below that the materials price variance is computed on the entire amount of materials purchased, whereas the materials quantity variance is computed only on the amount of materials used in production.Actual Quantity of
Inputs, at Actual Price
Actual Quantity of Inputs, at
Standard Price
Standard Quantity Allowed for Out-put, at Standard
Price(AQ × AP) (AQ × SP) (SQ × SP)
20,000 ounces × $2.40 per ounce
20,000 ounces × $2.50 per ounce
14,400 ounces* × $2.50 per ounce
= $48,000 = $50,000 = $36,000
Price Variance,
$2,000 F16,000 ounces × $2.50 per ounce
= $40,000
Quantity Variance, $4,000 U
*2,000 bottles × 7.2 ounces per bottle = 14,400 ounces
Alternatively:Materials Price Variance = AQ (AP – SP)20,000 ounces ($2.40 per ounce – $2.50 per ounce) =
$2,000 FMaterials Quantity Variance = SP (AQ – SQ)$2.50 per ounce (16,000 ounces – 14,400 ounces) = $4,000
U
© The McGraw-Hill Companies, Inc., 2008. All rights reserved.524 Managerial Accounting, 12th Edition

Exercise 10-12 (30 minutes)1. Number of units manufactured...................... 20,000
Standard labor time per unit (24 minutes ÷ 60 minutes per hour).................................. × 0.4
Total standard hours of labor time allowed.... 8,000Standard direct labor rate per hour............... × $6 Total standard direct labor cost..................... $48,000Actual direct labor cost.................................. $49,300Standard direct labor cost............................. 48,000 Total variance—unfavorable.......................... $ 1,300
2. Actual Hours of Input, at the Actual Rate
Actual Hours of Input, at the
Standard Rate
Standard Hours Allowed for Out-put, at the Stan-
dard Rate(AH × AR) (AH × SR) (SH × SR)$49,300 8,500 hours ×
$6 per hour8,000 hours* ×
$6 per hour= $51,000 = $48,000
Rate Variance,
$1,700 FEfficiency Variance,
$3,000 U
Total Variance, $1,300 U
*20,000 units × 0.4 hour per unit = 8,000 hours
Alternative Solution:Labor Rate Variance = AH (AR – SR)8,500 hours ($5.80 per hour* – $6.00 per hour) = $1,700 F
*$49,300 ÷ 8,500 hours = $5.80 per hourLabor Efficiency Variance = SR (AH – SH)$6 per hour (8,500 hours – 8,000 hours) = $3,000 U
© The McGraw-Hill Companies, Inc., 2008. All rights reserved.Solutions Manual, Chapter 10 525

Exercise 10-12 (continued)3. Actual Hours of
Input, at the Actual Rate
Actual Hours of Input, at the
Standard Rate
Standard Hours Allowed for Out-put, at the Stan-
dard Rate(AH × AR) (AH × SR) (SH × SR)$39,100 8,500 hours ×
$4 per hour8,000 hours ×
$4 per hour= $34,000 = $32,000
Spending Variance,
$5,100 UEfficiency Variance,
$2,000 U
Total Variance, $7,100 U
Alternative Solution:Variable Overhead Spending Variance = AH (AR – SR)8,500 hours ($4.60 per hour* – $4.00 per hour) = $5,100 U
*$39,100 ÷ 8,500 hours = $4.60 per hourVariable Overhead Efficiency Variance = SR (AH – SH)$4 per hour (8,500 hours – 8,000 hours) = $2,000 U
© The McGraw-Hill Companies, Inc., 2008. All rights reserved.526 Managerial Accounting, 12th Edition

Exercise 10-13 (45 minutes)1. Students’ answers may differ in some details from this solution.
© The McGraw-Hill Companies, Inc., 2008. All rights reserved.Solutions Manual, Chapter 10 527
Revenue per employee Sales
Profit marginFinancial
Ratio of billable hours to total hours
Average number of errors per tax re-
turn
Average time needed to prepare a return
Percentage of job offers accepted
Employee morale
Amount of compensation paid above industry aver-
age
Average number of years to be promoted
Cus-tomer
Internal BusinessProcesses
LearningAnd Growth
+ –
+ +
+
–
Customer sat-isfaction witheffectiveness
Customer sat-isfaction with
efficiency
Customer satisfaction
withservice qual-
Number of newcustomers ac-
quired
++ +
+
+ +
+
–

Exercise 10-13 (continued)2. The hypotheses underlying the balanced scorecard are
indicated by the arrows in the diagram. Reading from the bottom of the balanced scorecard, the hypotheses are:° If the amount of compensation paid above the industry
average increases, then the percentage of job offers accepted and the level of employee morale will increase.
° If the average number of years to be promoted decreases, then the percentage of job offers accepted and the level of employee morale will increase.
° If the percentage of job offers accepted increases, then the ratio of billable hours to total hours should increase while the average number of errors per tax return and the average time needed to prepare a return should decrease.
° If employee morale increases, then the ratio of billable hours to total hours should increase while the average number of errors per tax return and the average time needed to prepare a return should decrease.
° If employee morale increases, then the customer satisfaction with service quality should increase.
° If the ratio of billable hours to total hours increases, then the revenue per employee should increase.
° If the average number of errors per tax return decreases, then the customer satisfaction with effectiveness should increase.
° If the average time needed to prepare a return decreases, then the customer satisfaction with efficiency should increase.
° If the customer satisfaction with effectiveness, efficiency and service quality increases, then the number of new customers acquired should increase.
° If the number of new customers acquired increases, then sales should increase.
° If revenue per employee and sales increase, then the profit margin should increase.
© The McGraw-Hill Companies, Inc., 2008. All rights reserved.528 Managerial Accounting, 12th Edition

Exercise 10-13 (continued)Each of these hypotheses can be questioned. For example, Ariel’s customers may define effectiveness as minimizing their tax liability which is not necessarily the same as minimizing the number of errors in a tax return. If some of Ariel’s customers became aware that Ariel overlooked legal tax minimizing opportunities, it is likely that the “customer satisfaction with effectiveness” measure would decline. This decline would probably puzzle Ariel because, although the firm prepared what it believed to be error-free returns, it overlooked opportunities to minimize customers’ taxes. In this example, Ariel’s internal business process measure of the average number of errors per tax return does not fully capture the factors that drive the customer satisfaction. The fact that each of the hypotheses mentioned above can be questioned does not invalidate the balanced scorecard. If the scorecard is used correctly, management will be able to identify which, if any, of the hypotheses are invalid and then modify the balanced scorecard accordingly.
3. The performance measure “total dollar amount of tax refunds generated” would motivate Ariel’s employees to aggressively search for tax minimization opportunities for its clients. However, employees may be too aggressive and recommend questionable or illegal tax practices to clients. This undesirable behavior could generate unfavorable publicity and lead to major problems for the company as well as its customers. Overall, it would probably be unwise to use this performance measure in Ariel’s scorecard.However, if Ariel wanted to create a scorecard measure to capture this aspect of its client service responsibilities, it may make sense to focus the performance measure on its training process. Properly trained employees are more likely to recognize viable tax minimization opportunities.
© The McGraw-Hill Companies, Inc., 2008. All rights reserved.Solutions Manual, Chapter 10 529

Exercise 10-13 (continued)4. Each office’s individual performance should be based on the
scorecard measures only if the measures are controllable by those employed at the branch offices. In other words, it would not make sense to attempt to hold branch office managers responsible for measures such as the percent of job offers accepted or the amount of compensation paid above industry average. Recruiting and compensation decisions are not typically made at the branch offices. On the other hand, it would make sense to measure the branch offices with respect to internal business process, customer, and financial performance. Gathering this type of data would be useful for evaluating the performance of employees at each office.
© The McGraw-Hill Companies, Inc., 2008. All rights reserved.530 Managerial Accounting, 12th Edition

Exercise 10-14 (20 minutes)1. If the total variance is $330 unfavorable, and if the rate
variance is $150 favorable, then the efficiency variance must be $480 unfavorable, since the rate and efficiency variances taken together always equal the total variance.Knowing that the efficiency variance is $480 unfavorable, one approach to the solution would be:
Efficiency Variance = SR (AH – SH)$6 per hour (AH – 420 hours*) = $480 U$6 per hour × AH – $2,520 = $480**$6 per hour × AH = $3,000AH = 500 hours* 168 batches × 2.5 hours per batch = 420 hours
** When used with the formula, unfavorable variances are positive and favorable variances are negative.
2. Knowing that 500 hours of labor time were used during the week, the actual rate of pay per hour can be computed as follows:
Rate Variance = AH (AR – SR)500 hours (AR – $6 per hour) = $150 F500 hours × AR – $3,000 = -$150*500 hours × AR = $2,850AR = $5.70 per hour* When used with the formula, unfavorable variances are
positive and favorable variances are negative.
© The McGraw-Hill Companies, Inc., 2008. All rights reserved.Solutions Manual, Chapter 10 531

Exercise 10-14 (continued)An alternative approach to each solution would be to work from known to unknown data in the columnar model for variance analysis:
Actual Hours of Input, at the Actual Rate
Actual Hours of Input, at the
Standard Rate
Standard Hours Allowed for Out-put, at the Stan-
dard Rate(AH × AR) (AH × SR) (SH × SR)
500 hours × $5.70 per hour
500 hours × $6 per hour*
420 hours§ × $6 per hour*
= $2,850 = $3,000 = $2,520
Rate Variance,
$150 F*Efficiency Variance,
$480 U
Total Variance, $330 U*
§168 batches × 2.5 hours per batch = 420 hours*Given
© The McGraw-Hill Companies, Inc., 2008. All rights reserved.532 Managerial Accounting, 12th Edition

Exercise 10-15 (45 minutes)1. a.
Actual Quantity of Inputs, at
Actual Price
Actual Quantity of Inputs, at
Standard Price
Standard Quan-tity Allowed for Output, at Stan-
dard Price(AQ × AP) (AQ × SP) (SQ × SP)
7,000 feet × $5.75 per foot
7,000 feet × $6.00 per foot
5,250 feet* × $6.00 per foot
= $40,250 = $42,000 = $31,500
Price Variance,
$1,750 F6,000 feet × $6.00 per foot
= $36,000
Quantity Variance, $4,500 U
*1,500 units × 3.5 feet per unit = 5,250 feet
Alternatively:Materials Price Variance = AQ (AP – SP)7,000 feet ($5.75 per foot – $6.00 per foot) = $1,750 FMaterials Quantity Variance = SP (AQ – SQ)$6.00 per foot (6,000 feet – 5,250 feet) = $4,500 U
© The McGraw-Hill Companies, Inc., 2008. All rights reserved.Solutions Manual, Chapter 10 533
Exercise 10-15 (continued)b. The journal entries would be:
Raw Materials (7,000 feet × $6 per foot)..... 42,000Materials Price Variance
(7,000 feet × $0.25 F per foot)............. 1,750Accounts Payable
(7,000 feet × $5.75 per foot)................ 40,250Work in Process (5,250 feet × $6 per foot)... 31,500Materials Quantity Variance
(750 feet U × $6 per foot).......................... 4,500Raw Materials (6,000 feet × $6 per foot) 36,000
2. a.Actual Hours of
Input, at the Actual Rate
Actual Hours of Input, at the
Standard Rate
Standard Hours Allowed for Out-put, at the Stan-
dard Rate(AH × AR) (AH × SR) (SH × SR)
$8,120 725 hours × $10 per hour
600 hours* × $10 per hour
= $7,250 = $6,000
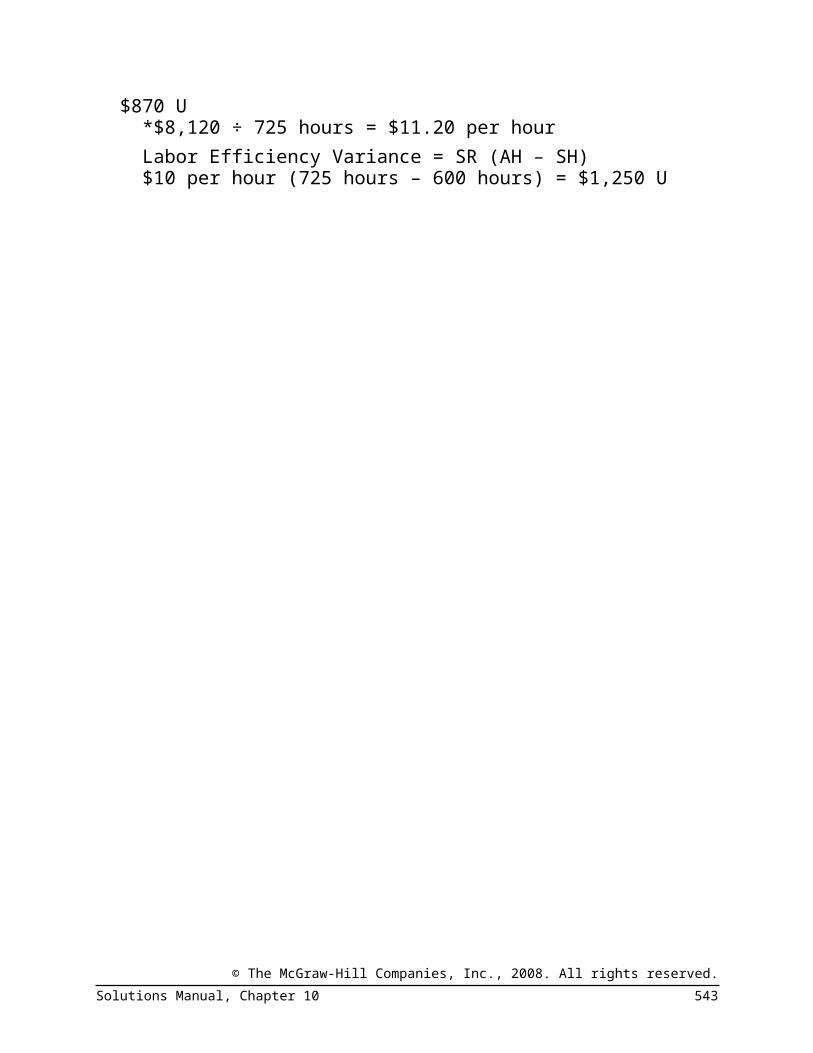
Rate Variance,
$870 UEfficiency Variance,
$1,250 U
Total Variance, $2,120 U
*1,500 units × 0.4 hour per unit = 600 hours
Alternatively:Labor Rate Variance = AH (AR – SR)725 hours ($11.20 per hour* – $10.00 per hour) = $870 U*$8,120 ÷ 725 hours = $11.20 per hourLabor Efficiency Variance = SR (AH – SH)$10 per hour (725 hours – 600 hours) = $1,250 U
© The McGraw-Hill Companies, Inc., 2008. All rights reserved.534 Managerial Accounting, 12th Edition

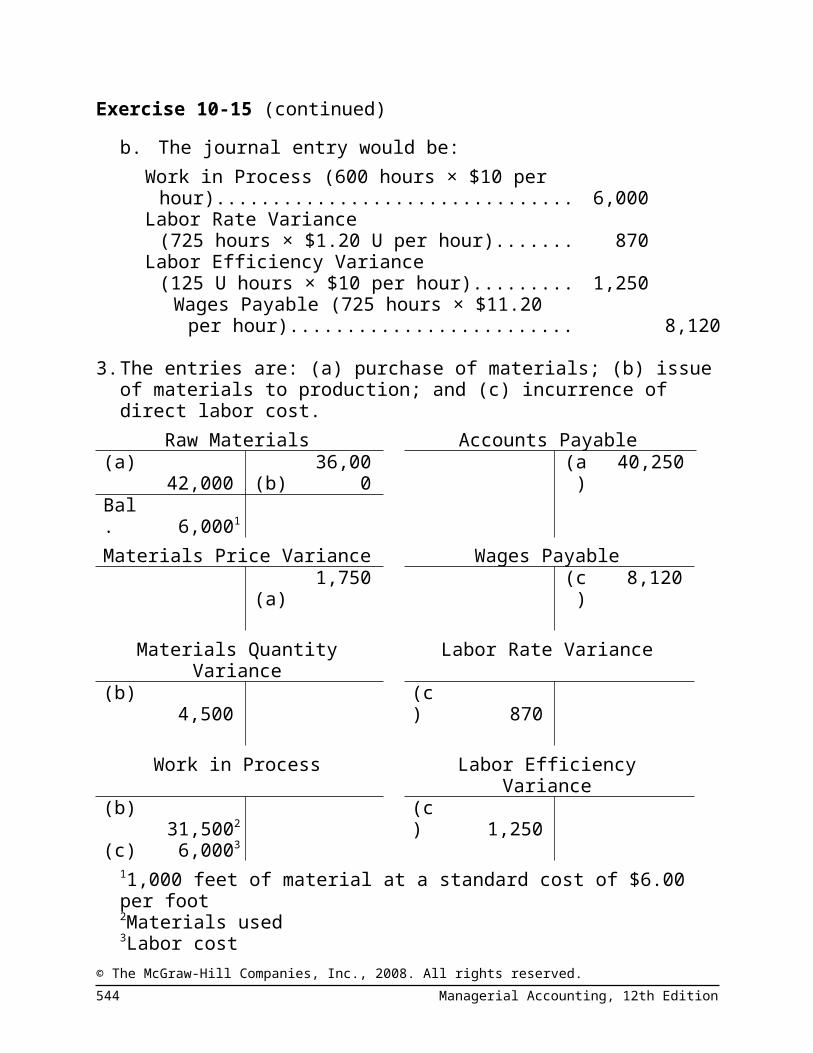
Exercise 10-15 (continued)b. The journal entry would be:
Work in Process (600 hours × $10 per hour)... 6,000Labor Rate Variance
(725 hours × $1.20 U per hour).................... 870Labor Efficiency Variance
(125 U hours × $10 per hour)....................... 1,250Wages Payable (725 hours × $11.20 per
hour)........................................................ 8,120
3. The entries are: (a) purchase of materials; (b) issue of materials to production; and (c) incurrence of direct labor cost.
Raw Materials Accounts Payable(a)
42,000 (b)36,00
0(a)
40,250
Bal. 6,0001
Materials Price Variance Wages Payable
(a)1,750 (c
)8,120
Materials Quantity Variance Labor Rate Variance(b) 4,500 (c) 870
Work in Process Labor Efficiency Variance(b) 31,5002 (c) 1,250(c) 6,0003
11,000 feet of material at a standard cost of $6.00 per foot2Materials used3Labor cost
© The McGraw-Hill Companies, Inc., 2008. All rights reserved.Solutions Manual, Chapter 10 535
Problem 10-16 (45 minutes)1. a.
Actual Quantity of Inputs, at
Actual Price
Actual Quantity of Inputs, at
Standard Price
Standard Quantity Allowed for Out-put, at Standard
Price(AQ × AP) (AQ × SP) (SQ × SP)
25,000 pounds × $2.95 per pound
25,000 pounds × $2.50 per pound
20,000 pounds* ×
$2.50 per pound= $73,750 = $62,500 = $50,000
Price Variance,
$11,250 U19,800 pounds × $2.50 per pound
= $49,500
Quantity Variance, $500 F
*5,000 ingots × 4.0 pounds per ingot = 20,000 pounds
Alternatively:Materials Price Variance = AQ (AP – SP)25,000 pounds ($2.95 per pound – $2.50 per pound) =
$11,250 UMaterials Quantity Variance = SP (AQ – SQ)$2.50 per pound (19,800 pounds – 20,000 pounds) = $500 F
© The McGraw-Hill Companies, Inc., 2008. All rights reserved.536 Managerial Accounting, 12th Edition

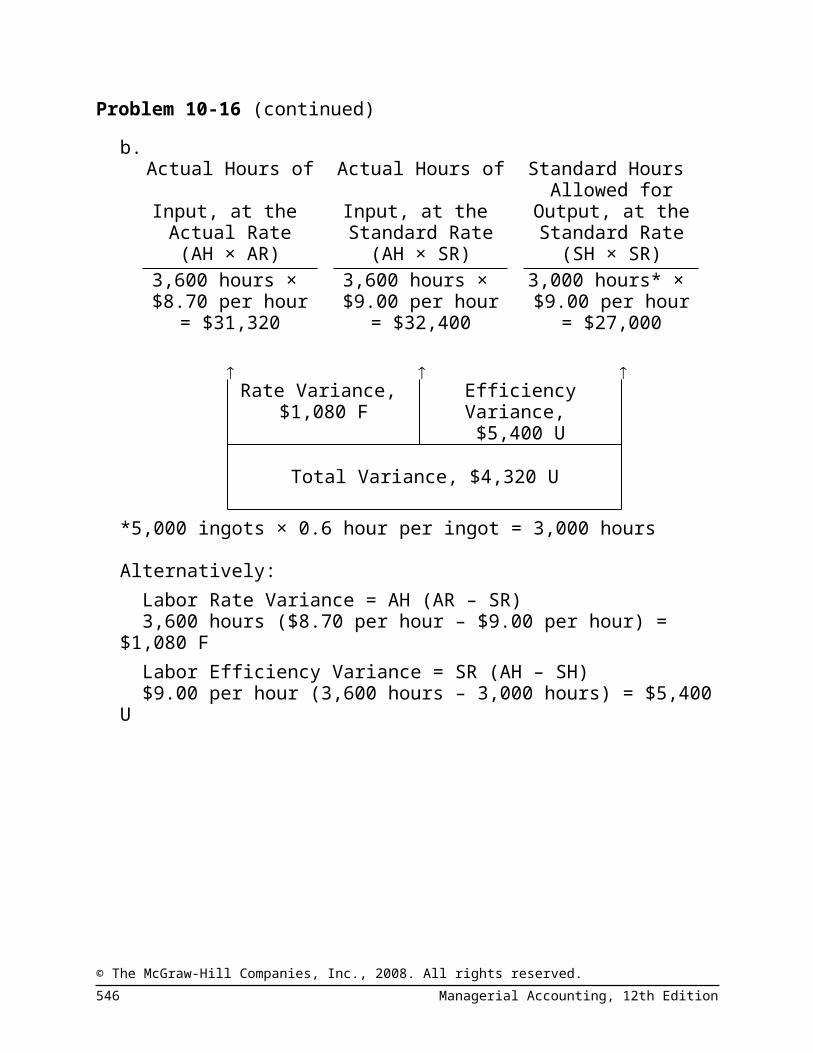
Problem 10-16 (continued)b.
Actual Hours of Input, at the Actual Rate
Actual Hours of Input, at the
Standard Rate
Standard Hours Allowed for Out-put, at the Stan-
dard Rate(AH × AR) (AH × SR) (SH × SR)
3,600 hours × $8.70 per hour
3,600 hours × $9.00 per hour
3,000 hours* × $9.00 per hour
= $31,320 = $32,400 = $27,000
Rate Variance,
$1,080 FEfficiency Variance,
$5,400 U
Total Variance, $4,320 U
*5,000 ingots × 0.6 hour per ingot = 3,000 hours
Alternatively:Labor Rate Variance = AH (AR – SR)3,600 hours ($8.70 per hour – $9.00 per hour) = $1,080 FLabor Efficiency Variance = SR (AH – SH)$9.00 per hour (3,600 hours – 3,000 hours) = $5,400 U
© The McGraw-Hill Companies, Inc., 2008. All rights reserved.Solutions Manual, Chapter 10 537
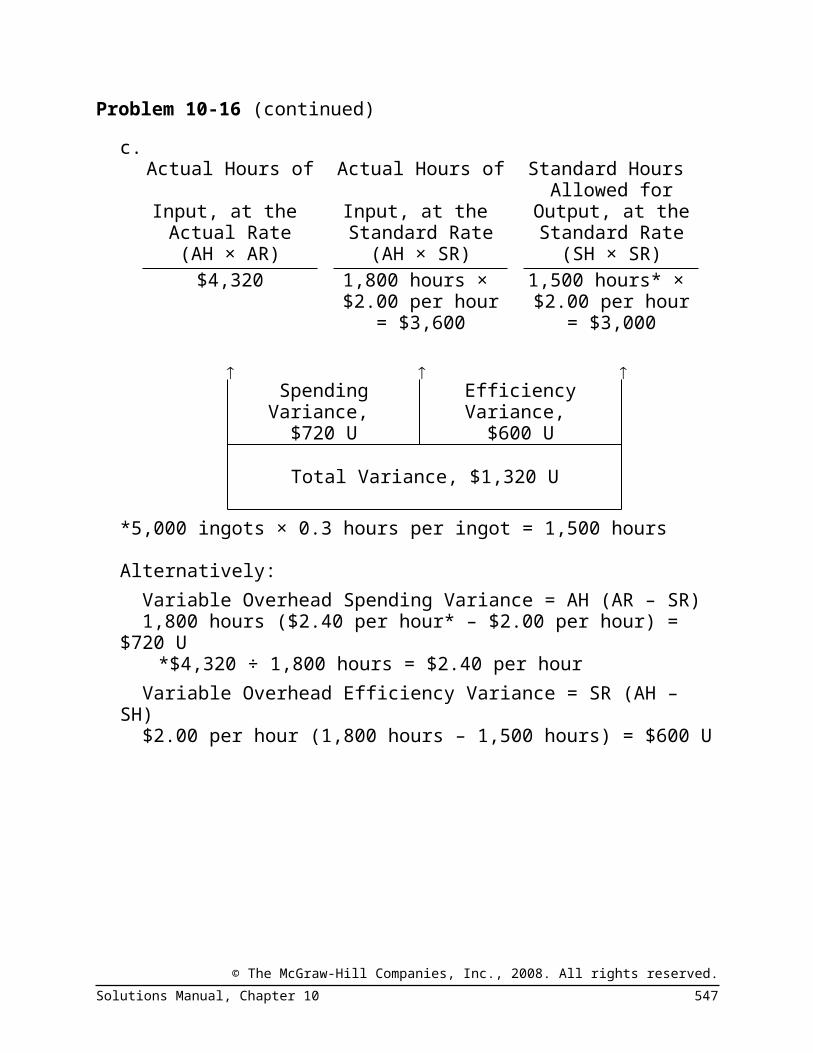
Problem 10-16 (continued)c.
Actual Hours of Input, at the Actual Rate
Actual Hours of Input, at the
Standard Rate
Standard Hours Allowed for Out-put, at the Stan-
dard Rate(AH × AR) (AH × SR) (SH × SR)
$4,320 1,800 hours × $2.00 per hour
1,500 hours* × $2.00 per hour
= $3,600 = $3,000
Spending Variance,
$720 UEfficiency Variance,
$600 U
Total Variance, $1,320 U
*5,000 ingots × 0.3 hours per ingot = 1,500 hours
Alternatively:Variable Overhead Spending Variance = AH (AR – SR)1,800 hours ($2.40 per hour* – $2.00 per hour) = $720 U
*$4,320 ÷ 1,800 hours = $2.40 per hourVariable Overhead Efficiency Variance = SR (AH – SH)$2.00 per hour (1,800 hours – 1,500 hours) = $600 U
© The McGraw-Hill Companies, Inc., 2008. All rights reserved.538 Managerial Accounting, 12th Edition

Problem 10-16 (continued)2. Summary of variances:
Material price variance..................... $11,250 UMaterial quantity variance............... 500 FLabor rate variance.......................... 1,080 FLabor efficiency variance................. 5,400 UVariable overhead spending vari-
ance............................................... 720 UVariable overhead efficiency vari-
ance............................................... 600 UNet variance..................................... $16,390 U
The net unfavorable variance of $16,390 for the month caused the plant’s variable cost of goods sold to increase from the budgeted level of $80,000 to $96,390:
Budgeted cost of goods sold at $16 per in-got............................................................. $80,000
Add the net unfavorable variance (as above)........................................................ 16,390
Actual cost of goods sold.............................. $96,390This $16,390 net unfavorable variance also accounts for the difference between the budgeted net operating income and the actual net loss for the month.
Budgeted net operating income.................. $15,000Deduct the net unfavorable variance added
to cost of goods sold for the month........... 16,390 Net operating loss........................................ $(1,390)
3. The two most significant variances are the materials price variance and the labor efficiency variance. Possible causes of the variances include:
Materials Price Vari-ance:
Outdated standards, uneconomical quantity purchased, higher quality materials, high-cost method of transport.
Labor Efficiency Vari-ance:
Poorly trained workers, poor quality materials, faulty equipment, work interruptions, inaccurate standards,
© The McGraw-Hill Companies, Inc., 2008. All rights reserved.Solutions Manual, Chapter 10 539

insufficient demand.
© The McGraw-Hill Companies, Inc., 2008. All rights reserved.540 Managerial Accounting, 12th Edition

Problem 10-17 (45 minutes)1. The standard quantity of plates allowed for tests performed
during the month would be:Smears.............................. 2,700Blood tests......................... 900 Total................................... 3,600Plates per test................... × 3 Standard quantity allowed. 10,800
The variance analysis for plates would be:Actual Quantity of
Inputs, at Actual Price
Actual Quantity of Inputs, at
Standard Price
Standard Quantity Allowed for Out-put, at Standard
Price(AQ × AP) (AQ × SP) (SQ × SP)$38,400 16,000 plates ×
$2.50 per plate10,800 plates × $2.50 per plate
= $40,000 = $27,000
Price Variance,
$1,600 F14,000 plates × $2.50 per plate
= $35,000
Quantity Variance, $8,000 U
Alternative Solution:Materials Price Variance = AQ (AP – SP)16,000 plates ($2.40 per plate* – $2.50 per plate) = $1,600 F
*$38,400 ÷ 16,000 plates = $2.40 per plate.Materials Quantity Variance = SP (AQ – SQ)$2.50 per plate (14,000 plates – 10,800 plates) = $8,000 U
© The McGraw-Hill Companies, Inc., 2008. All rights reserved.Solutions Manual, Chapter 10 541

Problem 10-17 (continued)Note that all of the price variance is due to the hospital’s 4% quantity discount. Also note that the $8,000 quantity variance for the month is equal to nearly 30% of the standard cost allowed for plates. This variance may be the result of using too many assistants in the lab.
2. a. The standard hours allowed for tests performed during the month would be:Smears: 0.3 hour per test × 2,700
tests.................................................. 810Blood tests: 0.6 hour per test × 900
tests.................................................. 540 Total standard hours allowed............... 1,350The variance analysis of labor would be:Actual Hours of
Input, at the Actual Rate
Actual Hours of Input, at the
Standard Rate
Standard Hours Allowed for Out-put, at the Stan-
dard Rate(AH × AR) (AH × SR) (SH × SR)$18,450 1,800 hours ×
$12 per hour1,350 hours × $12 per hour
= $21,600 = $16,200
Rate Variance,
$3,150 FEfficiency Variance,
$5,400 U
Total Variance, $2,250 U
Alternative Solution:Labor Rate Variance = AH (AR – SR)1,800 hours ($10.25 per hour* – $12.00 per hour) = $3,150 F
*$18,450 ÷ 1,800 hours = $10.25 per hourLabor Efficiency Variance = SR (AH – SH)$12 per hour (1,800 hours – 1,350 hours) = $5,400 U
© The McGraw-Hill Companies, Inc., 2008. All rights reserved.542 Managerial Accounting, 12th Edition
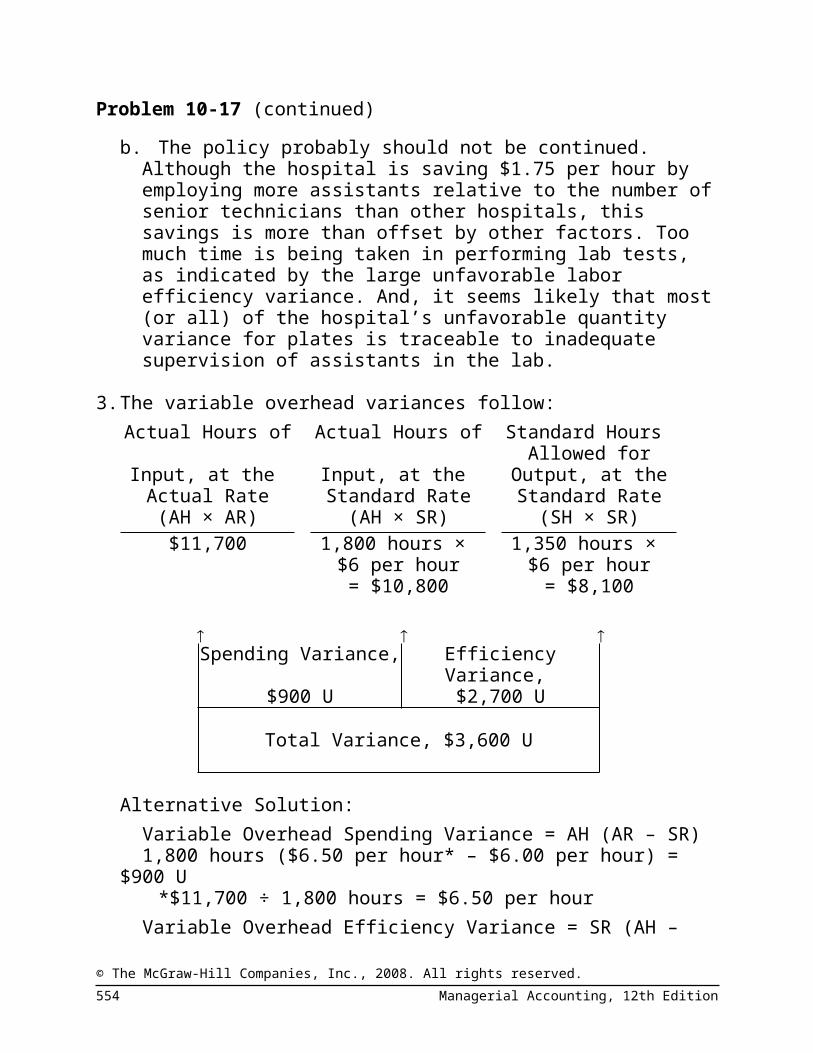
Problem 10-17 (continued)b. The policy probably should not be continued. Although the
hospital is saving $1.75 per hour by employing more assistants relative to the number of senior technicians than other hospitals, this savings is more than offset by other factors. Too much time is being taken in performing lab tests, as indicated by the large unfavorable labor efficiency variance. And, it seems likely that most (or all) of the hospital’s unfavorable quantity variance for plates is traceable to inadequate supervision of assistants in the lab.
3. The variable overhead variances follow:Actual Hours of
Input, at the Actual Rate
Actual Hours of Input, at the
Standard Rate
Standard Hours Allowed for Out-put, at the Stan-
dard Rate(AH × AR) (AH × SR) (SH × SR)$11,700 1,800 hours ×
$6 per hour1,350 hours ×
$6 per hour= $10,800 = $8,100
Spending Variance,
$900 UEfficiency Variance,
$2,700 U
Total Variance, $3,600 U
Alternative Solution:Variable Overhead Spending Variance = AH (AR – SR)1,800 hours ($6.50 per hour* – $6.00 per hour) = $900 U
*$11,700 ÷ 1,800 hours = $6.50 per hourVariable Overhead Efficiency Variance = SR (AH – SH)$6 per hour (1,800 hours – 1,350 hours) = $2,700 U
Yes, the two variances are related. Both are computed by comparing actual labor time to the standard hours allowed for the output of the period. Thus, if there is an unfavorable labor
© The McGraw-Hill Companies, Inc., 2008. All rights reserved.Solutions Manual, Chapter 10 543
efficiency variance, there will also be an unfavorable variable overhead efficiency variance.
© The McGraw-Hill Companies, Inc., 2008. All rights reserved.544 Managerial Accounting, 12th Edition

Problem 10-18 (60 minutes)1. a.
Actual Quantity of Inputs, at
Actual Price
Actual Quantity of Inputs, at
Standard Price
Standard Quantity Allowed for Out-put, at Standard
Price(AQ × AP) (AQ × SP) (SQ × SP)
21,120 yards × $3.35 per yard
21,120 yards × $3.60 per yard
19,200 yards* × $3.60 per yard
= $70,752 = $76,032 = $69,120
Price Variance,
$5,280 FQuantity Variance,
$6,912 U
Total Variance, $1,632 U
*4,800 units × 4.0 yards per unit = 19,200 yards
Alternatively:Materials Price Variance = AQ (AP – SP)21,120 yards ($3.35 per yard – $3.60 per yard) = $5,280 FMaterials Quantity Variance = SP (AQ – SQ)$3.60 per yard (21,120 yards – 19,200 yards) = $6,912 U
b.Raw Materials (21,120 yards @ $3.60 per
yard).............................................................. 76,032Materials Price Variance
(21,120 yards @ $0.25 per yard F)........... 5,280Accounts Payable
(21,120 yards @ $3.35 per yard)..............70,75
2
Work in Process (19,200 yards @ $3.60 per yard).............................................................. 69,120
Materials Quantity Variance (1,920 yards U @ $3.60 per yard)................. 6,912
Raw Materials (21,120 yards @ $3.60 per yard).........................................................
76,032
© The McGraw-Hill Companies, Inc., 2008. All rights reserved.Solutions Manual, Chapter 10 545
Problem 10-18 (continued)2. a.
Actual Hours of Input, at the Actual Rate
Actual Hours of Input, at the
Standard Rate
Standard Hours Allowed for Out-put, at the Stan-
dard Rate(AH × AR) (AH × SR) (SH × SR)
6,720 hours* × $4.85 per hour
6,720 hours × $4.50 per hour
7,680 hours** × $4.50 per hour
= $32,592 = $30,240 = $34,560
Rate Variance,
$2,352 UEfficiency Variance,
$4,320 F
Total Variance, $1,968 F
*4,800 units × 1.4 hours per unit = 6,720 hours
**4,800 units × 1.6 hours per unit = 7,680
hours
Alternatively:Labor Rate Variance = AH (AR – SR)6,720 hours ($4.85 per hour – $4.50 per hour) = $2,352 ULabor Efficiency Variance = SR (AH – SH)$4.50 per hour (6,720 hours – 7,680 hours) = $4,320 F
b.Work in Process (7,680 hours @ $4.50 per
hour)............................................................. 34,560Labor Rate Variance
(6,720 hours @ $0.35 per hour U)................. 2,352Labor Efficiency Variance
(960 hours F @ $4.50 per hour)............... 4,320Wages Payable (6,720 hours @ $4.85 per
hour)......................................................... 32,592
© The McGraw-Hill Companies, Inc., 2008. All rights reserved.546 Managerial Accounting, 12th Edition
Problem 10-18 (continued)3. Actual Hours of
Input, at the Actual Rate
Actual Hours of Input, at the
Standard Rate
Standard Hours Allowed for Out-put, at the Stan-
dard Rate(AH × AR) (AH × SR) (SH × SR)
6,720 hours × $2.15 per hour
6,720 hours × $1.80 per hour
7,680 hours × $1.80 per hour
= $14,448 = $12,096 = $13,824
Spending Variance,
$2,352 UEfficiency Variance,
$1,728 F
Total Variance, $624 U
Alternatively:Variable Overhead Spending Variance = AH (AR – SR)6,720 hours ($2.15 per hour – $1.80 per hour) = $2,352 UVariable Overhead Efficiency Variance = SR (AH – SH)$1.80 per hour (6,720 hours – 7,680 hours) = $1,728 F
4. No. This total variance is made up of several quite large individual variances, some of which may warrant investigation. A summary of variances is given below:Materials:
Price variance............................. $5,280 FQuantity variance....................... 6,912 U $1,632 U
Labor:Rate variance.............................. 2,352 UEfficiency variance...................... 4,320 F 1,968 F
Variable overhead:Spending variance...................... 2,352 UEfficiency variance...................... 1,728 F 624 U
Net unfavorable variance.............. $ 288 U
© The McGraw-Hill Companies, Inc., 2008. All rights reserved.Solutions Manual, Chapter 10 547

Problem 10-18 (continued)5. The variances have many possible causes. Some of the more
likely causes include:
Materials variances:Favorable price variance: Good price, inaccurate standards, inferior quality materials, unusual discount due to quantity purchased, drop in market price.Unfavorable quantity variance: Carelessness, poorly adjusted machines, unskilled workers, inferior quality materials, inaccurate standards.
Labor variances:Unfavorable rate variance: Use of highly skilled workers, change in wage rates, inaccurate standards, overtime.Favorable efficiency variance: Use of highly skilled workers, high-quality materials, new equipment, inaccurate standards.
Variable overhead variances:Unfavorable spending variance: Increase in costs, inaccurate standards, waste, theft, spillage, purchases in uneconomical lots.Favorable efficiency variance: Same as for labor efficiency variance.
© The McGraw-Hill Companies, Inc., 2008. All rights reserved.548 Managerial Accounting, 12th Edition

Problem 10-19 (45 minutes)1. a. In the solution below, the materials price variance is
computed on the entire amount of materials purchased, whereas the materials quantity variance is computed only on the amount of materials used in production:Actual Quantity of
Inputs, at Actual Price
Actual Quantity of Inputs, at
Standard Price
Standard Quan-tity Allowed for Output, at Stan-
dard Price(AQ × AP) (AQ × SP) (SQ × SP)$46,000 8,000 pounds ×
$6.00 per pound4,500 pounds* × $6.00 per pound
= $48,000 = $27,000
Price Variance,
$2,000 F6,000 pounds × $6.00 per pound
= $36,000
Quantity Variance, $9,000 U
*3,000 units × 1.5 pounds per unit = 4,500 pounds
Alternatively:Materials Price Variance = AQ (AP – SP)8,000 pounds ($5.75 per pound* – $6.00 per pound) =
$2,000 F*$46,000 ÷ 8,000 pounds = $5.75 per pound
Materials Quantity Variance = SP (AQ – SQ)$6 per pound (6,000 pounds – 4,500 pounds) = $9,000 U
b. No, the contract should probably not be signed. Although the new supplier is offering the material at only $5.75 per pound, it does not seem to hold up well in production as shown by the large materials quantity variance. Moreover, the company still has 2,000 pounds of unused material in the warehouse; if these materials do as poorly in production as
© The McGraw-Hill Companies, Inc., 2008. All rights reserved.Solutions Manual, Chapter 10 549

the 6,000 pounds already used, the total quantity variance on the 8,000 pounds of materials purchased will be very large.
© The McGraw-Hill Companies, Inc., 2008. All rights reserved.550 Managerial Accounting, 12th Edition

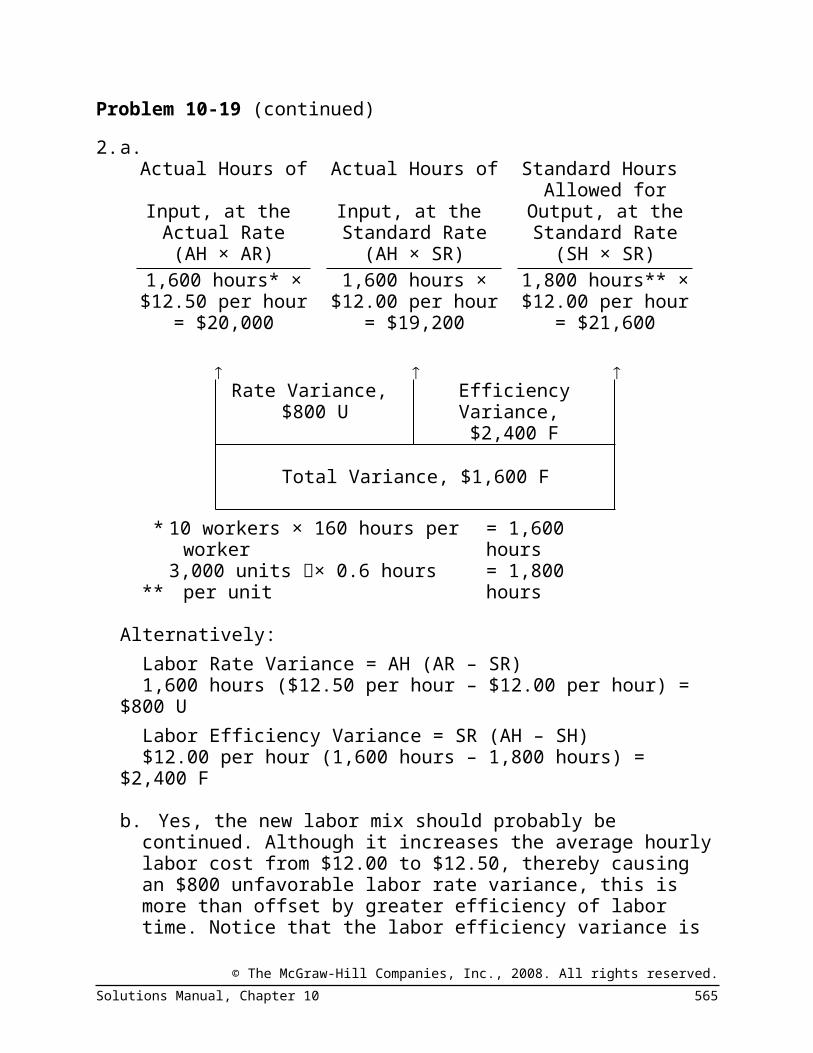
Problem 10-19 (continued)2. a.
Actual Hours of Input, at the Actual Rate
Actual Hours of Input, at the
Standard Rate
Standard Hours Allowed for Out-put, at the Stan-
dard Rate(AH × AR) (AH × SR) (SH × SR)
1,600 hours* × $12.50 per hour
1,600 hours × $12.00 per hour
1,800 hours** × $12.00 per hour
= $20,000 = $19,200 = $21,600
Rate Variance,
$800 UEfficiency Variance,
$2,400 F
Total Variance, $1,600 F
* 10 workers × 160 hours per worker = 1,600 hours
**3,000 units × 0.6 hours per
unit = 1,800 hours
Alternatively:Labor Rate Variance = AH (AR – SR)1,600 hours ($12.50 per hour – $12.00 per hour) = $800 ULabor Efficiency Variance = SR (AH – SH)$12.00 per hour (1,600 hours – 1,800 hours) = $2,400 F
b. Yes, the new labor mix should probably be continued. Although it increases the average hourly labor cost from $12.00 to $12.50, thereby causing an $800 unfavorable labor rate variance, this is more than offset by greater efficiency of labor time. Notice that the labor efficiency variance is $2,400 favorable. Thus, the new labor mix reduces overall labor costs.
© The McGraw-Hill Companies, Inc., 2008. All rights reserved.Solutions Manual, Chapter 10 551

Problem 10-19 (continued)3. Actual Hours of
Input, at the Actual Rate
Actual Hours of Input, at the
Standard Rate
Standard Hours Allowed for Out-put, at the Stan-
dard Rate(AH × AR) (AH × SR) (SH × SR)
$3,600 1,600 hours × $2.50 per hour
1,800 hours × $2.50 per hour
= $4,000 = $4,500
Spending Variance,
$400 FEfficiency Variance,
$500 F
Total Variance, $900 F
Alternatively:Variable Overhead Spending Variance = AH (AR – SR)1,600 hours ($2.25 per hour* – $2.50 per hour) = $400 F
*$3,600 ÷ 1,600 hours = $2.25 per hourVariable Overhead Efficiency Variance = SR (AH – SH)$2.50 per hour (1,600 hours – 1,800 hours) = $500 F
Both the labor efficiency variance and the variable overhead efficiency variance are computed by comparing actual labor-hours to standard labor-hours. Thus, if the labor efficiency variance is favorable, then the variable overhead efficiency variance will be favorable as well.
© The McGraw-Hill Companies, Inc., 2008. All rights reserved.552 Managerial Accounting, 12th Edition

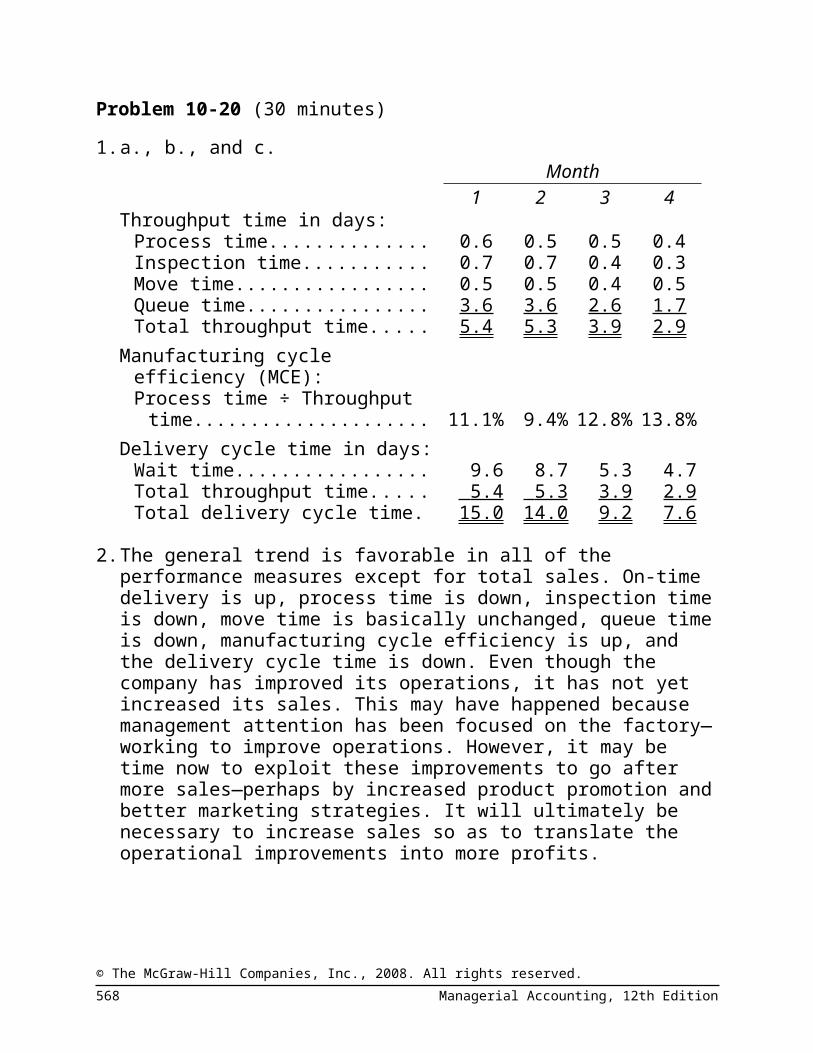
Problem 10-20 (30 minutes)1. a., b., and c.
Month1 2 3 4
Throughput time in days:Process time.............................. 0.6 0.5 0.5 0.4Inspection time......................... 0.7 0.7 0.4 0.3Move time................................. 0.5 0.5 0.4 0.5Queue time............................... 3.6 3.6 2.6 1.7Total throughput time................ 5.4 5.3 3.9 2.9
Manufacturing cycle efficiency (MCE):Process time ÷ Throughput
time........................................ 11.1% 9.4% 12.8% 13.8%Delivery cycle time in days:
Wait time................................... 9.6 8.7 5.3 4.7Total throughput time................ 5.4 5.3 3.9 2.9Total delivery cycle time........... 15.0 14.0 9.2 7.6
2. The general trend is favorable in all of the performance measures except for total sales. On-time delivery is up, process time is down, inspection time is down, move time is basically unchanged, queue time is down, manufacturing cycle efficiency is up, and the delivery cycle time is down. Even though the company has improved its operations, it has not yet increased its sales. This may have happened because management attention has been focused on the factory—working to improve operations. However, it may be time now to exploit these improvements to go after more sales—perhaps by increased product promotion and better marketing strategies. It will ultimately be necessary to increase sales so as to translate the operational improvements into more profits.
© The McGraw-Hill Companies, Inc., 2008. All rights reserved.Solutions Manual, Chapter 10 553
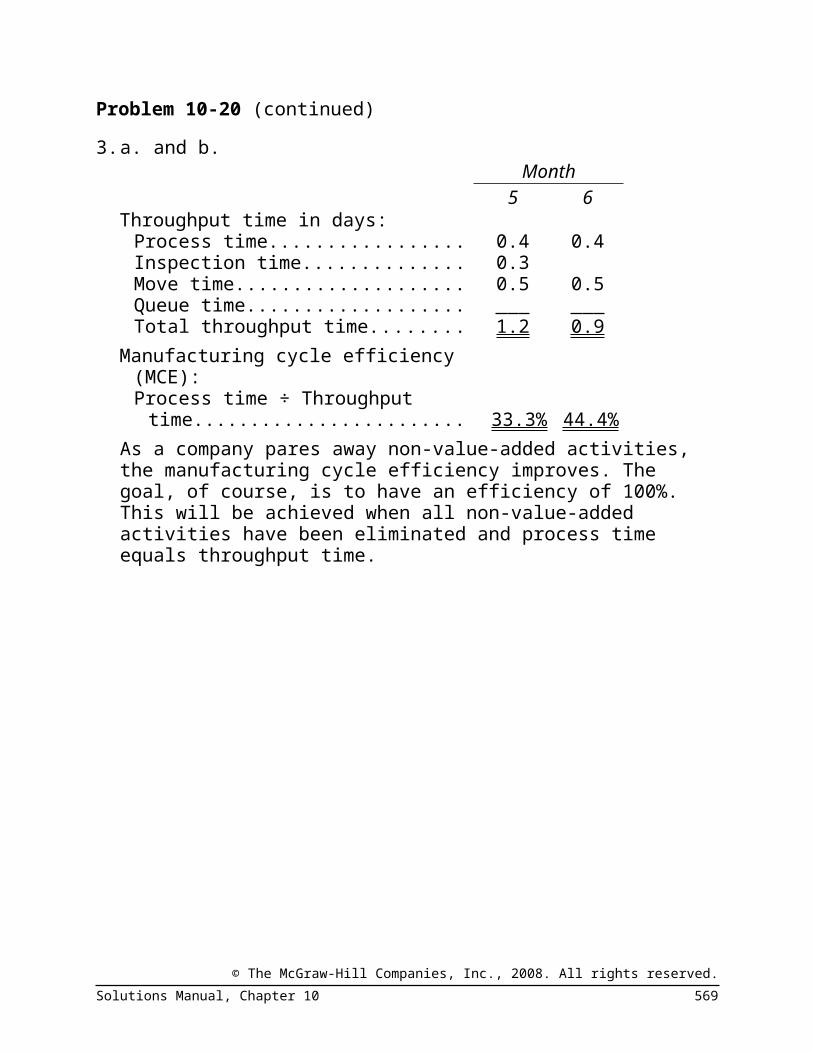
Problem 10-20 (continued)3. a. and b.
Month5 6
Throughput time in days:Process time.................................... 0.4 0.4Inspection time............................... 0.3Move time....................................... 0.5 0.5Queue time..................................... Total throughput time...................... 1.2 0.9
Manufacturing cycle efficiency (MCE):Process time ÷ Throughput time..... 33.3% 44.4%
As a company pares away non-value-added activities, the manufacturing cycle efficiency improves. The goal, of course, is to have an efficiency of 100%. This will be achieved when all non-value-added activities have been eliminated and process time equals throughput time.
© The McGraw-Hill Companies, Inc., 2008. All rights reserved.554 Managerial Accounting, 12th Edition
Problem 10-21 (45 minutes)The answers below are not the only possible answers. Ingenious people can figure out many different ways of making performance look better even though it really isn’t. This is one of the reasons for a balanced scorecard. By having a number of different mea-sures that ultimately are linked to overall financial goals, “gam-ing” the system is more difficult.
1. Speed-to-market can be improved by taking on less ambitious projects. Instead of working on major product innovations that require a great deal of time and effort, R&D may choose to work on small, incremental improvements in existing products. There is also a danger that in the rush to push products out the door, the products will be inadequately tested and developed.
2. Performance measures that are ratios or percentages present special dangers. A ratio can be increased either by increasing the numerator or by decreasing the denominator. Usually, the intention is to increase the numerator in the ratio, but a manager may react by decreasing the denominator instead. In this case (which actually happened), the managers pulled telephones out of the high-crime areas. This eliminated the problem for the managers, but was not what the CEO or the city officials had intended. They wanted the phones fixed, not eliminated.
3. In real life, the production manager simply added several weeks to the delivery cycle time. In other words, instead of promising to deliver an order in four weeks, the manager promised to deliver in six weeks. This increase in delivery cycle time did not, of course, please customers and drove some business away, but it dramatically improved the percentage of orders delivered on time.
© The McGraw-Hill Companies, Inc., 2008. All rights reserved.Solutions Manual, Chapter 10 555

Problem 10-21 (continued)4. As stated above, ratios can be improved by changing either the
numerator or the denominator. Managers who are under pressure to increase the revenue per employee may find it easier to eliminate employees than to increase revenues. Of course, eliminating employees may reduce total revenues and total profits, but the revenue per employee will increase as long as the percentage decline in revenues is less than the percentage cut in number of employees. Suppose, for example, that a manager is responsible for business units with a total of 1,000 employees, $120 million in revenues, and profits of $2 million. Further suppose that a manager can eliminate one of these business units that has 200 employees, revenues of $10 million, and profits of $1.2 million.
Before eliminat-ing the busi-
ness unit
After eliminat-ing the busi-
ness unitTotal revenue............ $120,000,000 $110,000,000Total employees........ 1,000 800Revenue per em-
ployee..................... $120,000 $137,500Total profits............... $2,000,000 $800,000
As these examples illustrate, performance measures should be selected with a great deal of care and managers should avoid placing too much emphasis on any one performance measure.
© The McGraw-Hill Companies, Inc., 2008. All rights reserved.556 Managerial Accounting, 12th Edition

Problem 10-22 (30 minutes)1. Lanolin quantity standard:
Required per 100-liter batch....................... 100 litersLoss from rejected batches (100 liters ×
1/20)......................................................... 5 litersTotal quantity per good batch..................... 105 liters
Alcohol quantity standard:Required per 100-liter batch....................... 8.0 litersLoss from rejected batches (8 liters ×
1/20)......................................................... 0.4 litersTotal quantity per good batch..................... 8.4 liters
Lilac powder quantity standard:Required per 100-liter batch....................... 200 gramsLoss from rejected batches (200 grams ×
1/20)......................................................... 10 gramsTotal quantity per good batch..................... 210 grams
2. Direct labor quantity standard:Total hours per day..................................... 8 hoursLess lunch, rest breaks, and cleanup.......... 2 hoursProductive time each day............................ 6 hours
Time required per batch.............................. 120 minutesLunch, rest breaks, and cleanup
(120 minutes ÷ 3 batches)....................... 40 minutesTotal............................................................ 160 minutesLoss from rejected batches
(160 minutes × 1/20)............................... 8 minutesTotal time per good batch........................... 168 minutes
© The McGraw-Hill Companies, Inc., 2008. All rights reserved.Solutions Manual, Chapter 10 557

Problem 10-22 (continued)3. Standard cost card:
Standard Quantity or Time per
BatchStandard Price
or Rate
Standard Cost per
Batch
Lanolin.................105
liters€16
per liter€1,680.0
0Alcohol................. 8.4 liters €2 per liter 16.80Lilac powder........ 210 grams €1 per gram 210.00Direct labor.......... 168 minutes €0.20 per minute 33.60 Total standard
cost per good batch.................
€ 1,940.4 0
© The McGraw-Hill Companies, Inc., 2008. All rights reserved.558 Managerial Accounting, 12th Edition

Problem 10-23 (60 minutes)1. Both companies view training as important; both companies
need to leverage technology to succeed in the marketplace; and both companies are concerned with minimizing defects. There are numerous differences between the two companies. For example, Applied Pharmaceuticals is a product-focused company and Destination Resorts International (DRI) is a service-focused company. Applied Pharmaceuticals’ training resources are focused on their engineers because they hold the key to the success of the organization. DRI’s training resources are focused on their front-line employees because they hold the key to the success of their organization. Applied Pharmaceuticals’ technology investments are focused on supporting the innovation that is inherent in the product development side of the business. DRI’s technology investments are focused on supporting the day-to-day execution that is inherent in the customer interface side of the business. Applied Pharmaceuticals defines a defect from an internal manufacturing standpoint, while DRI defines a defect from an external customer interaction standpoint.
© The McGraw-Hill Companies, Inc., 2008. All rights reserved.Solutions Manual, Chapter 10 559

Problem 10-23 (continued)2. Students’ answers may differ in some details from this solution.
Applied Pharmaceuticals
© The McGraw-Hill Companies, Inc., 2008. All rights reserved.560 Managerial Accounting, 12th Edition
Return on Stockholders’ Eq-
uity
Financial
Customer perception of first-to-market capa-
bility
Customer perception of product quality
Customer
R&D Yield Defect ratesInternalBusinessProcess
Dollars invested in engineering technol-
ogy
Percentage of job offers accepted
Dollars invested in engi-neering training per engi-
neer
LearningandGrowth
+
+ +
+ –
+ +
+

Problem 10-23 (continued)
Destination Resorts International
© The McGraw-Hill Companies, Inc., 2008. All rights reserved.Solutions Manual, Chapter 10 561
SalesFinancial
Number of repeat customersCus-tomer
Percentage of error-free repeat
customer check-ins
Average time to resolve customer
complaint
Room cleanli-ness
InternalBusinessProcess
Number of employees receiving database
training
Employee turnover
Survey of employee
morale
LearningandGrowth –
+
+
+
+
–
+
+

Problem 10-23 (continued)3. The hypotheses underlying the balanced scorecards are
indicated by the arrows in each diagram. Reading from the bottom of each balanced scorecard, the hypotheses are:
Applied Pharmaceuticalso If the dollars invested in engineering technology increase,
then the R&D yield will increase.o If the percentage of job offers accepted increases, then the
R&D yield will increase.o If the dollars invested in engineering training per engineer
increase, then the R&D yield will increase.o If the R&D yield increases, then customer perception of first-
to-market capability will increase.o If the defects per million opportunities decrease, then the
customer perception of product quality will increase.o If the customer perception of first-to-market capability in-
creases, then the return on stockholders’ equity will in-crease.
o If the customer perception of product quality increases, then the return on stockholders’ equity will increase.
Destination Resort Internationalo If the employee turnover decreases, then the percentage of
error-free repeat customer check-ins and room cleanliness will increase and the average time to resolve customer com-plaints will decrease.
o If the number of employees receiving database training in-creases, then the percentage of error-free repeat customer check-ins will increase.
o If employee morale increases, then the percentage of error-free repeat customer check-ins and room cleanliness will in-crease and the average time to resolve customer complaints will decrease.
o If the percentage of error-free repeat customer check-ins in-creases, then the number of repeat customers will increase.
o If the room cleanliness increases, then the number of repeat customers will increase.
© The McGraw-Hill Companies, Inc., 2008. All rights reserved.562 Managerial Accounting, 12th Edition

o If the average time to resolve customer complaints de-creases, then the number of repeat customers will increase.
o If the number of repeat customers increases, then sales will increase.
© The McGraw-Hill Companies, Inc., 2008. All rights reserved.Solutions Manual, Chapter 10 563
Problem 10-23 (continued)Each of these hypotheses is questionable to some degree. For example, in the case of Applied Pharmaceuticals, R&D yield is not the sole driver of the customers’ perception of first-to-market capability. More specifically, if Applied Pharmaceuticals experimented with nine possible drug compounds in year one and three of those compounds proved to be successful in the marketplace it would result in an R&D yield of 33%. If in year two, it experimented with four possible drug compounds and two of those compounds proved to be successful in the marketplace it would result in an R&D yield of 50%. While the R&D yield has increased from year one to year two, it is quite possible that the customer’s perception of first-to-market capability would decrease. The fact that each of the hypotheses mentioned above can be questioned does not invalidate the balanced scorecard. If the scorecard is used correctly, management will be able to identify which, if any, of the hypotheses are invalid and the balanced scorecard can then be appropriately modified.
© The McGraw-Hill Companies, Inc., 2008. All rights reserved.564 Managerial Accounting, 12th Edition
Problem 10-24 (30 minutes)1. a., b., and c.
Month1 2 3 4
Throughput time in days:Process time................................ 0.6 0.6 0.6 0.6Inspection time........................... 0.1 0.3 0.6 0.8Move time................................... 1.4 1.3 1.3 1.4Queue time................................. 5.6 5.7 5.6 5.7Total throughput time.................. 7.7 7.9 8.1 8.5
Manufacturing cycle efficiency (MCE):Process time ÷ Throughput time. 7.8% 7.6% 7.4% 7.1%
Delivery cycle time in days:Wait time..................................... 16.7 15.2 12.3 9.6Total throughput time.................. 7.7 7.9 8.1 8.5 Total delivery cycle time............. 24.4 23.1 20.4 18.1
2. a. The company seems to be improving mainly in the areas of quality control, material control, on-time delivery, and total delivery cycle time. Customer complaints, warranty claims, defects, and scrap are all down somewhat, which suggests that the company has been paying attention to quality in its improvement campaign. The fact that on-time delivery and delivery cycle time have both improved also suggests that the company is seeking to please the customer with improved service.
b. Inspection time has increased dramatically. Use as percentage of availability has deteriorated, and throughput time as well as MCE show negative trends.
© The McGraw-Hill Companies, Inc., 2008. All rights reserved.Solutions Manual, Chapter 10 565
Problem 10-24 (continued)c. While it is difficult to draw any definitive conclusions, it
appears that the company has concentrated first on those areas of performance that are of most immediate concern to the customer—quality and delivery performance. The lower scrap and defect statistics suggest that the company has been able to improve its processes to reduce the rate of defects; although, some of the improvement in quality apparently was due simply to increased inspections of the products before they were shipped to customers.
3. a. and b.Month
5 6Throughput time in days:
Process time...................................... 0.6 0.6Inspection time................................. 0.8 0.0Move time......................................... 1.4 1.4Queue time....................................... 0.0 0.0Total throughput time........................ 2.8 2.0
Manufacturing cycle efficiency (MCE):Process time ÷ Throughput time....... 21.4% 30.0%
As non-value-added activities are eliminated, the manufacturing cycle efficiency improves. The goal, of course, is to have an efficiency of 100%. This is achieved when all non-value-added activities have been eliminated and process time equals throughput time.
© The McGraw-Hill Companies, Inc., 2008. All rights reserved.566 Managerial Accounting, 12th Edition

Learningand Growth
InternalBusinessProcesses
Financial
Customer
Problem 10-25 (45 minutes)1. Students’ answers may differ in some details from this solution.
© The McGraw-Hill Companies, Inc., 2008. All rights reserved.Solutions Manual, Chapter 10 567
Total profit
Sales
Number of menu items
Dining area cleanliness
Percent-age of kitchen
staff com-pleting cooking course
+
+
+
+
Customer satis-faction with ser-
vice
Customer satis-faction with menu
choices+ +
Average time to prepare an
orderAverage time
to take or-ders
Percent-age of din-ing room staff com-
pleting hospitality
course
+
+ –
–
Problem 10-25 (continued)2. The hypotheses underlying the balanced scorecard are
indicated by the arrows in the diagram. Reading from the bottom of the balanced scorecard, the hypotheses are:o If the percentage of dining room staff who complete the
hospitality course increases, the average time to take an order will decrease.
o If the percentage of dining room staff who complete the hospitality course increases, then dining room cleanliness will improve.
o If the percentage of kitchen staff who complete the cooking course increases, then the average time to prepare an order will decrease.
o If the percentage of kitchen staff who complete the cooking course increases, then the number of menu items will increase.
o If the dining room cleanliness improves, then customer satisfaction with service will increase.
o If the average time to take an order decreases, then customer satisfaction with service will increase.
o If the average time to prepare an order decreases, then customer satisfaction with service will increase.
o If the number of menu items increases, then customer satisfaction with menu choices will increase.
o If customer satisfaction with service increases, sales will increase.
o If customer satisfaction with menu choices increases, sales will increase.
o If sales increase, total profits for the Lodge will increase.Each of these hypotheses can be questioned. For example, even if the number of menu items increases, customer satisfaction with the menu choices may not increase. The items added to the menu may not appeal to customers. The fact that each of the hypotheses can be questioned does not, however, invalidate the balanced scorecard. If the scorecard is used correctly, management will be able to identify which, if any, of the hypotheses is incorrect. [See below.]
3. Management will be able to tell if a hypothesis is false if an © The McGraw-Hill Companies, Inc., 2008. All rights reserved.568 Managerial Accounting, 12th Edition
improvement in a performance measure at the bottom of an arrow does not, in fact, lead to improvement in the performance measure at the tip of the arrow. For example, if the number of menu items is increased, but customer satisfaction with the menu choices does not increase, management will immediately know that something was wrong with their assumptions.
© The McGraw-Hill Companies, Inc., 2008. All rights reserved.Solutions Manual, Chapter 10 569

Problem 10-26 (45 minutes)1. Each kilogram of fresh mushrooms yields 150 grams of dried
mushrooms suitable for packing:One kilogram of fresh mushrooms........... 1,000 gramsLess: unacceptable mushrooms (¼ of
total)..................................................... 250 Acceptable mushrooms........................... 750Less 80% shrinkage during drying........... 600 Acceptable dried mushrooms.................. 150 gramsSince 1,000 grams of fresh mushrooms yield 150 grams of dried mushrooms, 100 grams (or, 0.1 kilogram) of fresh mushrooms should yield the 15 grams of acceptable dried mushrooms that are packed in each jar.The direct labor standards are determined as follows:
Sorting and InspectingDirect labor time per kilogram of
fresh mushrooms.............................. 15 minutesGrams of dried mushrooms per kilo-
gram of fresh mushrooms................. ÷ 150 gramsDirect labor time per gram of dried
mushrooms....................................... 0.10 minute per gramGrams of dried mushrooms per jar...... × 15 gramsDirect labor time per jar...................... 1.5 minutes
DryingDirect labor time per kilogram of ac-
ceptable sorted fresh mushrooms... . 10 minutesGrams of dried mushrooms per kilo-
gram of acceptable sorted fresh mushrooms....................................... ÷ 200 grams
Direct labor time per gram of dried mushrooms....................................... 0.05 minute per gram
Grams of dried mushrooms per jar...... × 15 gramsDirect labor time per jar...................... 0.75 minute
© The McGraw-Hill Companies, Inc., 2008. All rights reserved.570 Managerial Accounting, 12th Edition

Problem 10-26 (continued)Standard cost per jar of dried chanterelle mushrooms:
Direct material:Fresh mushrooms
(0.1 kilogram per jar × €60.00 per kilogram). €6.00Jars, lids, and labels (€10.00 ÷ 100 jars)........... 0.10 €6.10
Direct labor:Sorting and inspecting
(1.5 minutes per jar × €0.20 per minute*)..... 0.30Drying (0.75 minute per jar × €0.20 per
minute*)......................................................... 0.15Packing
(0.10 minute per jar** × €0.20 per minute*).. 0.02 0.47 Standard cost per jar........................................... €6.57
*€12.00 per hour is €0.20 per minute.
**10 minutes per 100 jars is 0.10 minute
per jar.
© The McGraw-Hill Companies, Inc., 2008. All rights reserved.Solutions Manual, Chapter 10 571

Problem 10-26 (continued)2. a. Ordinarily, the purchasing manager has more influence over
the prices of purchased materials than anyone else in the organization. Therefore, the purchasing manager is usually held responsible for material price variances.
b. The production manager is usually held responsible for materials quantity variances. However, this situation is a bit unusual. The quantity variance will be heavily influenced by the quality of the mushrooms acquired from gatherers by the purchasing manager. If the mushrooms have an unusually large proportion of unacceptable mushrooms, the quantity variance will be unfavorable. The production process itself is likely to have less effect on the amount of wastage and spoilage. On the other hand, if the production manager is not held responsible for the quantity variance, the production workers may not take sufficient care in their handling of the mushrooms. A partial solution to this problem would be to make the sorting and inspection process part of the purchasing manager’s responsibility. The purchasing manager would then be held responsible for any wastage in excess of the 100 grams expected for each 300 grams of acceptable fresh mushrooms. The production manager would be held responsible for any wastage after that point. This is only a partial solution, however, because the purchasing manager may pass on at least 300 grams of every 400 grams of fresh mushrooms, whether they are acceptable or not.
© The McGraw-Hill Companies, Inc., 2008. All rights reserved.572 Managerial Accounting, 12th Edition

Problem 10-27 (45 minutes)1. a. Materials Price Variance = AQ (AP – SP)
6,000 pounds ($2.75 per pound* – SP) = $1,500 F**$16,500 – 6,000 pounds × SP = $1,500***6,000 pounds × SP = $18,000SP = $3 per pound
*$16,500 ÷ 6,000 pounds = $2.75 per pound**$1,200 U + ? = $300 F; $1,200 U – $1,500 F = $300
F.***When used with the formula, unfavorable variances
are positive and favorable variances are negative.
b. Materials Quantity Variance = SP (AQ – SQ)$3 per pound (6,000 pounds – SQ) = $1,200 U$18,000 – $3 per pound × SQ = $1,200*$3 per pound × SQ = $16,800SQ = 5,600 pounds
*When used with the formula, unfavorable variances are positive and favorable variances are negative.
Alternative approach to parts (a) and (b):Actual Quantity of
Inputs, at Actual Price
Actual Quantity of Inputs, at
Standard Price
Standard Quantity Allowed for Out-put, at Standard
Price(AQ × AP) (AQ × SP) (SQ × SP)$16,500* 6,000 pounds* ×
$3 per pound5,600 pounds ×
$3 per pound= $18,000 = $16,800
Price Variance,
$1,500 FQuantity Variance,
$1,200 U*
Total Variance, $300 F*
*Given.
© The McGraw-Hill Companies, Inc., 2008. All rights reserved.Solutions Manual, Chapter 10 573

c. 5,600 pounds ÷ 1,400 units = 4 pounds per unit.
© The McGraw-Hill Companies, Inc., 2008. All rights reserved.574 Managerial Accounting, 12th Edition

Problem 10-27 (continued)2. a. Labor Efficiency Variance = SR (AH – SH)
$9 per hour (AH – 3,500 hours*) = $4,500 F$9 per hour × AH – $31,500 = –$4,500**$9 per hour × AH = $27,000AH = 3,000 hours
*1,400 units × 2.5 hours per unit = 3,500 hours**When used with the formula, unfavorable variances are
positive and favorable variances are negative.
b. Labor Rate Variance = AH (AR – SR)3,000 hours ($9.50 per hour* – $9.00 per hour) = $1,500 U
Alternative approach to parts (a) and (b):Actual Hours of
Input, at the Actual Rate
Actual Hours of Input, at the
Standard Rate
Standard Hours Allowed for Out-put, at the Stan-
dard Rate(AH × AR) (AH × SR) (SH × SR)
3,000 hours × $9.50 per hour*
3,000 hours × $9.00 per hour**
3,500 hours*** × $9.00 per hour**
= $28,500* = $27,000 = $31,500
Rate Variance,
$1,500 UEfficiency Variance,
$4,500 F*
Total Variance, $3,000 F
* $28,500 total labor cost ÷ 3,000 hours = $9.50 per hour** Given
*** 1,400 units × 2.5 hours per unit = 3,500 hours
© The McGraw-Hill Companies, Inc., 2008. All rights reserved.Solutions Manual, Chapter 10 575

Problem 10-28 (75 minutes)1. a.Actual Quantity of
Inputs, at Actual Price
Actual Quantity of Inputs, at
Standard Price
Standard Quantity Allowed for Out-put, at Standard
Price(AQ × AP) (AQ × SP) (SQ × SP)
60,000 feet × $0.95 per foot
60,000 feet × $1.00 per foot
36,000 feet* × $1.00 per foot
= $57,000 = $60,000 = $36,000
Price Variance,
$3,000 F38,000 feet × $1.00 per foot
= $38,000
Quantity Variance, $2,000 U
*6,000 units × 6.0 feet per unit = 36,000 feet
Alternative approach:Materials Price Variance = AQ (AP – SP)60,000 feet ($0.95 per foot – $1.00 per foot) = $3,000 FMaterials Quantity Variance = SP (AQ – SQ)$1.00 per foot (38,000 feet – 36,000 feet) = $2,000 U
b.Raw Materials (60,000 feet @ $1.00 per
foot)............................................................ 60,000Materials Price Variance
(60,000 feet @ $0.05 per foot F)............ 3,000Accounts Payable
(60,000 feet @ $0.95 per foot)............... 57,000Work in Process (36,000 feet @ $1.00 per
foot)............................................................ 36,000Materials Quantity Variance
(2,000 feet U @ $1.00 per foot).................. 2,000© The McGraw-Hill Companies, Inc., 2008. All rights reserved.576 Managerial Accounting, 12th Edition
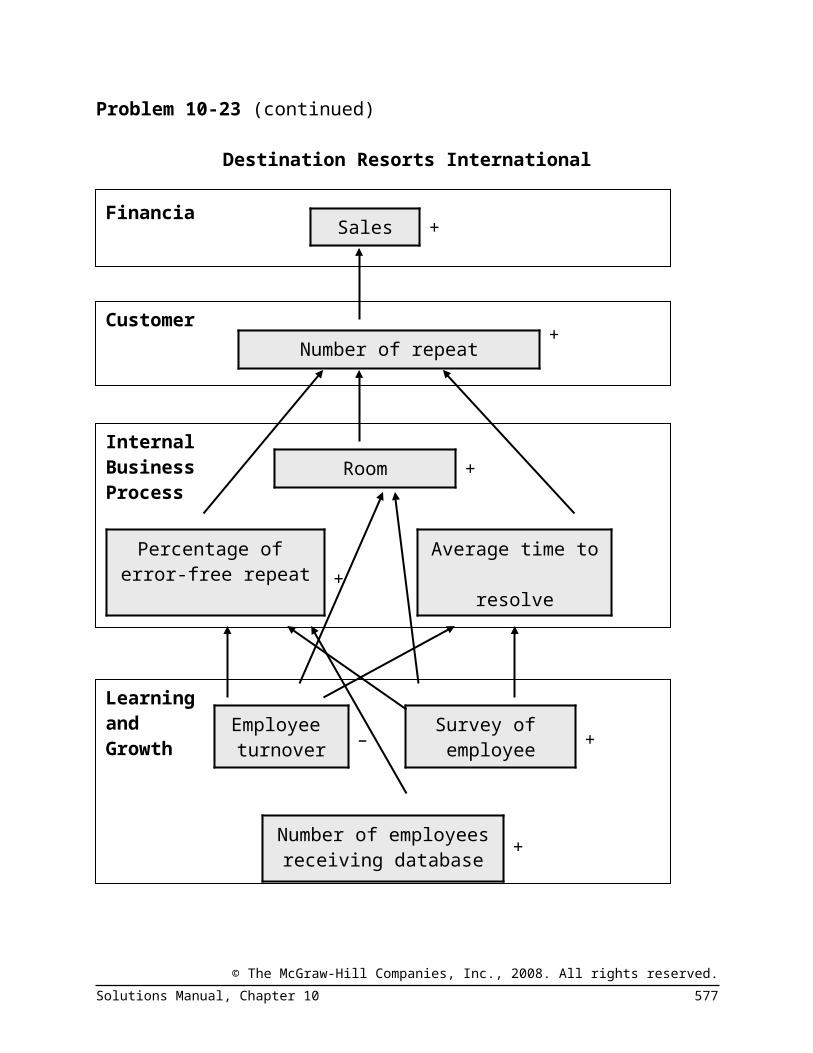
Raw Materials (38,000 feet @ $1.00 per foot)........................................................ 38,000
© The McGraw-Hill Companies, Inc., 2008. All rights reserved.Solutions Manual, Chapter 10 577

Problem 10-28 (continued)2. a.
Actual Hours of Input, at the Actual Rate
Actual Hours of Input, at the Stan-
dard Rate
Standard Hours Allowed for Out-put, at the Stan-
dard Rate(AH × AR) (AH × SR) (SH × SR)$27,950 6,500 hours* ×
$4.50 per hour6,000 hours** × $4.50 per hour
= $29,250 = $27,000
Rate Variance,
$1,300 FEfficiency Variance,
$2,250 U
Total Variance, $950 U
*The actual hours worked during the period can be com-puted through the variable overhead efficiency vari-ance, as follows:
SR (AH – SH) = Efficiency Variance$3 per hour (AH – 6,000 hours**) = $1,500 U$3 per hour × AH – $18,000 = $1,500***$3 per hour × AH = $19,500AH = 6,500 hours**6,000 units × 1.0 hour per unit = 6,000 hours
***When used with the formula, unfavorable variances are positive and favorable variances are negative.
Alternative approach:Labor Rate Variance = AH × (AR – SR)6,500 hours ($4.30 per hour* – $4.50 per hour) = $1,300 F*$27,950 ÷ 6,500 hours = $4.30 per hour
Labor Efficiency Variance = SR (AH – SH)$4.50 per hour (6,500 hours – 6,000 hours) = $2,250 U
© The McGraw-Hill Companies, Inc., 2008. All rights reserved.578 Managerial Accounting, 12th Edition

Problem 10-28 (continued)b. Work in Process
(6,000 hours @ $4.50 per hour).............. 27,000Labor Efficiency Variance
(500 hours U @ $4.50 per hour).............. 2,250Labor Rate Variance
(6,500 hours @ $0.20 per hour F)...... 1,300Wages Payable
(6,500 hours @ $4.30 per hour)......... 27,950
3. a.Actual Hours of
Input, at the Actual Rate
Actual Hours of Input, at the
Standard Rate
Standard Hours Allowed for Out-put, at the Stan-
dard Rate(AH × AR) (AH × SR) (SH × SR)$20,475 6,500 hours ×
$3.00 per hour6,000 hours × $3.00 per hour
= $19,500 = $18,000
Spending Variance,
$975 UEfficiency Variance,
$1,500 U
Total Variance, $2,475 U
Alternative approach:Variable Overhead Spending Variance = AH × (AR – SR)6,500 hours ($3.15 per hour* – $3.00 per hour) = $975 U*$20,475 ÷ 6,500 hours = $3.15 per hour
Variable Overhead Efficiency Variance = SR (AH – SH)$3.00 per hour (6,500 hours – 6,000 hours) = $1,500 U
© The McGraw-Hill Companies, Inc., 2008. All rights reserved.Solutions Manual, Chapter 10 579
Problem 10-28 (continued)b. No. When variable manufacturing overhead is applied on the
basis of direct labor-hours, it is impossible to have an unfavorable variable manufacturing overhead efficiency variance when the direct labor efficiency variance is favorable. The variable manufacturing overhead efficiency variance is the same as the direct labor efficiency variance except that the difference between actual hours and the standard hours allowed for the output is multiplied by a different rate. If the direct labor efficiency variance is favorable, the variable manufacturing overhead efficiency variance must also be favorable.
4. For materials:Favorable price variance: Decrease in outside purchase prices,
fortunate buy, inferior quality materials, unusual discounts due to quantity purchased, inaccurate standards.
Unfavorable quantity variance: Inferior quality materials, carelessness, poorly adjusted machines, unskilled workers, inaccurate standards.
For labor:Favorable rate variance: Unskilled workers (paid lower rates),
piecework, inaccurate standards.Unfavorable efficiency variance: Poorly trained workers, poor
quality materials, faulty equipment, work interruptions, fixed labor with insufficient demand to keep them all busy, inaccurate standards.
For variable overhead:Unfavorable spending variance: Increase in supplier prices,
inaccurate standards, waste, theft of supplies.Unfavorable efficiency variance: See comments under direct
labor efficiency variance.
© The McGraw-Hill Companies, Inc., 2008. All rights reserved.580 Managerial Accounting, 12th Edition

Problem 10-29 (45 minutes)This is a very difficult problem that is harder than it looks. Be sure your students have been thoroughly “checked out” in the vari-ance formulas before assigning it.
1. Actual Quantity of Inputs, at
Actual Price
Actual Quantity of Inputs, at
Standard Price
Standard Quantity Allowed for Out-put, at Standard
Price(AQ × AP) (AQ × SP) (SQ × SP)$36,000 6,000 yards ×
$6.50 per yard*5,600 yards** × $6.50 per yard*
= $39,000 = $36,400
Price Variance,
$3,000 FQuantity Variance,
$2,600 U
Total Variance, $400 F
*$18.20 ÷ 2.8 yards = $6.50 per yard.**2,000 units × 2.8 yards per unit = 5,600 yards
Alternative Solution:Materials Price Variance = AQ (AP – SP)6,000 yards ($6.00 per yard* – $6.50 per yard) = $3,000 F
*$36,000 ÷ 6,000 yards = $6.00 per yardMaterials Quantity Variance = SP (AQ – SQ)$6.50 per yard (6,000 yards – 5,600 yards) = $2,600 U
© The McGraw-Hill Companies, Inc., 2008. All rights reserved.Solutions Manual, Chapter 10 581

Problem 10-29 (continued)2. Many students will miss parts 2 and 3 because they will try to
use product costs as if they were hourly costs. Pay particular attention to the computation of the standard direct labor time per unit and the standard direct labor rate per hour.
Actual Hours of Input, at the Actual Rate
Actual Hours of Input, at the
Standard Rate
Standard Hours Allowed for Out-put, at the Stan-
dard Rate(AH × AR) (AH × SR) (SH × SR)
$7,600 760 hours × $9 per hour*
800 hours** × $9 per hour*
= $6,840 = $7,200
Rate Variance,
$760 UEfficiency Variance,
$360 F
Total Variance, $400 U
* 780 standard hours ÷ 1,950 robes = 0.4 standard hour per robe.
$3.60 standard cost per robe ÷ 0.4 standard hours = $9 standard rate per hour.
**2,000 robes × 0.4 standard hour per robe = 800 standard
hours.
Alternative Solution:Labor Rate Variance = AH (AR – SR)760 hours ($10 per hour* – $9 per hour) = $760 U
*$7,600 ÷ 760 hours = $10 per hourLabor Efficiency Variance = SR (AH – SH)$9 per hour (760 hours – 800 hours) = $360 F
© The McGraw-Hill Companies, Inc., 2008. All rights reserved.582 Managerial Accounting, 12th Edition

Problem 10-29 (continued)3. Actual Hours of In-
put, at the Actual Rate
Actual Hours of Input, at the
Standard Rate
Standard Hours Allowed for Out-put, at the Stan-
dard Rate(AH × AR) (AH × SR) (SH × SR)
$3,800 760 hours × $3 per hour*
800 hours × $3 per hour*
= $2,280 = $2,400
Spending Variance,
$1,520 UEfficiency Variance,
$120 F
Total Variance, $1,400 U
*$1.20 standard cost per robe ÷ 0.4 standard hours = $3 standard rate per hour.
Alternative Solution:Variable Overhead Spending Variance = AH (AR – SR)760 hours ($5 per hour* – $3 per hour) = $1,520 U
*$3,800 ÷ 760 hours = $5 per hourVariable Overhead Efficiency Variance = SR (AH – SH)$3 per hour (760 hours – 800 hours) = $120 F
© The McGraw-Hill Companies, Inc., 2008. All rights reserved.Solutions Manual, Chapter 10 583
Problem 10-30 (60 minutes)1. Total standard cost for units produced during August:
500 kits × $42 per kit................................................ $21,000Less standard cost of labor and overhead:
Direct labor................................................................ (8,000)Variable manufacturing overhead.............................. (1,600 )
Standard cost of materials used during August............ $11,400
2. Standard cost of materials used during August (a)....... $11,400Number of units produced (b)...................................... 500 Standard materials cost per kit (a) ÷ (b)...................... $ 22.80
3. Actual cost of material used........ $10,000Standard cost of material used. . . 11,400 Total variance.............................. $ 1,400 FThe price and quantity variances together equal the total variance. If the quantity variance is $600 U, then the price variance must be $2,000F:Price variance.............................. $ 2,000 FQuantity variance........................ 600 UTotal variance.............................. $ 1,400 F
© The McGraw-Hill Companies, Inc., 2008. All rights reserved.584 Managerial Accounting, 12th Edition

Problem 10-30 (continued)Alternative Solution:
Actual Quantity of Inputs, at
Actual Price
Actual Quantity of Inputs, at
Standard Price
Standard Quantity Allowed for Out-put, at Standard
Price(AQ × AP) (AQ × SP) (SQ × SP)
2,000 yards × $5 per yard
2,000 yards × $6 per yard*
1,900 yards** × $6 per yard*
= $10,000* = $12,000 = $11,400
Price Variance,
$2,000 FQuantity Variance,
$600 U*
Total Variance, $1,400 F
*Given.
**500 kits × 3.8 yards per kit = 1,900
yards
4. The first step in computing the standard direct labor rate is to determine the standard direct labor-hours allowed for the month’s production. The standard direct labor-hours can be computed by working with the variable manufacturing overhead cost figures, since they are based on direct labor-hours worked:
Standard manufacturing variable overhead cost for August (a)............................................................ $1,600
Standard manufacturing variable overhead rate per direct labor-hour (b)............................................. $2
Standard direct labor-hours for the month (a) ÷ (b)........................................................................ 800
© The McGraw-Hill Companies, Inc., 2008. All rights reserved.Solutions Manual, Chapter 10 585

© The McGraw-Hill Companies, Inc., 2008. All rights reserved.586 Managerial Accounting, 12th Edition

Problem 10-30 (continued)5. Before the labor variances can be computed, it is necessary to
compute the actual direct labor cost for the month:Actual cost per kit produced ($42.00 +
$0.14)......................................................... $ 42.14Number of kits produced............................... × 500Total actual cost of production...................... $21,070Less: Actual cost of materials........................ $10,000
Actual cost of manufacturing variable overhead............................................. 1,620 11,620
Actual cost of direct labor.............................. $ 9,450
With this information, the variances can be computed:Actual Hours of
Input, at the Actual Rate
Actual Hours of Input, at the
Standard Rate
Standard Hours Allowed for Out-put, at the Stan-
dard Rate(AH × AR) (AH × SR) (SH × SR)
$9,450 900 hours* × $10 per hour
$8,000*
= $9,000
Rate Variance,
$450 UEfficiency Variance,
$1,000 U
Total Variance, $1,450 U
*Given.
© The McGraw-Hill Companies, Inc., 2008. All rights reserved.Solutions Manual, Chapter 10 587

Problem 10-30 (continued)6. Actual Hours of
Input, at the Actual Rate
Actual Hours of Input, at the
Standard Rate
Standard Hours Allowed for Out-put, at the Stan-
dard Rate(AH × AR) (AH × SR) (SH × SR)$1,620* 900 hours* ×
$2 per hour*$1,600*
= $1,800
Spending Variance,
$180 FEfficiency Variance,
$200 U
Total Variance, $20 U
*Given.
7. Standard Quantity or Hours per
KitStandard
Price or Rate
Standard Cost per
KitDirect materials............ 3.8 yards1 $ 6 per yard $22.80Direct labor................... 1.6 hours2 $10 per hour3 16.00Variable manufacturing
overhead.................... 1.6 hours $ 2 per hour 3.20 Total standard cost per
kit............................... $42.001From part 2.2800 hours (from part 4) ÷ 500 kits = 1.6 hours per kit.3From part 4.
© The McGraw-Hill Companies, Inc., 2008. All rights reserved.588 Managerial Accounting, 12th Edition

Case 10-31 (30 minutes)This case may be difficult for some students to grasp since it re-quires looking at standard costs from an entirely different per-spective. In this case, standard costs have been inappropriately used as a means to manipulate reported earnings rather than as a way to control costs.
1. Lansing has evidently set very loose standards in which the standard prices and standard quantities are far too high. This guarantees that favorable variances will ordinarily result from operations. If the standard costs are set artificially high, the standard cost of goods sold will be artificially high and thus the division’s net operating income will be depressed until the favorable variances are recognized. If Lansing saves the favorable variances, he can release just enough in the second and third quarters to show some improvement and then he can release all of the rest in the last quarter, creating the annual “Christmas present.”
2. Lansing should not be permitted to continue this practice for several reasons. First, it distorts the quarterly earnings for both the division and the company. The distortions of the division’s quarterly earnings are troubling because the manipulations may mask real signs of trouble. The distortions of the company’s quarterly earnings are troubling because they may mislead external users of the financial statements. Second, Lansing should not be rewarded for manipulating earnings. This sets a moral tone in the company that is likely to lead to even deeper trouble. Indeed, the permissive attitude of top management toward the manipulation of earnings may indicate the existence of other, even more serious, ethical problems in the company. Third, a clear message should be sent to division managers like Lansing that their job is to manage their operations, not their earnings. If they keep on top of operations and manage well, the earnings should take care of themselves.
© The McGraw-Hill Companies, Inc., 2008. All rights reserved.Solutions Manual, Chapter 10 589

Case 10-31 (continued)3. Stacy Cummins does not have any easy alternatives available.
She has already taken the problem to the President, who was not interested. If she goes around the President to the Board of Directors, she will be putting herself in a politically difficult position with little likelihood that it will do much good if, in fact, the Board of Directors already knows what is going on.On the other hand, if she simply goes along, she will be violating the “Objectivity” standard of ethical conduct for management accountants. The Home Security Division’s manipulation of quarterly earnings does distort the entire company’s quarterly reports. And the Objectivity standard clearly stipulates that “management accountants have a responsibility to disclose fully all relevant information that could reasonably be expected to influence an intended user’s understanding of the reports, comments, and recommendations presented.” Apart from the ethical issue, there is also a very practical consideration. If Merced Home Products becomes embroiled in controversy concerning questionable accounting practices, Stacy Cummins will be viewed as a responsible party by outsiders and her career is likely to suffer dramatically and she may even face legal problems.We would suggest that Ms. Cummins quietly bring the manipulation of earnings to the attention of the audit committee of the Board of Directors, carefully laying out in a non-confrontational manner the problems created by Lansing’s practice of manipulating earnings. If the President and the Board of Directors are still not interested in dealing with the problem, she may reasonably conclude that the best alternative is to start looking for another job.
© The McGraw-Hill Companies, Inc., 2008. All rights reserved.590 Managerial Accounting, 12th Edition

Learningand Growth
InternalBusinessProcesses
Customer
Financial
Case 10-32 (60 minutes)1. Answers may differ concerning which category—learning and
growth, internal business processes, customers, or financial—a particular performance measure belongs to.
© The McGraw-Hill Companies, Inc., 2008. All rights reserved.Solutions Manual, Chapter 10 591
Total profit
Average age of accounts receiv-
able
Written-off accounts receiv-
able as a per-centage of sales
Customer satisfaction with
accuracy of charge account
billsPercentage of charge account bills containing
errors
Unsold inventory at end of season as a percentage of total cost of
salesPercentage of suppliers making
just-in-time deliveries
Percentage of sales clerks trained
to correctly enter
data on charge ac-count slips
+
+
+
+
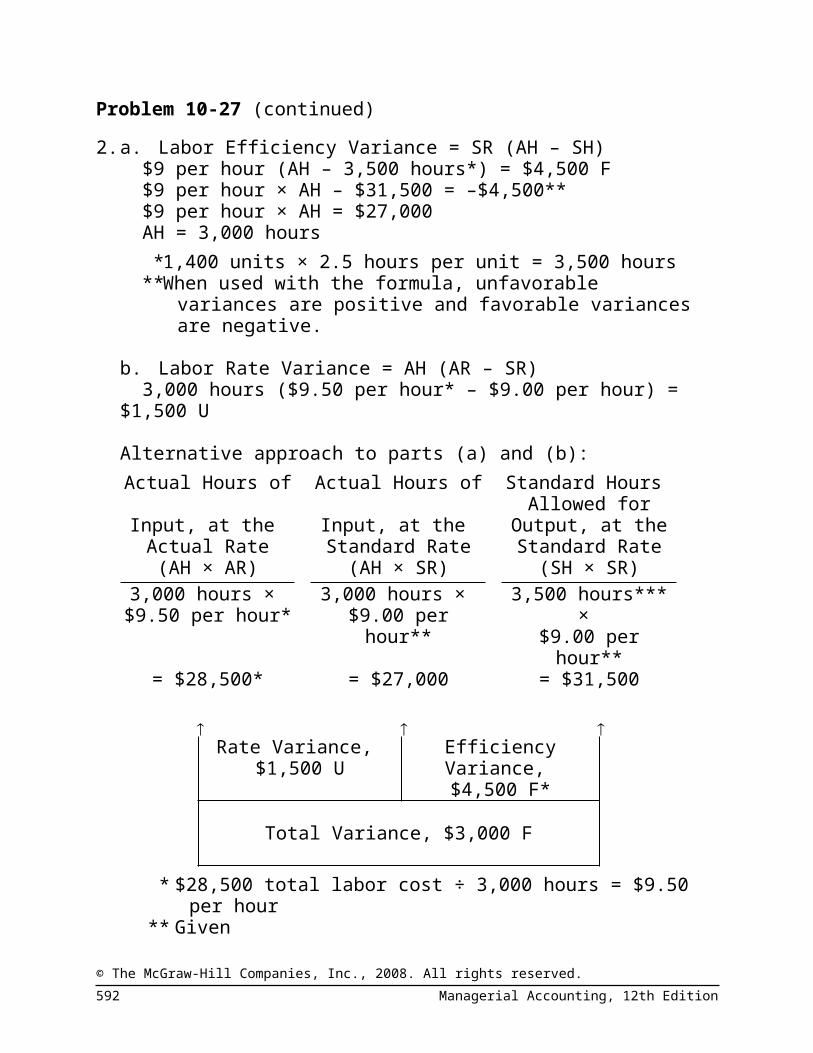
Case 10-32 (continued)A number of the performance measures suggested by managers have not been included in the above balanced scorecard. The excluded performance measures may have an impact on total profit, but they are not linked in any obvious way with the two key problems that have been identified by management—accounts receivables and unsold inventory. If every performance measure that potentially impacts profit is included in a company’s balanced scorecard, it would become unwieldy and focus would be lost.
2. The results of operations can be exploited for information about the company’s strategy. Each link in the balanced scorecard should be regarded as a hypothesis of the form “If ..., then ...”. For example, the balanced scorecard on the previous page contains the hypothesis “If customers express greater satisfaction with the accuracy of their charge account bills, then the average age of accounts receivable will improve.” If customers in fact do express greater satisfaction with the accuracy of their charge account bills, but the average age of accounts receivable does not improve, this would have to be considered evidence that is inconsistent with the hypothesis. Management should try to figure out why the average age of receivables has not improved. (See the answer below for possible explanations.) The answer may suggest a shift in strategy.In general, the most important results are those that provide evidence inconsistent with the hypotheses embedded in the balanced scorecard. Such evidence suggests that the company’s strategy needs to be reexamined.
© The McGraw-Hill Companies, Inc., 2008. All rights reserved.592 Managerial Accounting, 12th Edition
Case 10-32 (continued)3. a. This evidence is inconsistent with two of the hypotheses
underlying the balanced scorecard. The first of these hypotheses is “If customers express greater satisfaction with the accuracy of their charge account bills, then there will be improvement in the average age of accounts receivable.” The second of these hypotheses is “If customers express greater satisfaction with the accuracy of their charge account bills, then there will be improvement in bad debts.” There are a number of possible explanations. Two possibilities are that the company’s collection efforts are ineffective and that the company’s credit reviews are not working properly. In other words, the problem may not be incorrect charge account bills at all. The problem may be that the procedures for collecting overdue accounts are not working properly. Or, the problem may be that the procedures for reviewing credit card applications let through too many poor credit risks. If so, this would suggest that efforts should be shifted from reducing charge account billing errors to improving the internal business processes dealing with collections and credit screening. And in that case, the balanced scorecard should be modified.
b. This evidence is inconsistent with three hypotheses. The first of these is “If the average age of receivables declines, then profits will increase.” The second hypothesis is “If the written-off accounts receivable decrease as a percentage of sales, then profits will increase.” The third hypothesis is “If unsold inventory at the end of the season as a percentage of cost of sales declines, then profits will increase.”Again, there are a number of possible explanations for the lack of results consistent with the hypotheses. Managers may have decreased the average age of receivables by simply writing off old accounts earlier than was done previously. This would actually decrease reported profits in the short term. Bad debts as a percentage of sales could be decreased by drastically cutting back on extensions of credit to customers—perhaps even canceling some charge accounts. (There would be no bad debts at all if there were
© The McGraw-Hill Companies, Inc., 2008. All rights reserved.Solutions Manual, Chapter 10 593
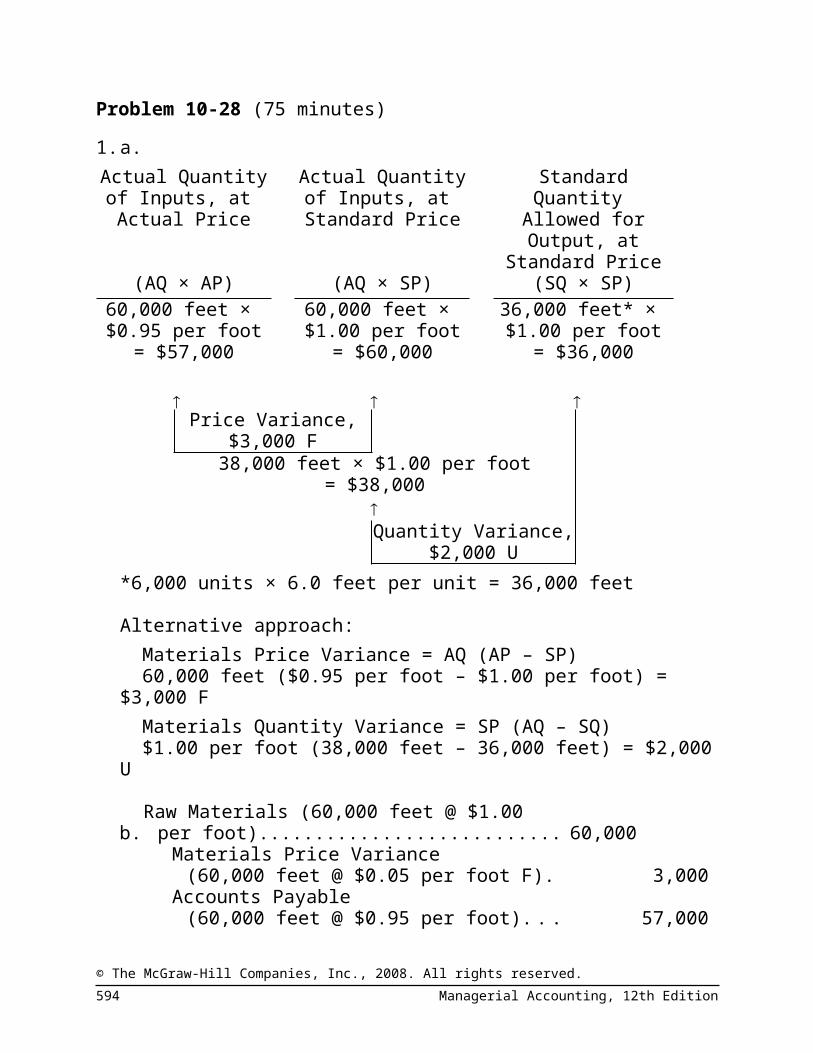
no credit sales.) This would have the effect of reducing bad debts, but might irritate otherwise loyal credit customers and reduce sales and profits.
© The McGraw-Hill Companies, Inc., 2008. All rights reserved.594 Managerial Accounting, 12th Edition

Case 10-32 (continued)The reduction in unsold inventories at the end of the season as a percentage of cost of sales could have occurred for a number of reasons that are not necessarily good for profits. For example, managers may have been too cautious about ordering goods to restock low inventories—creating stockouts and lost sales. Or, managers may have cut prices drastically on excess inventories in order to eliminate them before the end of the season. This may have reduced the willingness of customers to pay the store’s normal prices. Or, managers may have gotten rid of excess inventories by selling them to discounters before the end of the season.
© The McGraw-Hill Companies, Inc., 2008. All rights reserved.Solutions Manual, Chapter 10 595
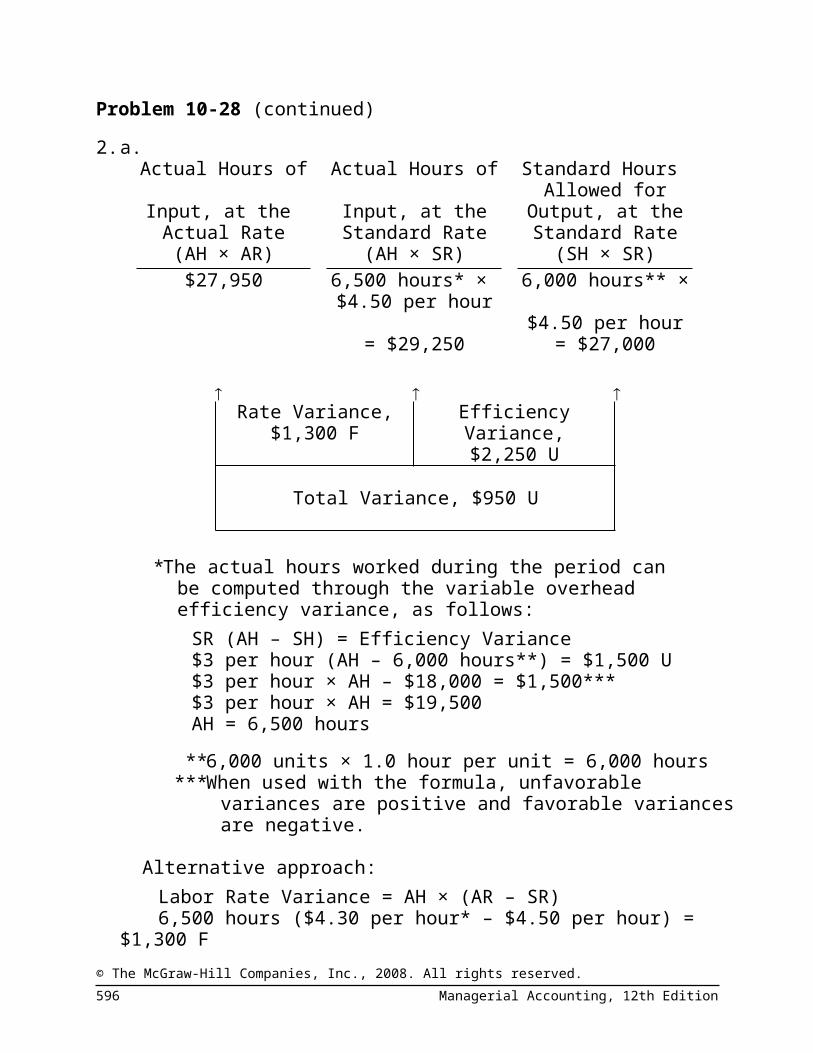
Research and Application 10-33 (240 minutes)1. Nordstrom succeeds first and foremost because of its customer
intimacy customer value proposition. The company’s Personal Book system is the clearest indication of its customer intimacy value proposition. Page 17 of the annual report says “With Personal Book, our salespeople are able to set and manage their customer follow-ups, organize and track customer preferences and easily reference customer purchases and contact information. The result is that our salespeople are able to tailor our service to the needs of each customer. We are able to stay connected with our customers and invite them back in for the new trends, merchandise, sales and events that interest them.” The Personal Book system is the latest innovation from a company that has prospered because of its attentiveness to individual customer needs.Offering fashionable, high-quality merchandise is also important to Nordstrom. However, the company has historically differentiated itself from competitors such as Dillard’s, Federated, and Neiman Marcus by hiring top-notch salespeople and motivating them to provide superior individualized customer service. Page 14 of the annual report says “On the selling floor, our goal has been to create an environment that’s fair and positive, while at the same time, providing our people with the tools they need to run their own businesses within our four walls. By giving each individual the ability and freedom to excel, we enhance our company’s ability to do the same.” Providing this extraordinary level of employee autonomy is another major driving force behind Nordstrom’s customer intimacy value proposition.
2. These measures do not comprise a balanced scorecard because all of the measures, except one (inventory turns) are financial measures. The measures shown in the annual report may be satisfactory for external investors who are primarily interested in financial results; however, they would not constitute a balanced scorecard for internal management purposes. First, the scorecard does not include enough measures related to the non-financial leading indicators that drive financial results. In other words, the customer, internal
© The McGraw-Hill Companies, Inc., 2008. All rights reserved.596 Managerial Accounting, 12th Edition

business process, and learning and growth perspectives are largely non-existent in the scorecard included in the annual report. Second, there are no linkages between the measures shown in the scorecard. This is understandable because all of the measures except one are financial measures. Nonetheless, to quality as a genuine balanced scorecard, the scorecard shown in the annual
© The McGraw-Hill Companies, Inc., 2008. All rights reserved.Solutions Manual, Chapter 10 597

Research and Application 10-33 (continued)report would need to include measures from various non-financial perspectives (such as the customer, internal business process, and learning and growth perspectives) and those measures would need to be related to one another on a cause-and-effect basis.
3. Students will probably choose their measures from among those shown in the scorecard included in Nordstrom’s annual report: (1) sales per square foot; (2) same-store sales percentage change; (3) gross profit as a percentage of sales; (4) SG&A expense as a percentage of sales; (5) earnings before income taxes as a percentage of sales; and (6) cash flow from operations. All of these measures, except SG&A expense as a percentage of sales, should increase over time.The most important part of this question is for students to see that these six measures provide feedback on different facets of financial performance. The “same-store sales percentage change” focuses on revenue management. The “gross profit as a percentage of sales,” “SG&A expense as a percentage of sales,” and “earnings before income taxes as a percentage of sales” are all margin-oriented measures that incorporate expense management into the evaluative scheme. The “sales per square foot” incorporates constraint management into the scorecard. Finally, “cash flow from operations” looks at cash flow management.
4. The annual report does not explicitly mention customer-focused performance measures. However, it contains numerous statements that refer to performance attributes that would be important to customers. For example, page 14 says “our merchants are doing a better job of reacting quickly to feedback from the sales floor by leveraging our new perpetual inventory system. As a result, we’re selling more of the right merchandise in the right store at the right time. This improved merchandise flow brings more fresh and compelling goods to the floor, resulting in fewer markdowns.” This quote alludes to two important aspects of the customers’ shopping experience. First, the survey-based measure “customer perception of
© The McGraw-Hill Companies, Inc., 2008. All rights reserved.598 Managerial Accounting, 12th Edition

merchandise fashion appeal” assesses if customers perceive Nordstrom’s product offerings as fresh and compelling. Second, the survey-based measure “customer perception of merchandise availability” assesses if customers perceive that Nordstrom has the right kind of merchandise available at the right time. Poor performance on this measure could be caused by excessive markdowns,
© The McGraw-Hill Companies, Inc., 2008. All rights reserved.Solutions Manual, Chapter 10 599

Research and Application 10-33 (continued)which would indicate that Nordstrom does not have enough fresh and compelling merchandise available for sale, or excessive stockouts, which would indicate that Nordstrom is running out of items that customers would like to have purchased.As already mentioned, the annual report also discusses the company’s Personal Book system. The purpose of this technology is to enable superior individualized customer service. The survey-based measure “customer perception of tailored service quality” assesses if customers believe that their individual preferences are understood and being met. Finally, page 15 of the annual report says “we’ve been taking a look at the different ways our customers choose to shop with us, whether by phone, online, or in our stores. We want to create a seamless shopping experience, sending our customers a clear and consistent message with the merchandise we offer, across all channels.” The survey-based measure “customer perception of channel integration” assesses if customers perceive a seamless shopping experience. All four of these measures should increase over time.
5. The annual report explicitly mentions one internal business process measure, inventory turns. If Nordstrom is selling “more of the right merchandise in the right store at the right time,” then inventory turnover should increase. The annual report does not explicitly mention any other internal process measures; however, it contains statements that point to various internal business process measures. For example, as previously mentioned, the Personal Book is a new tool that Nordstrom implemented to better serve and retain individual customers. For the Personal Book to work optimally, each Nordstrom salesperson should use the technology to help develop long-term relationships with their customers, to generate more follow-up visits from them, and to sell more merchandise to them. The measure “number of follow-up visits from customers” would provide feedback regarding the effectiveness of this technology. This measure should go up over time.
© The McGraw-Hill Companies, Inc., 2008. All rights reserved.600 Managerial Accounting, 12th Edition

The annual report also mentions that Nordstrom is always striving to improve its ability to respond to fashion trends. The measure “order cycle time” could be used to measure the amount of time that elapses from when Nordstrom spots a new trend and places an order with a supplier for a new SKU (Stock Keeping Unit) to when the merchandise
© The McGraw-Hill Companies, Inc., 2008. All rights reserved.Solutions Manual, Chapter 10 601

Research and Application 10-33 (continued)becomes available for sale to end consumers. The same type of time-based measure could be used to assess how efficiently Nordstrom replenishes its existing SKUs. These time-based measures should go down over time.The annual report emphasizes the importance of providing superior customer service. The measure “number of customer complaints” could be used to provide feedback regarding customer dissatisfaction with Nordstrom’s sales process. This measure should go down over time.The annual report says that Nordstrom strives to provide its customers with compelling merchandise. If customers return merchandise for a refund, it provides clear evidence that they did not find the merchandise to be very compelling or satisfying. Accordingly, the “dollar value of merchandise returns” is an internal business process measure that should decline over time.
6. The annual report does not explicitly mention any learning and growth measures; however, students can suggest some measures based on an elementary understanding of the business. The salespersons are critically important to Nordstrom because they manage the face-to-face customer interactions. Therefore, it would make sense for students to propose numerous measures related to the salesforce. For example, the measure “percentage of excellent job candidates hired” would assess Nordstrom’s ability to hire highly qualified job candidates. The measure “hours of training per employee” would assess Nordstrom‘s investment in enabling its salesforce to succeed. The qualitative measure “employee morale” would measure how satisfied employees are with their jobs. In a highly autonomous environment such as Nordstrom, intrinsic motivation and high employee morale are critical drivers of success. Finally, the measure “employee retention” would assess how effective Nordstrom is at retaining its employees.
© The McGraw-Hill Companies, Inc., 2008. All rights reserved.602 Managerial Accounting, 12th Edition
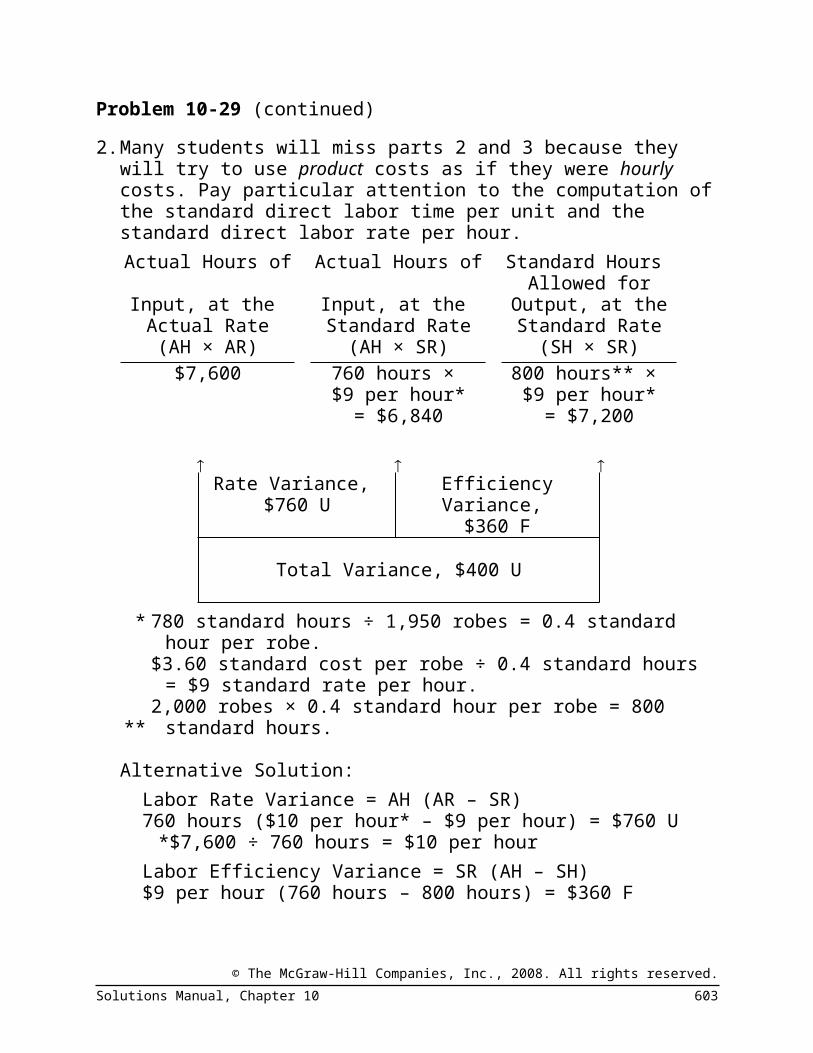
Research and Application 10-33 (continued)7. Here are eight “if-then” hypothesis statements based on the
measures mentioned above: If the level of employee morale increases, then the rate of
employee retention should increase. If the rate of employee retention increases, then the number
of follow-up visits from customers should increase. If the number of follow-up visits from customers increases,
then the customer perception of tailored service quality should increase.
If the customer perception of tailored service quality increases, then the same store sales percentage change should increase.
If the order cycle time for new SKUs decreases, then the customer perception of merchandise fashion appeal should increase.
If the customer perception of merchandise fashion appeal increases, then the gross margin as a percentage of sales should increase.
If the inventory turnover increases, then the sales per square foot should increase.
If the customer perception of channel integration increases, then the earnings before income taxes as a percentage of sales should increase.
© The McGraw-Hill Companies, Inc., 2008. All rights reserved.Solutions Manual, Chapter 10 603

This page intentionally left blank
© The McGraw-Hill Companies, Inc., 2008. All rights reserved.604 Managerial Accounting, 12th Edition