chapter 10 frequency response techniquesathena.ecs.csus.edu/.../chapter-10/chap10p1-9.pdf ·...
TRANSCRIPT
CHAPTER 10FREQUENCY RESPONSE TECHNIQUES
FINDING THE SYSTEM FREQUENCY RESPONSE
BODE PLOTS
STABILITY ANALYSIS FROM BODE PLOTS
GAIN DESIGN TO INCREASE STABILITY
EFFECT OF DELAY ON STABILITY
NYQUIST PLOTS
STABILITY ANALYSIS USING NYQUIST PLOTS
M & N CIRCLES & NICHOLS CHART TO FIND CLOSED-LOOP FREQUENCEY RESPONSE
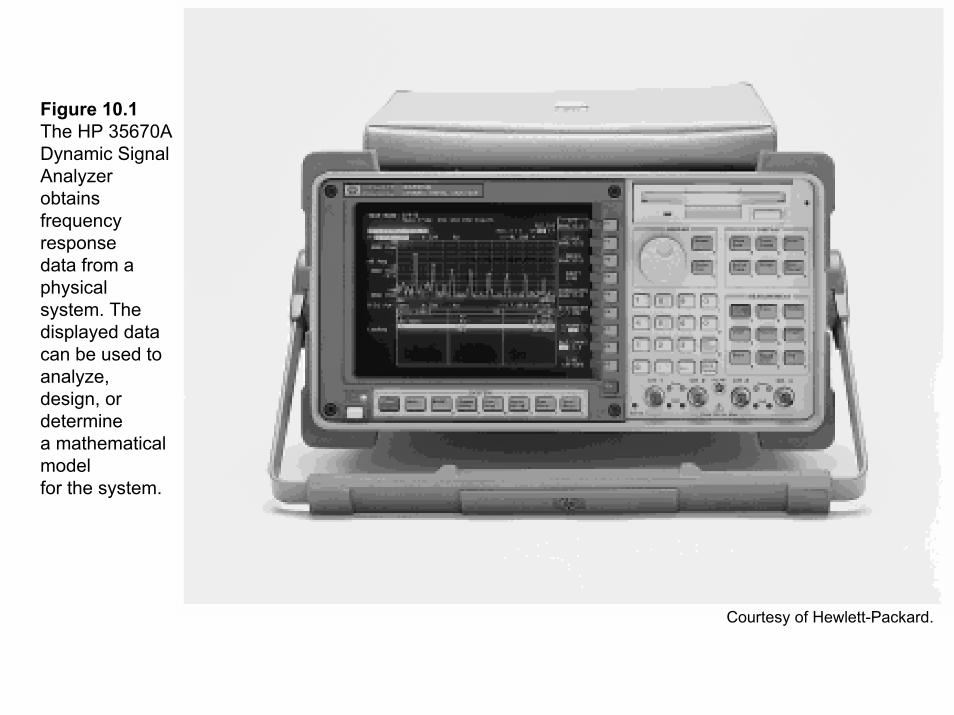
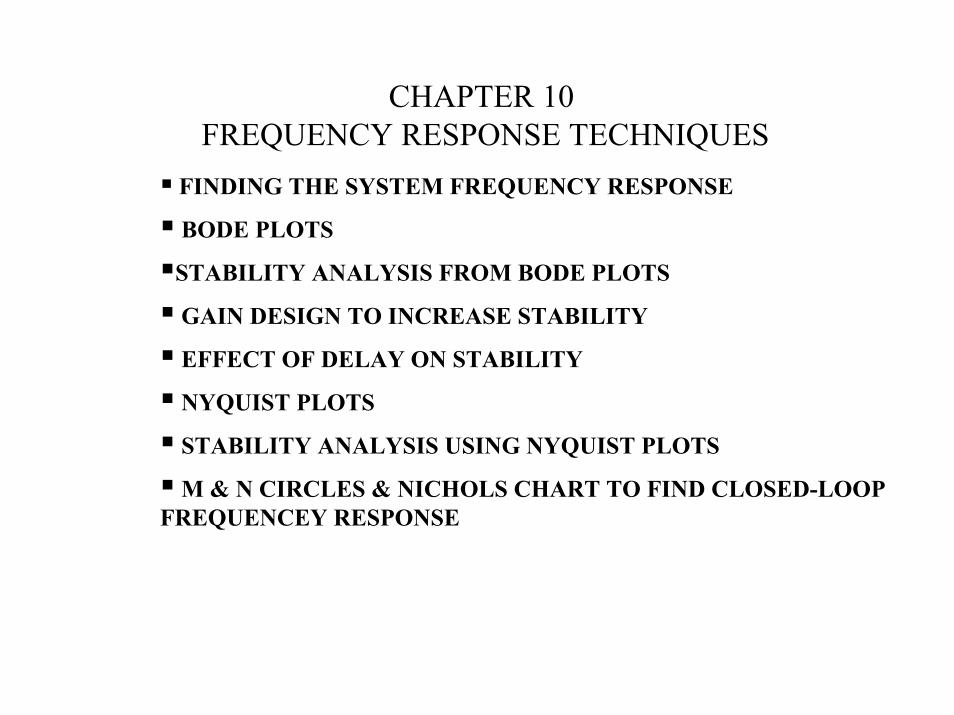
Figure 10.1The HP 35670A Dynamic Signal Analyzer obtainsfrequency responsedata from a physicalsystem. Thedisplayed data can be used to analyze, design, or determine a mathematical modelfor the system.
Courtesy of Hewlett-Packard.
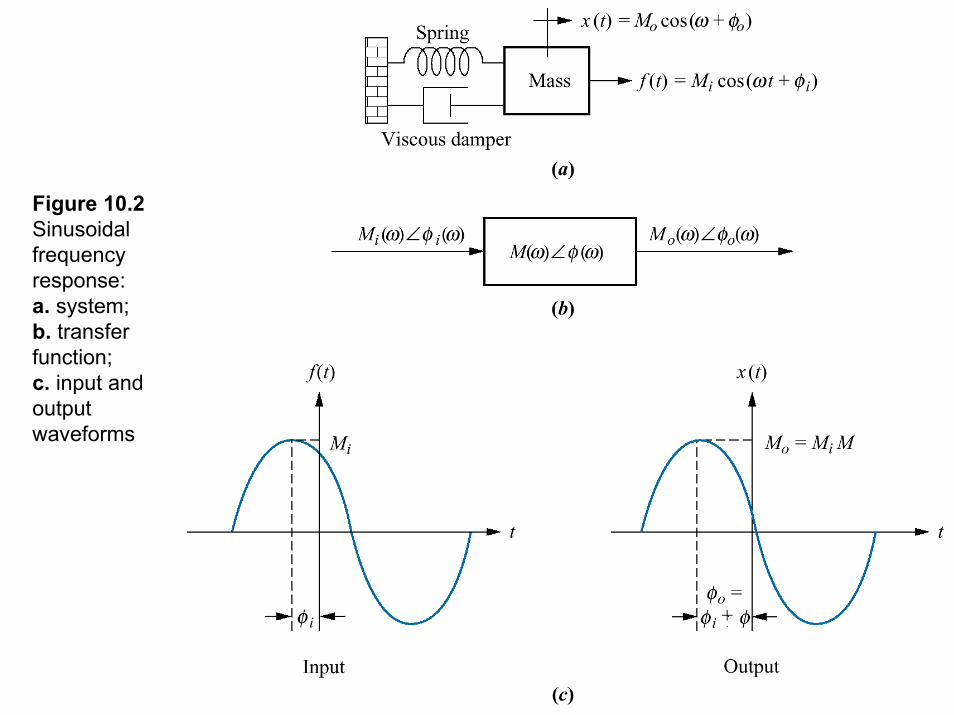
Figure 10.2Sinusoidal frequencyresponse:a. system;b. transfer function;c. input and outputwaveforms
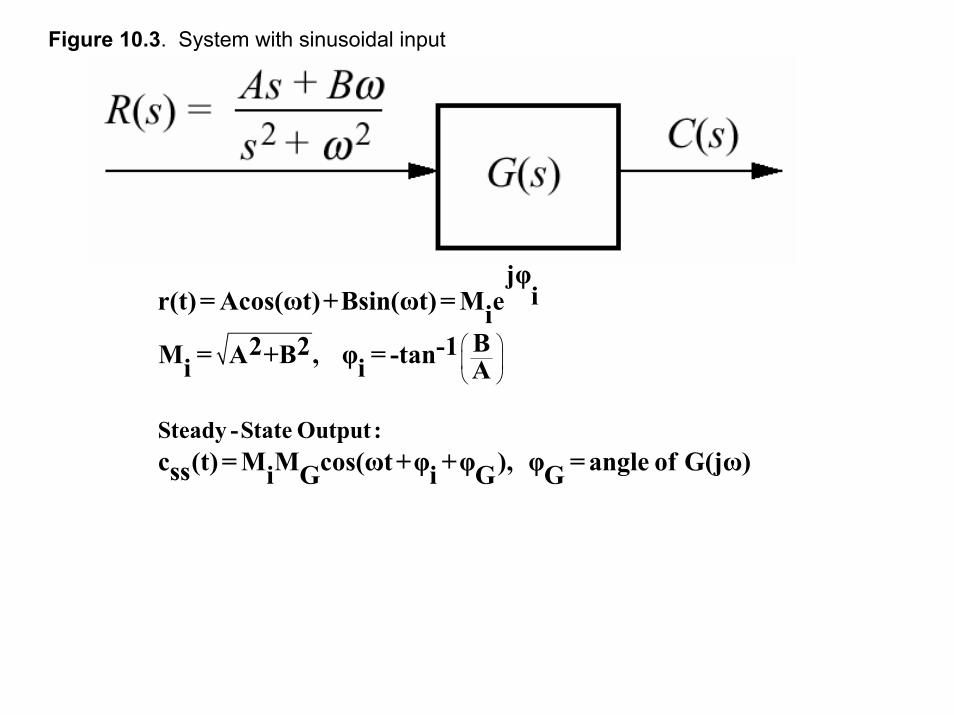
Figure 10.3. System with sinusoidal input
Steady -State Output:
jφir(t) = Acos(ωt)+Bsin(ωt) = M ei
B2 2 -1M = A +B , φ = -tani i A
c (t) = M M cos(ωt+φ +φ ), φ = angle of G(jω)ss i G i G G

10.5s+1
=1 0.5s+2 0.5s+1
20log(0.5)= -6.02dB
-5.7o
2/10 2*10
-45o
Figure 10.4 Frequency response plots for G(s) = 1/(s + 2): separate magnitude and phase
0
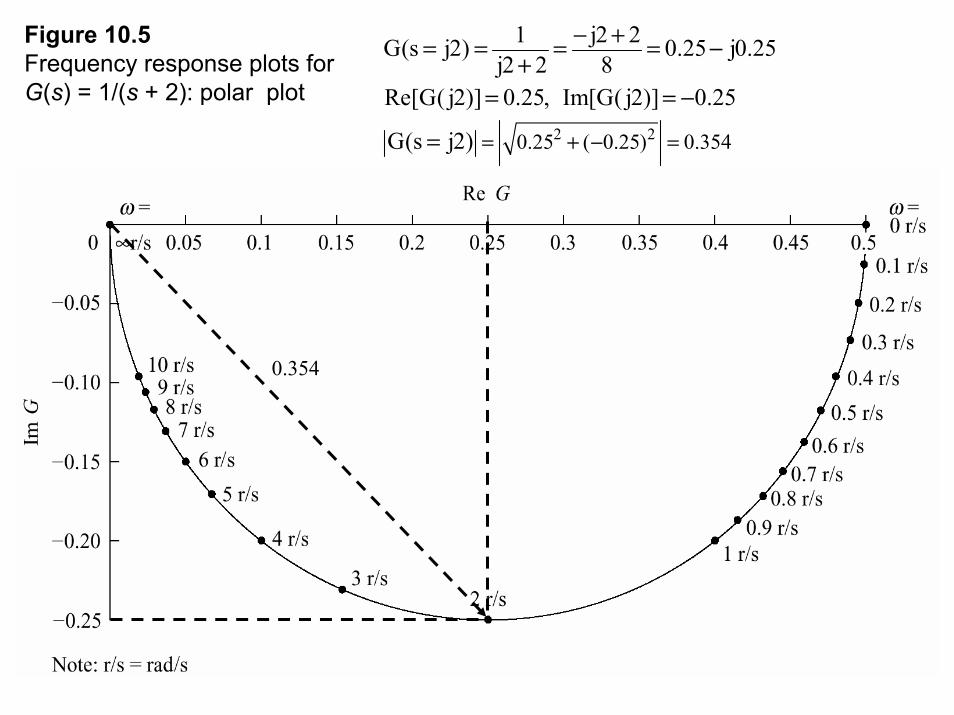
Figure 10.5Frequency response plots for G(s) = 1/(s + 2): polar plot
2 20.25 ( 0.25) 0.354
1 j2 2G(s j2) 0.25 j0.25j2 2 8
Re[G( j2)] 0.25, Im[G( j2)] 0.25
G(s j2) = + − =
− += = = = −+
= = −
=
0.354
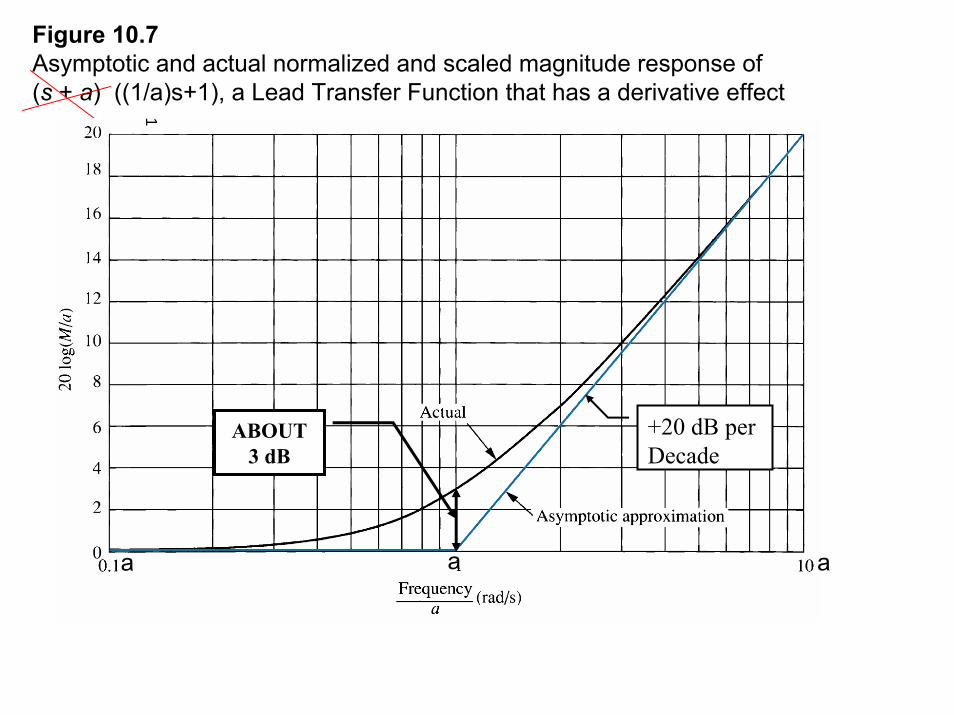
Figure 10.7Asymptotic and actual normalized and scaled magnitude response of(s + a) ((1/a)s+1), a Lead Transfer Function that has a derivative effect
ABOUT 3 dB
+20 dB per Decade
1
a aa
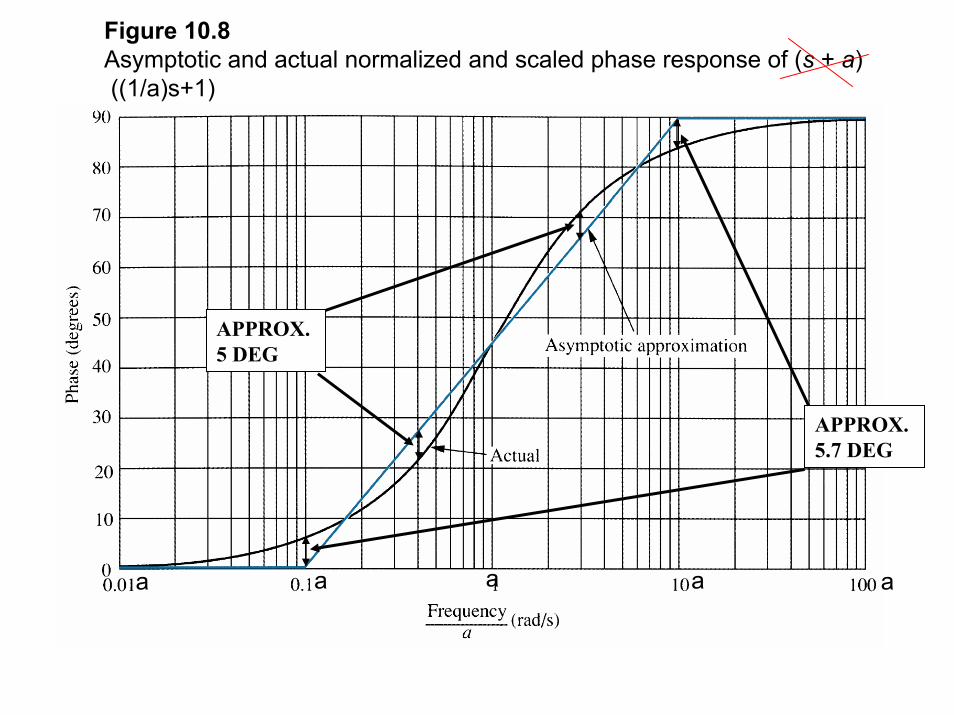
Figure 10.8Asymptotic and actual normalized and scaled phase response of (s + a)((1/a)s+1)
APPROX. 5 DEG
APPROX. 5.7 DEG
aaa a a
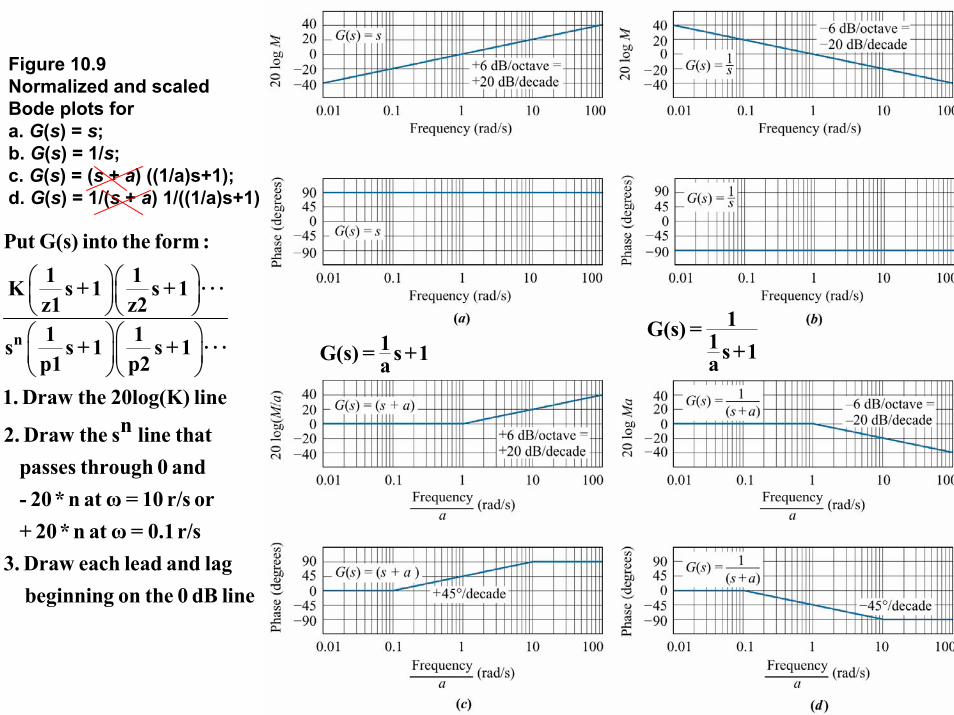
Figure 10.9Normalized and scaledBode plots fora. G(s) = s;b. G(s) = 1/s;c. G(s) = (s + a) ((1/a)s+1);d. G(s) = 1/(s + a) 1/((1/a)s+1)
n
Put G(s) into the form :1 1K s +1 s +1z1 z21 1s s +1 s +1p1 p2
1. Draw the 20log(K) linen2. Draw the s line that
passes through 0 and - 20* n at ω = 10 r/s or + 20* n at ω = 0.1 r/s3. Draw each lead and lag beginning on the 0 dB line
1G(s) = s +1a
1G(s) = 1 s+1a