chapter 13 normal distributions chapter 131. the normal distribution chapter 132 figure 13.7 two...
TRANSCRIPT
Chapter 13
Normal Distributions
Chapter 13 1
The Normal Distribution
Chapter 13 2
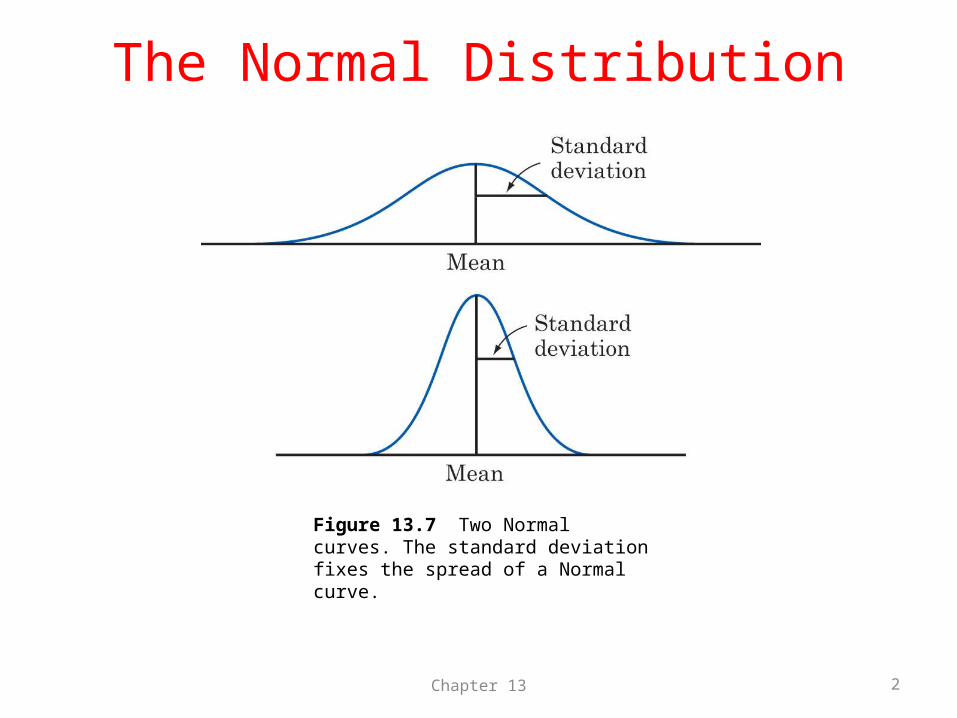
Figure 13.7 Two Normalcurves. The standard deviationfixes the spread of a Normalcurve.
Normal Density Curve
The normal curves are symmetric, bell-shaped curve has these properties:•A specific normal curve is completely determined by its mean and its standard deviation.•The mean determines the center of the distribution. It is located at the center of symmetry of the curve.•The standard deviation determines the shape of the curve.
Chapter 13 3
With the Mean and Standard Deviation of the Normal Distribution we can determine:
• What proportion of individuals fall into any range of values.
• At what percentile a given individual falls, if you know their value.
• What value corresponds to a given percentile.
Chapter 13 4
Chapter 13 5
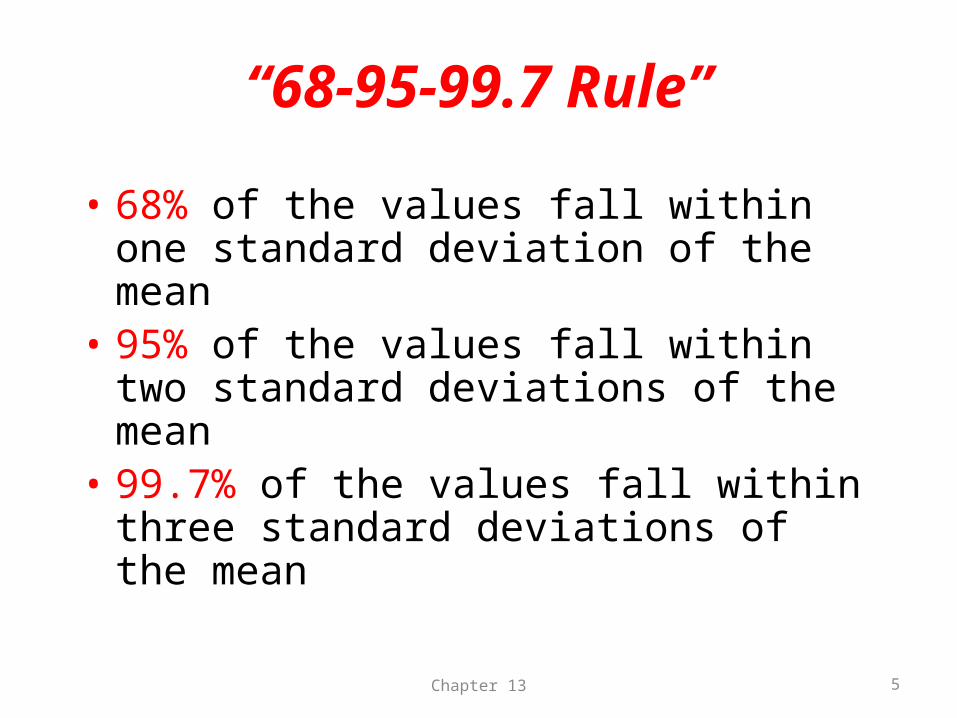
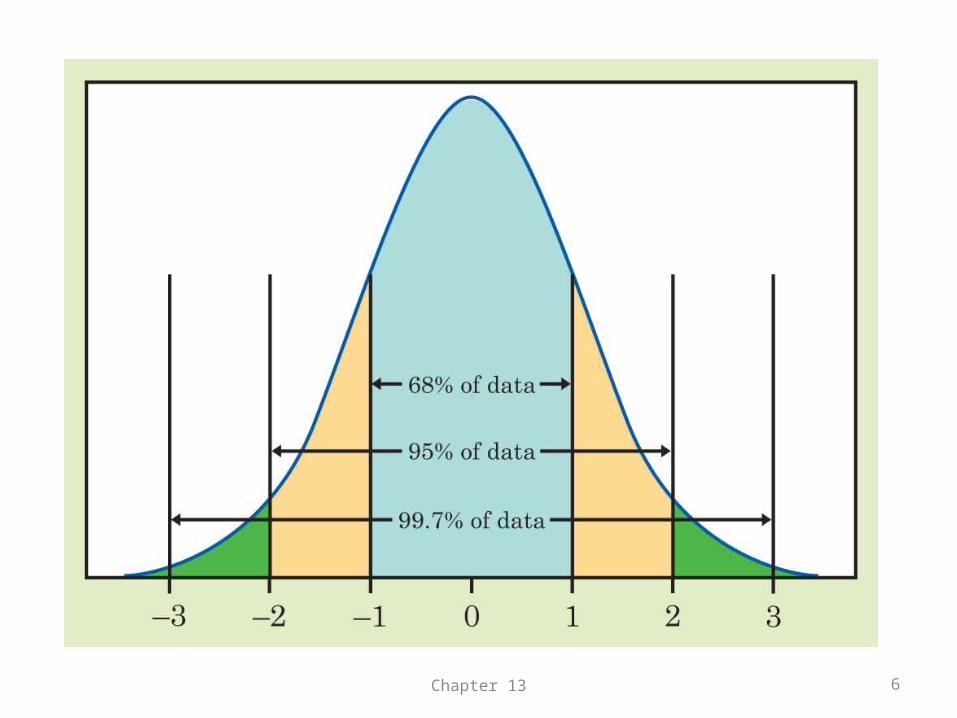
“68-95-99.7 Rule”
• 68% of the values fall within one standard deviation of the mean
• 95% of the values fall within two standard deviations of the mean
• 99.7% of the values fall within three standard deviations of the mean
Chapter 13 6
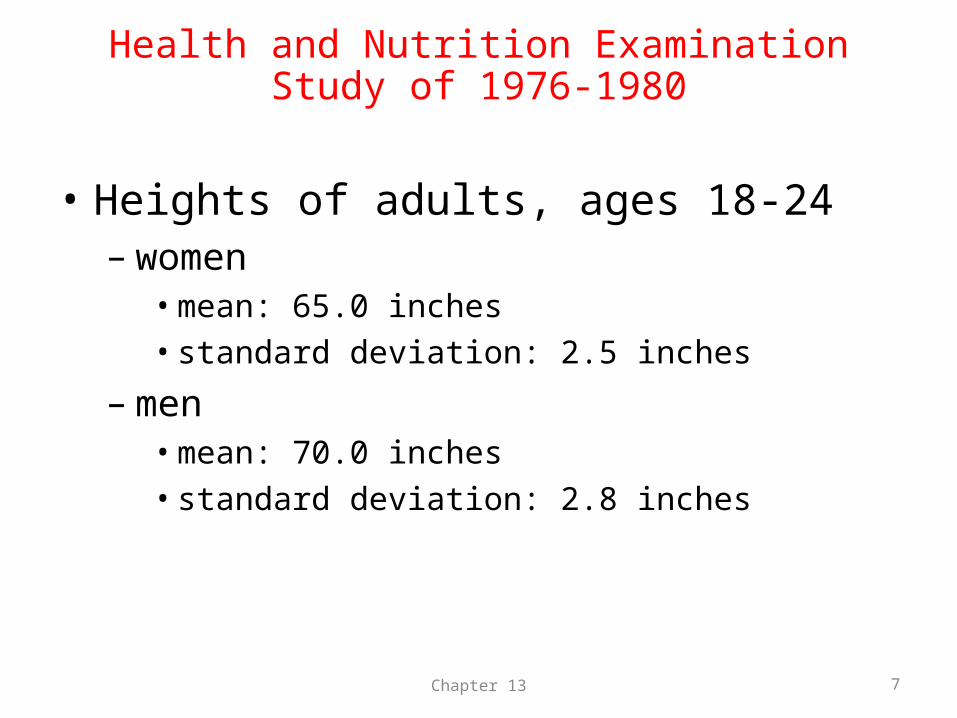
Health and Nutrition Examination Study of 1976-1980
• Heights of adults, ages 18-24– women
• mean: 65.0 inches• standard deviation: 2.5 inches
– men• mean: 70.0 inches• standard deviation: 2.8 inches
Chapter 13 7
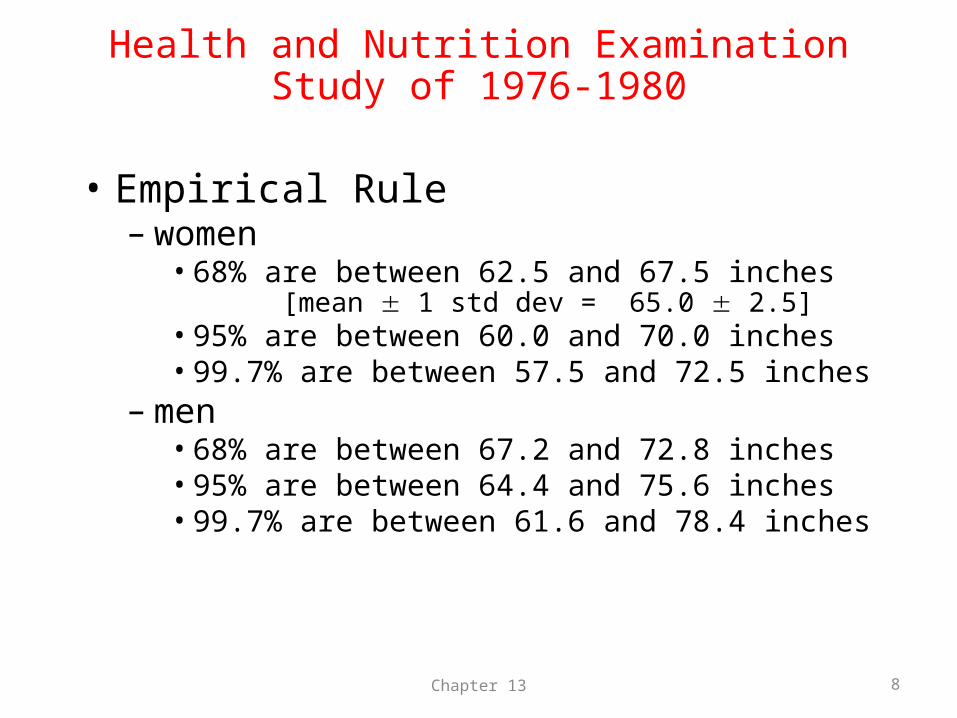
• Empirical Rule– women
• 68% are between 62.5 and 67.5 inches [mean 1 std dev = 65.0 2.5]
• 95% are between 60.0 and 70.0 inches• 99.7% are between 57.5 and 72.5 inches
– men• 68% are between 67.2 and 72.8 inches• 95% are between 64.4 and 75.6 inches• 99.7% are between 61.6 and 78.4 inches
Chapter 13 8
Health and Nutrition Examination Study of 1976-1980
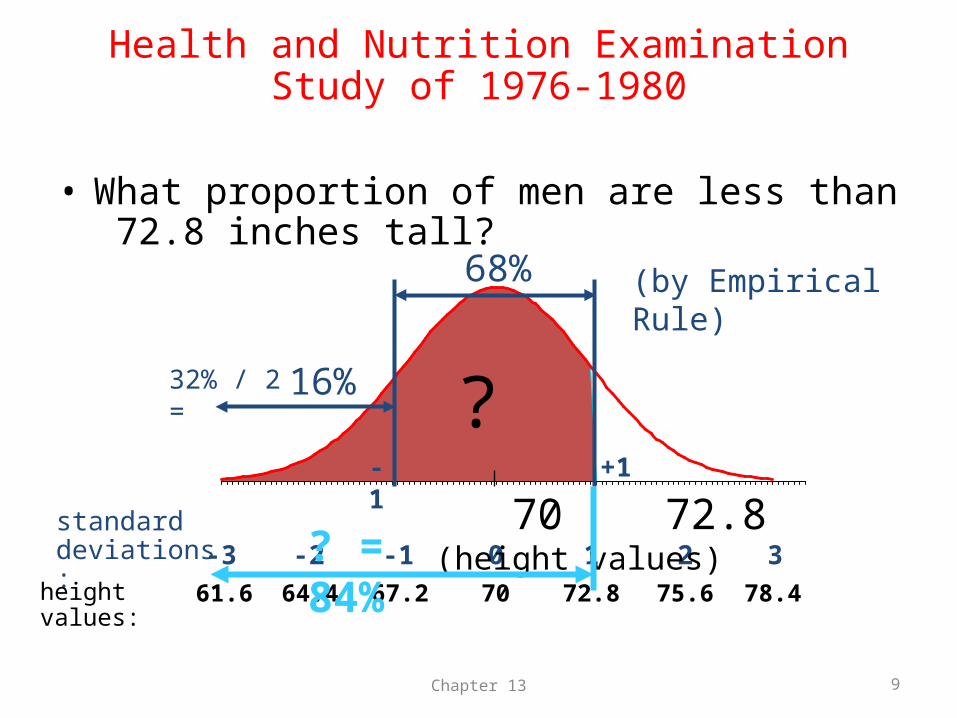
• What proportion of men are less than 72.8 inches tall?
Chapter 13 9
0 1-1 2-2 3-3standard deviations:
70 72.867.2 75.664.4 78.461.6height values:
?
70 72.8 (height values)
+1
68% (by Empirical Rule)
-1
? = 84%
16%32% / 2 =
Health and Nutrition Examination Study of 1976-1980
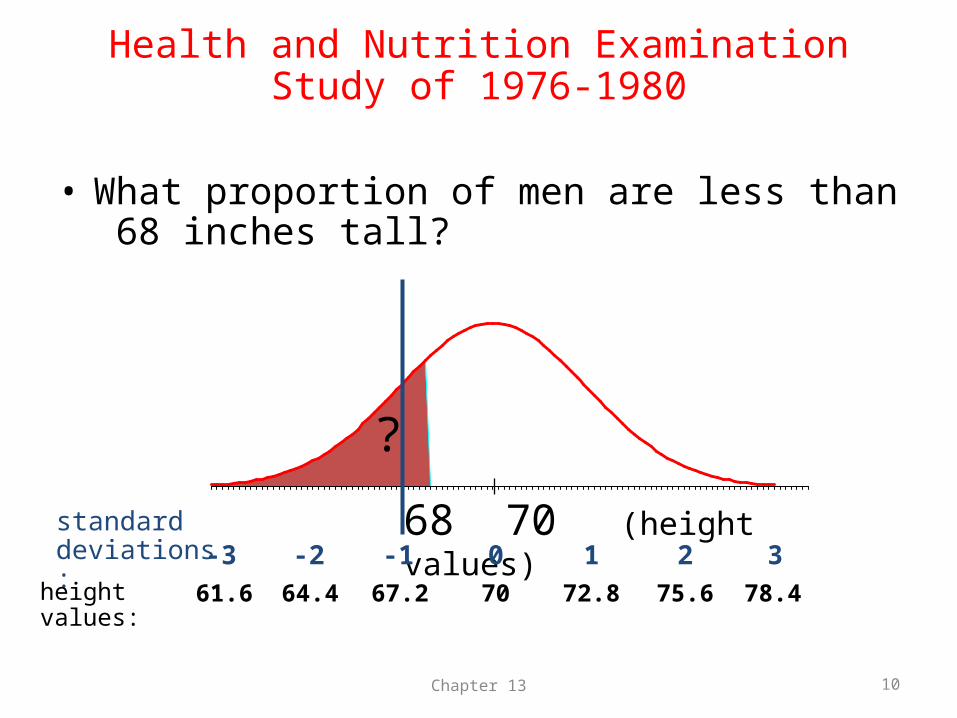
• What proportion of men are less than 68 inches tall?
Chapter 13 10
?
68 70 (height values)0 1-1 2-2 3-3
standard deviations:
70 72.867.2 75.664.4 78.461.6height values:
Health and Nutrition Examination Study of 1976-1980
Chapter 13 11
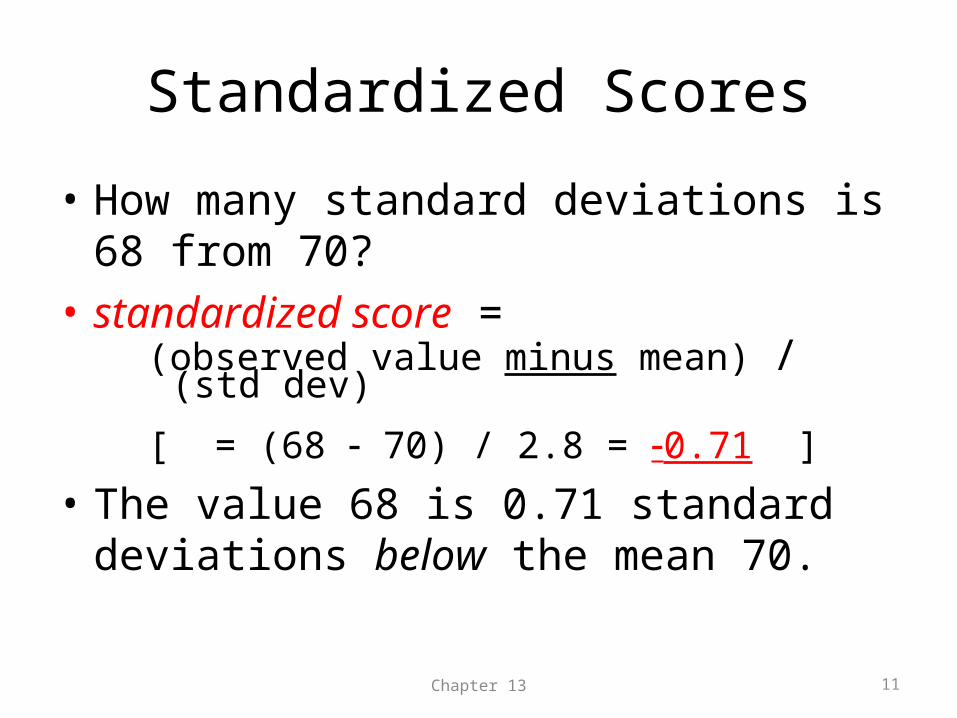
Standardized Scores
• How many standard deviations is 68 from 70?• standardized score =
(observed value minus mean) / (std dev)
[ = (68 70) / 2.8 = 0.71 ]
• The value 68 is 0.71 standard deviations below the mean 70.
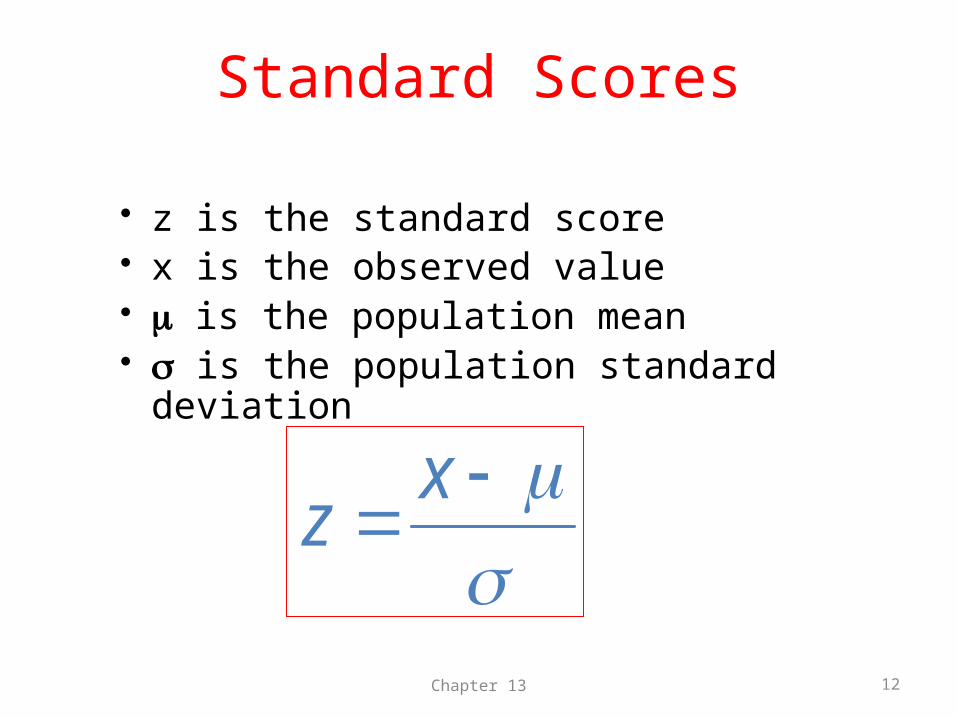
Standard Scores
z is the standard score x is the observed value is the population mean is the population standard deviation
Chapter 13 12
x
z
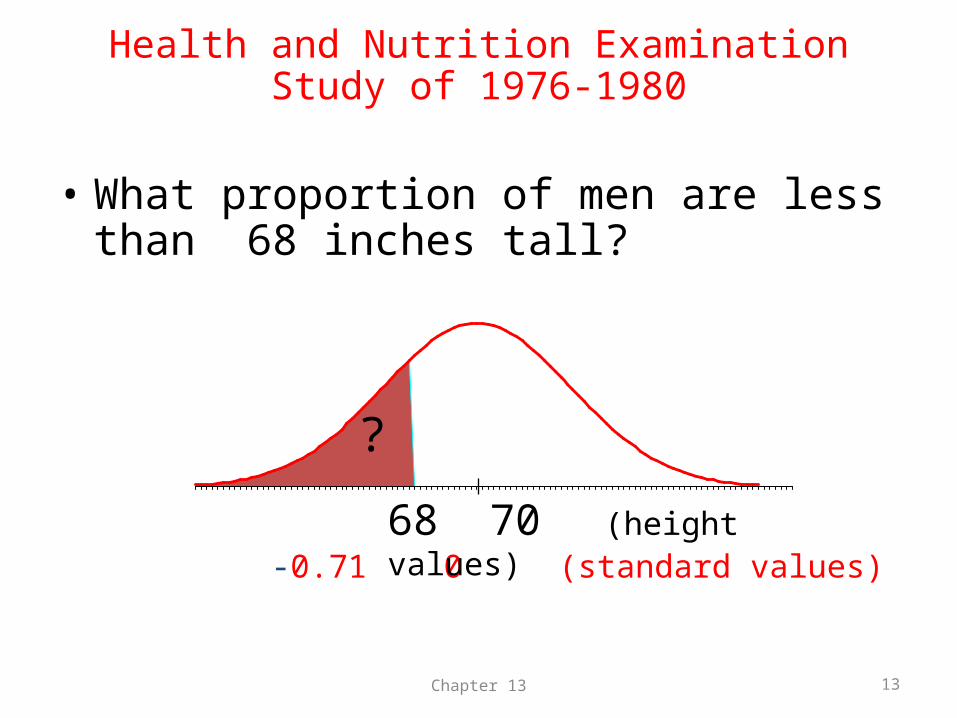
• What proportion of men are less than 68 inches tall?
Chapter 13 13
-0.71 0 (standard values)68 70 (height values)
?
Health and Nutrition Examination Study of 1976-1980
Table B: Percentiles of the standard Normal Distribution
• See pg. 599 in text for Table B (the “Standard Normal Table”).
• Look up the closest standard score in the table.
• Find the percentile corresponding to the standard score (this is the percent of values below the corresponding standard score or z-value).
Chapter 13 14
Chapter 13 15
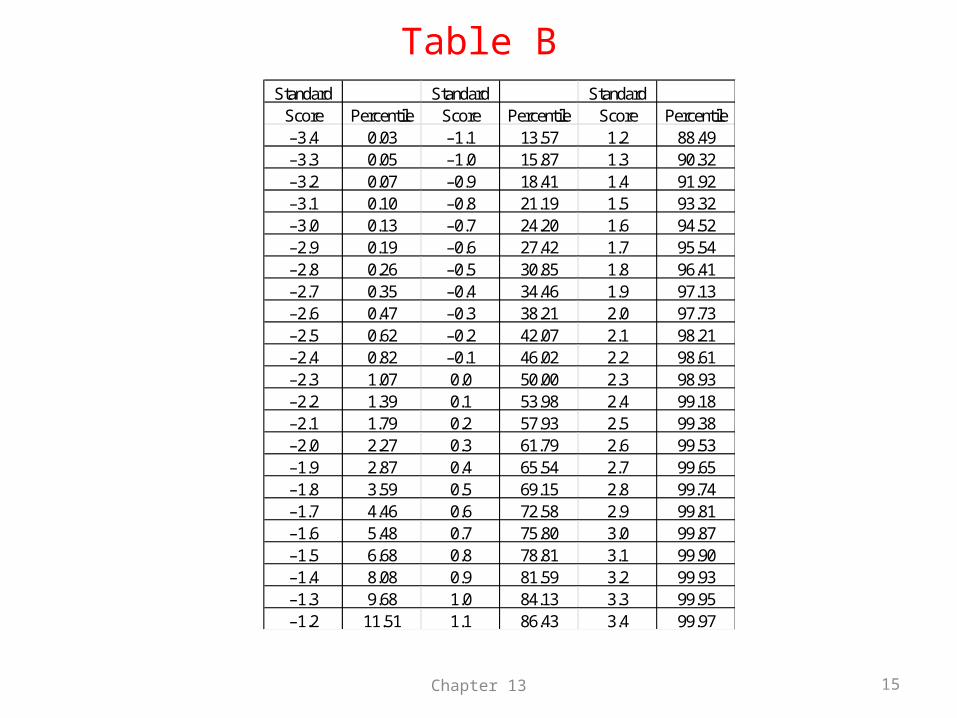
Table BStandard Standard Standard
Score Percentile Score Percentile Score Percentile–3.4 0.03 –1.1 13.57 1.2 88.49–3.3 0.05 –1.0 15.87 1.3 90.32–3.2 0.07 –0.9 18.41 1.4 91.92–3.1 0.10 –0.8 21.19 1.5 93.32–3.0 0.13 –0.7 24.20 1.6 94.52–2.9 0.19 –0.6 27.42 1.7 95.54–2.8 0.26 –0.5 30.85 1.8 96.41–2.7 0.35 –0.4 34.46 1.9 97.13–2.6 0.47 –0.3 38.21 2.0 97.73–2.5 0.62 –0.2 42.07 2.1 98.21–2.4 0.82 –0.1 46.02 2.2 98.61–2.3 1.07 0.0 50.00 2.3 98.93–2.2 1.39 0.1 53.98 2.4 99.18–2.1 1.79 0.2 57.93 2.5 99.38–2.0 2.27 0.3 61.79 2.6 99.53–1.9 2.87 0.4 65.54 2.7 99.65–1.8 3.59 0.5 69.15 2.8 99.74–1.7 4.46 0.6 72.58 2.9 99.81–1.6 5.48 0.7 75.80 3.0 99.87–1.5 6.68 0.8 78.81 3.1 99.90–1.4 8.08 0.9 81.59 3.2 99.93–1.3 9.68 1.0 84.13 3.3 99.95–1.2 11.51 1.1 86.43 3.4 99.97
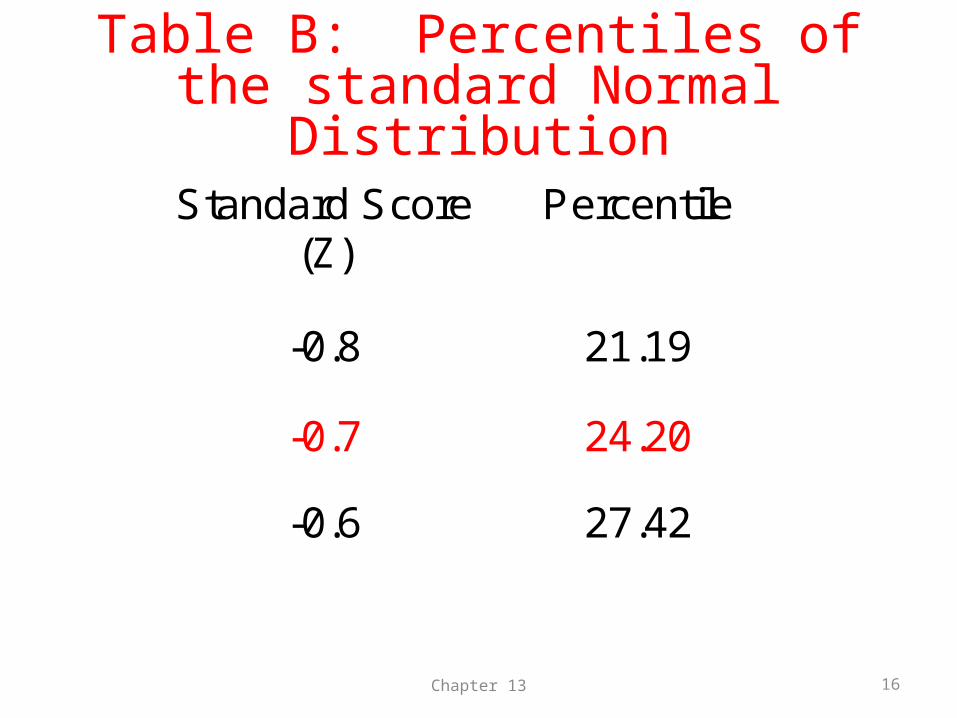
Table B: Percentiles of the standard Normal Distribution
Chapter 13 16
Standard Score (Z)
Percentile
-0.8 21.19
-0.7 24.20
-0.6 27.42
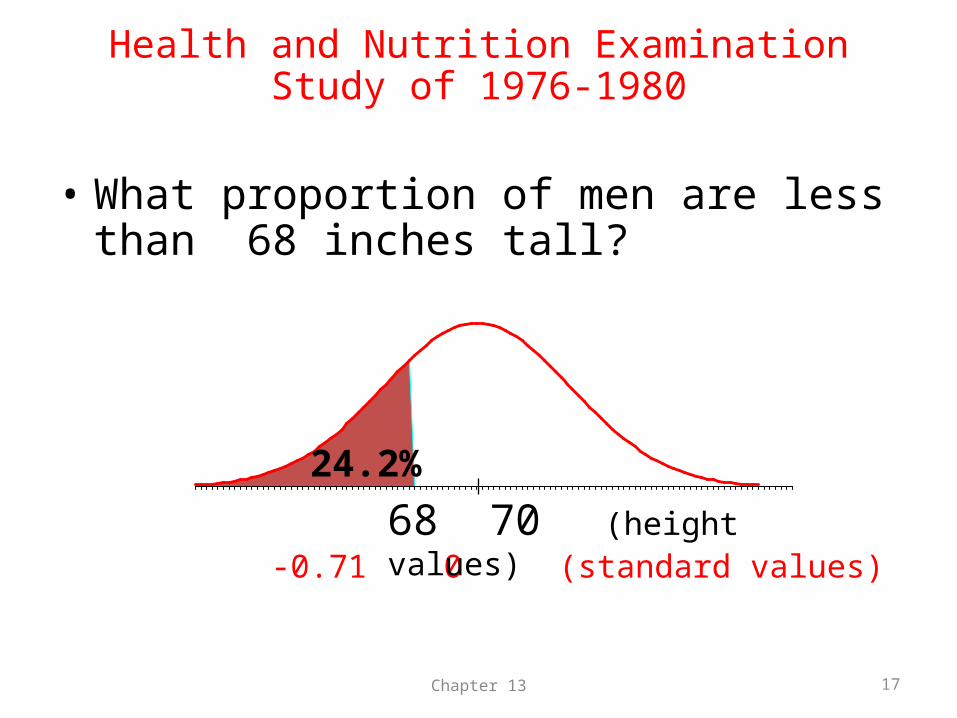
• What proportion of men are less than 68 inches tall?
Chapter 13 17
-0.71 0 (standard values)68 70 (height values)
24.2%
Health and Nutrition Examination Study of 1976-1980
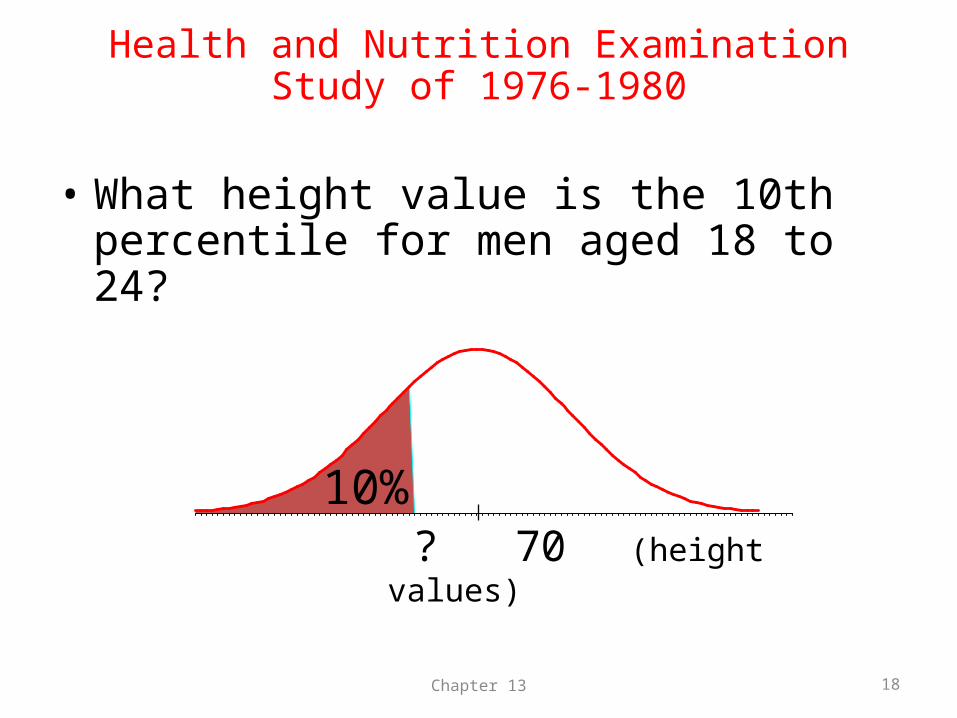
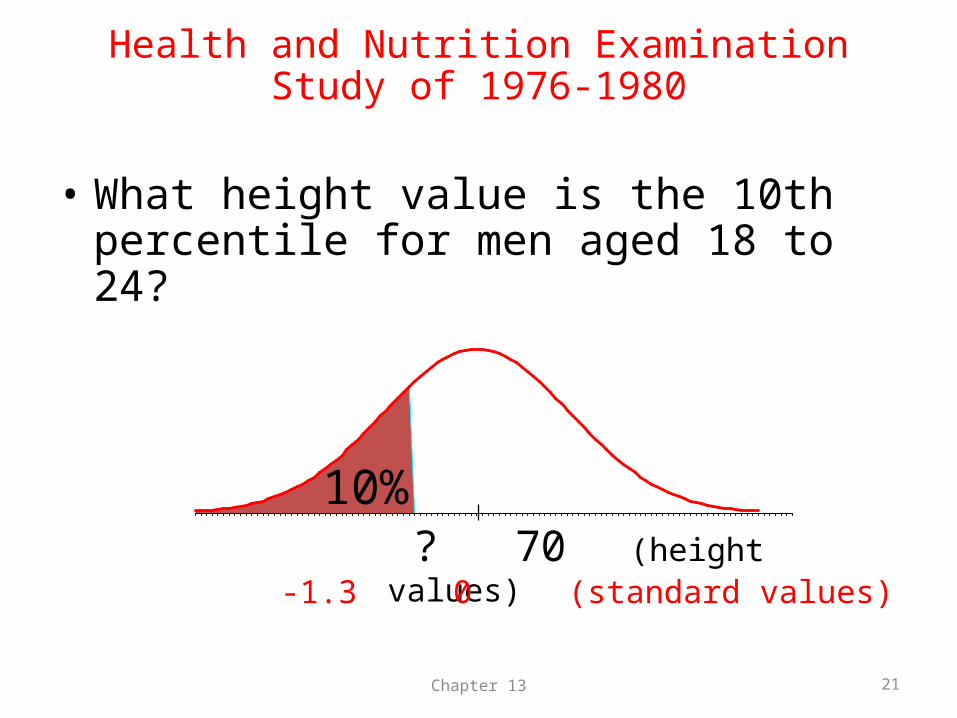
• What height value is the 10th percentile for men aged 18 to 24?
Chapter 13 18
10% ? 70 (height values)
Health and Nutrition Examination Study of 1976-1980
Table B: Percentiles of the standard Normal Distribution
• See pg. 599 in text for Table B.
• Look up the closest percentile in the table.
• Find the corresponding standard score.
• The value you seek is that many standard deviations from the mean.
Chapter 13 19
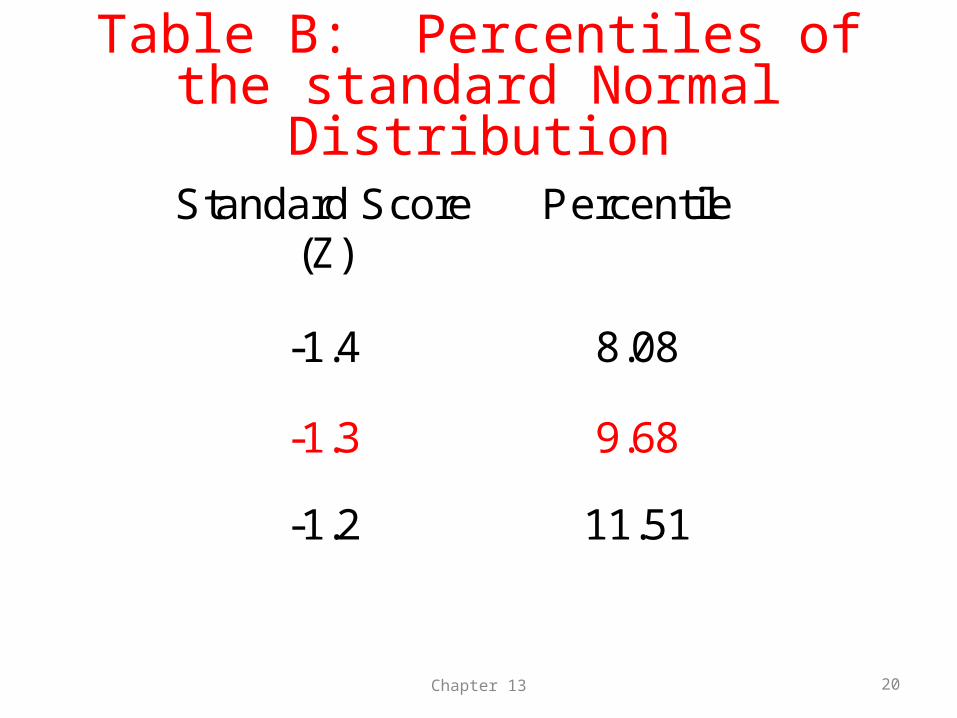
Table B: Percentiles of the standard Normal Distribution
Chapter 13 20
Standard Score (Z)
Percentile
-1.4 8.08
-1.3 9.68
-1.2 11.51
• What height value is the 10th percentile for men aged 18 to 24?
Chapter 13 21
10% ? 70 (height values)
-1.3 0 (standard values)
Health and Nutrition Examination Study of 1976-1980
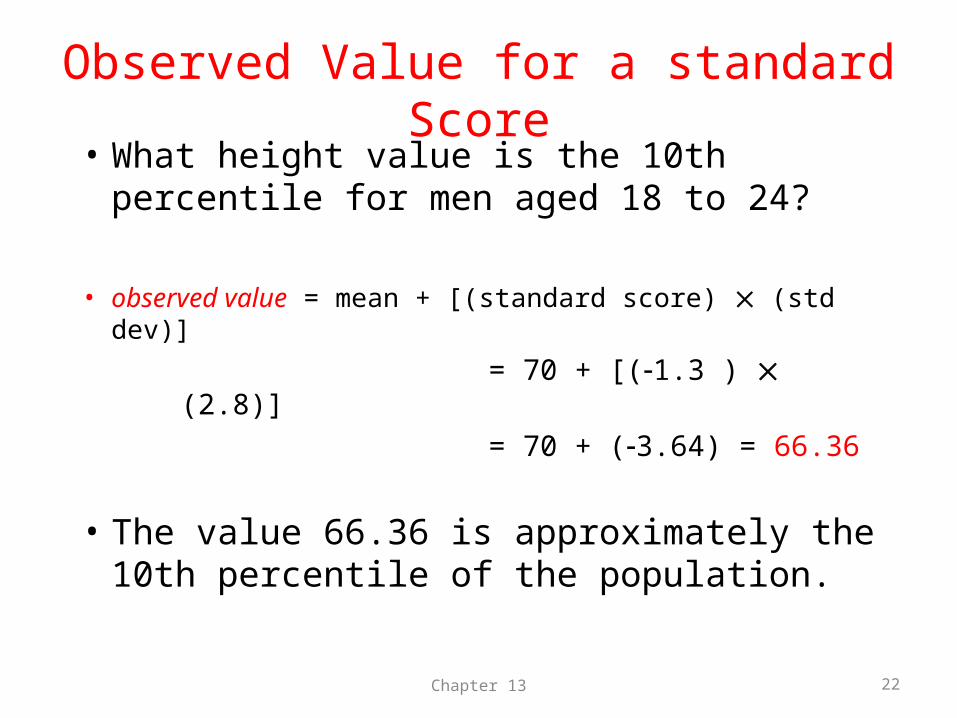
Observed Value for a standard Score• What height value is the 10th percentile for
men aged 18 to 24?
• observed value = mean + [(standard score) (std dev)]
= 70 + [(1.3 ) (2.8)] = 70 + (3.64) = 66.36
• The value 66.36 is approximately the 10th percentile of the population.
Chapter 13 22
Observed Value for a standard Score
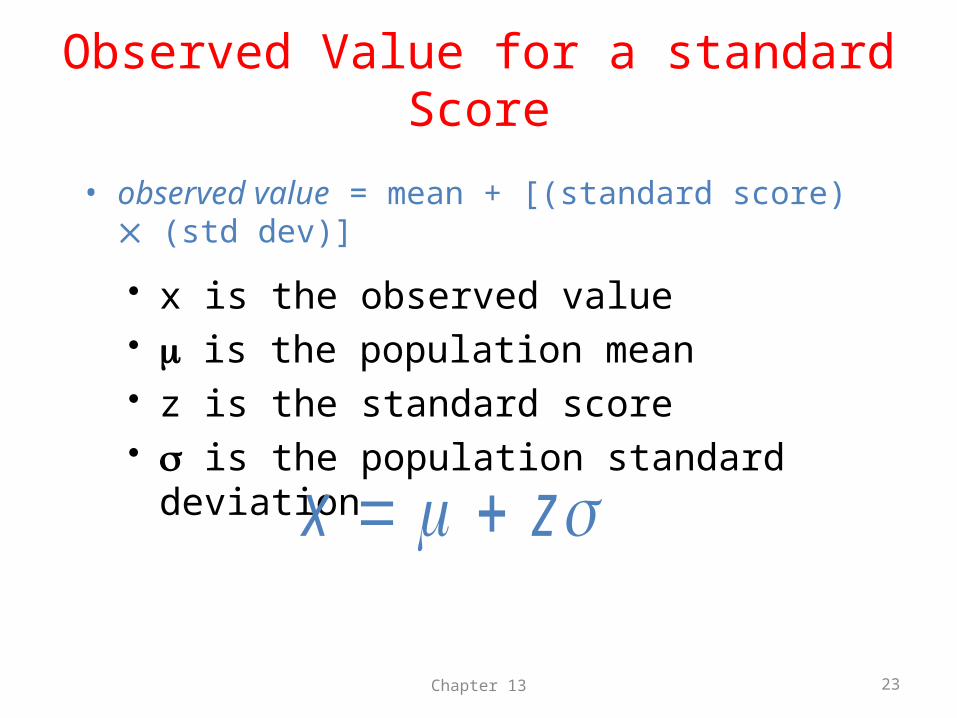
• observed value = mean + [(standard score) (std dev)]
x is the observed value is the population mean z is the standard score is the population standard deviation
Chapter 13 23
x z
Key Concepts
• Population values are distributed with differing shapes, some normal, some non-normal.
• Empirical Rule (“68-95-99.7 Rule”)• standard Score• Percentile• Standard Normal Table
Chapter 13 24
Exercise 13.7 – 13.9IQ Test Scores. Figure 13.13 is a stemplot of the IQ test of 74 seventh-grade students. This distribution is very close to Normal with mean 111 and standard deviation 11. It includes all the seventh-graders in a rural Midwest school except for 4 low outliers who were dropped because they may have been ill or otherwise not pay attention to the test. Take the Normal distribution with mean 111 and standard deviation as a description of the IQ test score of all rural Midwest seventh-grade students. Chapter 13 25
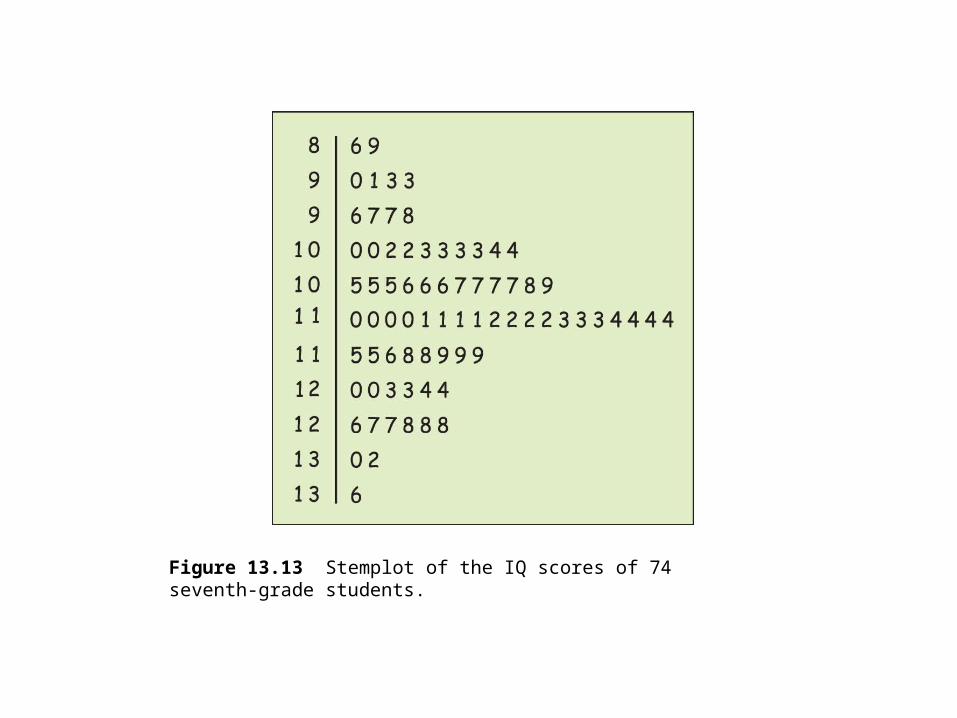
Figure 13.13 Stemplot of the IQ scores of 74 seventh-grade students.
• 13.7 Between what values do the IQ scores of 95% of all rural Midwest seventh-graders lie?
• 13.8 what percentage of all students have IQ scores are less than 100?
• 13.9 what percentage of all students have IQ scores 144 or higher? None of the 74 students in our sample school had scores this high. Are you surprised at this? Why?
Chapter 13 27
Exercise 13.14Comparing IQ Scores. The Wechsler Adult Intelligence Scale ( WAIS) is an IQ test. Scores on the WAIS for the 20 to 34 age group are approximately Normally distributed with mean 110 and standard deviation 15. Scores for the 60 to 64 age group are approximately Normally distributed with mean 90 and standard deviation 15. Sarah, who is 30, scores 130 on the WAIS. Her mother, who is 60, takes the test and scores 115.
Chapter 13 28
• (a) Express both scores as standard scores that show where each woman stands within her own age group.
• (b) Who scored higher relative to her age group, Sarah or her mother? Who has the higher absolute level of the variable measured by the test?
Chapter 13 29
Exercise 13.21NCAA rules for athletes. The NCAA requires Division II athletes to get a combined score of at least 820 on the Mathematics and Critical Reading sections of the SAT exam in order to compete in their first college year. In 2007, the combined scores of the millions of college-bound seniors taking the SATs were approximately Normal with mean 1017 and standard deviation approximately 210. What percentage of all college-bound seniors had scores less than 820?
Chapter 13 30
Exercise 13.22More NCAA rules. For Division I athletes the NCAA uses a sliding scale, based on both core GPA and the combined Mathematics and Critical Reading SAT score, to determine eligibility to compete in the first year of college. For athletes with a core GPA of 3.0, a score of at least 620 on the combined Mathematics and Critical Reading sections of the SAT exam is required. Use the information in the previous exercise to find the percentage of all SAT scores of college-bound seniors that are less than 620.Chapter 13 31
Exercise 13.23800 on the SAT. It is possible to score higher than 800 on the SAT, but scores above 800 are reported as 800. ( That is, a student can get a reported score of 800 without a perfect paper.) In 2007, the scores of college-bound senior men on the SAT Math test followed a Normal distribution with mean 533 and standard deviation 116. What percentage of scores were above 800 ( and so reported as 800 ) ?
Chapter 13 32