chapter 13 population labour force and employment - finance · 189 chapter 13 population labour...
TRANSCRIPT

189
Chapter 13
POPULATION LABOUR FORCE AND EMPLOYMENT
Introduction
At the time of independence in 1947, 32.5 million people lived in Pakistan. By 2006-07, the population is estimated to have reached 156.77 million. Thus in roughly three generations, Pakistan’s population has increased by 124.27 million or has grown at an average rate of 2.6 percent per annum. While Pakistan has more mouths to feed, more families to house, more children to educate, and more people looking for gainful employment, the high population also represents an abundance of labour which can be used for productive purposes. The large population also represents a large potential market for goods and services. This large consumer base with increasing disposable income may attract even more foreign investment. The large population therefore represents a big opportunity for Pakistan to benefit from demographic dividend which can fuel Pakistan’s growth for the next fifty years. The interest in relationship between population change and economic growth has reignited in Pakistan which is experiencing declining fertility and mortality rates and therefore declining growth in population. Consequently, Pakistan is witnessing changes in age structure with proportion of working age population increasing and offering a life time window of opportunity to turn demographic transition into demographic dividend.
What is demographic transition and demographic dividend? The demographic dividend is defined as “transition from a largely rural agrarian society with high fertility and mortality rates to a predominantly urban industrial society with low fertility and mortality rates”. Demographic transition consists of three phases resulting from the lag between changes in fertility and mortality.
At an early stage of this transition (phase one) the fertility and mortality rates are high, resulting in the decline of the share of working age population and creating bulge in the young age groups. In other words, the share of dependent population is higher, freeing less resource for investment and growth. During the second phase, fertility rates decline, leading to fewer younger dependents. On the other hand, the population bulge enters and stays in the working age. The working age population grows more rapidly than the population dependent on it, freeing up resources for investment and economic growth. Other things being equal, per capita income grows more rapidly and therefore making more income available for dependents. Accordingly, the welfare of the family improves. This dividend period is quite long and lasts five decades or more.
During the third phase, low fertility rates reduce the growth of young age population while the working age population moves out of the workforce gradually. In other words, the inflows of young age population moving into working age slows, the current working age population moves out of work force gradually and continuing improvement in old age mortality increases the share of elderly population . Other things being equal, per capita income grows more slowly and the first dividend begins to evaporate. But a second dividend is also possible. The working age population reaching retirement level has a powerful incentive to accumulate assets unless it is confident that its needs will be provided for by families or governments. Whether these additional assets are invested domestically or abroad, national income will rise. Therefore, the first dividend yields a transitory bonus lasting for over five decades and the second dividend transforms that bonus into greater assets and sustainable development. These outcomes are not

Economic Survey 2006-07
190
automatic but depend on the implementation of effective policies. Thus, the dividend period is a life
time window of opportunity rather than a guarantee of improved standards of living.
Fig 13.1(a): Population Pyramid for Pakistan, 1961 (Census)
20 15 10 5 0 5 10 15 20
0-0405-0910-1415-1920-2425-2930-3435-3940-4445-4950-5455-59
60 and over
Age
Gro
up
Total Population (Percent) 39.44 Million
Male % Female %
Fig 13.1(b): Population Pyramid for Pakistan, 2006 (E)
8 3 2 7
0-0405-0910-1415-1920-2425-2930-3435-3940-4445-4950-5455-59
60 and over
Age
Gro
up
Total Population (Percent) 156.77 Million
Male % Female %
Where exactly is Pakistan in this demographic transition? As shown in Table 13.1, the Population Census data depicts two phases of demographic transition. During the first phase when fertility rates were higher (see Fig-13.1) the share of young age (0-14) population continued to rise thereby creating bulge in young age population while the share of prime age (15-59) continued to decline until 1981. Pakistan appears to have entered the second phase of demographic transition from 1981 onward as it has witnessed a secular decline in fertility rate from 6.0 to 3.8 resulting in the rise of the of working age population and consequent decline in the share of dependent population (see Table 13.1 & Fig. 3.2). Theoretically, therefore, Pakistan’s long term growth potential should be a function of factors such as demographics, physical capital stock and productivity.
Pakistan is currently passing through the demographic transition phase which provides a window of opportunity to convert this transition into demographic dividend. Empirical evidence support the fact that Pakistan is in the second phase of demographic transition as more resources are available for investment , economic growth is accelerating and per capita income is rising at a faster pace. In other words, Pakistan has already started reaping its first dividend on the back of a large-scale spending on social sector (education,
health vocational training, etc.) over the last several years.
Table 13.1: Demographic Transition in Pakistan (%) Census** Young
(0-14 age) Prime
(15-59 age) Old
(60 + age) 1961 42.4 50.6 6.9 1972 43.8 49.2 7.0 1981 44.5 48.5 7.0 1998* 43.4 51.1 5.5 2006 (E) 36.8 57.2 6.0
Source: Various Economic Surveys & P & D Division *No census was conducted between 1981 & 1998 **The years listed in Table 13.1 are calendar years
6.36
5.4 5.4
4.5
3.8
3
4
5
6
7
1970
-75
1984
-85
1986
-91
1992
-96
1997
-00
2005
-06
Source: National Institute of Population Studies (NIPS)
Fig 13.2 : Trend in Total Fertility Rate,1970-2005

Population, Labour Force & Employment
191
The demographic dividend being currently experienced in Pakistan is affecting growth through the mechanisms of labor supply , saving and human capital in conjunction with rising per capita income , growing middle class, availability of consumer credit , inflows of workers remittance and rising exports (foreign demand). These are fueling consumption demand leading to the expansion of domestic markets. The growing domestic demand is being met through various booming sectors of the economy such as agriculture, manufacturing and services. As such, the strong domestic demand leading to the expansion of domestic market has emerged as a key driver of economic growth and is supporting the ongoing growth momentum. Foreseeing the importance of human development to realize the benefits from demographic dividend for an emerging economy like Pakistan, the government has already initiated a large number of programs to ramp up social spending. These programs include the recently launched National Internship Program, establishment of the National Vocational and Technical Education Commission (NAVTEC), increased budgetary allocation for social sectors, especially education (including higher education through the Higher Education Commission (HEC)), health, population etc. In addition, the Government has launched Rozgar Scheme (self employment scheme), Khushal Pakistan Program and many other initiatives.
13.1 Population Overview
13.1.1 Population Indicators
While mortality has been decreasing and fertility has shown a significant decline over the recent years, the crude death rate (CDR) of Pakistan is estimated at 7.1 (per thousand) in 2005-06. In Pakistan, decline in mortality rate is due to the elimination of epidemic diseases and improvement in medical services. Despite a considerable decline in the total mortality in Pakistan, infant mortality has still remained high at 70 per thousand live births in 2005-06. The major reasons for this high rate of infant and child mortality are diarrhea and pneumonia. Maternal mortality ratio ranges from
350-400 per hundred thousand births per year. On the other hand, contraceptive prevalence rate (CPR) is at 26 percent and total fertility rate (TFR) has declined from 4.5 percent in 2001-02 to 3.8 percent in 2005-06.
13.1.2 Population Welfare Program
In 1953, the Family Planning Association of Pakistan (Non-Government Organization) initiated few clinics to provide family planning services. During the second plan period (1960-65) the Population Welfare Program was started by the Ministry of Health but the program did not show adequate progress. Finally an autonomous Family Planning Council was created in 1965 to run the program independently. In 1965, the annual crude birth rate was around 45 per thousand and death rate was around 18 per thousand whereas the net growth rate was 2.7 percent per annum. The overall execution and entire funding of this Program is the responsibility of the Federal Government. The Ministry of Population Welfare is the main executing agency of the national program while implementation of field activities is the responsibility of the Population Welfare Departments in each of the four Provinces of Pakistan
During the past decade though the program enjoyed full political support and commitment from the government, it lacked the most important ingredient to make any program successful, that is, backing from the community. The community based approach could not be fully materialized due to religious, social and cultural norms of the society. Low literacy rate particularly among women happens to be another major stumbling block in the way of the program’s success. However, along with the passage of time and gradual globalization of the society, people have started to slowly but steadily recognize the usefulness of the population welfare program. Nevertheless, keeping in mind the prevailing trend of low literacy rate and other socio-cultural and religious norms, the Population Welfare Program would need more time to reach the replacement level of fertility in Pakistan.
With the commencement of the new millennium, the population welfare program has also taken a turn for the better. This turn in policy is a shift
Economic Survey 2006-07
192
from the focus on fertility towards a more comprehensive approach of integrating family planning with reproductive health and also
addressing wider range of concerns, especially economic status, education and gender equality.
Box-13.1: Population Policy of Pakistan
The Population Policy is the outcome of a participatory process and enjoys the consensus of all stakeholders and partners, within government, NGOs and civil society.
Goals
The Population Policy seeks to; Attain a balance between resources and population within the broad parameters of the International
Conference on Population and Development (ICPD) paradigm.
Address various dimensions of the population issue within national law and development priorities while remaining within our national social and cultural norms.
Increase awareness of the adverse consequences of rapid population growth both at the national, provincial, district and community levels.
Promote family planning as an entitlement based on informed and voluntary choice.
Attain a reduction in fertility through improvement in access and quality of reproductive health services.
Reduce population momentum through a delay in the first birth, changing spacing patterns and reduction in family size desires.
Objectives
Short Term:
Reduce population growth to 1.90 percent per annum by 2004. This objective of the population policy has already been achieved
Reduce fertility through enhanced voluntary contraception to 4 births per woman by the year 2004. This objective of the population policy has already been achieved
Long Term:
Reduce population growth rate from 1.90 per cent per annum in 2004 to 1.3 percent per annum by the year 2020.
Reduce fertility through enhanced voluntary contraceptive adoption to replacement level of 2.1 births per woman by 2020.
Universal access to safe family planning methods by 2010.
Source: Ministry of Population Welfare One of the major achievements of the Cairo Conference has been the recognition of the need to empower women, both as being highly important in itself and as a key to improving the quality of life for everyone. It also emphasizes that men have a key role to play in bringing about gender equality, in fostering women's full participation in
development and in improving women's reproductive health.
In this context goals are set out in three related areas: expanded access to education, particularly for girls; reduced mortality rates; and increased access to quality reproductive health services, including family planning. The International
Population, Labour Force & Employment
193
Conference on Population and Development (ICPD) Program of Action urges all countries to make reproductive health care and family planning accessible through primary health care system to all individuals of appropriate ages no later than 2015.
Table-13.2: Selected Demographic Indicators (Latest available) Indicators Current Year (2006-07) Total Fertility Rate (TFR) 2005-06 3.8
Crude Birth Rate (CBR) 2005-06 26.1
Crude Death Rate (CDR) 2005-06 7.1
Growth Rate 1.80% Infant Mortality Rate (IMR) (2005-06) 70
Maternal Mortality Rate (MMR) (2004-05) 350-400
Life Expectancy at Birth (2005-06)*
Male: 64 Years Female: 66 Years
Source: Federal Bureau of Statistics * Planning and Development Division. Some of the major strategies being pursued by the program with special attention to rural areas are:
Expansion of family planning services in the rural areas through village-based family planning workers;
Mobile service units for covering the far flung villages having no access to family planning services;
Expansion in service delivery through family welfare centres and reproductive health service centres in the public and private sectors for provision of contraceptive surgery;
Effective and increased involvement of all health outlets in the public and private sectors by providing training/refresher courses, basic equipment, sign boards and regular supply of contraceptives to paramedics;
Introduction of family planning and Mother and Child Health (MCH) services in Federally Administered Tribal Areas (FATA) adjoining the NWFP through their health infrastructure;
Reinforcement of family planning and MCH services in the Azad State of Jammu and Kashmir (AJK) and the Northern Areas;
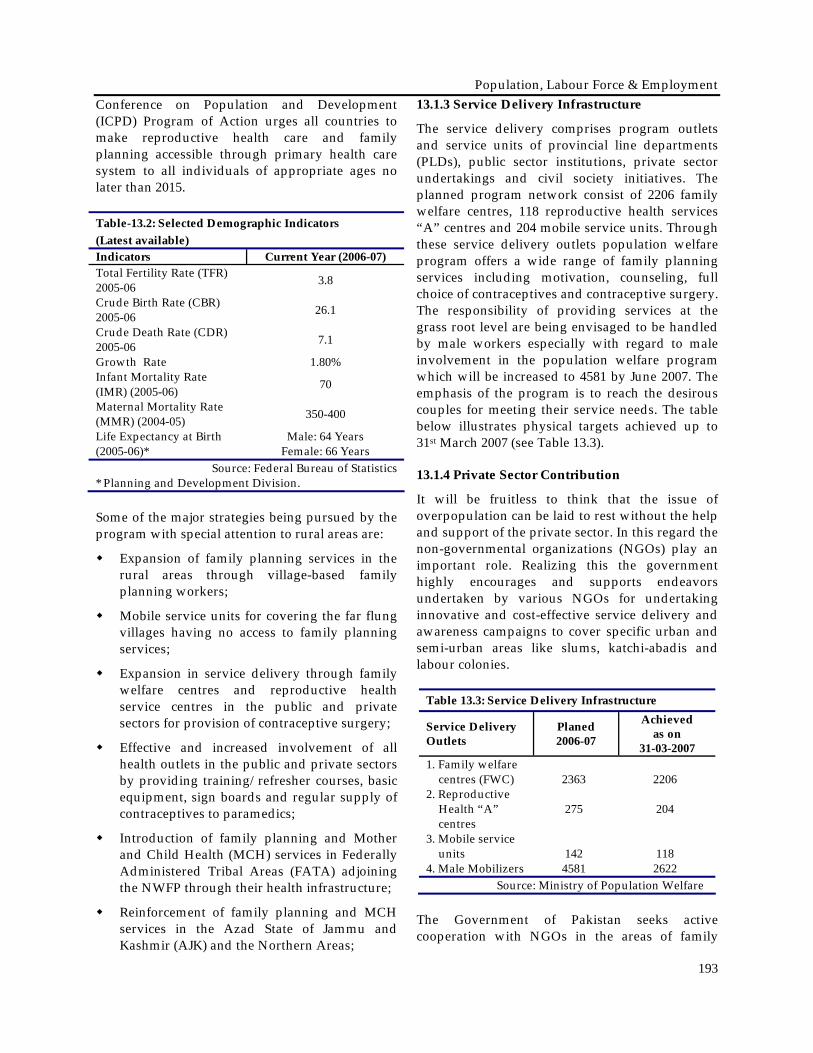
13.1.3 Service Delivery Infrastructure
The service delivery comprises program outlets and service units of provincial line departments (PLDs), public sector institutions, private sector undertakings and civil society initiatives. The planned program network consist of 2206 family welfare centres, 118 reproductive health services “A” centres and 204 mobile service units. Through these service delivery outlets population welfare program offers a wide range of family planning services including motivation, counseling, full choice of contraceptives and contraceptive surgery. The responsibility of providing services at the grass root level are being envisaged to be handled by male workers especially with regard to male involvement in the population welfare program which will be increased to 4581 by June 2007. The emphasis of the program is to reach the desirous couples for meeting their service needs. The table below illustrates physical targets achieved up to 31st March 2007 (see Table 13.3).
13.1.4 Private Sector Contribution
It will be fruitless to think that the issue of overpopulation can be laid to rest without the help and support of the private sector. In this regard the non-governmental organizations (NGOs) play an important role. Realizing this the government highly encourages and supports endeavors undertaken by various NGOs for undertaking innovative and cost-effective service delivery and awareness campaigns to cover specific urban and semi-urban areas like slums, katchi-abadis and labour colonies.
Table 13.3: Service Delivery Infrastructure
Service Delivery Outlets
Planed 2006-07
Achieved as on
31-03-2007 1. Family welfare
centres (FWC)
2363
2206 2. Reproductive
Health “A” centres
275
204
3. Mobile service units
142
118
4. Male Mobilizers 4581 2622 Source: Ministry of Population Welfare
The Government of Pakistan seeks active cooperation with NGOs in the areas of family

Economic Survey 2006-07
194
planning and reproductive health through the Ministry of Population Welfare, and the National Trust for Population Welfare (NATPOW). One example of cooperation between the NGOs and the Government is sharing the responsibility of meeting national population sector targets. NGOs use initiative, creativity, and take innovative steps because of their size and limited commitment; they can create "models" for replication. The NGOs have contributed significantly in promoting the cause of the population program in the country. Overall, some 264 NGOs with 479 outlets, operating throughout the country, have been registered with National Trust for Population Welfare (NATPOW) till date.
The private sector is also involved in the crusade against over population through Social Marketing (SM) activities with the aim of making Family Planning (FP) information and services available more widely at reduced rates. Currently SM Projects are funded by the KFW (Development Bank of Germany) and Department for International Development (DFID), U.K. The Projects are executed outside the Public Sector Development Program (PSDP) by Social Marketing Pakistan, by adopting independent logo of "Green Star" The other Project is executed by Key Social Marketing by using an independent logo of "key". The range of activities of SM includes advertisement/promotional campaign, training of doctors, paramedic & chemists as well as dispensation of contraceptives through a commercial distribution network of over 58,000 distribution/service points.
13.1.5 Some Future Strategies
Strategizing for the future is imperative in order to curb over population in Pakistan. In this regard numerous measures and procedures have been adopted. From the side of population management these include launching of advocacy campaigns for all segments of the society, ensuring ownership and participation of communities and stakeholders in service delivery. On the other hand, the health sector is involved by reducing unmet need for quality family planning and rural health (RH) services, adopting a shift from target oriented to people-centered approach, creating a comprehensive network of family planning & RH services in Pakistan, building a stronger
partnership with all the stakeholders in private and public sectors. In addition, mainstreaming population factor as a across cutting issue, strengthening contribution to population activities by all stakeholders, expanding social marketing of contraceptives, accessibility and affordability in rural and under-served areas, bringing attitudinal change in men to adopt small family norms and responsible parenthood, involving opinion leaders and religious scholars in the population control program and expanding family planning to under-served area also comes under the umbrella of future population control and management strategies.
Some recent policy directives issued by the Ministry of Population Welfare in order to boost its population welfare program are: establishment of population commission, directions issued to all social sector ministries and provincial departments for mainstreaming the population issues and responses, parliamentarians to project population as a cross cutting issue and over see progress in their constituencies, mandatory provision of family planning services from all service delivery units of health departments and lady health workers programs. Further more the following policy directives are also issued by the Ministry, district technical committee headed by EDO health, sustained management support infrastructure for flagship initiative of the public/private partnership for promoting FP/RH services, revamping/rejuvenating of National Trust for Population Welfare (NATPOW), annual grant-in-aid of Rs 200 million to NATPOW for promoting FP/RH through NGOs.
The population profile in Pakistan reveals that in order to achieve sustainable development and to control overpopulation, empowerment of women, effective use of resources, efficient family planning, and popularization of small family norm are imperative. Furthermore, slowdown in population growth rate, wider coverage of reproductive health services, education of women, and effective steps to eradicate poverty are prerequisites for sustainable development in Pakistan as well.

Population, Labour Force & Employment
195
13.2 Labour Force and Employment In an era of knowledge economy, human resource development and its management have assumed added importance as key driver of growth. Until recent past, Pakistan has, however, lagged behind in this field. Technological developments in the last centaury have transformed a majority of economic activities which are now more knowledge based than physical based. The level of education and training is comparatively very high in knowledge based economies and a considerable portion of GDP is invested in the skill development. Specific sectors like information technology, services etc in the guise of outsourcing are prominent examples of a skill or knowledge based economy.
Pakistan is also working to move towards a knowledge based economy. According to the Medium Term Development Program (MTDP) 2005-10, there is a strategy to move towards an efficient, balanced, internationally competitive, environmental friendly and technologically driven knowledge economy. There are two major potential challenges in shaping the knowledge base economy – the quality and quantity of education and investment in skill development to develop knowledge hubs. As such there is no prescribed unit for qualifying knowledge to measure in numerical figures but it can be assessed with the help of certain indicators which reflect in economic performance. One 0f these indicators is TFP or Total factor Productivity which is frequently used for measuring productivity levels of labour.
According to latest Labour Force Survey (2005-06,) at the moment there is 46.9 million employed labour force in the country. Whereas only 3 million workers are unemployed out of 50.05 million total labour force (see Table 13.4). It is no mean feat to adequately absorb such a huge labour force. However due to the Government’s prudent and far sighted economic policies this task has been successfully accomplished.
Pakistan is a country with about 25 million youth of 18-25 years age group but a very small percentage 1.7 percent are able to make contribution in national economy by applying their training and education. Around 540 technical and vocational institutions have the capacity to produce only 200, 000 skilled people every year which is inadequate as compared to the demand of the economy and the country’s population. Just focusing on enhancing the enrolment in technical institutes is not enough. We need to put emphasis on quality and quantity of skill development which match the needs of the firms and entrepreneurs.
To establish a market-based economy there is a need to have a change in strategy. Long term planning is mandatory-based on realistic assessment of our economic activities in the light of emerging trends and prudent investment policies. This requires three generations of investment reforms: first generation reforms calls for adoption of market-friendly policies – to liberalize the investment regimes by reducing barriers towards FDI, strengthening standards of treatment for foreign investors and giving a greater role to market forces in resource allocation. To move towards third generation reforms, investment promotion policies framework is required for attracting investment to target key investors in the identified industries and firms thus constituting second generation reforms. Further to meet their respective vocational workforce, there is a need to have programs of transfer of knowledge through global production networks and establishment of “knowledge hubs” in the light of industry development priorities. This is the only gateway for Pakistan to establish a successful knowledge based economy. Globalization of local knowledge and localization of global knowledge are the pre-requisites of knowledge based economy.
The employment generation, poverty reduction and human resource development are the main features of the development pursuits in Pakistan. The employment led growth rate captures a central
Economic Survey 2006-07
196
place in sustainability of development efforts and is crucially linked with the availability of decent work opportunities for able and willing adults. Along with the various measures taken to meet the above mentioned challenges the government has laid down the parameters for the growth of trade unions; protection of workers rights; the settlement of industrial disputes; and the redress of workers grievances through announcement of five labour policies. These policies also ensure compliance with international labour standards ratified by Pakistan.
13.2.1 Labour Market Overview
The over all employment and labour market situation in the country continues to draw attention in economic and social policy making. In order to make the conditions conducive for employment creation government needs to identify and remove perverse incentives that bias investment towards capital- intensive techniques. There is need to adopt a sectoral approach to create conditions for investment in employment intensive industries.
The recent turnaround in the economy and GDP growth rate on the trajectory of 6-8 percent in recent years is in sharp contrast to 1.8 percent in the year 2000-01. There is wider optimism in sustaining the growth trends is partly a result of consistent, participative and predictable policies. The medium term development framework 2005-10 (MTDF) stresses on just and sustainable economic system for reducing poverty and achieving millennium development goals (MDGs) by the target year of 2015. Furthermore, the MTDF incorporates a paradigm shift towards enhancing competitiveness not only by means of higher investment but also through knowledge inputs to maximize total factor productivity.
Cognizant of the situation the Government has tried to incorporate all elements needed toward the creation of the decent work opportunities. These elements include: Economic governance, macro economic stability; Institutional reforms, deregulation and privatization; Creation of conditions that sufficiently motivate private sector and attract foreign investors; Building and strengthening physical infrastructure; Enhancing
technical and vocational competence of the work force, strengthening of the SMEs and developing entrepreneurship; Gender mainstreaming and designing the programs targeting women and youth and labour markets and Policies and institutions.
Table 13.4: Civilian Labor Force, Employed and Unemployed for Pakistan (millions)
2001-02 2003-04 2005-06
Labour Force 41.83 45.5 50.05 Employed 38.37 42.0 46.95 Unemployed 3.46 3.5 3.1
Source: Labour Force Survey 2001-02, 2003-04 & 2005-06
13.2.2 Labour Force Participation Rate
The Pakistani working age population is estimated to be 105.37 million. However, a significant number of this is not a part of the economically active population. Those not active in the labor market include: housewives, students, handicapped, senior citizens, etc. Internationally, economically active population is defined as the proportion of population that is either employed or looking for work. This is also referred to as labor force or labor supply. The labor force participation rate is measured on the basis of Crude Activity Rate (CAR) and Refined Activity Rate (RAR). The CAR is the percentage of the labor force in the total population while RAR is the percentage of the labor force in the population of persons 10 years of age and above.
The labor market in Pakistan demonstrates a lower labor force participation rate (LFPR) as compared to its co mpetitors. It has been in the range of 28.6% -32.3% over a decade; even the RAR is low and hovered at 43% over a decade (see Table-13.5). It is nevertheless important to point out that both these ratios are increasing in recent years. This is mainly attributed to increasing economic activities that are fairly diversified and thus are not only generating employment opportunities but also motivating others to join workforce. The crude activity rate has stayed roughly constant since 1980, but has started to rise in the last few years: from 29.6% in year 2001-02 to 32.3% in 2005-06. Similarly, the RAR has also started to increase from past trend of

Population, Labour Force & Employment
197
43.3% in 2001-02 to 46% in 2006-07. Participation rates are highest in Punjab and lowest in NWFP.
These rising rates of participation point towards an increasing optimism in the labor market.
Table -13.5: Population, Labor Force and Labor Force Participation (LFP) Rates Year Population
(million) Labor Force
(million) LFP Rate (percent)
Total Working age* Total Increase Crude Refined
1996-97 126.90 84.65 36.30 1.57 28.6 43.0
1997-98 130.58 88.52 38.20 1.90 29.3 43.3
1999-00 136.01 92.05 39.4 1.20 29.4 42.8
2001-02 145.80 99.60 42.39 2.99 29.6 43.3
2003-04 148.72 103.40 45.23 2.84 30.4 43.7
2005-06 151.55 105.37 48.95 3.72 32.3 46.0
Source: Labour Force Survey 2001-02, 2003-04 & 2005-06 * Population 10 years and above is considered as working age population. Further disaggregating of the data reveals other important trends. The LFPR has been increasing over the years but still it is low and even lower for the female segment of the population, however the low LFPR indicates huge reservoirs of human resources that can be effectively utilized for future economic growth. Moreover, the trends in the LFPR show that there has been a substantial increase in the female labour force over the years (15.9% in 2003-04 to 18.9% in 2005-06). Though increasing, female LFP rate continues to be exceptionally low as compared to the South Asian countries where it ranges between 35-50 percent. Female participation in Balochistan (12.6%), NWFP (13.0%) and Sindh (9.1%) are especially low.
A number of gender-specific measures taken by the government are positively influencing female participation in the economic activities. Facilitating and increasing the availability of suitable jobs for women, targeting education and skill formation, improving under-reporting especially in the non-wage sector and addressing issues of discrimination and career progression are important initiatives.1 All of this means that 1 Many labor market activities of females are not being disclosed to male enumerators due to social and cultural reasons and that causes non-sampling error. To reduce the measurement error in FLFPR, a number of detailed questions are included in LFSs since 1990-91
Pakistan could potentially see a dramatic expansion in the labour force as more men and especially women choose to enter the labour force in the future.
A significant growth in employment has been observed since 1999-00. During the last six years (2000-06) 12.81 million lobs have been created. However, with the rising pace of economic activity in the last three years the rate of job creation has also accelerated. As shown in Table 13.6, 3.1 million jobs have been created between 2001-02 and 2003-04 (2 years) and 4.94 million jobs were created in between 2003-04 and 2005-06 (2 years) as against 4.6 million in 6 years prior to the year 2000. The focus of the current economic policies is to generate work opportunities in both urban and rural areas. It is however important to note that more work opportunities are being created in rural areas as compared to urban areas. During the last seven years (2000-06) out of additional employment of 12.81 million, 8.61 million (67.2%) were created in rural areas as compared to 4.2 million (32.8%) in urban areas. Now the challenge and estimates are presented under “improved estimates.” These show much higher activity rate as compared to the traditional low estimates. The improved participation rate of 39.3 percent in 2005-06 is more than twice the traditional estimates.
Economic Survey 2006-07
198
faced by the government is to sustain the growth momentum to create more jobs, increase incomes
of the people, and reduce unemployment and poverty.
Table -13.6: Employment Trend and Change: 1996-97 and 2005-06 (millions) Pakistan Rural Urban Year
Employed Change Employed Change Employed Change 1996-97 34.13 - 23.87 - 10.78 - 1999-00 36.32 2.19 25.55 1.68 10.77 -0.01 2001-02 38.88 2.56 26.66 1.11 12.22 1.45 2003-04 42.00 3.12 28.81 2.15 13.19 0.97 2005-06 46.94 4.94 32.48 3.67 14.46 1.27
Source: Labor Force Survey, various issues 13.2.3 Employment Situation
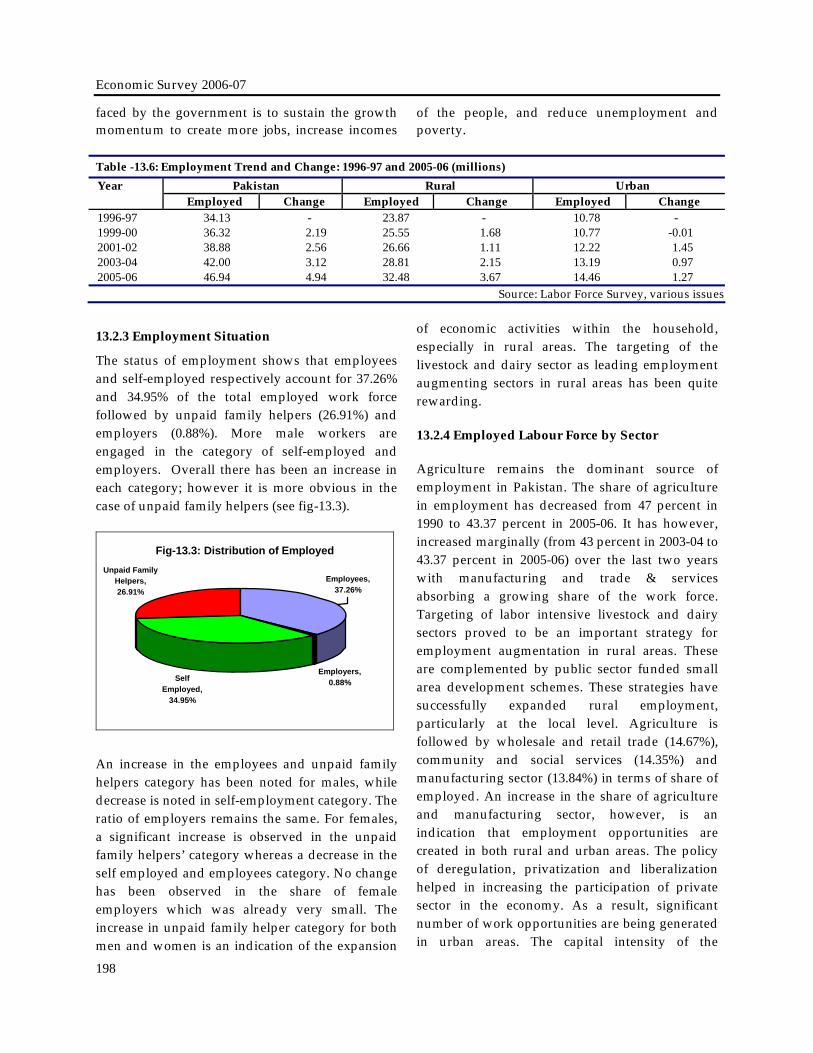
The status of employment shows that employees and self-employed respectively account for 37.26% and 34.95% of the total employed work force followed by unpaid family helpers (26.91%) and employers (0.88%). More male workers are engaged in the category of self-employed and employers. Overall there has been an increase in each category; however it is more obvious in the case of unpaid family helpers (see fig-13.3).
Fig-13.3: Distribution of Employed
Employers, 0.88%Self
Employed, 34.95%
Unpaid Family Helpers, 26.91%
Employees, 37.26%
An increase in the employees and unpaid family helpers category has been noted for males, while decrease is noted in self-employment category. The ratio of employers remains the same. For females, a significant increase is observed in the unpaid family helpers’ category whereas a decrease in the self employed and employees category. No change has been observed in the share of female employers which was already very small. The increase in unpaid family helper category for both men and women is an indication of the expansion
of economic activities within the household, especially in rural areas. The targeting of the livestock and dairy sector as leading employment augmenting sectors in rural areas has been quite rewarding.
13.2.4 Employed Labour Force by Sector
Agriculture remains the dominant source of employment in Pakistan. The share of agriculture in employment has decreased from 47 percent in 1990 to 43.37 percent in 2005-06. It has however, increased marginally (from 43 percent in 2003-04 to 43.37 percent in 2005-06) over the last two years with manufacturing and trade & services absorbing a growing share of the work force. Targeting of labor intensive livestock and dairy sectors proved to be an important strategy for employment augmentation in rural areas. These are complemented by public sector funded small area development schemes. These strategies have successfully expanded rural employment, particularly at the local level. Agriculture is followed by wholesale and retail trade (14.67%), community and social services (14.35%) and manufacturing sector (13.84%) in terms of share of employed. An increase in the share of agriculture and manufacturing sector, however, is an indication that employment opportunities are created in both rural and urban areas. The policy of deregulation, privatization and liberalization helped in increasing the participation of private sector in the economy. As a result, significant number of work opportunities are being generated in urban areas. The capital intensity of the

Population, Labour Force & Employment
199
industrial sector, however, limits its employment generating capacity. Sector wise break up of employed labour force shows that female share,
especially in agriculture, manufacturing and services is gradually rising (See Table-13.7).
TABLE-13.7 EMPLOYED LABOR FORCE BY SECTORS (%) 2003-04 2005-06 Sector
Total Rural Urban Total Rural Urban Agriculture 43.05 60.03 5.94 43.37 59.87 6.32 Manufacturing 13.73 9.05 23.97 13.84 9.00 24.71 Construction 5.82 6.02 5.39 6.13 6.23 5.91 Trade 14.80 9.39 26.62 14.67 9.30 26.71 Transport 5.73 4.33 8.80 5.74 4.64 8.22 Services 15.01 10.36 25.17 14.35 10.06 24.00 Others 1.85 0.82 4.12 1.89 0.89 4.13 Total 100.0 100.0 100.0 100.0 100.0 100.0
Source: Labor Force Surveys, 2003-04 & 2005-06
Although agriculture sector dominates employment for men and women, a larger proportion of females earn livelihood from this sector (see Fig-13.4). The manufacturing and
services sectors also employ a higher proportion of females especially in the fields of teaching, medicine and domestic helpers whereas males are concentrated in manufacturing, services and trade sectors.
Reduction in employment was observed in public sector and public sector enterprises (PSEs) which historically had significant new job opportunities
to offer. The stagnating public sector has been over taken by thriving private sector in terms of job creation.
Box 13.2: Emerging Employment Scenario in Pakistan
Many new areas have recently emerged as sources of employment leading to outsourcing of Pakistan’s wealth of skilled professionals to the rest of the world. The telecom, auto industry, auto vending, auto service stations, show rooms, hotels and restaurants, livestock and dairy sectors dominate in jobs creation. The leading industries/sectors include: Telecom and IT Sector Mobile phone, wireless loop and LDI companies, public call offices, internet
Fig-13.4: Gender Distribution by Sector Employment
0 10 20 30 40 50 60 70
Agriculture
Manufacturing
Construction
Trade
Transport
Community
Others
Male Female Male Female

Economic Survey 2006-07
200
service providers, broad band service providers, cable services, electronic media companies, information technology and internet related companies and call centers.
Health and Education Sector Private and philanthropic hospitals and clinics, biomedical sciences and biomedical and genetic engineering, private and non-governmental educational institutions, and scientific research and development organizations.
Chemical Fertilizer, pesticide, seeds and agro-chemical distribution.
Allied Agriculture Sectors Dairy and milk processing packaging and marketing, livestock, fruits and vegetable industry, fisheries and feed mills.
Financial Services Islamic banking services, new private banks including micro financing institutions, risk managers in the financial sector, leasing and insurance.
Transport Sector Intercity and intra city coach, bus and transport services, and private airline companies.
Construction Construction services particularly plumbers, electricians and masons.
Other Services Advertising, marketing, creative services, accountancy and management consultancy, and electronic and print media.
Oil and Gas Oil and gas exploration and drilling, petrol and CNG filling stations.
Source: Ministry of Labour & Manpower
13.2.5 Unemployment
Unemployment is defined as all persons ten years of age and above who during the reference period were: a) without work i.e., were neither in paid or self employment nor employed as unpaid family helpers, b) currently available for work i.e., were available for paid employment or self-employment, and c) seeking work i.e., had taken
specific steps in a specified period to seek paid or self-employment. According to this definition, about 3.10 million people were unemployed during the fiscal year 2005-06 as compared to 3.50 million in 2003-04. It is important to highlight that the rising trend of unemployment has not only been arrested but it has also started declining since 2001-02 (see Table-13.8).
TABLE-13.8: UNEMPLOYED LABOR FORCE BY AREAS
UNEMPLOYED LABOR FORCE (IN MILLION)
UNEMPLOYMENT RATE (%)
YEARS
TOTAL RURAL URBAN TOTAL RURAL URBAN 1996-97 2.26 1.33 0.94 5.93 5.02 7.98 1999-00 3.08 1.92 1.15 7.82 6.94 9.92 2000-01 3.33 2.10 1.22 8.30 7.53 10.09 2001-02 3.46 2.15 1.31 8.27 7.55 9.80 2003-04 3.50 2.08 1.41 7.69 6.74 9.70 2005-06 3.10 1.84 1.26 6.20 5.35 8.04
Source: Labor Force Survey, various issues Overall unemployment rate has declined from 8.3 percent in 2001-02 to 7.7 percent in 2003-04 and
further to 6.2 percent in 2005-06. As far as rural area is concerned, it declined from 7.55% in 2001-

Population, Labour Force & Employment
201
02 to 5.35% in 2005-06 while for urban areas this figure is 9.8% to 8.04% during the same period. Both male and female unemployment rates declined in rural as well as urban areas. The decline in female unemployment in both rural and urban areas can be attributed to two factors. Firstly, it has been observed in many developing countries including Pakistan that females would not enter the job markets due to perceived or otherwise discriminatory factors. In recent years, in Pakistan, it is now being observed that such impression is being dispelled as female participation rate is on the rise because of the
increased job opportunities and conductive environment. Secondly, the availability of micro finance facilities focusing on women particularly in rural areas have given rise to a new wave of rural women entrepreneurs.
Sustaining economic growth – a priority area - is expected to further generate employment opportunities. This is likely to reduce overall unemployment to 4% by 2009-10, a target aimed at in the Medium Term Development Framework (MTDF) 2005-10. About 3 million people enter the job market each year. Creating jobs for them is the key to reducing poverty.
7.88.2
7.7
6.2
5
6
7
8
9
1999-00 2001-02 2003-04 2005-06
Fig-13.5(a): Unemployment Rate (%)
Fig-13.5(b): Age Specific Unemployment Rate 2005-06
0
2
4
6
8
10
12
14
10-1
4
15-1
9
20-2
4
25-2
9
30-3
4
35-3
9
40-4
4
45-4
9
50-5
4
55-5
9
60 y
rs. &
abo
ve
Source: Labour Force Survey, 2005-06
13.2.6 Age Specific Unemployment Rate
The age specific unemployment rate shows a typical U shaped pattern (fig 13.5 (b)); higher rate for younger and older groups and lower for the prime age persons (those who fall between 25-49 years) (see Table-13.9). The interesting observation, however, is a visible fall in the unemployment rate in age-groups below 49 years in 2005-06 as compared to 2003-04. The decline in unemployment in the younger age groups is the result of aggressive education campaign of the government. Increasing enrolment in schools is reducing not only the incidence of child labor but their entry into the labour market as well. The goal
of universal primary education along with achieving other Millennium Development Goals (MDGs) is expected to contribute significantly in the withdrawal of working children from the labor market, thus reducing unemployment.
The incidence of unemployment in older age group especially among women though have registered decline in 2005-06 are still relatively high and requires government attention. A number of facilities and social services are being extended for senior citizens; absence of an adequate institutional mechanism of social protection is greatly felt. Table 13.9 shows that unemployment rate starts declining from the age
Economic Survey 2006-07
202
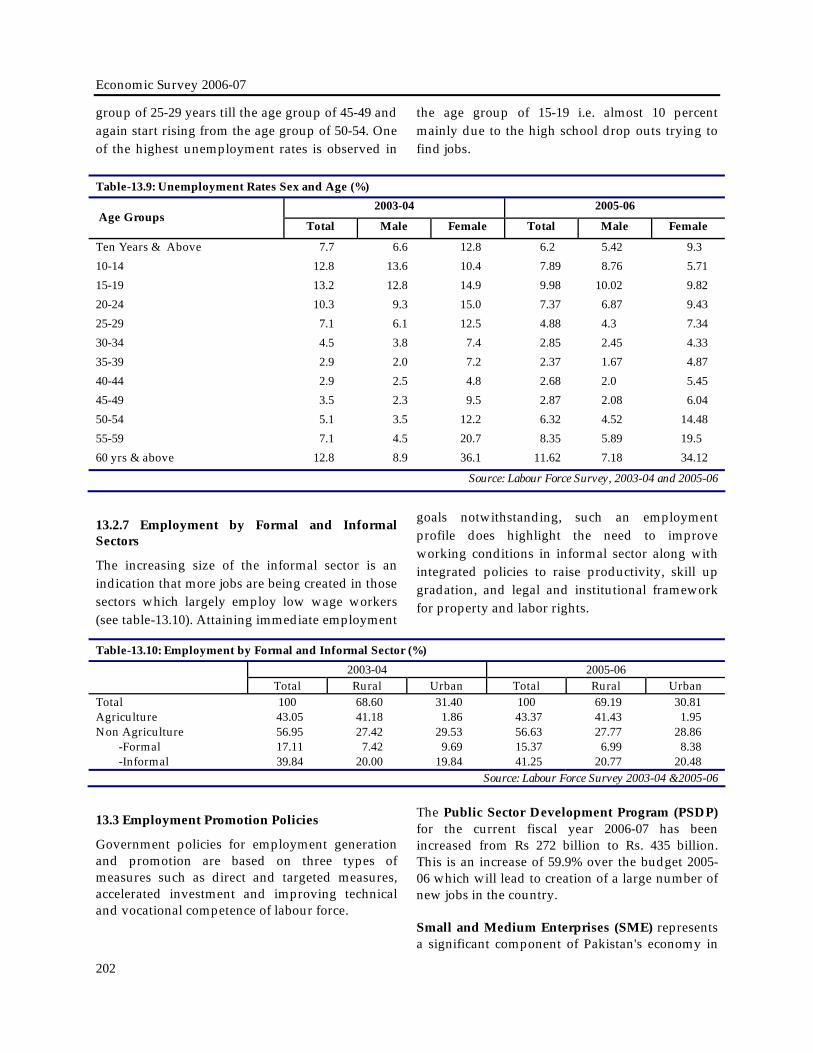
group of 25-29 years till the age group of 45-49 and again start rising from the age group of 50-54. One of the highest unemployment rates is observed in
the age group of 15-19 i.e. almost 10 percent mainly due to the high school drop outs trying to find jobs.
Table-13.9: Unemployment Rates Sex and Age (%) 2003-04 2005-06
Age Groups Total Male Female Total Male Female
Ten Years & Above 7.7 6.6 12.8 6.2 5.42 9.3 10-14 12.8 13.6 10.4 7.89 8.76 5.71 15-19 13.2 12.8 14.9 9.98 10.02 9.82 20-24 10.3 9.3 15.0 7.37 6.87 9.43 25-29 7.1 6.1 12.5 4.88 4.3 7.34 30-34 4.5 3.8 7.4 2.85 2.45 4.33 35-39 2.9 2.0 7.2 2.37 1.67 4.87 40-44 2.9 2.5 4.8 2.68 2.0 5.45 45-49 3.5 2.3 9.5 2.87 2.08 6.04 50-54 5.1 3.5 12.2 6.32 4.52 14.48 55-59 7.1 4.5 20.7 8.35 5.89 19.5 60 yrs & above 12.8 8.9 36.1 11.62 7.18 34.12
Source: Labour Force Survey, 2003-04 and 2005-06
13.2.7 Employment by Formal and Informal Sectors
The increasing size of the informal sector is an indication that more jobs are being created in those sectors which largely employ low wage workers (see table-13.10). Attaining immediate employment
goals notwithstanding, such an employment profile does highlight the need to improve working conditions in informal sector along with integrated policies to raise productivity, skill up gradation, and legal and institutional framework for property and labor rights.
Table-13.10: Employment by Formal and Informal Sector (%) 2003-04 2005-06
Total Rural Urban Total Rural Urban Total 100 68.60 31.40 100 69.19 30.81 Agriculture 43.05 41.18 1.86 43.37 41.43 1.95 Non Agriculture 56.95 27.42 29.53 56.63 27.77 28.86 -Formal 17.11 7.42 9.69 15.37 6.99 8.38 -Informal 39.84 20.00 19.84 41.25 20.77 20.48
Source: Labour Force Survey 2003-04 &2005-06
13.3 Employment Promotion Policies
Government policies for employment generation and promotion are based on three types of measures such as direct and targeted measures, accelerated investment and improving technical and vocational competence of labour force.
The Public Sector Development Program (PSDP) for the current fiscal year 2006-07 has been increased from Rs 272 billion to Rs. 435 billion. This is an increase of 59.9% over the budget 2005-06 which will lead to creation of a large number of new jobs in the country.
Small and Medium Enterprises (SME) represents a significant component of Pakistan's economy in

Population, Labour Force & Employment
203
terms of value. They are highly labour intensive and provide employment to the bulk of the non-agricultural labour force. The growth of SMEs has mainly been hampered by the non-availability of credit in the past. Realizing this constraint the government has opened two specialized banks namely, the SME Bank and Khushhali Bank. The Small and Medium Enterprises Development Authority (SMEDA) is also actively developing program for managerial skill development and providing technical and information support to the SMEs. A large number of SMEs are being financed under a program lending scheme namely "Hunarmand Pakistan Scheme" in businesses such as fan manufacturing, cutlery manufacturing, surgical instruments, doctors and dentists clinic, women entrepreneurs, CNG stations, motorized looms, auto parts manufacturing, furniture manufacturing, motorcycle and rickshaw. The SME Bank has so far financed 6060 SMEs and disbursed loans amounting to Rs.3469 million and has been successfully created 42420 employment opportunities in the country.
Realizing the importance of microfinance in improving the lives of the poor people, the government established Khushhali Bank in 2000 - a microfinance institution - under a public-private partnership program. It also encouraged private sector to setup microfinance banks in Pakistan whose outreach have increased to half a million households in just 4-5 years. In the next five years the outreach will increase to three million households. The Khushhali Bank alone has so far disbursed Rs.9603 million and nearly 33 percent of its clients are women. The services of these institutions will be the most effective instruments in improving the lives of the poor people in both urban and rural areas.
Pakistan Poverty Alleviating Fund (PPAF) was set up in April 2000 with an endowment of $100 million, as a wholesale lender to NGOs engaged in providing micro financing. The PPAF is present in 104 districts across Pakistan and it has 68 partner organizations. So far it has made disbursements of Rs.17448 million and it has around 6.18 million beneficiaries.
The housing and construction sector provide substantial additional employment opportunities
as it contributes through a higher multiplier effect with a host of beneficial forward and backward linkages in the economy. Nearly 40 industries are linked with construction activities. With employment elasticity at 0.60 and targeted growth rate ranging from 6.0% to 8.0% during the medium term, increasing housing can not only reduce the housing shortage, but also give a boost to about 40 allied industries linked with construction and housing, and increase fairly dispersed employment and income opportunities. There is a shortage of 6.0 million houses in the country, construction activity in the country and the housing sector is actively engaged to meet the demand.
Targeted Measure /Programs
National Internship Program: Government of Pakistan has recently launched a National Internship Program and 20, 000 internees have been inducted in the first batch during 2006-07. According to this program the educated youth who have completed 16 years of education will have an opportunity to have practical experience of working in government institutions and corporations for one year as internees before entering into labour market. Stipend of Rs.10, 000 per month will be given to these young people along with the experience certificate after completion of the internship.
Rozgar Scheme: This scheme was launched in 2006 aiming at providing employment opportunities in the age group of 18-40 having secondary school certification. This condition of minimum education is exempted for females. This scheme is implemented by National Bank of Pakistan (NBP). The (NBP) has developed a range of products with a brand name of “NBP KAROBAR”. Half of the mark-up rate of 12 percent will be borne by the Government.
Overseas Migration: The major focus is on managing international migration and taking full advantage of opportunities being offered by the demographic changes taking place in industrialized countries as well as under the ongoing discussion on services at the World Trade Organization (WTO). As a labour exporting country and Pakistani, the focus is on: i) making efforts in exporting to increase the number of overseas workers with proper skills, ii) protecting

Economic Survey 2006-07
204
the rights of migrant workers, iii) facilitating workers in sending remittances through legal channels and effective utilization of remittances, and iv) developing investment facilities for the expatriates to use their acquired expertise. In order to seek greater participation of overseas Pakistanis in business and economic activities, the Ministry of Labour has organized a high profile Overseas Pakistanis Investment Conference.
Government is also targeting different sectors for employment creation. A national plan of action for rapid industrial growth through industrial technology development is being launched for accelerated industrialization and improvement in total factor productivity. A number of industrial estates are being set up with common technology centers (CTCs). Industrial corridors (ICs) and specialized industrial zones (SIZs) with full support of federal Government are being set up by the provincial government along motorways, expressways and railways. These projects will help in boosting employment.
Public Works Program: Small public works scheme under “Tameer-e-Pakistan and Khushhal Pakistan” are important initiatives to contribute expanding employment by under taking small public works schemes, such as farm to market roads, water supply, sewerage, garbage collection and village electrification.
The “Khushhal Pakistan” program aims at creating employment in rural areas by, i) skill training for self employed, ii) micro financing, iii)
village level small infrastructure, iv) agriculture including live stock development, and v) primary education and health care.. Nearly 3.2 million households living in 2,000 rural union councils across Pakistan have benefited from this program.
Emphasis on technical and vocational education and flexible training are important for enhancing technical and vocational competence of the population and work force. To strengthen, standardize and streamline vocational and technical education government has setup National Vocational and Technical Education commission (NAVTEC) mainly as a regulatory and coordinating body for skills development and establishing national skill standards, certification and accreditation.
Technical and vocational training enhances the employability of the work force. There are 315 training institutes under NTB across Pakistan, which also includes all Technical Education and Vocational Training Authority (TEVT A) TEVTA institutions in Punjab. They offer vocational courses in 80 trades and the net output capacity of these institutions is 150,000 per year which will be doubled within a period of three years and will further increase to one million per annum. At present the training capacity of 28,050 trainees is available under TEVTA, Punjab and the other Provincial Directorates of Manpower and Training. Besides 8807 apprentices are being trained under the Apprenticeship Training Program in the country.
Box-13.3: Public-Private Partnership in Skills Development
Greater participation of and coordination with the employers and the private sector is being actively pursued to ensure that education and training responds well to the labor market needs. Besides the policy of establishment of Centre Management Committees (CMCs) that are chaired by the representatives of employers, public-private partnership in the form of establishment of “Skills Development Councils” (SDCs) has been encouraged. The SDCs have been set up in the provincial capitals as well as Islamabad. Led by the representatives of the industry, the SDCs supported by the MOLMOP are autonomous in their work and tailor their skills development programs in line with the market demand. A large number of training programs are run by the SDCs annually.
SMEs Promotion and Enterprise Development
The measures taken for the SMEs development are: i) up-gradation of technology and
enhancement of business skills, ii) increase in competitiveness of SMEs through provision of subsidized focused short duration training module to workers and their shop floor managers, iii)
Population, Labour Force & Employment
205
incentives for investment in the form of reduced taxes for enterprises which sign up for up-gradating their business products, iv) improve quality standards to compete in the global economy, v) improve market access and product information, vi) strengthening of legal, taxation and institutional framework, and vii) improved access to financial resources and services including a substantial increase in bank financing for SMEs and credit as venture capital for new start-ups especially those engaged in export-oriented contract manufacturing.
Establishment of technology and business incubation centers (TICs) and (BICs) are being considered for enterprise and SMEs development as well as tools to catalyze business startups and HRD. Industry-academia linkages, important in this regard, are increasingly being developed. The Small and Medium Enterprises Development policy was approved by the Cabinet on 17th January 2007.
National Employment Policy and Action Plan: To ensure that the high priority given the creation to decent employment as outlined in the MTDF and PRSP are translated into key policy action, the Ministry of Labor, Manpower, and Overseas Pakistanis (MOLMOP) together with the social partners has been actively involved in the formulation of a National Employment and Skills Development Policy. To discuss the main elements of such a national policy, MOLMOP along with the ILO, organized a national tri-partite forum with high level participation from key Ministries, representatives of employers and workers, concerned NGOs and academia.
The Plan of Action adopted by the Forum also drew upon the global employment agenda (GEA) framework of the ILO and elaborates the following areas:
Strengthening vocational and technical competence of the workforce,
Accelerating employment, income and productivity growth by encouraging growth in high labor absorption sectors,
Active labor market policies including for productive re-absorption of displaced workers, setting up public employment services and support for women entrepreneurship development,
Employment and labor market monitoring, analysis and feedback, and
Setting up an efficient and equitable labor market including review of minimum wages.
The MOLMOP has also established a Policy Planning Cell (PPC). The Cell is entrusted with the task of preparing national policies in the crucial areas of: i) employment generation, ii) international migration, and iii) human resource development (HRD). The PPC is also entrusted to make recommendations in the area of workers’ welfare and social protection as well as rationalization/classification of labor laws. Based on the consultations made by the PPC and the feedback received, the PPC initiated its work on preparation of the draft employment policy.
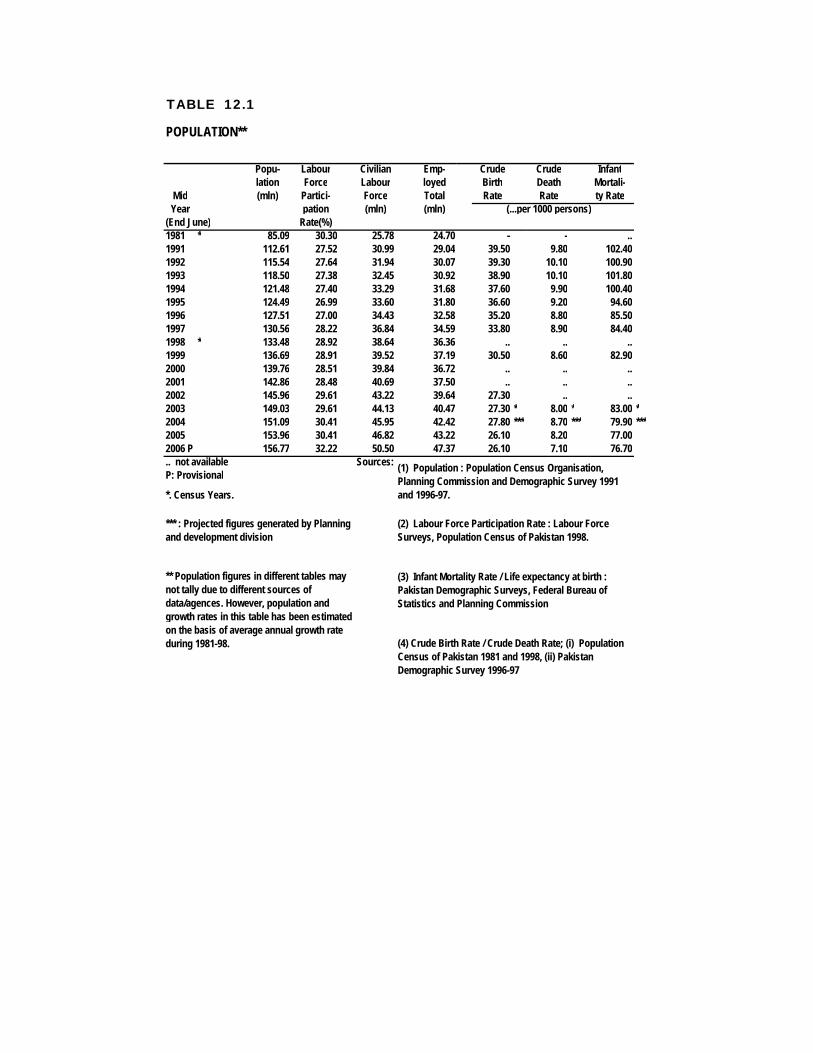
TABLE 12.1
Popu- Labour Civilian Emp- Crude Crude Infantlation Force Labour loyed Birth Death Mortali-
Mid (mln) Partici- Force Total Rate Rate ty RateYear pation (mln) (mln) (...per 1000 persons)
(End June) Rate(%)1981 * 85.09 30.30 25.78 24.70 - - ..1991 112.61 27.52 30.99 29.04 39.50 9.80 102.401992 115.54 27.64 31.94 30.07 39.30 10.10 100.901993 118.50 27.38 32.45 30.92 38.90 10.10 101.801994 121.48 27.40 33.29 31.68 37.60 9.90 100.401995 124.49 26.99 33.60 31.80 36.60 9.20 94.601996 127.51 27.00 34.43 32.58 35.20 8.80 85.501997 130.56 28.22 36.84 34.59 33.80 8.90 84.401998 * 133.48 28.92 38.64 36.36 .. .. ..1999 136.69 28.91 39.52 37.19 30.50 8.60 82.902000 139.76 28.51 39.84 36.72 .. .. ..2001 142.86 28.48 40.69 37.50 .. .. ..2002 145.96 29.61 43.22 39.64 27.30 .. ..2003 149.03 29.61 44.13 40.47 27.30 * 8.00 * 83.00 *2004 151.09 30.41 45.95 42.42 27.80 *** 8.70 *** 79.90 ***2005 153.96 30.41 46.82 43.22 26.10 8.20 77.002006 P 156.77 32.22 50.50 47.37 26.10 7.10 76.70.. not available Sources:P: Provisional
*. Census Years.
(4) Crude Birth Rate / Crude Death Rate; (i) Population Census of Pakistan 1981 and 1998, (ii) Pakistan Demographic Survey 1996-97
** Population figures in different tables may not tally due to different sources of data/agences. However, population and growth rates in this table has been estimated on the basis of average annual growth rate during 1981-98.
POPULATION**
(1) Population : Population Census Organisation, Planning Commission and Demographic Survey 1991 and 1996-97.
(3) Infant Mortality Rate / Life expectancy at birth : Pakistan Demographic Surveys, Federal Bureau of Statistics and Planning Commission
*** : Projected figures generated by Planning and development division
(2) Labour Force Participation Rate : Labour Force Surveys, Population Census of Pakistan 1998.

TABLE 12.2
(Population 000)Mid Year All Areas Rural areas Urban areas Male Female
(End June)1981 85.09 61.01 24.08 44.67 40.421991 112.61 77.95 34.66 58.82 53.791992 115.54 79.60 35.79 60.31 55.231993 118.50 81.45 37.05 61.83 56.671994 121.48 93.19 28.29 63.35 58.131995 124.49 94.95 29.54 64.88 59.611996 127.51 86.69 40.82 66.42 61.091997 130.56 88.44 42.12 67.98 62.581998 133.48 89.98 43.52 69.45 64.031999 136.69 91.91 44.78 71.09 65.602000 139.96 93.63 46.13 72.65 67.112001 142.86 95.36 47.50 74.23 68.632002 146.75 97.06 48.89 75.79 70.172003 149.65 99.12 49.91 77.38 71.652004 151.09 101.05 50.00 77.62 73.452005 153.96 101.55 52.41 77.59 76.362006 156.77 .. .. .. ..
Source: 1. Population Census Organization2. Planning Commission, Islamabad
Note: Population Census were conducted in February 1951, January 1961, September 1972, andMarch 1981 and 1998.
POPULATION BY SEX AND RURAL/URBAN AREAS
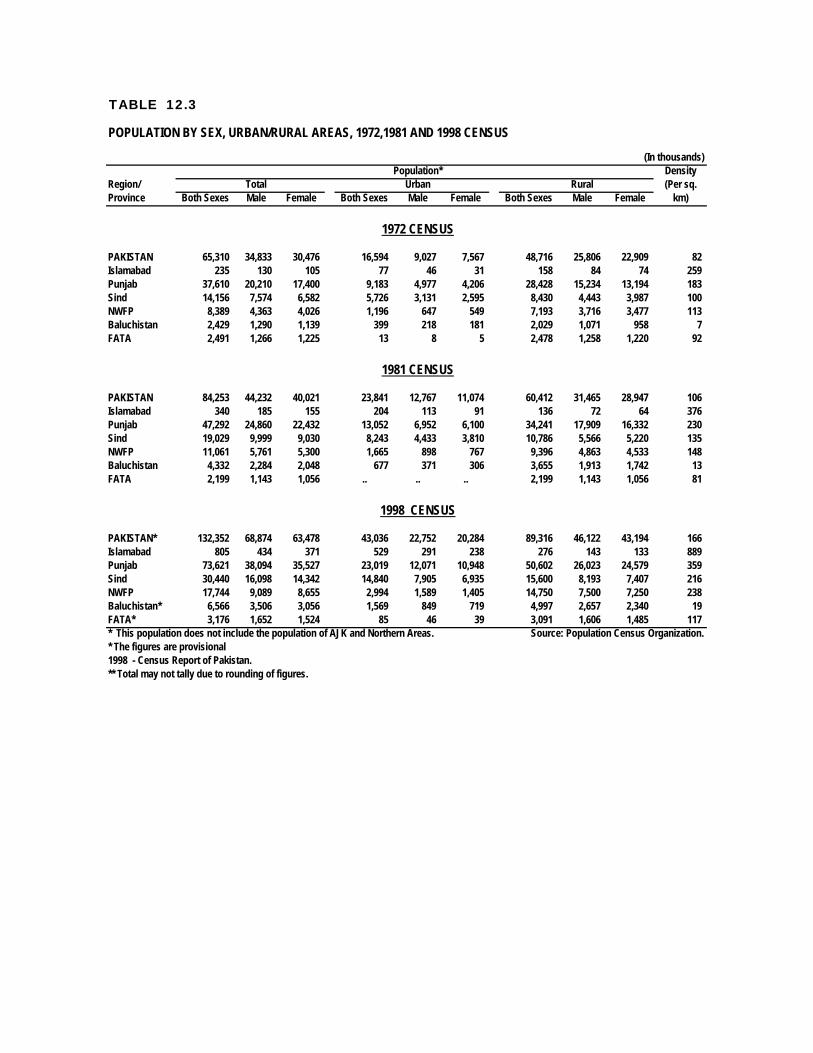
TABLE 12.3
(In thousands)Population* Density
Region/ Total Urban Rural (Per sq.Province Both Sexes Male Female Both Sexes Male Female Both Sexes Male Female km)
1972 CENSUS
PAKISTAN 65,310 34,833 30,476 16,594 9,027 7,567 48,716 25,806 22,909 82Islamabad 235 130 105 77 46 31 158 84 74 259Punjab 37,610 20,210 17,400 9,183 4,977 4,206 28,428 15,234 13,194 183Sind 14,156 7,574 6,582 5,726 3,131 2,595 8,430 4,443 3,987 100NWFP 8,389 4,363 4,026 1,196 647 549 7,193 3,716 3,477 113Baluchistan 2,429 1,290 1,139 399 218 181 2,029 1,071 958 7FATA 2,491 1,266 1,225 13 8 5 2,478 1,258 1,220 92
1981 CENSUS
PAKISTAN 84,253 44,232 40,021 23,841 12,767 11,074 60,412 31,465 28,947 106Islamabad 340 185 155 204 113 91 136 72 64 376Punjab 47,292 24,860 22,432 13,052 6,952 6,100 34,241 17,909 16,332 230Sind 19,029 9,999 9,030 8,243 4,433 3,810 10,786 5,566 5,220 135NWFP 11,061 5,761 5,300 1,665 898 767 9,396 4,863 4,533 148Baluchistan 4,332 2,284 2,048 677 371 306 3,655 1,913 1,742 13FATA 2,199 1,143 1,056 .. .. .. 2,199 1,143 1,056 81
1998 CENSUS
PAKISTAN* 132,352 68,874 63,478 43,036 22,752 20,284 89,316 46,122 43,194 166Islamabad 805 434 371 529 291 238 276 143 133 889Punjab 73,621 38,094 35,527 23,019 12,071 10,948 50,602 26,023 24,579 359Sind 30,440 16,098 14,342 14,840 7,905 6,935 15,600 8,193 7,407 216NWFP 17,744 9,089 8,655 2,994 1,589 1,405 14,750 7,500 7,250 238Baluchistan* 6,566 3,506 3,056 1,569 849 719 4,997 2,657 2,340 19FATA* 3,176 1,652 1,524 85 46 39 3,091 1,606 1,485 117* This population does not include the population of AJK and Northern Areas. Source: Population Census Organization.* The figures are provisional1998 - Census Report of Pakistan.** Total may not tally due to rounding of figures.
POPULATION BY SEX, URBAN/RURAL AREAS, 1972,1981 AND 1998 CENSUS

TABLE 12.4
(In thousands)Age Total Rural Urban
(in years) Both Sexes Male Female Both Sexes Male Female Both Sexes Male Female
All ages 84,253 44,232 40,021 23,841 12,767 11,074 60,412 31,465 28,947 0- 4 12,911 6,365 6,546 3,579 1,813 1,766 9,332 4,552 4,780 5- 9 13,494 6,992 6,502 3,552 1,839 1,713 9,942 5,153 4,78910-14 11,092 6,012 5,080 3,119 1,653 1,466 7,973 4,359 3,61415-19 7,971 4,304 3,667 2,540 1,365 1,175 5,491 2,939 2,49220-24 6,395 3,356 3,039 2,108 1,159 950 4,287 2,198 2,08925-29 5,626 2,968 2,658 1,719 943 776 3,907 2,025 1,88230-34 4,741 2,451 2,290 1,391 757 634 3,350 1,694 1,65635-39 4,309 2,177 2,132 1,276 668 608 3,033 1,509 1,52440-44 3,969 1,989 1,980 1,132 606 526 2,837 1,383 1,45445-49 3,158 1,653 1,505 882 490 392 2,276 1,163 1,11350-54 3,045 1,681 1,364 796 459 337 2,249 1,222 1,02755-59 1,654 882 772 424 242 182 1,230 640 59060-64 2,276 1,334 942 549 327 222 1,727 1,007 72065-69 1,013 570 443 232 135 97 781 435 34670-74 1,193 696 497 261 152 109 932 544 38875 and above 1,406 802 604 281 160 121 1,125 642 483
All ages 129,176 67,222 61,954 86,225 44,516 41,709 42,951 22,705 20,245 0- 4 19,118 9,761 9,357 13,534 6,907 6,627 5,584 2,854 2,730 5- 9 20,215 10,571 9,644 14,211 7,466 6,745 6,004 3,105 2,89910-14 16,732 8,909 7,822 11,106 5,973 5,132 5,625 2,935 2,69015-19 13,400 6,909 6,490 8,553 4,396 4,157 4,846 2,513 2,33320-24 11,588 5,815 5,773 7,402 3,610 3,791 4,186 2,205 1,98125-29 9,521 4,878 4,643 6,092 3,024 3,067 3,429 1,854 1,57530-34 8,040 4,232 3,808 5,083 2,604 2,479 2,956 1,628 1,32835-39 6,166 3,254 2,913 3,846 1,984 1,862 2,320 1,270 1,05040-44 5,745 2,931 2,814 3,669 1,812 1,848 2,086 1,119 96745-49 4,563 2,360 2,203 2,995 1,512 1,483 1,568 848 72050-54 4,148 2,200 1,948 2,776 1,458 1,318 1,372 742 63055-59 2,777 1,505 1,272 1,868 1,001 867 909 504 40560-64 2,637 1,418 1,219 1,838 987 851 799 431 36865-69 1,554 850 704 1,076 585 491 478 265 21370-74 1,408 778 631 1,022 564 458 386 214 17275 and above 1,563 849 714 1,162 632 531 400 217 183* : Figures regarding FATA not included. Source: Population Census Organization.
1981 Census
1998 Census*
POPULATION BY AGE, SEX URBAN/RURAL AREAS 1981 AND 1998 CENSUS

TABLE 12.5
Area Population (In thousand)Province Sq km 1951 1961 1972 1981 1998*PAKISTAN 796,096 33,740 42,880 65,309 84,254 132,352
(100.00) (100.00) (100.00) (100.00) (100.00) (100.00)
NWFP 74,521 4,587 5,752 8,392 11,061 17,744(9.4) (13.6) (13.4) (12.8) (13.10) (13.41)
FATA 27,220 1,332 1,847 2,491 2,199 3,176(3.4) (3.9) (4.3) (3.8) (2.6) (2.40)
Punjab 205,345 20,541 25,464 37,607 47,292 73,621(25.8) (60.8) (59.4) (57.6) (56.1) (55.62)
Sind 140,914 6,048 8,367 14,156 19,029 30,440(17.7) (17.9) (19.5) (21.7) (22.6) (23.00)
Baluchistan 347,190 1,167 1,353 2,429 4,332 6,566(43.6) (3.5) (3.2) (3.7) (5.1) (4.96)
Islamabad 906 96 118 238 340 805(0.1) (0.3) (0.3) (0.4) (0.4) (0.61)
Note: Percentage share is given in parentheses. Source: Population Census Organisation
ENUMERATED POPULATION OF PAKISTAN BY PROVINCE, LAND AREA AND PERCENTAGE DISTRIBUTION 1951-1998

TABLE 12.6
Total Urban Rural1981 1981 1981
Sex 15 Years 10 Years 10 Years 15 Years 10 Years 10 Years 15 Years 10 Years 10 Years& Above & Above & Above & Above & Above & Above & Above & Above & Above
PAKISTANBoth Sexes 41.5 43.9 26.2 61.0 63.1 47.1 30.8 33.6 17.3Male 53.4 54.8 35.0 69.1 70.0 55.3 44.4 46.4 26.2Female 28.5 32.0 16.0 51.6 55.2 37.3 16.7 20.1 7.3
ISLAMABADBoth Sexes 70.2 72.4 47.8 75.6 77.2 57.6 58.8 62.5 32.5Male 79.8 80.6 59.1 82.6 83.2 65.8 73.6 75.1 48.1Female 58.3 62.4 33.5 66.6 69.7 46.8 42.7 48.8 14.7
PUNJABBoth Sexes 43.8 46.6 27.4 62.4 64.5 46.7 34.9 38.0 20.0Male 55.6 57.2 36.8 70.2 70.9 55.2 48.3 50.4 29.6Female 31.2 35.1 16.8 53.5 57.2 36.7 20.9 24.8 9.4
SINDBoth Sexes 43.6 45.3 31.5 61.9 63.7 50.8 24.0 25.7 15.6Male 53.8 54.5 39.7 68.9 69.8 57.8 36.9 37.9 24.5Female 32.0 34.8 21.6 53.6 56.7 42.2 9.9 12.2 5.2
NWFPBoth Sexes 32.1 35.4 16.7 51.4 54.3 35.8 27.7 31.3 13.2Male 48.7 51.4 25.9 65.9 67.5 47.0 44.6 47.7 21.7Female 15.1 18.8 6.5 34.5 39.1 21.9 11.2 14.7 3.8
BALUCHISTANBoth Sexes 30.7 24.8 10.3 43.9 46.9 32.2 16.1 17.5 6.2Male 33.3 34.0 15.2 56.4 58.1 42.4 25.0 25.8 9.8Female 11.8 14.1 4.3 28.6 33.1 18.5 6.4 7.9 1.7
FATA*Both Sexes .. 17.4 6.4 .. 39.3 .. .. 16.8 6.4Male .. 29.5 10.9 .. 59.7 .. .. 28.6 10.9Female .. 3.0 0.8 .. 12.0 .. .. 2.8 0.8
FATA: Federally Administered Tribal Areas. Source: Population Census Organisation.. Not available.
LITERACY RATIOS OF POPULATION BY SEX, REGION AND URBAN/RURAL AREAS, 1998 AND 1981 CENSUS
1998 1998 1998

TABLE 12.7
(Population in Thousand)Area Sq. Year Year Year Year Year Year
Kms 1951 1981 1998 (2003) 2005 2006796,096 33,816 84,254 132,352 149,030 153.960 (E) 156.77 (E)100.00 100.00 100.00 100.00 100.00 100.00 100.00
205,344 20,557 47,292 73,621 82,710 85650(E) 86,25525.80 60.80 56.10 55.63 55.50 55.63 55.00
140,914 6,054 19,029 30,440 34,240 35410(E) 35,86417.70 17.90 22.60 23.00 22.97 23.00 23.00
74,521 4,587 11,061 17,744 20,170 20640 (E) 21,3929.10 13.60 13.10 13.41 13.54 13.41 13.60
347,190 1,187 4,332 6,566 7,450 7630 (E) 8,00443.60 3.50 5.10 4.96 5.00 4.96 5.10
27,220 1,337 2,199 3,176 3,420 3690 (E) 3,6213.40 3.90 2.60 2.40 2.30 2.40 2.30
906 94 340 805 1,040 940 (E) 1,1240.10 0.30 0.40 0.61 0.70 0.61 0.71
Source: 1) Population Census Organization2) Planning and Development division
vi) Islamabad
iv) BALUCHISTAN
v) FATA
Province-wise Population, Land Area and Percent Distribution 1951, 1981, 1998 and 2006
Province
NWFP
A PAKISTAN
i) PUNJAB
ii) SINDH
iii)

TABLE 12.8
(Percent Share)Civilian Labour Force
Civilian Labour Force Not in CivilianPopulation Total Employed Unemployed Labour Force
Total Male Female Total Male Female Total Male Female Total Male Female Total Male FemalePAKISTAN 100.00 51.06 48.94 46.01 36.74 9.27 43.16 34.75 8.41 2.85 1.99 0.86 53.99 14.31 39.68
Rural 100.00 50.60 49.40 48.92 37.36 11.56 46.30 35.64 10.66 2.62 1.73 0.89 51.08 13.24 37.84Urban 100.00 51.89 48.11 40.73 35.62 5.10 37.45 33.15 4.30 3.28 2.48 0.80 59.27 16.26 43.01
BALUCHISTAN 100.00 55.36 44.64 45.21 39.57 5.64 43.78 38.51 5.27 1.42 1.05 0.37 54.79 15.79 39.01Rural 100.00 55.23 44.77 47.88 41.10 6.79 46.69 40.22 6.47 1.19 0.87 0.32 52.12 14.13 37.98Urban 100.00 55.75 44.25 37.01 34.90 2.11 34.88 33.28 1.60 2.13 1.62 0.51 62.99 20.85 42.14
NWFP 100.00 48.53 51.47 39.73 33.02 6.71 35.04 30.31 4.73 4.70 2.71 1.98 60.27 15.51 44.76Rural 100.00 48.19 51.81 40.17 33.00 7.17 35.52 30.42 5.10 4.65 2.58 2.07 59.83 15.19 44.64Urban 100.00 50.24 49.67 37.52 33.11 4.41 32.62 29.73 2.86 4.92 3.37 1.55 62.48 17.13 42.35
PUNJAB 100.00 50.39 49.61 48.94 36.59 12.36 46.00 34.49 11.50 2.95 2.09 0.86 51.06 13.81 37.25Rural 100.00 49.91 50.09 52.20 37.04 15.15 49.68 35.30 14.38 2.52 1.75 0.77 47.80 12.86 34.94Urban 100.00 51.35 48.65 42.51 35.68 6.83 38.71 32.89 5.81 3.80 2.78 1.02 57.49 15.67 41.82
SINDH 100.00 53.18 46.82 42.91 38.64 4.27 41.03 37.12 3.92 1.88 1.53 0.35 57.09 14.54 42.55Rural 100.00 53.79 46.21 47.22 41.50 5.71 45.83 40.42 5.41 1.39 1.08 0.31 52.78 12.29 40.49Urban 100.00 52.63 47.37 39.00 36.05 2.95 36.68 34.11 2.56 2.32 1.93 0.39 61.00 16.18 44.42
Source: Labour Force Survey 2005-06
PERCENTAGE DISTRIBUTION OF POPULATION OF 10 YEARS AND ABOVE AND CIVILIAN LABOUR FORCE BY SEX AND NATURE OF ACTIVITY: 2005-06
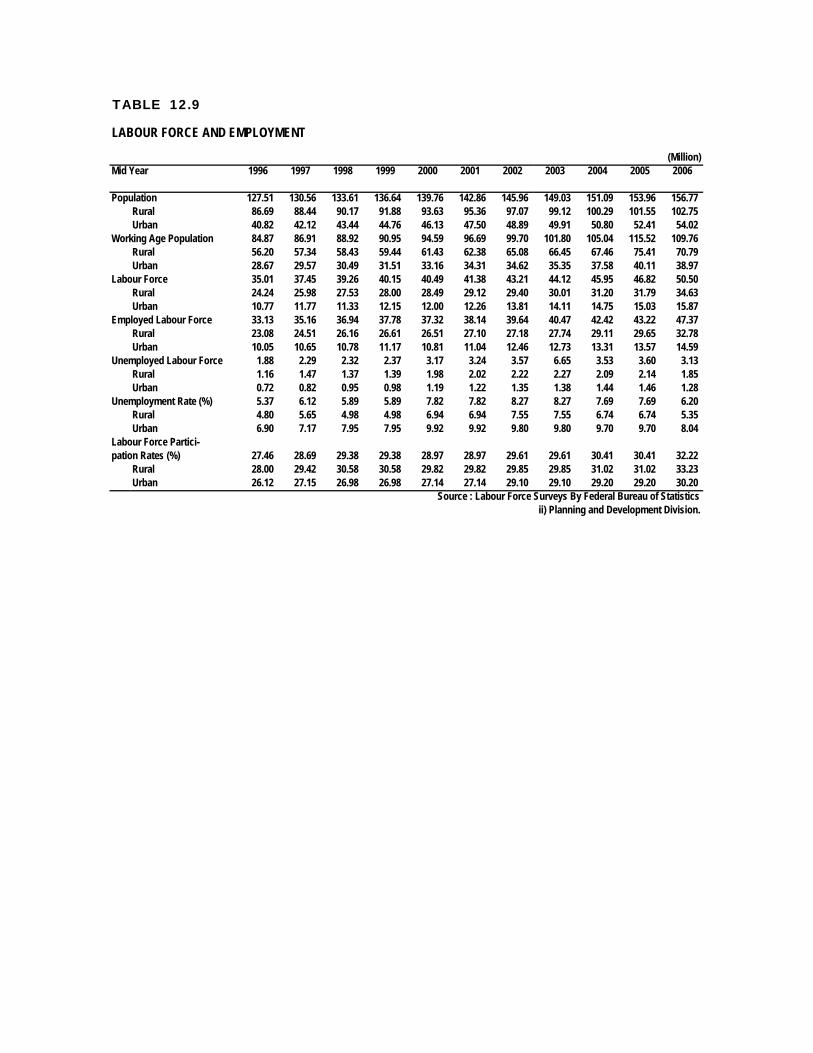
TABLE 12.9
(Million)Mid Year 1996 1997 1998 1999 2000 2001 2002 2003 2004 2005 2006
Population 127.51 130.56 133.61 136.64 139.76 142.86 145.96 149.03 151.09 153.96 156.77Rural 86.69 88.44 90.17 91.88 93.63 95.36 97.07 99.12 100.29 101.55 102.75Urban 40.82 42.12 43.44 44.76 46.13 47.50 48.89 49.91 50.80 52.41 54.02
Working Age Population 84.87 86.91 88.92 90.95 94.59 96.69 99.70 101.80 105.04 115.52 109.76Rural 56.20 57.34 58.43 59.44 61.43 62.38 65.08 66.45 67.46 75.41 70.79Urban 28.67 29.57 30.49 31.51 33.16 34.31 34.62 35.35 37.58 40.11 38.97
Labour Force 35.01 37.45 39.26 40.15 40.49 41.38 43.21 44.12 45.95 46.82 50.50Rural 24.24 25.98 27.53 28.00 28.49 29.12 29.40 30.01 31.20 31.79 34.63Urban 10.77 11.77 11.33 12.15 12.00 12.26 13.81 14.11 14.75 15.03 15.87
Employed Labour Force 33.13 35.16 36.94 37.78 37.32 38.14 39.64 40.47 42.42 43.22 47.37Rural 23.08 24.51 26.16 26.61 26.51 27.10 27.18 27.74 29.11 29.65 32.78Urban 10.05 10.65 10.78 11.17 10.81 11.04 12.46 12.73 13.31 13.57 14.59
Unemployed Labour Force 1.88 2.29 2.32 2.37 3.17 3.24 3.57 6.65 3.53 3.60 3.13Rural 1.16 1.47 1.37 1.39 1.98 2.02 2.22 2.27 2.09 2.14 1.85Urban 0.72 0.82 0.95 0.98 1.19 1.22 1.35 1.38 1.44 1.46 1.28
Unemployment Rate (%) 5.37 6.12 5.89 5.89 7.82 7.82 8.27 8.27 7.69 7.69 6.20Rural 4.80 5.65 4.98 4.98 6.94 6.94 7.55 7.55 6.74 6.74 5.35Urban 6.90 7.17 7.95 7.95 9.92 9.92 9.80 9.80 9.70 9.70 8.04
Labour Force Partici- pation Rates (%) 27.46 28.69 29.38 29.38 28.97 28.97 29.61 29.61 30.41 30.41 32.22
Rural 28.00 29.42 30.58 30.58 29.82 29.82 29.85 29.85 31.02 31.02 33.23Urban 26.12 27.15 26.98 26.98 27.14 27.14 29.10 29.10 29.20 29.20 30.20
Source : Labour Force Surveys By Federal Bureau of Statisticsii) Planning and Development Division.
LABOUR FORCE AND EMPLOYMENT

TABLE 12.10
(Million)Mid Crude Employed Mining Electri-Year Popula- Activity Labour Unemp- Labour Agricul- & Manu- Construc city & Gas Trans- Trade Others(End June) tion Rate(%) Force loyment Force ture facturing tion Distri- port
bution1990 109.71 28.83 31.63 0.98 30.65 15.68 3.93 1.96 0.18 1.50 3.65 3.751991 112.61 27.97 31.50 1.98 29.52 14.01 3.66 1.95 0.24 1.55 3.90 4.211992 115.54 28.11 32.48 1.90 30.58 14.76 3.83 1.93 0.24 1.69 4.01 4.121993 118.50 27.86 33.01 1.56 31.45 14.95 3.46 2.18 0.26 1.74 4.19 4.671994 121.48 27.88 33.87 1.64 32.23 16.12 3.26 2.10 0.28 1.60 4.12 4.751995 124.49 27.46 34.18 1.83 32.35 15.14 3.40 2.33 0.26 1.64 4.69 4.891996 127.51 27.46 35.01 1.88 33.13 15.50 3.48 2.39 0.27 1.68 4.80 5.011997 130.56 28.69 37.45 2.29 35.16 15.52 3.93 2.37 0.35 2.01 5.14 5.841998 133.61 29.38 39.26 2.32 36.94 17.46 3.75 2.32 0.25 2.02 5.13 6.011999 136.64 29.38 40.15 2.37 37.78 17.85 3.84 2.37 0.26 2.07 5.24 6.152000 139.76 28.97 40.49 3.17 37.32 18.07 4.31 2.16 0.26 1.88 5.04 5.602001 142.86 28.97 41.38 3.24 38.14 18.47 4.40 2.21 0.26 1.92 5.15 5.732002 145.96 28.97 43.21 3.57 39.64 16.68 5.51 2.40 0.32 2.34 5.89 6.502003 149.03 28.97 44.12 3.65 40.47 17.03 5.63 2.45 0.33 2.39 6.01 6.632004 151.09 30.41 45.95 3.53 42.24 18.26 5.85 2.47 0.28 2.43 6.28 6.852005 153.96 30.41 46.82 3.60 43.22 18.60 5.96 2.52 0.29 2.48 6.39 6.982006* 156.77 32.22 50.50 3.13 47.37 20.54 6.60 2.91 0.31 2.72 6.95 7.34
Source: (i) Federal Bureau of Statistics(ii) Planning and Development Division
* : Absolute figures refer to 1st July 2000,2002,2004 & 2006 for which LFS were conducted
POPULATION AND LABOUR FORCE

TABLE 12.11
(Percentage)Mining & Electricity
Years Agricul- Manufac- Construc- & Gas Trans- Trade Othersture turing tion Distribution port
1990 51.15 12.84 6.38 0.59 4.89 11.93 12.221991 47.45 12.38 6.62 0.83 5.24 13.24 14.221992 48.27 12.53 6.33 0.79 5.51 13.10 13.481993 47.55 11.00 6.93 0.84 5.52 13.32 14.841994 50.04 10.12 6.50 0.87 4.95 12.78 14.751995 46.79 10.50 7.21 0.82 5.07 14.50 15.121996 46.79 10.50 7.21 0.82 5.07 14.50 15.121997 44.15 11.20 6.75 0.98 5.71 14.62 16.601998 47.25 10.15 6.26 0.70 5.48 13.87 16.281999 47.25 10.15 6.26 0.70 5.48 13.87 16.282000 48.42 11.55 5.78 0.70 5.03 13.50 15.02 2001 48.42 11.55 5.78 0.70 5.03 13.50 15.02 2002 42.09 13.91 6.05 0.81 5.90 14.85 16.39 2003 42.09 13.91 6.05 0.81 5.90 14.85 16.39 2004 43.05 13.80 5.83 0.67 5.73 14.80 16.12 2005 43.05 13.80 5.83 0.67 5.73 14.80 16.12 2006 43.37 13.93 6.13 0.66 5.74 14.67 15.49 2007 43.37 13.93 6.13 0.66 5.74 14.67 15.49 P: Provisional Source: Federal Bureau of Statistics
DISTRIBUTION OF EMPLOYED PERSONS OF 10 YEARS AGE AND ABOVE BY MAJOR INDUSTRIES

TABLE 12.12
(Percentage)Major Industry PAKISTAN BALUCHISTAN NWFP PUNJAB SINDDivision Total Rural Urban Total Rural Urban Total Rural Urban Total Rural Urban Total Rural Urban
Total 100.00 100.00 100.00 100.00 100.00 100.00 100.00 100.00 100.00 100.00 100.00 100.00 100.00 100.00 100.001) Agriculture Forestry,
Hunting and Fishing 43.37 59.87 6.32 59.33 71.30 10.27 44.29 51.11 6.84 44.35 58.99 7.17 37.27 66.09 4.592) Mining and Quarrying 0.09 0.12 0.02 0.23 0.15 0.53 0.30 0.34 0.06 0.08 0.10 0.01 - - -3) Manufacturing 13.84 9.00 24.71 1.75 0.66 6.21 8.05 6.91 14.32 15.40 11.27 25.90 14.97 5.22 26.024) Electricity, Gas
and Water 0.66 0.39 1.25 0.61 0.24 2.15 0.57 0.41 1.45 0.51 0.37 0.85 1.97 0.50 1.765) Construction 6.13 6.23 5.91 5.08 4.64 6.91 10.44 10.97 7.50 5.55 5.64 5.33 5.81 5.22 6.496) Wholesale, Retail Trade,
Restaurant and Hotels 14.67 9.30 26.71 12.91 8.64 30.45 11.94 9.60 24.82 14.08 9.23 26.38 17.81 9.53 27.217) Transport, Storage
and Communication 5.74 4.64 8.22 6.21 5.16 10.53 7.99 7.22 12.23 5.30 4.21 8.08 5.73 4.05 7.638) Financing,Insurance,
Real Estate andBusiness Services 1.10 0.35 2.79 0.44 0.18 1.54 0.72 0.35 2.78 0.98 0.39 2.46 1.74 0.27 3.40
9) Community, Social andPersonal Services 14.35 10.06 24.00 13.42 9.03 31.40 15.66 13.07 29.89 13.72 9.77 23.78 15.54 9.11 22.82
10) Activities NotAdequately Defined 0.04 0.03 0.06 0.01 0.01 0.02 0.03 0.02 0.09 0.04 0.04 0.05 0.05 0.02 0.09.. not available Source : Labour Force Survey, 2003-2004, Federal Bureau of Statistics
PERCENTAGE DISTRIBUTION OF EMPLOYED PERSONS OF 10 YEARS AGE AND ABOVE BY MAJOR INDUSTRY 2005-2006

TABLE 12.13
(%)
Age Group 1992-93 1993-94 1994-95 1995-96 1996-97 1997-98 1998-99 1999-00 2000-01 2001-02 2003-04* 2004-05* 2005-0610 years & overBoth Sexes 42.35 42.01 41.25 41.25 43.01 43.34 43.34 42.80 43.34 43.34 43.74 43.74 46.01Male 69.24 69.07 69.10 69.10 70.01 70.48 70.48 70.39 70.32 70.32 70.61 70.61 71.97Female 13.15 13.32 11.39 11.39 13.63 13.92 13.92 13.72 14.44 14.44 15.93 15.93 18.9310-14Male 18.02 16.76 16.55 16.54 17.19 17.95 17.95 18.32 17.18 17.18 18.45 18.45 20.68Female 7.77 6.94 5.70 5.70 7.61 7.40 7.40 2.79 6.28 6.28 6.69 6.69 9.2115-19Male 53.13 52.29 51.13 51.13 52.89 52.43 52.43 58.26 57.56 57.56 59.00 59.00 60.87Female 12.46 12.06 9.64 9.64 13.06 13.51 13.51 7.19 13.78 13.78 14.51 14.51 16.9120-24Male 83.91 84.91 85.46 85.46 85.05 84.86 84.86 85.24 87.03 87.03 85.70 85.70 87.63Female 13.47 14.02 11.71 11.71 15.08 15.16 15.16 14.14 15.94 15.94 18.03 18.03 20.6725-34Male 97.05 97.55 97.22 97.22 97.21 96.96 96.96 96.41 96.57 96.57 96.27 96.27 97.03Female 14.54 15.67 12.85 12.85 13.79 14.80 14.80 18.80 16.07 16.07 18.31 18.31 21.6235-44Male 98.27 98.23 97.89 97.89 98.46 97.80 97.80 97.51 97.49 97.49 97.36 97.36 97.57Female 16.43 17.11 15.66 15.66 16.61 17.29 17.29 21.70 19.90 19.90 21.64 21.64 25.0745-54Male 95.84 96.00 97.07 97.07 96.54 96.23 96.23 95.90 95.55 95.55 95.63 95.63 96.37Female 16.81 17.50 14.75 14.75 17.51 17.15 17.15 21.27 19.39 19.39 20.95 20.95 24.7855-59Male 90.12 91.84 91.50 91.50 90.13 90.63 90.63 90.61 88.19 88.19 89.68 89.68 90.62Female 16.62 15.09 15.23 15.23 19.60 15.84 15.84 17.76 14.50 14.50 18.57 18.57 22.8460+Male 60.71 62.02 62.65 62.65 63.41 63.65 63.65 60.68 56.63 56.63 58.37 58.37 59.38Female 9.79 10.01 9.26 9.26 12.34 13.60 13.60 13.04 11.36 11.36 12.90 12.90 14.69
Source: Labour Force Survey. Federal Bureau of Statistics* : For the years 2002-03 and 2004-05 Labour Force Survey was not conducted
AGE SPECIFIC LABOUR FORCE PARTICIPATION RATE

TABLE 12.14
(In Pak Rupees)
1993 1994 1995 1996 1997 1998 1999 2000 2001 2002 2003 2004 2005 2006
CarpenterIslamabad 150.00 150.00 175.00 190.00 200.00 200.00 225.00 218.75 225.00 225.00 250.00 325.00 400.00 450.00Karachi 164.81 178.94 205.00 219.62 231.15 250.00 285.57 292.30 291.34 298.08 301.92 337.00 365.00 402.00Lahore 150.00 151.42 185.00 195.71 217.50 226.42 262.50 262.50 262.50 262.50 262.50 277.00 338.00 361.00Peshawar 115.00 135.00 135.00 150.00 175.00 200.00 200.00 200.00 225.00 225.00 225.00 250.00 275.00 300.00Quetta 170.00 180.00 200.00 215.00 230.00 250.00 250.00 250.00 250.00 250.00 250.00 275.00 275.00 400.00
Mason (Raj)Islamabad 150.00 150.00 175.00 190.00 200.00 200.00 225.00 218.75 225.00 225.00 250.00 325.00 400.00 450.00Karachi 161.82 177.78 205.00 234.61 245.19 250.00 285.57 292.30 291.34 298.08 301.92 337.00 365.00 402.00Lahore 150.00 151.42 185.00 197.14 217.50 226.42 262.50 262.50 262.50 262.50 262.50 318.00 380.00 461.00Peshawar 115.00 135.00 135.00 150.00 175.00 200.00 200.00 200.00 225.00 225.00 225.00 275.00 325.00 325.00Quetta 162.50 175.00 188.75 210.00 225.00 250.00 250.00 250.00 250.00 250.00 250.00 275.00 275.00 400.00
Labourer (Unskilled)Islamabad 70.00 77.50 90.00 95.00 100.00 110.00 120.00 120.00 120.00 120.00 130.00 160.00 200.00 250.00Karachi 73.40 80.88 101.80 133.20 156.53 160.00 172.11 174.04 176.34 182.11 183.27 150.00 230.00 275.00Lahore 85.71 85.71 105.00 108.21 117.14 122.50 145.00 145.00 145.00 145.00 145.00 167.00 200.00 246.00Peshawar 50.00 60.00 65.00 70.00 75.00 80.00 80.00 80.00 90.00 90.00 90.00 134.00 150.00 175.00Quetta 75.00 77.50 77.50 95.00 95.00 110.00 110.00 100.00 100.00 112.50 111.67 150.00 170.00 250.00
* Data pertains to month of November each year Source: Federal Bureau of Statistics
DAILY WAGES OF CONSTRUCTION WORKERS IN DIFFERENT CITIES*
Category of workers
and cities