chapter 17 local air quality
TRANSCRIPT

Chap
ter 17 – Local air quality
Chapter 17Local air quality

Parsons Brinckerhoff i
Contents
Page number
17. Local air quality 17-1
17.1 Assessment approach 17-3
17.1.1 Air quality criteria 17-3 17.1.2 Pollutant types 17-4 17.1.3 Assessment methodology 17-5 17.1.4 Cumulative assessment 17-7
17.2 Existing environment 17-7
17.2.1 Terrain 17-7 17.2.2 Sensitive receivers 17-8 17.2.3 Wind speed, wind direction and atmospheric stability 17-8 17.2.4 Climate 17-12 17.2.5 Existing ambient air quality 17-12
17.3 Impact assessment 17-16
17.3.1 Air emission sources 17-16 17.3.2 Modelled impacts 17-21 17.3.3 Impacts summary 17-31
17.4 Management and mitigation 17-33
17.4.1 Early works and construction 17-33 17.4.2 During operation 17-34 17.4.3 Future monitoring 17-37
17.5 Summary 17-38
Parsons Brinckerhoff ii
List of tables Page number
Table 17.1 Relevant Commonwealth EIS Guidelines and NSW SEARs 17-1 Table 17.2 NEPM reporting standards and goals 17-3 Table 17.3 Adopted NSW air quality assessment criteria 17-4 Table 17.4 Project emission scenarios 17-7 Table 17.5 Adopted baseline air quality – Project site 17-14 Table 17.6 Summary of total pollutant emissions for each scenario (kg/yr) 17-22 Table 17.7 Derived short-term concentrations for SO2 and CO - all scenarios 17-23 Table 17.8 Summary of predicted air quality criteria exceedances 17-32 Table 17.9 Summary of air quality impacts at Full Build, without mitigation, for each rail access
option 17-38
List of figures Page number
Figure 17.1 Location of Project air quality monitoring network 17-9 Figure 17.2 Nearest assess receivers to the Project Site 17-10 Figure 17.3 Annual and seasonal windroses for OEH Liverpool Station (2013) 17-11 Figure 17.4 Source contributions to annual emissions during Full Build (all rail access options) 17-20 Figure 17.5 Modelled maximum (incremental and cumulative) PM10 24-hour average air emission
levels (µg/m3) associated with the Project against impact assessment criteria 17-25 Figure 17.6 Modelled annual average PM10 emission levels (µg/m3) for selected key emission
sources associated with the Project against impact assessment criteria 17-27 Figure 17.7 Modelled annual average PM2.5 emission levels (µg/m3) for selected key emission
sources associated with the Project against impact assessment criteria 17-29 Figure 17.8 Modelled annual average TSP emission levels (µg/m3) for selected key emission sources
associated with the Project against impact assessment criteria 17-30

Parsons Brinckerhoff 17-1
17. Local air quality
Chapter 17 provides an assessment of the existing local air quality surrounding the Moorebank Intermodal Terminal (IMT) site (the Project site) and the predicted local air quality impacts resulting from construction and operation of the Moorebank IMT Project (the Project). The term ‘local’ in this context is defined as the extent of the nearest assessed receivers surrounding the Project site as shown in Figure 17.2. The chapter summarises the detailed local air quality assessment prepared by Environ Australia Pty Ltd, which is included in Technical Paper 7 – Local air quality impact assessment in Volume 6 of this Environmental Impact Statement (EIS). Regional air quality is covered in Chapter 18 – Regional air quality, and covers potential impacts on air quality for the Sydney region or Sydney basin as a whole.
An independent peer review of Technical Paper 7 has been undertaken by NH2 Dispersion Sciences. A letter endorsing the technical paper and the approach described therein is included in Appendix G to this EIS (Volume 2).
The assessment addresses the Commonwealth Department of the Environment (DoE)’s Environmental Impact Statement (EIS) Guidelines and the Secretary for the NSW Department of Planning and Environment (NSW DP&E)’s Environmental Assessment Requirements (NSW SEARs) for the Project listed in Table 17.1.
Table 17.1 Relevant Commonwealth EIS Guidelines and NSW SEARs
Requirement Where addressed
Commonwealth EIS Guidelines under the Commonwealth Environment Protection and Biodiversity Conservation Act 1999 (EPBC Act)
A discussion of the known and potential developments in the local region on the environmental values of land, impacts to air and water and public health. This assessment may include air and water sheds affected by the proposal.
Section 17.2 of this chapter and section 6 of Technical Paper 7 – Local air quality impact assessment in Volume 6 of this EIS cover the air issues in this requirement. Water is addressed in Chapter 16 – Hydrology, groundwater and water quality and public health in Chapter 25 – Human health risks and impacts.
The potential for human health impacts was partly assessed in Technical Paper 7 – Local air quality impact assessment (in Volume 6) by evaluating cumulative concentrations against NSW impact assessment criteria intended to be protective of communities. When it was concluded that the impact assessment criteria could be exceeded (as in the case of fine particles), the potential for health risks was further investigated within the human health risk assessment in Volume 9. Chapter 25 – Human health risks and impacts summarises the findings of the human health risk assessment.
Describe the existing air quality site, including a description of the relationship of the site to the regional air drainage basin and of diurnal and seasonal variations in air pollution levels and the influence of short term weather phenomena. Reference must be made to levels of hydrocarbons, suspended particulate matter, carbon monoxide, oxides of nitrogen, sulphur dioxide, ozone, reactive organic compounds, lead and air toxics. The description must include relevant weather characteristics including winds, fogs and temperature inversions and any topographic features which may affect the dispersion of air pollutants.
Section 17.2 of this chapter and sections 5 and 6 of Technical Paper 7 – Local air quality impact assessment in Volume 6 of this EIS.

Parsons Brinckerhoff 17-2
Requirement Where addressed
Analyse and describe the changes to the local and regional air drainage basin as a result of construction and operational phases of the action. The analysis must consider diurnal and seasonal variations in air pollution levels and the influence of short term weather phenomena. The analysis must provide results for the following: hydrocarbons, suspended particulate matter, carbon monoxide, oxides of nitrogen, sulphur (sulphur) dioxide, ozone, reactive organic compounds, lead and air toxics.
Local air quality impacts are described in section 17.3 of this chapter and sections 10 and 12 of Technical Paper 7 – Local air quality impact assessment in Volume 6 of this EIS.
Regional impacts are covered in Chapter 18 – Regional air quality.
NSW SEARs under the NSW Environmental Planning and Assessment Act 1979 EP&A Act
A quantitative assessment of worst case predicted emission of air pollutants, including an assessment of potential air pollution sources (including identifying locomotive standards), dust deposition, total suspended particulates, PM10 PM2.5 and atmospheric pollutants of concern for local and regional air quality.
Section 17.3 of this chapter and sections 8, 10 and 12 of Technical Paper 7 – Local air quality impact assessment in Volume 6 of this EIS.
Consideration of relevant weather characteristics, seasonal variations and topographic features that may affect the dispersion of atmospheric pollutants.
Section 17.2 of this chapter and sections 3, 5 and Appendix A of Technical Paper 7 – Local air quality impact assessment in Volume 6 of this EIS.
Taking into account the Australian Greenhouse Office Factors and Methods workbook (AGO 2006), Approved Methods for the Modelling and Assessment of Air Pollutants in NSW (DEC) and the National Environmental Protection Measures for Ambient Air Quality (National Protection Council), and Environmental Health Risk Assessment: Guidelines for assessing human health risks from environmental hazards (enHealth 2012).
Section 17.1.1 of this chapter and sections 5, 6 and 9 of Technical Paper 7 – Local air quality impact assessment in Volume 6 of this EIS. The Australian Greenhouse Office (AGO 2006) reference is relevant to the greenhouse gas assessment in Chapter 19 – Greenhouse gas assessment. The enHealth reference is relevant to Chapter 25 – Human health risks and impacts.

Parsons Brinckerhoff 17-3
17.1 Assessment approach
17.1.1 Air quality criteria
Local air quality impacts that may arise from the construction and operation of the Project have been quantitatively assessed in this chapter. This assessment was completed with consideration of the guidelines presented in the Approved Methods for the Modelling and Assessment of Air Pollutants in New South Wales (NSW Department of Environment and Conservation (DEC) 2005a); the National Environmental Protection (Ambient Air Quality) Measure (NEPC 1998) and updates (NEPC 2003); the National Environmental Protection (Air Toxics) Measure (NEPC 2011); and the relevant NSW SEARs and EIS Guidelines (refer Table 17.1). NEPMs are broad framework-setting statutory instruments defined in the Commonwealth National Environment Protection Council Act 1994 (NEPC Act).
The NEPM air quality goals are long-term reporting descriptors used as objectives or standards to compare against long term air quality monitoring data. The NEPM standards and goals are provided in Table 17.2 below. This table shows the NEPM standards in the context of the ‘maximum allowable exceedances’ per year against each pollutant. The allowable exceedances account for certain environmental events, such as bushfires and windstorms, which can otherwise significantly influence air quality monitoring results.
Table 17.2 NEPM reporting standards and goals
Pollutant Averaging
period Goal
Maximum allowable exceedances per year
Carbon monoxide 8 hour 9.0 ppm 1
Nitrogen dioxide 1 hour 0.12 ppm 1
Annual 0.03 ppm 0
Photochemical oxidants (as ozone) 1 hour 0.10 ppm 1
4 hour 0.08 ppm 1
Sulfur dioxide 1 hour 0.20 ppm 1
1 day 0.08 ppm 1
Annual 0.02 ppm 0
Lead Annual 0.5 µg/m3 0
PM10 24 hour 50 µg/m3 5
PM2.5 24 hour 25 µg/m3 N/A
Annual 8 µg/m3 N/A
Notes: µg/m3 = micrograms per cubic metre; PM10 – Particulate matter ≤ 10 µm in aerodynamic diameter; PM2.5 – Particulate matter ≤ 2.5 µm in aerodynamic diameter, NEPM advisory reporting standard only;
N/A = No allowable exceedance is provided in the NEPM (Air) 2003; ppm = parts per million

Parsons Brinckerhoff 17-4
In addition to the NEPM air quality standards, the Project has also been assessed under NSW impact assessment criteria for a range of air quality pollutants in accordance with Approved Methods for the Modelling and Assessment of Air Pollutants in New South Wales (DEC 2005b). The NSW assessment criteria for the Project are presented in Table 17.3.
Table 17.3 Adopted NSW air quality assessment criteria
Pollutant Averaging period Concentration
Reference µg/m3 1 pphm2
NO2 1-hour 226 12 NSW EPA3
Annual 56 3 NSW EPA3
SO2 1-hour 524 20 NSW EPA3
24-hour 210 8 NSW EPA3
Annual 52 2 NSW EPA3
CO 1-hour 29,000 2,500 NSW EPA3
8-hour 10,000 900 NSW EPA3
Benzene 1-hour 31 0.9 NSW EPA3,4,5
Toluene 1-hour 370 9 NSW EPA3,4,6
Xylene (total) 1-hour 190 4 NSW EPA3,4,6
1,3-butadine 1-hour 43 1.8 NSW EPA3,4,5
Formaldehyde 1-hour 24 1.8 NSW EPA3,4,5
Acetaldehyde 1-hour 45 2.3 NSW EPA3,4,6
PAHs (as BaP) 1-hour 0.4 - NSW EPA
Note 1: Gas volumes expressed at 0°C and 1 atmosphere Note 2: pphm = parts per hundred million Note 3: Approved Methods for Modelling Note 4: For a Level 2 Assessment (defined within the Approved Methods for Modelling), expressed as the 99.9th Percentile
Value. The current assessment constitutes a Level 2 Assessment Note 5: Assessment criteria specified for toxic air pollutant Note 6: Assessment criteria summarised for odorous air pollutants
The criteria presented in Tables 17.2 and 17.3 have been used to assess both the incremental air quality concentrations from the Project alone, and the predicted cumulative air quality concentrations as a result of the Project in addition to future baseline air quality concentrations. A detailed discussion and comparison of the incremental and cumulative concentrations of the Project against the criteria is provided in section 17.3.
17.1.2 Pollutant types
The air quality assessment considered the following air pollutants, as these were identified to be the main emissions from the Project:
• Particulate matter (PM): PM occurs naturally through bushfires and the suspension of mineral dust and sea salt through wind driven processes, and through human activity such as the combustion of fossil fuels, including diesel engines. PM is carried through the air and can be defined by particle size as:
> total suspended particulates (TSP), which have an upper size range usually taken as 30 micrometres (µm);
> PM10 which have an aerodynamic diameter of less than 10 µm;
> PM2.5 (fines), which have an aerodynamic diameter of less than 2.5 µm.

Parsons Brinckerhoff 17-5
• Oxides of nitrogen (NO and NO2): The key compounds that comprise oxides of nitrogen (NOX) are nitric oxide (NO) and nitrogen dioxide (NO2), which occur most commonly through the combustion of fossil fuels, such as vehicle emissions and power stations.
• Ozone (O3): Ozone is generally not emitted directly, but is formed through a series of photochemical reactions that are triggered by increased levels of man-made pollution (such as NO2). In the upper atmosphere, ozone plays an important role in reducing and blocking harmful sunlight. However, ozone at the earth’s surface has the potential to do harm when it can cause damage to human and plant health.
• Carbon monoxide (CO): CO is primarily produced from the incomplete combustion of fossil fuels, for example, combustion engines, wood fire heaters and stoves, burning of waste and tobacco smoke. CO is also created from the earth’s natural processes, including from coal seam gas and bushfires.
• Sulfur dioxide (SO2): SO2 is produced during the combustion of fossil fuels that contain sulfur (e.g. diesel and coal) and is most commonly associated with acid rain. Sulfur content of common fuels has been significantly reduced since the introduction of the Commonwealth Fuel Quality Standards Act 2000, thereby also reducing potential environmental risks from this pollutant in Australia.
• Volatile organic compounds (VOCs): Common VOCs emitted in the urban atmosphere include benzene, toluene, ethylbenzene, xylene (BTEX), 1,3-butadiene, acetaldehyde and formaldehyde and are all primarily produced from vehicle exhaust emissions. These toxic air pollutants are often present in ambient air in very low concentrations. However, prolonged exposure above acceptable health levels can be hazardous to human, animal and plant life.
• Polycyclic aromatic hydrocarbons (PAHs): PAHs comprise a complex mixture of molecules and are most commonly derived from the incomplete combustion of fuels, for example, wood burning heaters, agricultural waste burning, motor vehicle exhaust, cigarette smoke and emissions from asphalt road and roofing operations.
• Lead: Lead is a heavy metal that, when consumed by humans and animals, accumulates in soft tissues and bones causing poisoning. Lead is no longer used in fuels in Australia.
17.1.3 Assessment methodology
The key steps undertaken to assess the existing local air quality and potential air quality impacts during the construction and operation of the Project are outlined below. This section summarises the methodology detailed in the local air quality assessment in Technical Paper 7 – Local Air Quality Impact Assessment in Volume 6 of this EIS. The key steps in the assessment comprised:
• a review of the indicative IMT site layouts and identification of sensitive receivers within the local area;

Parsons Brinckerhoff 17-6
• analysis of appropriate background air quality and meteorological data from the nearest or most relevant air quality and meteorological data stations (see Figure 17.1) to determine the existing climate and ambient air environment, including data from:
> OEH-operated air quality monitoring stations at Liverpool, Prospect and Chullora − these were adopted as the background air quality concentrations for the Project site as they characterise the local airshed;
> Bureau of Meteorology (BoM) weather stations at Holsworthy Control Range and Bankstown Airport and the OEH weather station at Liverpool, which provided meteorological data to analyse and determine potential dispersion patterns; and
> the installed Project air quality monitoring network, which monitors baseline air quality conditions for the local area and includes real time monitoring of NOX and PM10, an automatic weather station (AWS), and monitoring at three sensitive receiver locations during July and August 2012 to measure dust deposition, benzene, toluene, ethylbenzene, xylene (BTEX) and ozone;
• the development of the Project site representative meteorological conditions for use in dispersion modelling, using existing OEH data and derived data from the Commonwealth Scientific and Industrial Research Organisation (CSIRO)'s The Air Pollution Model (TAPM);
• review of the indicative IMT site layouts and description of works, including identification of potential air emission sources for the construction and operational phases of the Project; and
• the development of an air emission inventory of all potential local air pollutant sources for the assessment scenarios described below, and evaluation of such sources including:
> quantitative assessment of potential local air quality impacts during construction and operation of the Project. This assessment used the AMS/US EPA regulatory model (AERMOD) (US-EPA 2004) of the potential worst case and maximum offsite impacts at 35 sensitive receivers and four boundary point locations, for the following pollutants: TSP, PM10, PM2.5, dust deposition, SO2, NO2, CO, VOCs (benzene, toluene, xylenes, 1,3-butadine, formaldehyde and acetaldehyde) and PAHs;
> qualitative assessment of odour and lead pollutant impacts; and
> recommendation of mitigation measures to minimise potential impacts on the receiving environment.
Ozone was omitted from the assessment as this is a secondary pollutant and would not constitute a direct emission from onsite sources. A regional approach has instead been adopted for assessing ozone formation. As such, it has been considered in the regional air quality assessment in Chapter 18 – Regional air quality.
Twelve assessment scenarios were developed to assess the potential local air quality impacts of the Project. These scenarios cover the different construction and operation stages of the Project, as represented in Table 17.4 below. Due to the short term and minor nature of the activities associated with Early Works, the potential air emissions are expected to be negligible, as further discussed in section 7.3.1. For this reason, a detailed quantitative impact assessment of the Early Works scenario has not been undertaken. However, qualitative consideration has been given to the potential for Early Works activities to result in air quality impacts, and this is discussed in section 7.3.1.

Parsons Brinckerhoff 17-7
For each of the three Project layouts, four emission scenarios have been developed, corresponding to Phase A, Phase B, Phase C and Project Full Build, totalling 12 emissions scenarios. Chapter 8 – Project development phasing and construction provides a detailed definition of each Project phase, while Table 17.4 provides a summary of each scenario.
Table 17.4 Project emission scenarios
Project Phase Construction Operations Scenario ID
Phase A – (2016/2017) Scenario N1 – Northern rail access option Scenario C1 – Central rail access option Scenario S1 – Southern rail access option
Phase B – (2023/2024) Scenario N2 – Northern rail access option Scenario C2 – Central rail access option Scenario S2 – Southern rail access option
Phase C – (2028/2029) Scenario N3 – Northern rail access option Scenario C3 – Central rail access option Scenario S3 – Southern rail access option
Full Build – (2030) Scenario N4 – Northern rail access option Scenario C4 – Central rail access option Scenario S4 – Southern rail access option
17.1.4 Cumulative assessment
In accordance with the NSW SEARs, this EIS includes a cumulative assessment of the predicted local air impacts of the Project in combination with development of the Sydney Intermodal Terminal Alliance (SIMTA) site and other planned developments within the surrounding region. The findings of the cumulative assessment are provided in Chapter 27 – Cumulative impacts and within section 12 of Technical Paper 7 – Local Air Quality Impact Assessment (Volume 6).
17.2 Existing environment
17.2.1 Terrain
The terrain in the immediate vicinity of the Project site is primarily flat to the north and east. The Georges River is located immediately to the west of the Project site. On the other side of the Georges River, elevations increase to 40–50 metres (m), which is approximately 20 m higher than the Project site.
Local air drainage flows are normally considered when assessing potential impacts of ground level sources of pollutants. ‘Katabatic drift’ is the term used to describe the downward motion of cold air from a high point. This can result in plume entrapment, poor dispersion of airborne pollutants and the potential to cause greater off-site impacts. Katabatic drift is expected to occur in the vicinity of the Project site due to the influence of the Blue Mountains to the west. As these local air drainage flows often occur at night, this would result in temperature inversion (a thin layer of the atmosphere where the normal reduction in temperature with height switches to a temperature increase with height). This allows for the trapping of pollutants below the inversion until it breaks down (typically around mid-morning).
Parsons Brinckerhoff 17-8
17.2.2 Sensitive receivers
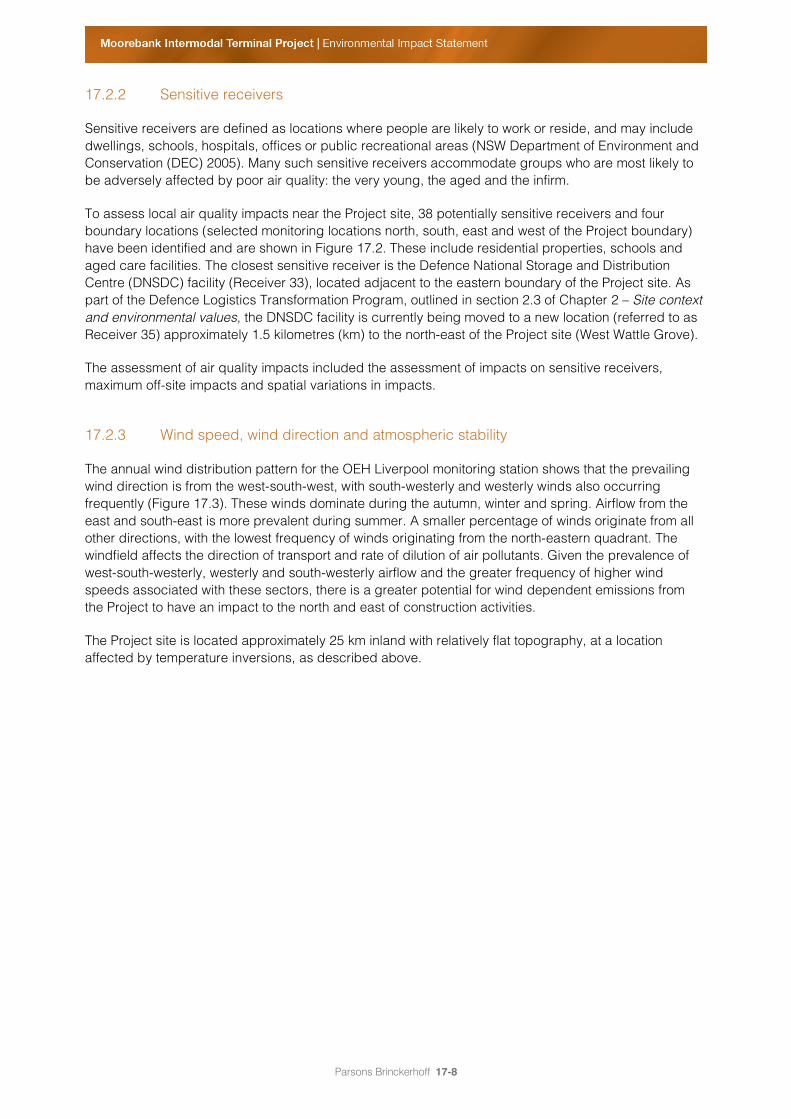
Sensitive receivers are defined as locations where people are likely to work or reside, and may include dwellings, schools, hospitals, offices or public recreational areas (NSW Department of Environment and Conservation (DEC) 2005). Many such sensitive receivers accommodate groups who are most likely to be adversely affected by poor air quality: the very young, the aged and the infirm.
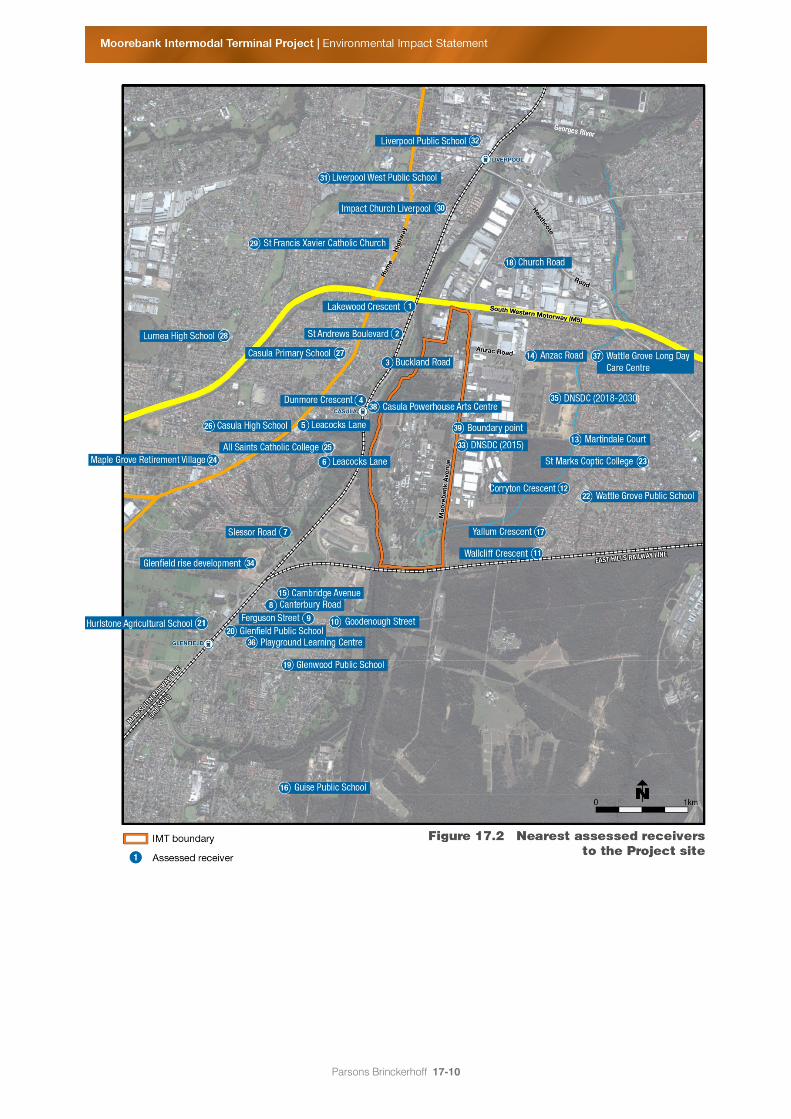
To assess local air quality impacts near the Project site, 38 potentially sensitive receivers and four boundary locations (selected monitoring locations north, south, east and west of the Project boundary) have been identified and are shown in Figure 17.2. These include residential properties, schools and aged care facilities. The closest sensitive receiver is the Defence National Storage and Distribution Centre (DNSDC) facility (Receiver 33), located adjacent to the eastern boundary of the Project site. As part of the Defence Logistics Transformation Program, outlined in section 2.3 of Chapter 2 – Site context and environmental values, the DNSDC facility is currently being moved to a new location (referred to as Receiver 35) approximately 1.5 kilometres (km) to the north-east of the Project site (West Wattle Grove).
The assessment of air quality impacts included the assessment of impacts on sensitive receivers, maximum off-site impacts and spatial variations in impacts.
17.2.3 Wind speed, wind direction and atmospheric stability
The annual wind distribution pattern for the OEH Liverpool monitoring station shows that the prevailing wind direction is from the west-south-west, with south-westerly and westerly winds also occurring frequently (Figure 17.3). These winds dominate during the autumn, winter and spring. Airflow from the east and south-east is more prevalent during summer. A smaller percentage of winds originate from all other directions, with the lowest frequency of winds originating from the north-eastern quadrant. The windfield affects the direction of transport and rate of dilution of air pollutants. Given the prevalence of west-south-westerly, westerly and south-westerly airflow and the greater frequency of higher wind speeds associated with these sectors, there is a greater potential for wind dependent emissions from the Project to have an impact to the north and east of construction activities.
The Project site is located approximately 25 km inland with relatively flat topography, at a location affected by temperature inversions, as described above.

Parsons Brinckerhoff 17-9
Figure 17.1 Location of Project air quality monitoring network
Parsons Brinckerhoff 17-10
Figure 17.2 Nearest assess receivers to the Project Site

Parsons Brinckerhoff 17-11
Annual windrose – OEH Liverpool Station 2013
Seasonal windroses – OEH Liverpool Station 2013
Figure 17.3 Annual and seasonal windroses for OEH Liverpool Station (2013)

Parsons Brinckerhoff 17-12
17.2.4 Climate
Historic meteorological data spanning 30 years is available from the closest BoM monitoring station at the Bankstown AWS, approximately 6 km north-east of the Project site. Other weather stations in the region were not considered appropriate to use, as they either lacked data from recent years or did not contain representative data across a 30-year period. Holsworthy Control Range AWS, approximately 1.5 km to the south of the Project site, only has data available from 1998. The prevailing climate based on the long-term climate record from Bankstown AWS is summarised below.
Temperature
The maximum monthly average temperatures at the Bankstown Airport AWS range between 17.1°C in winter (July) to 28.2°C in summer (January). Monthly average minimum temperatures range between 5.1°C in winter (July) and 18.1°C in summer (January and February).
Rainfall
Rainfall reduces dust generation potential and helps to remove airborne pollutants. The wettest months generally occur during late summer and early autumn. The wettest month is usually February, with an average rainfall of 106 mm. The lowest rainfall usually occurs in September with a monthly average of 45 mm. The long-term average annual rainfall experienced at the Bankstown Airport AWS is 896 mm, which falls over an average of 115 days over the course of the year.
Relative humidity
The relative humidity (RH) levels at the Bankstown AWS are slightly higher at 9 am than at 3 pm. RH is usually lowest in late winter and spring (i.e. August to November), and highest during autumn through to early winter (February to June). Maximum RH levels (80%) occurred in June (9 am data set) and the lowest RH level (3 pm data set) also occurred in August (44%).
Days of fog
There are currently no publicly available records that identify the prevalence of fog in the south-west Sydney region. However, information is available on the number of days of fog that occur at Sydney Airport (24 km east of the Project site). This site records between four and five days of fog on average each year (Weymouth 2012). As the Project site is located inland from Sydney Airport, the number of days of fog is expected to be higher.
17.2.5 Existing ambient air quality
A number of industrial and non-industrial sources close to the Project site have the potential to influence the local airshed. These include:
• existing industries to the east and north-east of the Project site (including Greenhills Industrial Estate and Moorebank Business Park);
• the existing Glenfield Landfill to the south-west;
• traffic emissions from the existing road network, including the M5 Motorway directly bordering the northern boundary of the Project site;

Parsons Brinckerhoff 17-13
• emissions from diesel locomotives on the SSFL to the west of the Project boundary (and a small number of diesel XPT trains on the Main South Line);
• diesel locomotive emissions from the East Hills Rail Line to the south of the Project site boundary (diesel trains are infrequent on this line but do occur occasionally, when diesel trains such as XPT-type locomotives are diverted from the Main South Line);
• emissions from aircraft at Bankstown Airport to the north-east and the military airfield at Holsworthy; and
• emissions from the Boral Concrete batching plant, approximately 4 km west of the Project site.
These sources are likely to give rise to emissions of particulate matter (TSPs, PM10 and PM2.5), NO2, SO2, CO, trace levels of VOCs, heavy metals and odour.
Ambient air quality monitoring equipment was established at the Project site in July 2012 and comprises the following:
• continuous monitoring of NOx, PM10 and PM2.5 at a location within the Project site (results are available on the Project website at <http://www.micl.com.au/>);
• dust deposition gauges at three selected sensitive receiver locations; and
• diffusion tubes monitoring BTEX and ozone at three selected sensitive receiver locations.
The Approved Methods for the Modelling and Assessment of Air Pollutants in New South Wales (Approved Methods for Modelling) (DEC 2005) requires that predicted impacts from the Project (derived through dispersion modelling) of TSP, PM10, dust deposition, NO2, SO2 and CO should be combined with existing background levels before comparison with the applicable impact assessment criteria. While not listed as a pollutant for assessment within the Approved Methods for Modelling, PM2.5 has been addressed in the same manner.
For these pollutants, section 5.1.1 of the Approved Methods for Modelling provides guidance on accounting for background concentrations in air quality impact assessments. Future baseline air pollution concentrations comprise the adopted measured concentrations in addition to incremental concentrations due to local sources and approved developments, as documented in subsequent sections of the Approved Methods for Modelling.
Therefore, in order to assess the cumulative impacts of predicted concentrations from the Project with existing background concentrations, the monitoring results documented in Technical Paper 7 – Local Air Quality Impact Assessment were adopted as baseline. These baseline levels are summarised in Table 17.5 below.
In addition to the data recorded by onsite air quality monitoring equipment, data from the NSW EPA ambient air quality monitoring stations at Liverpool and Chullora were collated to quantify baseline air quality. Comparison between the onsite monitoring data shows similarities in terms of magnitude and diurnal variability between the two PM10 datasets (refer section 6 of Technical Paper 7 – Local Air Quality Impact Assessment for detail). The recorded data for the OEH Liverpool Station generally reflected a higher background concentration; consequently this has been adopted as the baseline dataset to account for emissions from neighbouring sources. Data from the Project’s air quality program for deposited dust have been adopted in the assessment.

Parsons Brinckerhoff 17-14
Table 17.5 Adopted baseline air quality – Project site
Pollutant Averaging period Concentration (µg/m³)
unless otherwise stated Source/Notes
TSP Annual 42.6 Derived from OEH Liverpool 5-Year average for PM10 and Sydney PM10/TSP relationship
PM10 24-hour 24-hourly varying 2013
(100th percentile = 98.5) OEH Liverpool
Annual 20.4 OEH Liverpool 5-Year average
PM2.5 24-hour 24-hourly varying 2013
(100th percentile = 73.8) OEH Liverpool
Annual 7.6 OEH Liverpool 5-Year average
Dust deposition
Annual 0.8 g/m2/month Maximum 12-month average deposition across Project site monitoring locations
NO2 1-hour Hourly varying 2013
(100th Percentile = 114.8) OEH Liverpool
Annual 22.7
SO2
1-hour Hourly varying 2013 (100th Percentile = 34.3)
OEH Chullora 24-hour 24-hourly varying 2013 (100th percentile = 8.9)
Annual 1.9
CO
1-hour Hourly varying 2013 (100th percentile = 5,000)
OEH Liverpool
8-hour 8-hourly varying 2013 (100th percentile = 2,250)
Note: Recorded NO2, SO2 and CO concentrations converted from ppb or ppm to µg/m³ assuming 0°C and 1 atmosphere
Particulate matter (PM10 and PM2.5)
Hourly-average PM10 data were collated from both the onsite and OEH Liverpool air quality monitoring stations, with 24-hour average concentrations calculated.
The NSW EPA 24-hour average PM10 ambient air quality criterion is 50 micrograms per cubic metre (µg/m3) of air. Exceedances of the NSW EPA criterion of 50 µg/m³ were experienced at both monitoring stations, directly attributable to extensive bushfire events in the greater Sydney metropolitan region between September and November 2013. Annual average PM10 concentrations at both the onsite and OEH Liverpool stations were below the NSW EPA criterion of 30 µg/m³.
Data from the Liverpool OEH monitoring station were also used to consider longer term trends. The 2009 calendar year experienced higher PM10 concentrations than the following four years; however, 2009 was notable for the occurrence of significant dust storms across the east coast of Australia. The average PM10 concentration recorded at the OEH Liverpool station between 2009 and 2013, incorporating natural particulate matter events (bushfires and dust storms), was 20.4 µg/m³.
In the past five years, 2013 represents a relatively high year for PM10 concentrations. This is considered to be largely attributable to the occurrence of significant bushfires around Sydney and across NSW.

Parsons Brinckerhoff 17-15
PM2.5 concentrations are also measured at the Liverpool OEH monitoring station. There are no OEH or national air quality standards for PM2.5; reference is therefore made to the NEPM advisory reporting standard for this pollutant. The NEPM advisory reporting standard for maximum 24-hour average PM2.5 is 25 µg/m3. Two exceedances of the NEPM 24-hour average advisory reporting goal for PM2.5 were recorded during 2013 and are attributed to hazard reduction burns (late April 2013) and bushfires (between September and November 2013) in the greater Sydney metropolitan region.
The annual average PM2.5 concentration recorded during 2013 at the OEH Liverpool station was 9.4 µg/m³, which exceeds the NEPM advisory reporting goal of 8 µg/m³. The average PM2.5 concentration recorded at the OEH Liverpool station between 2009 and 2013, incorporating natural particulate matter events (bushfires and dust storms), was 7.6 µg/m³.
The long-term trend in PM2.5 concentrations at the Liverpool monitoring station indicates that concentrations have remained at similar levels over the past several years, with a greater number of peak concentrations during the years affected by vegetation burning or drought.
Oxides of nitrogen
The 1-hour average NO2 OEH criterion is 246 µg/m3. A review of the annual average and maximum NO2 concentrations at the Liverpool monitoring station from 2005 to 2012 showed an improvement in NO2 levels. The highest 1-hour average NO2 concentration was recorded in 2005, measuring 129 µg/m3.
Carbon monoxide (CO)
The 1-hour average CO OEH criterion is 30 milligrams per cubic metre (mg/m3). The highest 1-hour average CO concentration, recorded in 2013, was 4 mg/m3. This is well below the OEH criterion. All measured CO levels taken at the Liverpool monitoring station met the OEH criterion.
Sulfur dioxide (SO2)
The 1-hour, 24-hour and annual average OEH air quality criteria for SO2 are 570 µg/m3, 225 µg/m3 and 60 µg/m3 respectively. Since 2005 there have been no exceedances of the 1-hour, 24-hour and annual average OEH air quality criteria at the Liverpool and Chullora monitoring stations.
Volatile organic compounds (VOCs)
BTEX was measured at three locations at the Project site and found to be below the pollutant investigation levels specified in the Air Toxics NEPM.
Poly-cyclic aromatic hydrocarbons (PAHs)
There are no current available monitoring data for PAHs in the Sydney area. These pollutants are anticipated to be present in trace concentrations within the local ambient environment.

Parsons Brinckerhoff 17-16
Total suspended particulates (TSPs)
No publicly available TSP monitoring is conducted in the vicinity of the Project site. Historically, the NSW OEH recorded concurrent 24-hour average TSP and PM10 concentrations on a one-in-six day sampling regime at Earlwood, Rozelle and the Sydney CBD. This monitoring was discontinued in 2004. NSW OEH quarterly air quality monitoring reports for 2003 and 2004 were reviewed for concurrent PM10 and TSP concentrations. These data highlighted that, on average, PM10 concentrations recorded by the NSW OEH were 48% of TSP concentrations.
In the absence of concurrent TSP monitoring data, this PM10/TSP relationship from the 2003–2004 NSW OEH monitoring reports has been applied to the OEH Liverpool station PM10 monitoring data. Over the five-year period between 2009 and 2013, this returns an average TSP concentration of 42.6 µg/m³. This is considered a conservative (upper bound) estimate of TSP concentrations in the study area.
Deposited dust
Monitoring for dust deposition has been conducted at three locations surrounding the Project site since August 2012. Recorded monthly dust deposition levels (as total insoluble solids) since August 2012 are presented in section 6 of Technical Paper 7 – Local Air Quality Impact Assessment. The results indicated that the recorded deposition levels are below the NSW EPA criterion of 4 g/m2/month. Across all three locations, the 12-month average deposition levels range from 0.6 g/m2/month and 0.8 g/m2/month.
17.3 Impact assessment
17.3.1 Air emission sources
Early Works phase
The Early Works phase would have the potential to generate air quality emissions, primarily particulate matter (TSP, PM10 and PM2.5), through the demolition of structures, localised earthworks within the conservation area and the handling and transportation of material generally. Approximately 5,500m3 of contaminated soil material has been estimated for remediation activities (refer Table 8.2 in Chapter 8 – Project development phasing and construction). Given the expected low magnitude of the earthworks and the short term nature of Early Works construction and remediation activities, it is considered that the potential air emissions and related impacts from this phase of the Project would be negligible.
A preliminary Remediation Action Plan (RAP) has been prepared for the Project and is included in Technical Paper 5 – Environmental Site Assessment (Phase 2). The RAP identifies the processes and methods that would be followed during the investigation and remediation of the contaminated material.
Section 15.5.1 of Chapter 15 – Contamination and soils summarises the soil and remediation methods that may be utilised throughout Early Works and the following construction phases of the Project. These methodologies include: containment and monitoring; consolidation and/or capping; excavation and offsite disposal; and excavation and onsite treatment. Once further details of the Project are known, the RAP would be updated and would confirm the remediation methodologies to be undertaken at the Project site.
Given the expected low magnitude of the earthworks and the short term nature of construction activities, it is considered that the potential air emissions and related impacts from this phase of the Project would be negligible.

Parsons Brinckerhoff 17-17
It is considered that, with the implementation of recommended and proposed control measures as specified in section 17.4.1, air quality emissions and associated impacts on the local environment would be low. Emissions from the Early Works phase have not been considered further within the assessment.
During construction (Phases A, B and C)
During construction, the main potential air quality related impacts would be associated with the generation of dust and emissions from the movement of onsite machinery, bulk earthworks, material storage and associated vehicular traffic within the construction footprint.
Dust emissions
The generation of PM during construction could temporarily affect the local ambient air environment. PM emissions depend on the quantity and drift potential of the particles in the atmosphere. Larger particles (TSP) settle out closer to the source due to their larger mass. The deposition of these particles can cause nuisance within the surrounding area. Finer particles (PM10 and PM2.5) remain airborne much longer and therefore are spread greater distances. The fine nature of these particles also has the potential to affect people’s respiratory systems if not adequately controlled.
Potential sources of dust emission during the terminal development include:
• vehicle movements on paved and unpaved roads;
• erosion of stockpiles and freshly exposed areas onsite;
• handling, transfer and storage of materials;
• heavy earthwork operations such as excavation and earthmoving activities; and
• re-contouring of land and soil exposure for reseeding.
The short-term nature of the construction activities and the proposed implementation of detailed control measures (refer to section 17.4) would enable particulate matter emissions to be effectively managed.
Vehicle emissions
During construction, emissions are likely to be associated with the combustion of diesel fuel and petrol. The operation of onsite machinery during construction and general site operations would generate CO, CO2, NOX, SO2, particulate matter (PM10 and PM2.5) and trace amounts of non-combustible hydrocarbons. Emission rates and impact potential would depend on the number and power output of the combustion engines, the quality of the fuel and the condition of the combustion engines.
During Phases A, B and C it is expected that up to 965, 972 and 197 trucks respectively would enter and leave the Project site each day, delivering equipment and materials and removing materials. Combustion emissions from these trucks have the potential to affect the local airshed and have, therefore, been included in the dispersion modelling assessment (refer to section 17.3.2). Fugitive PM emissions associated with onsite construction plant and machinery (dozers, scrapers, excavators, etc.) have also been included in the dispersion modelling.
In comparison to the construction haulage trucks, only a small number of other mobile sources (such as bulldozers and excavators) would be operating onsite each day. Therefore, items of construction plant are only expected to generate low levels of exhaust emissions, and exhaust emissions from construction machinery were not considered further in the assessment.
Parsons Brinckerhoff 17-18
Odour emissions
Part of the excavation works includes the removal of potentially contaminated soils from within the construction footprint. As a result of the contaminated soils being exposed to the ambient air environment, there is potential for some odorous emissions to be released. Slight odours may be detectable at the Project site close to the emission source(s) during construction. The intensity of perceived odour impacts can vary significantly between people, as reactions to odour are highly subjective. However, onsite surveys of the soils detected few volatile contaminants and odorous compounds (Parsons Brinckerhoff 2014b) and odorous emissions are therefore not expected to be an issue during excavation works.
The southern rail access option crosses the Glenfield Landfill site. It is understood that the landfill handles disposal of inert material such as building/construction, garden and timber waste but not the disposal of putrescible waste. The potential for odorous emissions to be generated that would be detectable at off-site receivers during construction activities in this area is considered to be low.
During operation (Phases B, C and Full Build)
Emissions from diesel locomotives and switch engines
A significant source of air emissions during the operation of the Project would be the diesel freight train locomotives travelling to and from the import/export (IMEX) and interstate terminals and the switch engines used to move the wagons within the working tracks.
Locomotive emissions would result from the combustion of diesel fuel and petroleum. Pollutants would include PM fractions (TSP, PM10 and PM2.5), CO, CO2, NOx, SO2 and trace levels of non-combustible VOCs, non-methane hydrocarbons (NMHCs) and PAHs.
Fugitive particulate matter emissions from the use of freight trains are mainly caused by wheel/brake action on rail lines and entrainment of surface particles in the rail corridor. (Note: Emissions from open sources such as this are termed ‘fugitive’ as they are not discharged to the atmosphere in a confined flow stream). The emissions of PM from these fugitive sources would be minor and were not included in the quantitative assessment summarised in section 17.3.2.
Emissions from onsite mobile equipment
Onsite mobile emissions were modelled from sources including forklifts, side picks and in-terminal vehicles (ITVs). This equipment would be used to transport the TEU containers to the warehousing facilities and container storage facilities. Forklifts would be limited to the warehouses and would not be required until Project Phase B, when the warehousing facilities become operational. The side picks and ITVs would operate throughout the Project site.
All forklifts, side picks and ITVs would be powered by liquefied natural gas (LNG). Emissions from LNG equipment would primarily consist of NOx, PM2.5, CO and trace levels of non-combustible hydrocarbons such as VOCs.
Parsons Brinckerhoff 17-19
Off-terminal transport vehicle (OTV), diesel and petrol vehicle emissions
Emissions are anticipated to arise from the combustion of diesel and petrol fuel from delivery trucks and heavy goods vehicles (off-terminal transport vehicles (OTVs)) and employee and visitor cars entering and leaving the Project site. Combustion exhausts from the OTVs are expected to be a significant contributor of emissions to the local airshed and have been included in the predictive air dispersion modelling described in section 17.3.2, along with emissions from passenger vehicles which comprise a minor source.
Emissions from the OTVs and passenger vehicles are expected to include NOx, PM10, PM2.5, SO2 and CO. Low levels of VOCs, NMHCs and PAHs are also anticipated.
Warehousing
The local air quality assessment (in Volume 6) has assumed the use of natural gas systems for heating and cooling of the proposed warehouses. This constitutes a worst case scenario. Annual emissions of PM10, PM2.5, NOx, SO2, CO, VOCs and PAHs were estimated for natural gas combustion at the proposed warehouses based on projected annual natural gas consumption.
Miscellaneous emissions
Minor fugitive emissions are expected from fuels and chemicals stored onsite (e.g. LNG, diesel, lubricant oils and cleaning chemicals). Refrigeration facilities may be required throughout the operation of the Project, which would result in refrigeration emissions being released as part of the Project’s operation. Transportation refrigeration units (TRUs) are used to maintain climate control for containers and railcars carrying perishable cargo. A study into air emission sources commonly associated with centres for the transport and movement of goods, such as intermodal facilities and maintenance yards, showed that TRUs were responsible for only a small amount of PM10 emissions from the operation of intermodal facilities. The study also found that the proportion of NOX emissions resulting from TRUs was significantly less for PM10 (Douglass, Heiken & Rubenstein 2010). The air quality emissions resulting from Project-related refrigeration activities are therefore unlikely to contribute significantly to the overall air emissions from the Project. However, at this stage of the development, specific refrigeration requirements of the Project are unknown. This would need to be further investigated at the detailed design stage.
Some minor localised odour emissions may be generated as part of the Project’s general operation and/or the proposed onsite sewage treatment plant. The expected odour impacts both on and offsite would be negligible, based on the location of the Project site, the likely ambient air quality characteristics and the transient nature of odorous emissions.
Odorous emissions would be controlled through the implementation of Best Management Practice (BMP) as discussed in section 17.4.6.
As all of the miscellaneous emissions are expected to be minor, with minimal potential for impact on the local airshed, they were not included in the predictive air dispersion modelling described in section 17.3.2.

Parsons Brinckerhoff 17-20
Emissions summary
To provide an indication of the key contributing sources to air pollutants during Full Build, Figure 17.4 illustrates the contribution of the emission sources identified above to all calculated air pollutants. As represented in Figure 17.3, diesel locomotives and switch engines are significant contributors of SO2, NOx, PM10, PM2.5 and PAHs, while onsite mobile equipment (ITVs, side picks and forklifts) are the highest contributor to CO and VOC emissions. OTVs are a key contributor to the majority of combustion pollutants calculated, in particular NOx, PM10 and PM2.5, SO2 and PAHs. Of all the emissions sources considered, warehouse heating and cooling and passenger vehicles are comparatively insignificant generators of all pollutants, relative to other Project sources.
Figure 17.4 Source contributions to annual emissions during Full Build (all rail access options)

Parsons Brinckerhoff 17-21
17.3.2 Modelled impacts
The 12 impact assessment scenarios (Table 17.4) were investigated for potential air quality impacts on nearby sensitive receivers, with the results presented and discussed in the local air quality assessment in Volume 6 of this EIS.
The assessment considered both the incremental and cumulative impacts of the Project, whereby:
• incremental impacts refer to the predicted impact of the ‘Project only’ under future scenarios; and
• cumulative impacts refer to the predicted impact of the Project and projected future baseline air quality:
> including existing measured air quality and impacts due to the existing Glenfield Landfill and SSFL, but
> excluding any potential development on the Sydney Intermodal Terminal Alliance (SIMTA) site or any other significant potential developments in the area that are yet to be approved or confirmed. An assessment of the cumulative impacts of the Project with reference to a potential SIMTA warehousing development is included in Chapter 27 – Cumulative impacts of this EIS.
The modelling assumed a number of conditions as well as the implementation of a number of mitigation measures, as detailed in Appendix E of the local air quality assessment (in Technical Paper 7 – Local Air Quality Impact Assessment in Volume 6). The assumed mitigation measures included in the modelling are discussed in section 17.4. Additional mitigation measures have also been discussed in section 17.4; these were not assumed in the assessment modelling, but it is considered that the implementation of these additional measures could further control or remove local air quality impacts of the Project.
It should be noted that incremental impacts are useful in isolating the Project only impacts; however, they are not a true reflection of future conditions, which will include other background sources.
Potential impacts are described below in relation to each relevant pollutant for the scenarios considered (which include a combination of construction and operational conditions).
A summary of the total emissions predicted to be released during each scenario is provided in Table 17.6. The modelling results show that over time the total emissions of TSP and PM10 would substantially decline. This is associated with the expected reduction in construction emissions, with construction scheduled to be finalised during 2029. Conversely, the proposed ramp up in operations in the later scenarios is reflected in the relative increase in total emissions of the remaining, combustion-related pollutants (PM2.5, NOx, SO2, CO, PAHs and VOCs). A summary of the results is presented in the following discussion. Full results and isopleth plots for each of the modelled scenarios are presented in Appendix C and Appendix D of Technical Paper 7 – Local Air Quality Impact Assessment.

Parsons Brinckerhoff 17-22
Table 17.6 Summary of total pollutant emissions for each scenario (kg/yr)
Layout option
Year TSP PM10 PM2.5 NOx SO2 CO PAHs VOCs
Northern Phase A – 2016
43,240 14,223 2,515 21,669 24.6 8,169 9.6 1,203
Phase B – 2023
23,680 9,021 3,523 98,454 126.1 38,676 19.0 11,418
Phase C – 2025
27,077 12,473 6,142 146,128 136.3 180,549 10.6 67,899
Full Build 7,691 7,691 7,551 262,224 246.5 289,794 18.9 133,084
Central Phase A – 2016
46,386 14,595 2,549 21,669 24.6 8,169 9.6 1,203
Phase B – 2023 29,215 11,693 3,925 98,454 126.1 38,676 19.0 11,418
Phase C – 2025
28,767 12,876 6,200 146,128 136.3 180,549 10.6 67,899
Full Build 7,691 7,691 7,551 262,224 246.5 289,794 18.9 133,084
Southern Phase A – 2016 40,846 13,387 2,396 21,669 24.6 8,169 9.6 1,203
Phase B – 2023
26,113 9,989 3,672 98,454 126.1 38,676 19.0 11,418
Phase C – 2025 29,353 13,391 6,280 146,128 136.3 180,549 10.6 67,899
Full Build 7,691 7,691 7,551 262,224 246.5 289,794 18.9 133,084
Oxides of nitrogen (NOx)
The Ozone Limiting Method (OLM) developed by the United States Environmental Protection Agency (US EPA) was used to assess the amount of NO2 in the total nitrogen oxide (NOX) found in the atmosphere under each scenario. The method assumes that all available ozone would react with NO to produce NO2. An OLM NO2 assessment using hourly monitored NO2 and O3 data was undertaken to determine the maximum 1-hour and annual average NO2 concentration for each scenario.
The predicted maximum 1-hour average and annual average NO2 concentrations were below the relevant air impact assessment criteria for all sensitive receivers considered and for all Project scenarios. Therefore, the Project is not expected to have an adverse impact in relation to NO2 concentrations.
Carbon monoxide (CO)
During the worst case operating conditions CO emissions are predicted to be within the respective OEH criteria. Furthermore, incremental CO levels for the maximum 1-hour and 8-hour averaging periods were predicted to account for less than 5% of the respective air quality impact assessment criteria across all of the scenarios modelled.

Parsons Brinckerhoff 17-23
Review of the air quality modelling results in Appendix C of Technical Paper 7 – Local Air Quality Impact Assessment indicates that for all three rail access options, the Full Build, (2030) scenarios would result in the highest cumulative concentrations at the sensitive receptors investigated. However, the maximum 1-hour and 8-hour average concentrations of 4.6 mg/m3 and 2.1 mg/m3 (both at Receiver 33) were all below the respective OEH criteria of 30 mg/m3 and 10 mg/m3. Therefore, even during the worst case operating conditions, CO concentrations are predicted to be within the OEH criteria. As a consequence, the Project is not expected to have an adverse impact in relation to CO concentrations.
Sulfur dioxide (SO2)
The air quality modelling results in Appendix C of Technical Paper 7 – Local Air Quality Impact Assessment show that the highest cumulative SO2 concentrations predicted for all scenarios would be below the respective assessment criteria.
The highest incremental SO2 concentrations were predicted to occur under Full Build operations. However, the results show that for both incremental and cumulative SO2 emissions from the construction and operation of the Project, no criteria exceedances were predicted. Therefore, the Project is not expected to have an adverse impact in relation to SO2 concentrations.
Short-term average concentrations for CO and SO2
The NSW EPA prescribes short term (sub-hourly) air quality impact assessment criteria within the Approved Methods for Modelling. Specifically relevant to emissions from the Project are the 10-minute SO2 criterion and 15 minute CO criterion.
The atmospheric dispersion modelling conducted for this EIS reports in hourly time steps. In order to assess compliance with the short term criteria, the short term concentrations of SO2 and CO were calculated from the modelled1-hour average concentrations. Further detail on this is provided in Section 9 of Technical Paper 7 – Local Air Quality.
The maximum predicted incremental (Project only) 1-hour average concentrations across all modelling scenarios and receptor locations were identified and then converted to the short term averaging period (10-minute for SO2 or 15-minute for CO). Table 17.7 presents the results of this conversion.
Table 17.7 Derived short-term concentrations for SO2 and CO - all scenarios
Pollutant Maximum 1-hour Average Project Increment (μg/m3)1
Derived Short Term Concentration (μg/m3) NSW EPA Criteria
(μg/m3) Increment Cumulative
SO2 0.2 0.6 101.3 712
CO 188.9 434.0 11,934 100,000
Notes: 1: Maximum 1-hour average concentration presented is the maximum predicted across all receptors and modelling scenarios.
Source: Table 29 in Technical Paper 7 – Local Air Quality
The derived incremental maximum 10-minute SO2 and 15-minute CO concentrations are significantly lower than the applicable NSW EPA criteria. Furthermore when the derived maximum baseline concentrations are added to the model predictions, the cumulative concentrations are also well below the short term assessment criterion.
Parsons Brinckerhoff 17-24
Volatile organic compounds (VOCs)
The predicted incremental impacts of VOC emissions have been presented in Appendix C of Technical Paper 7 – Local Air Quality Impact Assessment for the 99.9th percentile1 1-hour average concentrations of benzene, toluene, xylene, 1,3-butadiene, formaldehyde and acetaldehyde.
The results show that the 99.9th percentile 1-hour average concentrations would be below the relevant air assessment criteria for benzene, toluene, xylene, 1,3-butadiene and acetaldehyde at all the sensitive receivers considered. The maximum offsite 99.9th percentile concentrations of these VOCs were also predicted to be within the relevant impact assessment criteria for all scenarios. Therefore, the Project is not expected to have an adverse impact in relation to these VOC concentrations.
Based on the compliance with OEH IAC for toluene, xylene and acetaldehyde (classified as odorous pollutants by OEH in the Approved Methods for Modelling), odour from the Project is not likely to have an impact on the surrounding environment.
Polycyclic aromatic hydrocarbons (PAHs)
PAH emissions were modelled for both incremental and cumulative maximum 1-hour average concentrations. The assessment assumed that all PAH emissions are presented as benzo(a)pyrene, providing a conservative assessment of potential PAH impacts.
Incremental results show the predicted PAH impacts for the Project only. Cumulative results include PAH emissions from the SSFL. No background contributions for the cumulative results were available for this study, as discussed in section 17.2. The OEH impact assessment criterion is, however, specified for the evaluation of incremental (Project-related) concentrations.
As shown in the air quality modelling results in Appendix C of Technical Paper 7 – Local Air Quality Impact Assessment, the maximum 1-hour average PAH concentrations were predicted to be well below the benzo(a)pyrene impact assessment criterion of 0.4 µg/m3 at all sensitive receivers investigated for all Project scenarios.
Particulate matter – PM10
Maximum 24 hour average PM10 results
The predicted maximum 24-hour average PM10 incremental and cumulative concentrations were assessed for nearby receivers for all scenarios. A contemporaneous assessment was used, which adds each individual PM10 model prediction to the corresponding projected background concentration for the same period. Background concentrations, which include emissions from both the SSFL and Glenfield Landfill, were predicted to account for more than 97% of the maximum cumulative 24-hour average PM10 concentrations in all scenarios.
1 Percentiles are used to exclude high concentration variance from the compliance assessment. When calculating the 99.9th
percentile, it is based on one year of 1-hourly data, with 0.01% (or the highest 8.76 hours of monitoring/modelled data) excluded. Effectively only the 10th highest hourly average measured/predicted concentration is compared to the impact assessment criterion.

Parsons Brinckerhoff 17-25
Figure 17.5 shows that the predicted maximum 24-hour average incremental concentrations of PM10 would comply with the OEH criterion at all sensitive receivers under all scenarios. However, the cumulative 24-hour average PM10 impacts were predicted to be above the OEH criterion of 50 µg/m3 at all sensitive receivers investigated, primarily due to elevated existing background concentrations. The cumulative PM10 concentrations are also predicted to exceed the 24-hour average IAC of 50 µg/m3 for one day of the year, due to elevated background concentrations (coinciding with bushfires in the greater Sydney area) – i.e. this exceedance is already occurring without the Project. In cases where the background concentrations exceed the OEH 24-hour PM10 criterion, the Approved Method for Modelling requires that it be demonstrated that the Project does not result in additional exceedances. No additional exceedances were predicted to occur under any scenario, nor at any sensitive receiver. As shown in Table 17.6, the total emissions of PM10 would substantially decline over time due to the expected reduction in construction emissions, with construction scheduled to be finalised by 2030. Full results data are contained in Appendix C of Technical Paper 7 – Local Air Quality Impact Assessment.
Note: For modelling purposes, a worst case scenario was adopted for all considerations relevant to each modelled emission
(e.g. it was assumed that the maximum number of equipment will be operating simultaneously during each phase (construction/operation) relevant to a scenario. Maxima presented are the maximum predicted concentration at any modelled receiver for each scenario.
Figure 17.5 Modelled maximum (incremental and cumulative) PM10 24-hour average air emission levels (µg/m3) associated with the Project against impact assessment criteria

Parsons Brinckerhoff 17-26
Construction dust would make a substantial contribution to the predicted Project-related PM10
concentrations during Phases A, B and C for all rail access options. Although typical dust control measures during construction were assumed in the Project predictions, operational dust management incorporating real-time monitoring and associated contingency measures (refer section 17.4) was not accounted for in the modelling.
Exhaust emissions from diesel trucks and locomotives would make a substantial contribution to the predicted Project-related PM10 concentrations during the operational components of Phases B, C and Full Build. The adopted emission rates incorporated an assumption that there would be progressive improvements in combustion engine exhaust emissions for diesel trucks and locomotives. However, these assumptions may in fact be conservative if Euro VI standards for heavy duty vehicles are introduced in Australia. In this event, PM10 emissions from compliant trucks would be reduced by a further 50%.

Parsons Brinckerhoff 17-27
Annual average PM10 results
Figure 17.6 shows the predicted cumulative annual average PM10 concentration. The results show that all sensitive receivers would comply with the OEH annual average PM10 criterion of 30 µg/m3. Full results data are contained in Appendix C of Technical Paper 7 – Local Air Quality Impact Assessment.
Note: For modelling purposes, a worst case scenario was adopted for all considerations relevant to each modelled emission (e.g. it was assumed that the maximum number of equipment will be operating simultaneously during each phase (construction/operation) relevant to a scenario. Maxima presented are the maximum predicted concentration at any modelled receiver for each scenario.
Figure 17.6 Modelled annual average PM10 emission levels (µg/m3) for selected key emission sources associated with the Project against impact assessment criteria
For the cumulative annual average concentrations, Receiver 33 would experience the greatest PM10 concentrations for all scenarios, with a maximum concentration of 21.5 µg/m3 predicted to occur under Scenario C3.
Receiver 33 would also experience the highest incremental PM10 concentrations for all scenarios, with the greatest concentration predicted to occur under Scenario C3 (1.1 µg/m3), well under the assessment criteria. It is clear that incremental impacts would decline as construction activities that generate PM10 emissions come to an end.

Parsons Brinckerhoff 17-28
Particulate matter – PM2.5
No criteria for PM2.5 concentrations are provided in the Approved Methods for Modelling; nor are NEPM air quality standards specified for this pollutant. Instead, the NEPM (Ambient Air Quality) advisory reporting standard has been adopted for this pollutant.
On some occasions, existing background PM2.5 concentrations exceed the NEPM advisory reporting standard in NSW due to bushfires and dust storms (OEH, 2013). Measured ambient PM2.5 concentrations are recorded as being influenced by the bushfires in the greater Sydney metropolitan area, as discussed in section 17.2.6. As a result, the 24-hour average PM2.5 advisory reporting standard was found to have been exceeded on two days during the monitoring year used in this assessment.
Maximum 24-hour average PM2.5 results
The maximum 24-hour average incremental and cumulative PM2.5 concentrations were predicted for nearby receivers for all Project scenarios. A contemporaneous assessment was used, which adds each individual PM2.5 model prediction to the corresponding background concentration for the same period measured at the Liverpool monitoring stations.
The modelled results for the incremental maximum 24-hour average predictions complied with the NEPM advisory reporting goal of 25 µg/m3 at all sensitive receivers under all Project scenarios.
However, the modelled results for the cumulative maximum 24-hour average predictions were above the NEPM advisory reporting goal of 25 µg/m3 at all sensitive receivers for all scenarios, as reflected in Appendix C of Technical Paper 7 – Local Air Quality Impact Assessment. The maximum cumulative predictions were associated with the maximum recorded measurements in the baseline data. As a result of the bushfires in late 2013, two days within the background air quality data recorded concentrations above the 24-hour average PM2.5 concentration criteria of 25 µg/m3. No additional PM2.5 exceedances to those observed in the background data are predicted to occur as a result of the construction and operation of the Project.
PM2.5 exhaust emissions from diesel trucks and locomotives would make a substantial contribution to the predicted Project-related PM2.5 concentrations during the operational period. The adopted emission rates incorporated an assumption that there would be progressive improvements in combustion engine exhaust emissions for diesel trucks and locomotives. However, these assumptions may in fact be conservative, if Euro VI standards for heavy duty vehicles are introduced in Australia. In this event, PM2.5 emissions from compliant trucks would be reduced by a further 50%, as noted in the discussion of PM10 findings above.
Annual average PM2.5 results
Figure 17.7 reflects the maximum cumulative annual average PM2.5 concentrations predicted at any receiver. An exceedance of the OEH annual average PM2.5 criterion of 8 µg/m3 is predicted for all scenarios in Phases B, C and Full Build. In each case, this exceedance is predicted at Receiver 33 only. The cumulative results show a maximum annual average PM2.5 concentration of 8.5 µg/m3 under Scenario C3 at Receiver 33.
Receiver 33 was also predicted to have the highest incremental annual average PM2.5 concentration, with the greatest incremental concentrations predicted to be experienced during Scenario C3 (1.2 µg/m3). Figure 17.7 also shows the predicted annual average incremental PM2.5 concentrations for all scenarios.

Parsons Brinckerhoff 17-29
Note: For modelling purposes, a worst case scenario was adopted for all considerations relevant to each modelled emission (e.g. it was assumed that the maximum number of equipment will be operating simultaneously during each phase (construction/operation) relevant to a scenario. Maxima presented are the maximum predicted concentration at any modelled receiver for each scenario.
Figure 17.7 Modelled annual average PM2.5 emission levels (µg/m3) for selected key emission sources associated with the Project against impact assessment criteria
Based on these predictions, the incremental contribution of the Project would be below the NEPM advisory reporting goals. No offsite exceedances of the annual average PM2.5 NEPM goal are predicted to occur as a result of the construction or operation of the Project.
Total suspended particulates (TSPs)
Figure 17.8 shows the maximum cumulative annual concentration of TSPs predicted to result from the development of the Project. TSP concentrations are predicted to decrease with time, as the bulk earthworks and dust generating activities during construction come to an end. Consequently, TSP is not considered for Full Build scenarios.
There are no predicted incremental or cumulative TSP criteria exceedances, and hence no predicted TSP impacts, at any sensitive receiver nor under any scenario investigated in this assessment.
Receiver 33 is predicted to experience the highest incremental (Project-related) concentration. The predicted cumulative TSP annual average concentrations are highest at this receiver (45 µg/m3) during the Phase A scenarios. The maximum offsite cumulative annual average TSP concentration is also predicted to be below the OEH impact assessment criteria of 90 µg/m3.

Parsons Brinckerhoff 17-30
Note: For modelling purposes, a worst case scenario was adopted for all considerations relevant to each modelled emission (e.g. it was assumed that the maximum number of equipment will be operating simultaneously during each phase (construction/operation) relevant to a scenario. Maxima presented are the maximum predicted concentration at any modelled receiver for each scenario. TSP has been modelled as a construction-only impact.
Figure 17.8 Modelled annual average TSP emission levels (µg/m3) for selected key emission sources associated with the Project against impact assessment criteria
Deposited dust
Deposited dust emissions would only arise from construction activities; therefore, impacts have not been considered for Full Build project scenarios (N4, C4 and S4).
There are no predicted incremental or cumulative deposited dust exceedances or impacts at any of the receivers investigated. The highest incremental and cumulative dust deposition rates were predicted at Receiver 33.
Dust deposition rates are predicted to peak in 2015/16 during Phase A bulk earthworks, and then to decrease with time as the bulk earthworks and dust generating activities are completed.

Parsons Brinckerhoff 17-31
17.3.3 Impacts summary
In relation to the assessment of the existing and proposed DNSDC site as a sensitive receiver, the following conservative approach was taken:
• Although the DNSDC is currently being moved to West Wattle Grove, impacts on the ‘existing’ DNSDC were assessed in its location on Moorebank Avenue opposite the Project site (as Receiver 33) for all scenarios (2015, 2028 and 2030), given that this site would contain commercial and industrial facilities under all future scenarios.
• In addition, the proposed new location of the DNSDC (Receiver 35 at West Wattle Grove) has also been assessed for Scenarios N3, C3, S3, N4, C4 and S4 (2028 and 2030).
Taking elevated background airborne PM concentrations into account, the maximum cumulative 24-hour average PM10 and PM2.5 concentrations at Receiver 33 exceed the applicable NSW EPA criteria and NEPM advisory reporting goals; however, the peak ambient concentrations are already above the goals due to the influence of extensive bushfire activity in late 2013. Review of the model predictions at all receptors with the daily varying ambient background concentrations (presented in Appendix C of Technical Paper 7 – Local Air Quality Impact Assessment) shows that no exceedance events would occur as a result of construction or operational emissions at the Project site.
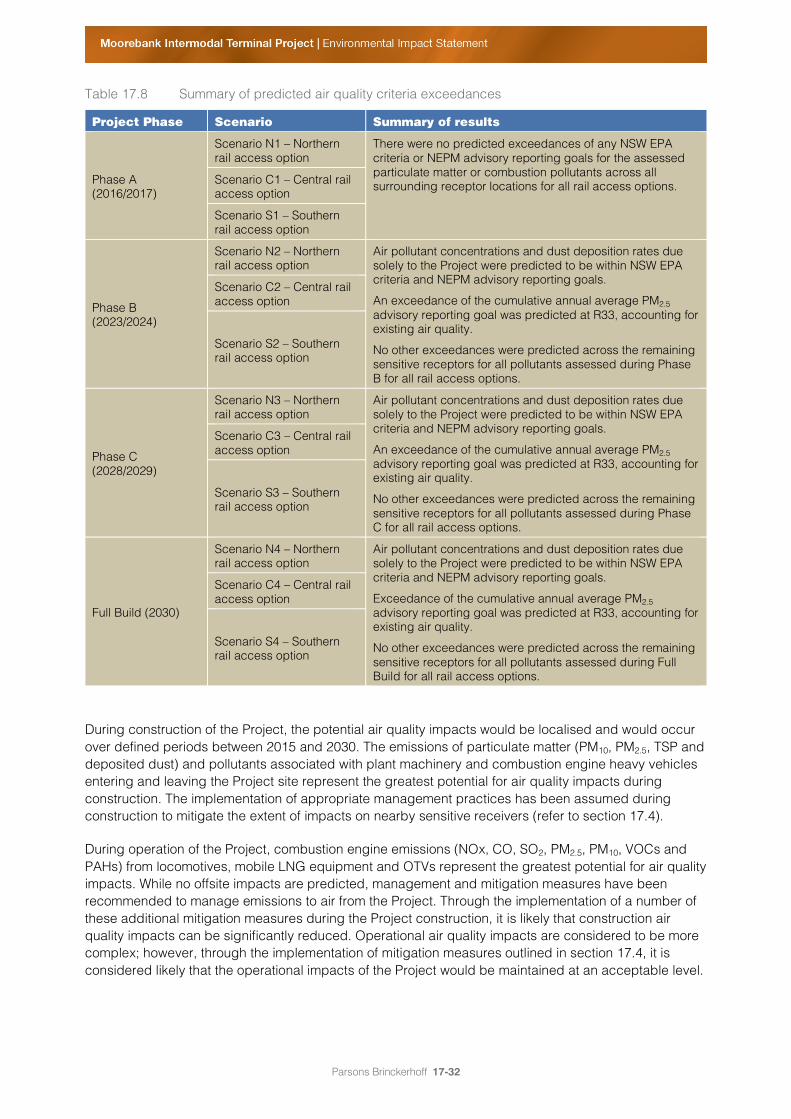
Table 17.8 presents a summary of all predicted exceedances at sensitive receivers. Incremental air pollutant concentrations and dust deposition rates associated with all modelled scenarios were predicted to be within NSW EPA criteria and NEPM advisory reporting goals.
Cumulative PM2.5 is predicted to exceed the annual average NEPM advisory reporting goal at Receiver 33 in Phase C and Full Build. As noted above, the DNSDC is being relocated to location R35 (with full relocation expected by end 2014). The five-year PM2.5 average concentration recorded at the OEH Liverpool station accounts for peak natural events such as dust storms and bushfires, and is notably higher than concentrations recorded during the same period at other locations in Sydney. The derived background concentration of 7.6 µg/m3 is very close to the advisory reporting goal of 8 µg/m3 and is the key contributing factor to the predicted cumulative exceedances, rather than the incremental concentrations (peak annual average PM2.5 concentration of 0.8 g/m3 predicted at receptor R1 during Phases B and C) attributable to the Project.
Based on the magnitude of incremental concentrations predicted for all pollutants assessed at all surrounding receptors, the likelihood of adverse impacts arising from the construction and operation of the Project in the surrounding environment is considered to be low.
Lead emissions were not assessed in the predictive model, as the sale of leaded petrol ceased in Australia in 2002 and no other known potential sources of lead emissions are anticipated.
Parsons Brinckerhoff 17-32
Table 17.8 Summary of predicted air quality criteria exceedances
Project Phase Scenario Summary of results
Phase A (2016/2017)
Scenario N1 – Northern rail access option
There were no predicted exceedances of any NSW EPA criteria or NEPM advisory reporting goals for the assessed particulate matter or combustion pollutants across all surrounding receptor locations for all rail access options. Scenario C1 – Central rail
access option
Scenario S1 – Southern rail access option
Phase B (2023/2024)
Scenario N2 – Northern rail access option
Air pollutant concentrations and dust deposition rates due solely to the Project were predicted to be within NSW EPA criteria and NEPM advisory reporting goals.
An exceedance of the cumulative annual average PM2.5 advisory reporting goal was predicted at R33, accounting for existing air quality.
No other exceedances were predicted across the remaining sensitive receptors for all pollutants assessed during Phase B for all rail access options.
Scenario C2 – Central rail access option
Scenario S2 – Southern rail access option
Phase C (2028/2029)
Scenario N3 – Northern rail access option
Air pollutant concentrations and dust deposition rates due solely to the Project were predicted to be within NSW EPA criteria and NEPM advisory reporting goals.
An exceedance of the cumulative annual average PM2.5 advisory reporting goal was predicted at R33, accounting for existing air quality.
No other exceedances were predicted across the remaining sensitive receptors for all pollutants assessed during Phase C for all rail access options.
Scenario C3 – Central rail access option
Scenario S3 – Southern rail access option
Full Build (2030)
Scenario N4 – Northern rail access option
Air pollutant concentrations and dust deposition rates due solely to the Project were predicted to be within NSW EPA criteria and NEPM advisory reporting goals.
Exceedance of the cumulative annual average PM2.5 advisory reporting goal was predicted at R33, accounting for existing air quality.
No other exceedances were predicted across the remaining sensitive receptors for all pollutants assessed during Full Build for all rail access options.
Scenario C4 – Central rail access option
Scenario S4 – Southern rail access option
During construction of the Project, the potential air quality impacts would be localised and would occur over defined periods between 2015 and 2030. The emissions of particulate matter (PM10, PM2.5, TSP and deposited dust) and pollutants associated with plant machinery and combustion engine heavy vehicles entering and leaving the Project site represent the greatest potential for air quality impacts during construction. The implementation of appropriate management practices has been assumed during construction to mitigate the extent of impacts on nearby sensitive receivers (refer to section 17.4).
During operation of the Project, combustion engine emissions (NOx, CO, SO2, PM2.5, PM10, VOCs and PAHs) from locomotives, mobile LNG equipment and OTVs represent the greatest potential for air quality impacts. While no offsite impacts are predicted, management and mitigation measures have been recommended to manage emissions to air from the Project. Through the implementation of a number of these additional mitigation measures during the Project construction, it is likely that construction air quality impacts can be significantly reduced. Operational air quality impacts are considered to be more complex; however, through the implementation of mitigation measures outlined in section 17.4, it is considered likely that the operational impacts of the Project would be maintained at an acceptable level.

Parsons Brinckerhoff 17-33
17.4 Management and mitigation
17.4.1 Early works and construction
The following mitigation measures and safeguards or equivalent are proposed during the Early Works and construction phases of the Project:
• A Dust Management Plan (DMP) would be prepared as part of the Construction Environmental Management Plan (CEMP).
• Dust minimisation measures would be developed and implemented before construction starts. The NSW Coal Mining Benchmarking Study: Measures to Prevent and/or Minimise Emissions of Particulate Matter from Coal Mining (OEH 2011) would be referenced for best practice measures for dust management.
• Methods for management of emissions would be incorporated into Project inductions, training and pre-start talks.
• Activities with the potential to cause significant emissions, such as material delivery and load out and bulk earthworks, would be identified in the CEMP. Work practices that minimise emissions during these activities would be investigated and applied where reasonable and feasible.
• A mechanism for raising and responding to complaints would be put in place for the duration of the construction phase.
• Vehicle movements would be limited to designated entries and exits, haulage routes and parking areas. Project site exits would be fitted with hardstand material, rumble grids or other appropriate measures to limit the amount of material transported offsite (where required).
• Worksite compounds and exposed areas would be screened to assist in capturing airborne particles and reduce potential entrainment of particles from areas susceptible to wind erosion.
• Dust would be visually monitored and, where necessary, the following measures would be implemented:
> Apply water (or alternative measures) to exposed surfaces that are generating dust. Surfaces may include any stockpiles, hardstand areas and other exposed surfaces (for example, recently graded areas). Regular watering would ensure that the soil is moist to achieve 50% control of dust emissions from scrapers, graders and dozers.
> Appropriately cover loads on trucks transporting material to and from the construction site. Securely fix tailgates of road transport trucks before loading and immediately after unloading.
> Prevent where possible, or remove, mud and dirt being tracked onto sealed road surfaces.
> Apply water at a rate of >2 litres per square metre per hour (L/m2/hr) to internal unsealed access roadways and work areas. Application rates would be related to atmospheric conditions (e.g. prolonged dry periods) and the intensity of construction operations. Paved roads would be regularly swept and watered when necessary.
• Dust generating activities (particularly clearing and excavating) would be avoided or minimised during dry and windy conditions.

Parsons Brinckerhoff 17-34
• Project site speed limits of 20 km per hour (km/hr) would be imposed on all construction vehicles at the Project site.
• Graders would be limited to a speed of 8 km/hr to reduce potential dust emissions.
• Material stockpiles would not exceed an area of 1 hectare (ha) and would be regularly watered to achieve 50% control of potential dust emissions.
• Exposed areas and stockpiles would be limited in area and duration. For example, vegetation stripping or grading would be staged where possible, unconsolidated stockpiles would be covered, or hydro mulch or other revegetation applied to stockpiles or surfaces left standing for extended periods.
• Revegetation or rehabilitation activities would proceed once construction activities are completed within a disturbed area.
• Construction plant and equipment would be well maintained and regularly serviced so that vehicular emissions remain within relevant air quality guidelines and standards.
• Excavation works in potentially contaminated soils would be managed to ensure that they are completed during optimal dispersive conditions to minimise odorous emissions.
• Emissions from trucks would be regulated in accordance with the requirements prescribed in the NEPM (Diesel Vehicle Emissions) (NEPC 2001).
• All construction vehicles would be tuned to not release excessive levels of smoke from the exhaust and would be compliant with OEH’s Smokey Vehicles Program under the Protection of the Environment and Operations Act 1997 (NSW) (POEO Act) and POEO Regulations (NSW) (2010).
• All on-road trucks would comply with the Euro V emission standards.
• All new off-road construction equipment would meet, at minimum, the US EPA Tier 3 emission standards for non-road diesel engines.
• Establishment of Action Response Levels (ARLs) for use with real-time dust management. These aid in the assessment of impact potential, and establish an early warning system during adverse trends, reducing complaint potential and non-compliance issues. An ARL trigger would be a defined measurement of elevated dust levels for a prolonged period.
17.4.2 During operation
The following mitigation measures are proposed to mitigate and manage operational local air quality impacts, and would include the principle of Best Available Control Techniques (BACT) to minimise emissions to atmosphere:
• An air quality management plan (AQMP) would be prepared for the operation of the Project.
• Project site traffic would be managed to ensure trucks do not queue along public roads adjacent to the Project site. This can be achieved through the implementation and enforcement of an idling limit (e.g. 1 hour) for trucks on site and at the troubled truck parking area.
• Investigate the possibility of reducing locomotives’ idling times on site.

Parsons Brinckerhoff 17-35
• Optimise the use of trucks capable of transporting multiple TEU containers simultaneously to achieve maximum efficiency on site and reduce air emissions.
• Emissions from any exhaust stacks would be regulated in accordance with the provisions of the POEO Act.
• Periodic extractive monitoring would be undertaken to demonstrate compliance with in-stack limits.
• Vehicles would be tuned to not release excessive levels of smoke from the exhaust and to be compliant with OEHs Smokey Vehicles Program under the POEO Act and POEO Regulations.
• A documented testing program conducted by relevant enforcement agencies would be implemented at regular intervals.
• A regular and documented maintenance and inspection program would be implemented for all equipment that enters the Project site.
• Onsite good housekeeping and raw material handling practices would be controlled through agreed protocols.
• Emissions from trucks would be regulated by the NEPM (Diesel Vehicle Emissions) (NEPC 2001).
• Emissions from locomotives would follow international standards, such as those provided for under United States legislation Final Rule: Control of Emissions of Air Pollution from Locomotives and Marine Compression-Ignition Engines Less Than 30 Liters per Cylinder (Final Rule) (US EPA 2012), and would meet the Tier 2+ or above emission standard for all new locomotives entering the Project site (no emission standards are available under the NSW or Federal legislative framework for locomotives).
• Emissions from shunting engines would follow international standards, such as those provided for under United States Final Rule legislation, and would meet the Tier 2+ or above emission standard. Older locomotives would be upgraded to meet Tier 1 or Tier 2+ emission standards where reasonable and feasible (no emission standards are available under the NSW or Federal legislative framework for shunting engines).
Cleaner fuel technology
Proposals to implement the use of cleaner fuels and technologies would significantly reduce emissions from onsite activities. These would be investigated at detailed design stage and may include:
• electrically powered refrigerated onsite containers;
• use of hybrid only cars (electric/LNG/CNG,LPG) on site;
Parsons Brinckerhoff 17-36
• considering the requirement for older diesel trucks be fitted with the latest emission reduction technology (e.g. retrofitting of particle filters, installation of catalytic convertors or replacement with newer less polluting diesel engines to ensure emissions requirements conform to the Australian Design Rule ADR80/03);
• requiring all on-road trucks to comply with the Euro V emission standards;
• requiring all new off-road construction equipment to meet, at minimum, the US EPA Tier 3 emission standards for non-road diesel engines (US EPA Tier 4 emission standard equipment should be adopted where available);
• considering the use of hybrid locomotives or cleaner fuels for locomotives (e.g. locomotives powered by batteries with a small diesel engine for recharging and for additional power, as currently used on the Burlington Northern Santa Fe railway, California, USA); and
• considering the use of fuel cells, LNG and electric powered locomotives.
Strategic planning and management
Strategic planning of the Project would benefit local air quality and increase efficiency, communications and onsite safety. The following proposals would be considered as part of an effective and integrated strategic management plan:
• investigation into the feasibility of increasing the fraction of container traffic that moves by rail;
• implementation of terminal appointment systems and appropriate time slots for Project site access for truck and rail deliveries, to avoid unnecessary onsite air emissions during peak periods;
• minimising the potential for fluctuating demand forecasts for equipment among carriers, railways and the terminal through effective communication;
• applying the latest information technologies, such as Intelligent Transportation Systems (ITS), to transportation operations for improved transportation efficiency and a reduced environmental impact; and
• considering the use of a virtual container yard to assist with incorporating onsite operational efficiencies to ensure air emissions are minimised.
Miscellaneous emissions
All other onsite sources (such as LNG, lubricant oils and cleaning chemicals) are considered minor and of minimal significance. Notwithstanding this, mitigation measures would be further investigated at detailed design stage as follows:
• All chemicals and fuels would be stored in sealed containers as per appropriate regulations and guidelines.
• Onsite storage of fuel would be kept to a minimum to minimise vapour emission levels.
• Unloading of fuels (diesel or liquefied natural gas) would be vented via return hoses that recirculate vapours from delivery to receiver.
Parsons Brinckerhoff 17-37
• Tanks would be fitted with a conservation vent (to prevent air inflow and vapour escape until a pre-set vacuum or pressure develops).
• Strategies to reduce the use of chemicals and fuels, in addition to using alternative fuel technologies as recommended in NSW Action for Air (DECCW 2009). Particular focus would be on those products with the potential to release high levels of air toxics.
Odour
Odour emissions associated with the sewage treatment plant would be controlled through the implementation of best management practice (BMP). The following mitigation measures and safeguards are recommended for the operational works:
• providing covering for inlet works;
• extraction of inlet works foul air gases to a soil bed filter for treatment; and
• contingencies for potential loss of aeration (e.g. backup generator for power supply and storage of lime for dosing to the process units, if anaerobic conditions occur).
17.4.3 Future monitoring
It is proposed that ambient air quality monitoring be undertaken as part of the Project’s construction phase and through to operation. This would include:
• onsite monthly dust deposition monitoring during construction, to measure dust fallout from the Project at boundary points and selected sensitive receiver locations and to compare concentrations with the air quality criteria;
• continuation of the existing Project monitoring (that records continuous measurements of NOx, PM10, PM2.5 and weather data) after the start of operations to ensure that the ambient air quality criteria are met. The existing station may need relocation based on site construction works and regulator recommendations; and
• review of the existing onsite meteorological monitoring station location to ensure compliance with relevant Australian Standard documentation.
No other ongoing dust or other air pollutant monitoring during the operation of the Project is recommended.

Parsons Brinckerhoff 17-38
17.5 Summary
The key aspects of the Local Air Quality Assessment are summarised below:
• During the Early Works phase of the Project, the potential air emissions and related local air quality impacts are predicted to be negligible, given the expected low magnitude of the earthworks and the short-term nature of construction activities.
• During the main construction phases (Phases A, B and C), the potential air quality impacts would be localised and would occur over defined periods between 2015 and 2030. Emissions of particulate matter (PM10, PM2.5, TSP and deposited dust) and pollutants associated with combustion engines and plant machinery represent the greatest potential for air quality impacts during these phases.
• During operation of the Project, combustion engine emissions (i.e. NOx, CO, SO2, PM2.5, PM10, VOCs and PAHs) from locomotives, mobile LNG equipment and heavy vehicles represent the greatest potential for air quality impacts.
• Incremental (Project-only) air pollutant concentrations and dust deposition rates associated with all modelled scenarios were predicted to be within NSW EPA criteria and NEPM advisory reporting goals.
• When existing elevated background airborne PM concentrations were considered (including extensive bushfire activity in late 2013), the maximum cumulative 24 -hour average PM10 and PM2.5 concentrations exceeded the applicable NSW EPA criteria and NEPM advisory reporting goals at one receptor (R33), located adjacent to the Project site on Moorebank Avenue. However, the peak ambient concentrations were already above the goals due to the influence of this bushfire activity. Importantly, the assessment predicted that no additional exceedance events would occur as a result of construction or operational emissions at the Project site.
• Overall, there is a low likelihood of adverse local air quality impacts in the surrounding environment arising from the construction and operation of the Project.
Table 17.9 provides a summary of local air quality impacts associated with the Project at Full Build, without mitigation, for each rail access option.
Table 17.9 Summary of air quality impacts at Full Build, without mitigation, for each rail access option
Impact IMT layout and associated rail access
connection option
Northern Central Southern
Incremental impacts (Project only)
Air pollutant concentrations and dust deposition rates that exceed NSW EPA criteria and NEPM advisory reporting goals.
- - -
Cumulative impacts (Project and background air quality)
Air pollutant concentrations and dust deposition rates that exceed NSW EPA criteria and NEPM advisory reporting goals for PM10 and PM2.5.
•¹ •¹ •¹
Air pollutant concentrations and dust deposition rates that exceed NSW EPA criteria and NEWP advisory reporting goals for all other pollutants.
- - -
Key: • = impact, - = no impact
Note 1: Exceedance only reported at one receptor. Peak ambient concentrations are already above the goals due to influence of bushfire activity in late 2013. No additional exceedance events are predicated as a result of the Project.

Parsons Brinckerhoff 17-39
Key measures proposed to manage and/or mitigate local air quality impacts include:
• implementation of dust and air quality management plans;
• during Early Works and construction — best practice measures for dust management, including screening and watering processes (e.g. of stockpiles/exposed surfaces), avoidance of dust generating activities during dry and windy conditions, and monitoring; and
• during operation — maintenance and inspection program for all equipment, adoption of cleaner fuel technology when feasible, and ongoing monitoring of air quality.