chapter 2 energy outlook of vietnam through 2005
TRANSCRIPT

25
Chapter 2 Energy Outlook of Vietnam through 2005
In Chapter 2, we will conduct fundamental analysis for formulation of the National Energy Master
Plan running various case studies using the Energy Database, the Energy Demand Forecasting Model
and the Energy Supply Optimization Model that were constructed for this study, and will examine
different forecast results on energy outlook and their implications under various socio-economic
development scenarios, effects of different energy policy options for securing energy supply, impacts
on environment and so on.
2.1 Procedure of Energy Outlook Formulation First of all, fundamental understanding and assumptions in conducting this study will be explained
such as the world energy situation, crude oil price trend, issues facing Vietnam as well as some
technical aspects such as composition of the analytical tools, major preconditions, setting of the
fundamental scenario and directions of case studies.
International Circumstance and Issue of Concerns on Energy As the world economy is growing steadily, many questions are raised whether we could continue
this trend into the future or not consistently securing sufficient energy supply and environment
protection. For example, IEA begins its World Energy Outlook 2006 with the following words:
“The world is facing twin energy-related threats: that of not having adequate and secure supplies of
energy at affordable prices and that of environmental harm caused by consuming too much of it”.
Source: Compiled from the BP Statistical Review of World Energy 2006
Figure 2.1-1 Asian Energy Consumption (excluding Middle East)
Looking to the recent world trend of energy that is the baseline of the above outlook, energy
0.0
0.5
1.0
1.5
2.0
2.5
3.0
3.5
1970 1975 1980 1985 1990 1995 2000 2005
Billion TOE
China
Korea
Japan
South Asia
SE Asia
Vietnam
70⇒90 90⇒05 70⇒05Share
(2005)
Japan 154% 121% 186% 16.0%Korea 631% 249% 1571% 6.8%China+Taiw 302% 225% 680% 51.0%SE Asia 308% 199% 613% 11.3%Vietnam 74% 518% 385% 0.9%South Asia 306% 203% 621% 14.0%

26
demand is increasing rapidly in the emerging countries such as China, India and Southeast Asian
countries, who are leading the world economic growth. During the five years from 2000 through
2005, the energy demand in Asia (excluding Japan and Korea) increased 25% while the world energy
consumption increased 14%. Among them, China recorded 60% increase in the energy consumption.
As its domestic oil production is nearing peak, China’s oil import increased outrageously to 127
million tons in 2005, overtaking South Korea. Energy consumption of Vietnam has also increased at
an annual average rate of over 11% since the 1990s, and its speed is accelerating recently. Despite
the fact, the absolute quantity of the Vietnamese energy consumption shares only 0.9% among Asian
countries. Though energy is a big issue for Vietnam, it is apparent that the matter should be
considered along with the world current.
Looking around the world, oil peaking and global climate change have become particular
objective of energy policy. However, Vietnam, currently being still low in its economic development
with less than 1/10 of energy consumption of developed countries, shall need a big amount of
incremental energy for its construction of the economy. Its per capita energy consumption would
increase along with economic development, as the international trend is against the increase of energy
consumption. While UNFCCC stipulates “common but differentiated responsibilities” of nations
toward the global warming, it is a very important policy issue for Vietnam how to accept and digest
such circumstance in the course of constructing the economy.
Since commencement of Doi Moi (economic Reform) policy in 1986, the Vietnamese economy was
put on a track of extraordinary high economic growth and the domestic energy consumption also
recorded rapid increase. Despite the fact, Vietnam steadily developed its indigenous energy
resources and realized energy self-sufficiency as a total balance. At present, however, its energy
demand, in particular the electricity demand is not satisfied and therefore it is highly possible that the
domestic energy demand may increase faster than past. On the other hand, its domestic energy
production is approaching the peak. As a result, Vietnam would change from an energy exporting to
an importing country. This suggests that energy issues of Vietnam will change its nature from those
confined within the country to those exposed to rough turbulence of the international market.
Then, anticipating internationalization of energy structure, what elements should we keep in mind in
formulating the energy policy? Energy is a global issue in the contemporary world and the major
points considered in energy discussions may be summarized as follows.
1) Assurance of social development under good coordination among 3S, namely, Economy, Energy
and Environment
2) Strengthening of 3S in energy, namely, Security, Sustainability and Stability
3) Rational energy use and energy conservation
4) Best mix of energy supply
Economic Development and Energy Conservation Long-term economic trend and energy conservation are the key elements to give great impacts on
the future energy trend of Vietnam. This study assumes the following fundamental understanding on
them.

27
Regarding the long-term economic outlook of Vietnam, the latest official plan is “The Five Year
Socio-economic Development Plan 2006-2010” and, for longer-term, there is an outlook “Economic
Development Forecast serving Study on Development for the period up to 2050” (hereinafter called as
“EDF2050”). This was used as the economic development scenario of the Sixth Power Development
Plan (PDP6), and hence could be considered as semi-official one. These projections foresee that the
long-term economic growth at over 8% will continue.
Figure 2.1-2 ASEAN and Economic Development of Vietnam
The recent rapid increase of FDI indicates that Vietnam has come out of the first stage preparing for
development and entered into the second stage for take-off. Globalization and marketization of the
economy have accelerated the inflow of FDI into Vietnam. Likewise, progress of tighter linkage and
unitization with neighboring countries, Asian developed countries like Japan and US and European
markets through accession to WTO would possibly accelerate economic growth of Vietnam. Transfer
of industries from neighboring countries is already progressing substantially in labor-intensive
industries as projected in EDF2050. However, the agriculture sector, which shared 20.9% of GDP
and 56.9% of the labor force in 2005, will continue to supply labor forces to manufacturing and
service industries for a long period.
From the above viewpoint, it may be appropriate to think that Vietnam will continue high economic
growth exceeding annual 8% in future, and hence we will adopt the socio-economic development
outlook of EDF2050 in this study for the Reference Case.
In the dream case that Vietnam would catch-up Thailand in aggregate GDP, its growth rate shall be
10.5%. Then, as the population of Vietnam is greater than Thailand, the per capita GDP of Vietnam
still remains at 73% ($3,705) of that of Thailand. The above discussion may suggest that the high
growth case for this study may be considered to be 9.5%, a half way between the dream case and the
Reference Case.
Then, while we can not avoid increase of energy consumption accompanying economic growth, it is
very important to consider Energy Efficiency and Conservation (EEC) as a measure to mitigate issues
of energy security and environment to be incurred. EEC is important in a sense that it is a measure to
0.0
1.0
2.0
3.0
4.0
5.0
0 50 100 150 200 250 300
GDP $Billion in 2000 price
2025
Malaysia in 2004
Thailand in 2004
Indonesia in 2004Philippines
Vietnam
Per Capita R-GDP in $1000
Small Population Economy
Big Population Economy
2015
2004
Reference Case growing at 8.4%

28
create “negative demand” and compares to discoveries of giant oil fields.
(Source) compiled from ADB “Key Indicators”
Figure 2.1-3 Vietnam Catching-up Thailand
From various observations, annual 1% energy conservation may be realized as a natural trend, while
nationwide promotion of EEC is required to enhance the energy conservation further. It is needless
to say that efforts in every sector are required to promote such program, while the role of economic
structure change is also large. In case of Vietnam, since the economy is going to expand 5 fold in the
coming 20 years, we need to appropriately set out the position of the energy efficiency and
conservation policy constructing the grand design of the future economic society.
Crude Oil Price Scenario On the future crude oil price trend, we set out for the “Reference Scenario” that, referring to studies
run by IEA and other research institutes, the average import crude oil price (FOB) of IEA countries for
the first ten months of 2007 ($65 per barrel) will continue through 2005 in real term. We also
examine scenarios such as “High Price Scenario” and “Super-High-Price Scenario” to examine what
situation would appear in Vietnam when the crude oil price rises and “Low Price Scenario” on the
other extreme.
We estimate the domestic energy prices based on each crude oil scenario. The domestic energy
prices will follow the trend of the international energy prices and keep the linkage in future. The
current domestic energy prices, except for petroleum products, remain at 1/2 or 1/3 of the international
market prices. Such low energy prices would hamper efficient use and lead to wasteful use of
energy. In order to promote reasonable development of domestic energy resources introducing
necessary technology and fund into the energy sector, it is required to move to a pricing system
following the international market. In this study, it is assumed that the domestic energy prices will
reach the international market price levels in 2015.
0.0
50.0
100.0
150.0
200.0
250.0
300.0
350.0
400.0
450.0
2005 2010 2015 2020 2025
Vietnam
Billion US$ (in 2000 prices)
Thailand growing at 4%
Development of Vietnam
Dream Case: 10.5%
High Case: 9.5%
Reference Case: 8.4%
Low Case : 7.5%
30% in 2005
387
326
264
204177
53
261
119106

29
(Unit: $/bbl)
Figure 2.1-4 Actual world average import price (FOB) and forecast by scenario
(Unit: $/ton) (Unit: $/MMBTU)
(Coal for Power Generation) (Associated Gas for Power Generation)
Figure 2.1-5 Domestic Energy Prices by Case
2.2 Composition of the Long-term Energy Model Analytical tools used in this study are composed of three blocks, namely, Energy Database, Demand
Forecasting Model and Supply Optimization Model. The energy database is designed applying the
IEA method as the standard. The database shall be operated independently from the analytical
models; the data compiled and aggregated in the database are used from time to time being copied to
these models.
The long-term energy model is divided into two blocks, the Demand Forecasting Model and the
Supply/Demand Optimization Model, in view of operational convenience, and adopts a one-way flow
method “from demand forecasting to supply optimization.” The first priority is given to how
-
20.0
40.0
60.0
80.0
100.0
120.0
1997
1999
2001
2003
2005
2007
2009
2011
2013
2015
2017
2019
2021
2023
2025
Reference
High price
Super high price
Low price$100/Bbl
$75/Bbl
$65/Bbl
$50/Bbl
-
20.0
40.0
60.0
80.0
100.0
1997
1999
2001
2003
2005
2007
2009
2011
2013
2015
2017
2019
2021
2023
2025
base
High price
Super high price
Low price
$74/Bbl
$62/Bbl
$57/Bbl
$47/Bbl
-
5.0
10.0
15.0
1997
1999
2001
2003
2005
2007
2009
2011
2013
2015
2017
2019
2021
2023
2025
base
High price
Super high price
Low price
$11.0/Bbl
$8.2/Bbl
$7.0/Bbl
$5.3/Bbl
30
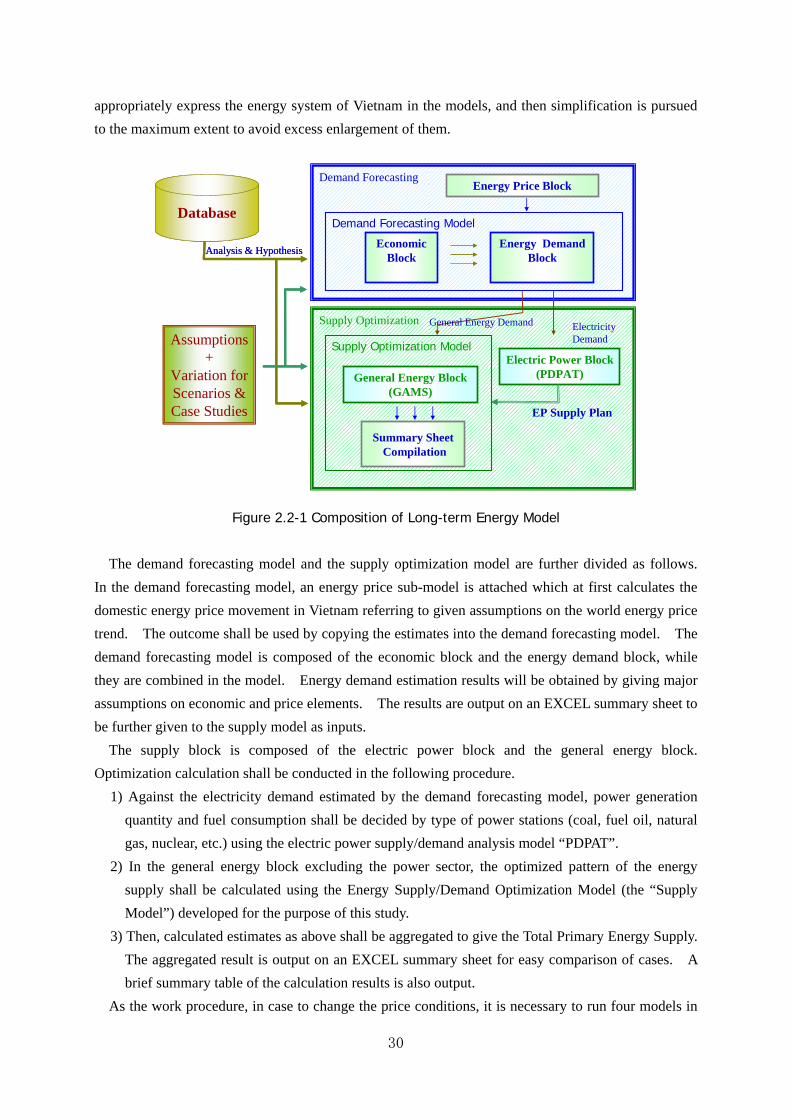
appropriately express the energy system of Vietnam in the models, and then simplification is pursued
to the maximum extent to avoid excess enlargement of them.
Figure 2.2-1 Composition of Long-term Energy Model
The demand forecasting model and the supply optimization model are further divided as follows.
In the demand forecasting model, an energy price sub-model is attached which at first calculates the
domestic energy price movement in Vietnam referring to given assumptions on the world energy price
trend. The outcome shall be used by copying the estimates into the demand forecasting model. The
demand forecasting model is composed of the economic block and the energy demand block, while
they are combined in the model. Energy demand estimation results will be obtained by giving major
assumptions on economic and price elements. The results are output on an EXCEL summary sheet to
be further given to the supply model as inputs.
The supply block is composed of the electric power block and the general energy block.
Optimization calculation shall be conducted in the following procedure.
1) Against the electricity demand estimated by the demand forecasting model, power generation
quantity and fuel consumption shall be decided by type of power stations (coal, fuel oil, natural
gas, nuclear, etc.) using the electric power supply/demand analysis model “PDPAT”.
2) In the general energy block excluding the power sector, the optimized pattern of the energy
supply shall be calculated using the Energy Supply/Demand Optimization Model (the “Supply
Model”) developed for the purpose of this study.
3) Then, calculated estimates as above shall be aggregated to give the Total Primary Energy Supply.
The aggregated result is output on an EXCEL summary sheet for easy comparison of cases. A
brief summary table of the calculation results is also output.
As the work procedure, in case to change the price conditions, it is necessary to run four models in
Supply Optimization
Demand ForecastingEnergy Price Block
Database
Economic Block
Energy Demand Block
Electric Power Block(PDPAT)General Energy Block
(GAMS)
Assumptions+
Variation forScenarios &Case Studies
Summary SheetCompilation
ElectricityDemand
General Energy Demand
EP Supply Plan
Analysis & Hypothesis
Demand Forecasting Model
Supply Optimization Model
31
0
20
40
60
80
100
120
140
160
180
1990 1995 2000 2005 2010 2015 2020 2025
Million toe
Demand BAU
Reference
Domestic Supply
Import Ratio 2015 2025BAU 4% 50%Reference -5% 31%
the order of 1) price model 2) demand forecasting model 3) PDPAT 4) energy supply model.
In case assumptions on the demand forecasting were changed, three models after 2) shall be run.
Likewise, in case of changing the conditions for the electric power sector, the last two models after 3)
and in case of changing energy supply conditions, the last model under 4) shall be run. As the case
study procedure is a little bit complicated like this, it is designed to improve the operational
convenience by dividing the model into several blocks.
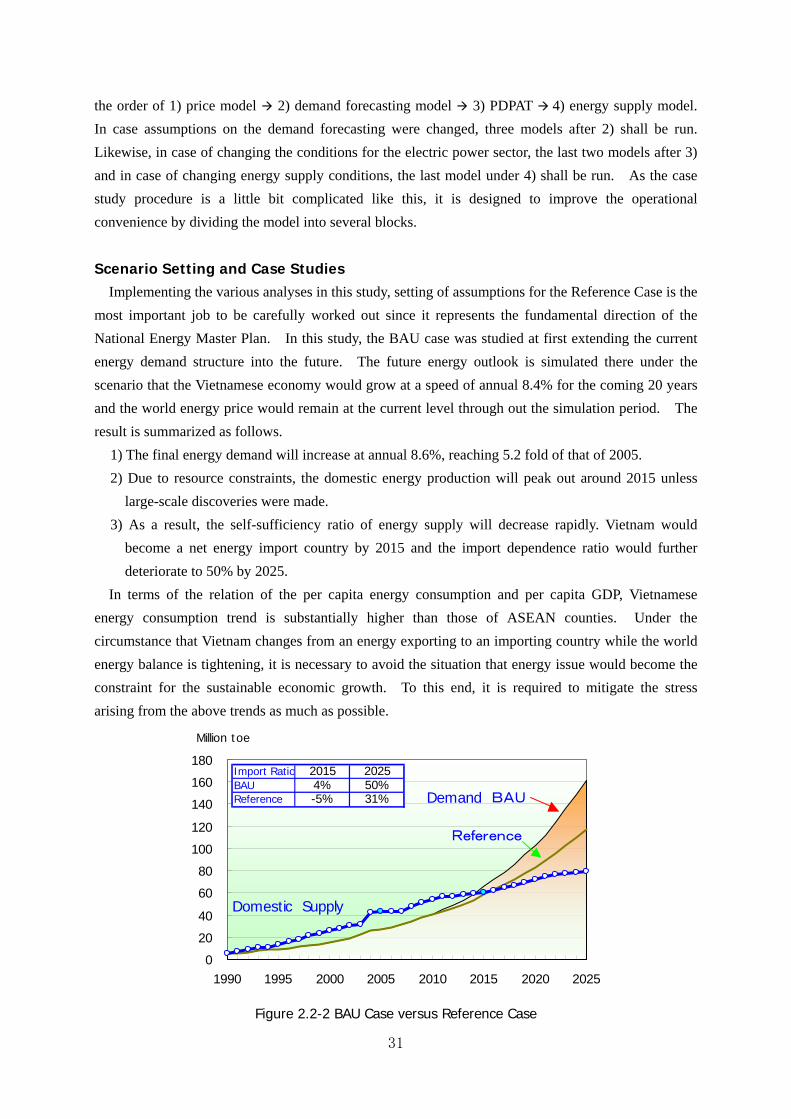
Scenario Setting and Case Studies Implementing the various analyses in this study, setting of assumptions for the Reference Case is the
most important job to be carefully worked out since it represents the fundamental direction of the
National Energy Master Plan. In this study, the BAU case was studied at first extending the current
energy demand structure into the future. The future energy outlook is simulated there under the
scenario that the Vietnamese economy would grow at a speed of annual 8.4% for the coming 20 years
and the world energy price would remain at the current level through out the simulation period. The
result is summarized as follows.
1) The final energy demand will increase at annual 8.6%, reaching 5.2 fold of that of 2005.
2) Due to resource constraints, the domestic energy production will peak out around 2015 unless
large-scale discoveries were made.
3) As a result, the self-sufficiency ratio of energy supply will decrease rapidly. Vietnam would
become a net energy import country by 2015 and the import dependence ratio would further
deteriorate to 50% by 2025.
In terms of the relation of the per capita energy consumption and per capita GDP, Vietnamese
energy consumption trend is substantially higher than those of ASEAN counties. Under the
circumstance that Vietnam changes from an energy exporting to an importing country while the world
energy balance is tightening, it is necessary to avoid the situation that energy issue would become the
constraint for the sustainable economic growth. To this end, it is required to mitigate the stress
arising from the above trends as much as possible.
Figure 2.2-2 BAU Case versus Reference Case

32
Based on a preliminary review as above, the Reference Case for this study is set out that, with
enhanced energy conservation, energy consumption would be decreased by 10% in 2015 and by
25-30% in 2025 from the BAU Case. In addition, as shown in the Figure 2.2-3, various case studies
are run regarding changes in economic growth rate, energy prices and supply side conditions.
Figure 2.2-3 Case Setting
2.3 Energy Demand Forecast In this section, outcome of the demand analysis using the Demand Forecasting Model will be
presented. Case setting and estimation results will be explained on the cases relating to changes of
the energy demand, that is, on the Reference Case, “High economic growth case” (Low economic
growth case as an additional study), “High energy price case” (Low energy price case as an additional
study) and “Super EEC case”, respectively.
Reference Case as the Standard Scenario With regard to the middle-long term economic outlook of Vietnam, we follow in this study the
projections made in the present Socio-Economic Development Plan and EDF2050 and assume that
annual 8.5% economic growth will continue through 2020 and this will slightly slow down to 8.0%
afterwards.
BAU CaseEconomic Growth…8.4%Crude Price….....$65/Bbl EEC…………………….1.0%
Reference CaseEconomic Growth…8.4%Crude Price….....$65/Bbl EEC……………………3-4%
Economic Growth Rate Economic Growth..6.0% & 11.0%Crude Price……….$65/Bbl EEC…………………….3-4%
Price ChangesEconomic Growth…7.4%-8.4%Crude Price….....$75 or $50/Bbl EEC…………………….3-4%
Other CasesSuper EEC (5-7%)MotorizationNuclear DevelopmentNatural Gas Development including LNG Import Coal ImportLPG Import Electricity TariffTax on Gasolineetc
To identify maximum impact of energy priceChanges
Under the assumptions for the BAU case, energy consumption of Vietnam in 2025 would exceed that of the present Thailand by 30% while the per capita GDP is slightly lower.Continued effort for efficient energy use and conservation is required to realize the sustainable development.
High Growth Case:Catch up Thailand by 2025 interms of aggregate GDP
Low Growth Case:Growth rate lowers to 5%after 2015
To examine effects of
different policy selections

33
Table 2.3-1 Economic growth outlook in the middle and long term
(Note) Please refer to Chapter 12 on estimation of the individual economic variables
Other major assumptions are as follows.
Table 2.3-2 Population growth rate
(Source) EDF2050
Table 2.3-3 Exchange Rate Outlook: VND vs. US$
(Source)EDF2050
Table 2.3-4 Petroleum product prices in Reference case
Major Factors to incur Demand Change Elements to give certain influence on demand trend are 1) economic growth rate, 2) energy price, 3)
progress of energy efficiency and conservation and 4) motor vehicle ownership.
1) Suppose that a dream case would be that the aggregate GDP catches up Thailand in 2025 (average
growth rate through 2025 will be 10.5%), the high growth case may be set at middle between the
dream case and the Reference case. Then, the average economic growth rate will be 9.5%.
The low growth case is set to be one percent lower than the Reference Case as follows.
2006-2020 2020-2025 Reference case 8.5 8.0
2011-2020 2021-2030 High growth case 8.5 8.0 Predicted case 7.2 7.0
This project
EDF2050
Unit 2010/2005 2015/2010 2020/2015 2025/2020
G.R. of Population % 1.1 1.1 1.1 0.8
2005 2010 2015 2020 2025
VND/US$ 15,916 16,856 17,947 19,609 21,168
Products Unit 2005 2010 2015 2020 2025IEA world export price US$/bbl 50 65 65 65 65Crude oil export price of Vietnam US$/bbl 54 70 70 70 70Coal FOB $/ton 20 38 57 57 57Asian LNG CIF $/MMBTU 6.4 7.5 7.5 7.5 7.5Natural Gas (Domestic price) $/MMBTU 3.3 5.1 7.0 7.0 7.0Gasoline retail price Dong/liter 8,933 11,885 13,010 13,820 14,257Kerosene retail price Dong/liter 6,300 11,266 12,348 13,126 13,547Diesel retail price Dong/liter 6,500 10,897 11,943 12,696 13,102Fuel oil price in Vietnam Dong/liter 4,633 6,761 7,410 7,877 8,129LPG price in Vietnam Dong/kg 13,800 20,484 22,451 23,866 24,630Electricity for Agriculture use Dn/KWh 660 1,012 1,118 1,236 1,365Electricity for Residential use Dn/KWh 695 1,065 1,177 1,301 1,437Electricity for Industry use Dn/KWh 829 1,271 1,405 1,553 1,716Electricity for Commercial use Dn/KWh 1,359 2,083 2,302 2,544 2,811

34
Table 2.3-5 Economic Growth Rates for Case Study
2) With regard to energy price, we set the High Price Case as the world crude oil price soars up to
$75 per barrel. Prices of petroleum products and natural gas will follow this trend. Since coal
is endowed widely and affluently worldwide, its supply would increase in response to demand
increase and therefore its price increase may be slower, at a half pace of crude oil.
3) Two cases will be examined on EE&C, namely, the BAU Case where energy conservation may
progress at a speed of the current trend, and the Reference Case where the main industries will make
substantial efforts on energy conservation strongly backed by the Government. Considering the time
lag for the effect of energy conservation efforts to materialize, the study period is divided into three
steps as below.
Step 1: Preparation and Trial
Step 2: Partial implementation to the energy users selected from each sector
Step 3: Full scale implementation
4) Motorbikes are used widely in Vietnam as popular transportation vehicle with 19 million units
registered in 2005. They are owned one for one household already, though its sale is running at
a high level. On the other hand, the number of four-wheel-vehicles is only 577,000, among
which passenger cars were only 195,000 units in 2005. However, as income level improves, it
is possible that the passenger car ownership would rapidly increase as we have seen in other
Asian countries, triggering abrupt increase of gasoline and diesel consumption at certain timing.
Energy demand in the Reference Case In Vietnam, it is considered that modernization of energy will progress in Manufacturing,
Commercial and Services, and Residential sectors. In these sectors, use of non-commercial energies
will decrease, while the demand of substituting energies such as LPG and electricity will increase
rapidly. In the transportation sector, diesel gas oil demand for automobile will increase greatly.
However, as the prevalence of motorbike nears to its peak while four-wheeled passenger car is yet
slow to increase, growth of gasoline demand would be rather moderate. On the other hand, reflecting
increase of freight transport by motor vehicles, the diesel gas oil demand is expected to grow fast.
Energy conservation rate is set at annual 1%for the BAU Case, as generally expected, and at 3-4%
for the Reference Case where EEC efforts should be strengthened. In the BAU Case, the current high
energy elasticity to GDP (1.6 in 2005) is expected to lower to 1.2 by 2025, a moderate level observed
Years High Case Reference Case Low Case2005 8.4 8.4 8.42006 8.5 8.5 8.52007 8.5 8.5 8.52008 9.5 8.5 8.52009 9.5 8.5 8.505-10 8.9 8.5 8.510-15 9.5 8.5 7.815-20 9.5 8.5 7.020-25 9.5 8.0 6.505-25 9.4 8.4 7.4

35
in neighboring countries. However the per capita electricity consumption is still extremely high
compared to neighboring ASEAN countries. The past and current energy supply system in Vietnam
excessively depends on electricity, and this system would not change much. Though the current
power shortage is serious, it is necessary to examine carefully whether the high energy elasticity and
electricity dependence would continue to the future or not.
In the Reference Case, the final energy demand will be lower than BAU case by 9% for 2015 and
23% for 2025, and the energy elasticity in the scenario would become 0.9 in 2025 near to the value
generally seen in other developing countries.
Table 2.3-6 Energy Demand Outlook in Reference Case
(Note) Final Energy Demand does not include energy consumption in Transformation sectors and Power stations.
Energy Demand Trend by Sector
1) Agriculture Sector The final energy demand in the Agriculture sector increases from 395 ktoe in 2005 to 833 ktoe in
2015 and 1,163 ktoe in 2025, and the annual average growth rate will be 3.6% per year from 2005 to
2025. The average growth rates are Coal: 0.9%, Oil products: 3.0%, Gas: 0% and Electricity: 8.0%;
growth of the electricity demand is significantly high in this sector.
(unit: kTOE)
Figure 2.3-1 Final Energy Demand in Agriculture sector
2) Light Industry Sector The Light industry sector is the main industry that shall lead the future Vietnamese economy, and
thus its energy demand will show the highest growth among sectors. The final energy demand of the
FInal Energy Deamand in Agriculture
0
100
200
300
400
500
600
700
2005 2010 2015 2020 2025
KTO
E
Power
Coal
Gasoline
Diesel
Fuel oil
2005 2010 2015 2020 2025 25/05Power demand Reference Case 46 86 132 203 293 9.8 (TWh) BAU Case 46 87 148 252 400 11.6
Gap% 0% -2% -11% -19% -27%Elasticity 2.0 1.6 1.1 1.1 0.9
Final energy demand Reference Case 23 33 47 67 91 7.2(MTOE) BAU Case 23 34 51 80 118 8.6
Gap% 0% -2% -9% -16% -23%Elasticity 1.6 1.0 0.8 0.9 0.9

36
sector is forecast to increase from 8,800ktoe in 2005 (including electricity demand and
non-commercial energy) to 17,600ktoe in 2015 and 39,800ktoe in 2025. The demand elasticity to the
sector GDP is estimated at a relatively low level of 0.52 for the period from 2005 to 2025 with the
average growth rate at 7.9%.
(Unit :kTOE)
Figure 2.3-2 Final Energy Demand in Light Industry Sector
In the Light industry sector, a special attention should be paid to LPG, a kind of petroleum products,
which has recorded an abrupt growth of 38% per year in the last 5 years. The high growth rate of
LPG has started since 1999 in accordance with the growth of the light industry; LPG is used in
production lines and welfare facilities at these factories.
Since the domestic supply of LPG is limited in Vietnam, most of the LPG must be imported in
future. However, the international LPG market is quite unstable and its price is vulnerable.
Therefore, it is better to consider that the LPG supply would be limited at a certain level, and that a
best mix with other substituting energy sources such as gas, coal and oil products should be studied
seriously.
3) Heavy Industry Sector The final energy demand in the heavy industry sector is forecast to increase from 4,900 ktoe
(including electricity demand) in 2005 to 9,000 ktoe in 2015 and 13,300 ktoe.
(Unit:kTOE)
Figure 2.3-3 Final Energy Demand in Heavy Industry Sector
Final Demand in Manufacturing (Light)
0
2,000
4,000
6,000
8,000
10,000
12,000
2005 2010 2015 2020 2025
kTO
E
Power
Coal
LPG
Oil Products
Natural gas
Noncommercial
FInal Energy Demand in Mabufacturing (Heavy)
0
2000
4000
6000
8000
10000
2005 2010 2015 2020 2025
kTO
E
Power
Coal
Diesel
Fuel oil
Natural gas
37
0
5
10
1520
25
30
35
40
1990 1995 2000 2005 2010 2015 2020 20250
500
1000
1500
2000
2500
3000
3500
4000
Motorbike (<--)
Passenger Car
BusTruck
Motorbike Million Units Others Thousand Units
The growth of the heavy industry sector may remain relatively moderate in Vietnam as the
government aims at construction of a less energy intensive economic structure. The average growth
rate of the final energy demand in the sector will be 5.1% per year from 2005 to 2025: growth rates by
energy are Coal: 4.9%, Oil products: 5.1%, Gas: 4.8%, electricity: 7.1%. The growth rate of
electricity is comparatively high in this sector. Likewise the light industry sector, natural gas has a
possibility to grow faster pending development of infrastructure.
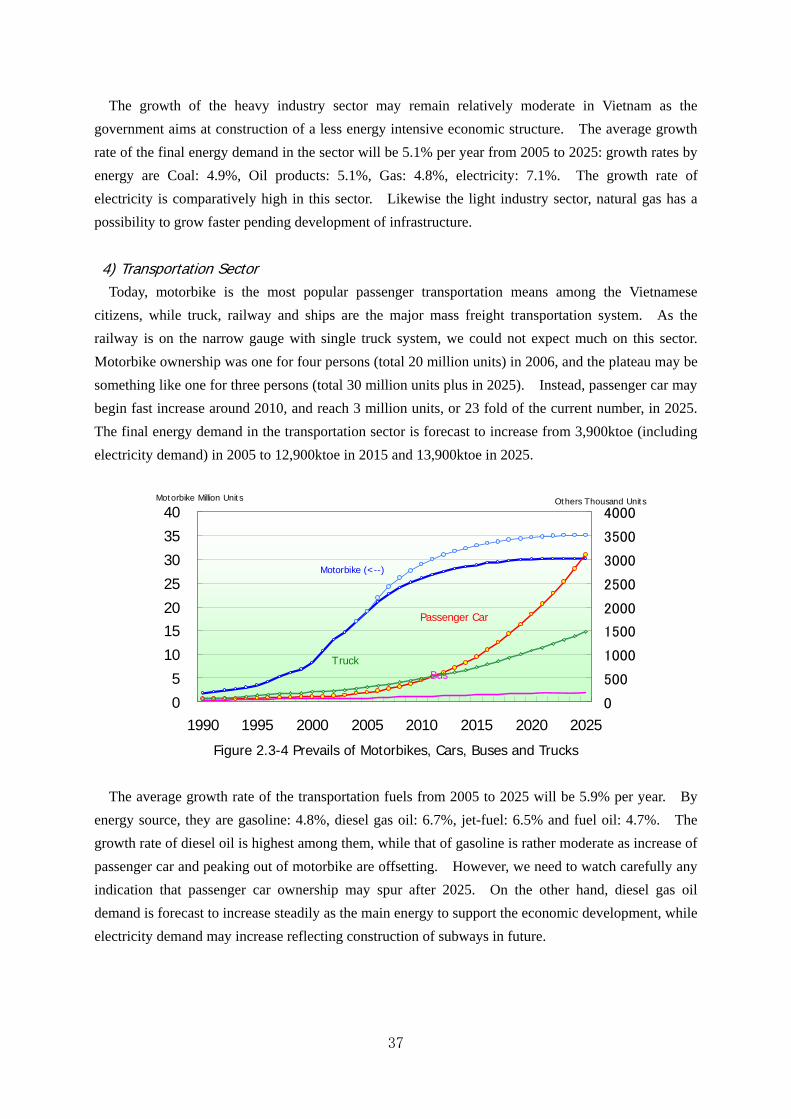
4) Transportation Sector Today, motorbike is the most popular passenger transportation means among the Vietnamese
citizens, while truck, railway and ships are the major mass freight transportation system. As the
railway is on the narrow gauge with single truck system, we could not expect much on this sector.
Motorbike ownership was one for four persons (total 20 million units) in 2006, and the plateau may be
something like one for three persons (total 30 million units plus in 2025). Instead, passenger car may
begin fast increase around 2010, and reach 3 million units, or 23 fold of the current number, in 2025.
The final energy demand in the transportation sector is forecast to increase from 3,900ktoe (including
electricity demand) in 2005 to 12,900ktoe in 2015 and 13,900ktoe in 2025.
Figure 2.3-4 Prevails of Motorbikes, Cars, Buses and Trucks
The average growth rate of the transportation fuels from 2005 to 2025 will be 5.9% per year. By
energy source, they are gasoline: 4.8%, diesel gas oil: 6.7%, jet-fuel: 6.5% and fuel oil: 4.7%. The
growth rate of diesel oil is highest among them, while that of gasoline is rather moderate as increase of
passenger car and peaking out of motorbike are offsetting. However, we need to watch carefully any
indication that passenger car ownership may spur after 2025. On the other hand, diesel gas oil
demand is forecast to increase steadily as the main energy to support the economic development, while
electricity demand may increase reflecting construction of subways in future.

38
(Unit:kTOE)
Figure 2.3-5 Final Energy Demand in Transportation Sector
5) Commercial Sector Final energy demand in the Commercial sector is forecast to increase from 1,300 ktoe (including
electricity demand) in 2005 to 2,400 ktoe in 2015 and 3,900 ktoe in 2025. The average growth rate
of the final energy demand will be 5.5% per year from 2005 to 2025. The growth rates of the final
demand by energy source are coal: 1.92%, LPG: 5.7%, oil products (kerosene, gas oil and fuel oil):
3.6% and electricity: 11.3%. The growth rate of electricity demand is highest.
(Unit:kTOE)
Figure 2.3-6 Final Energy Demand in Commercial Sector
Specific feature of the Commercial sector for the last 5 years is the high growth of LPG increasing
at 16% per annum, followed by electricity demand at 12%. Consumption of fuel oil and kerosene
has decreased in the same term, being replaced with LPG. Likewise in the light industry sector,
demand for LPG, which is clean and easy to use, will increase greatly. It is necessary to investigate
what kind of energy should be selected and how they should be supplied to such sector.
6) Residential Sector The final energy demand in the Residential sector is forecast to increase from 14,900 ktoe to 18,400
ktoe and 23,700 ktoe in 2025. The average growth rate of the final energy demand in the sector will
Final Demand in Transportation
0
2,000
4,000
6,000
8,000
10,000
12,000
14,000
2005 2010 2015 2020 2025
kTOE
Power
Gasoline
Jetfuel
Diesel
Fuel oil
Final Energy Demand in Commercial
0200400600800
1,0001,2001,4001,6001,800
2005 2010 2015 2020 2025
kTOE
Power
Coal demand
LPG demand
Oil products

39
be 2.3% per year from 2005 to 2025. Growth rates of the final demand by energy source are coal:
minus 2.3%, LPG: 10.4%, oil products (kerosene, gas oil and fuel oil): 3.8%, electricity: 9.8% and
non- commercial energy: minus 1.3%.
(Unit:kTOE)
Figure 2.3-7 Final Energy Demand in Residential Sector
The significant issue in the Residential sector is very high growth of electricity and oil products,
especially LPG. Supported by strong GDP growth, demands for electricity (mainly for refrigerator
and air conditioner) and LPG (mainly for cocking) are increasing rapidly reflecting increase of
municipal workers and improvement of their life styles in recent years. On the other hand,
non-commercial energies like woods and charcoal are decreasing as the rural population declines and
kitchen style in municipal residences are changed.
Petroleum Product Demand Table 2.3-7 Petroleum Products Demand Outlook
1) LPG LPG is consumed in the manufacturing, commercial and household sectors. As introduction of
natural gas is not transparent at present, extraordinary demand increase is expected for LPG compared
to other petroleum products. As the national average demand increase is expected at annual 12.6%,
Final demand in Residential
0
2,000
4,000
6,000
8,000
10,000
12,000
14,000
2005 2010 2015 2020 2025
kTO
E
Power
Coal
LPG
Oil products
Non-commercial
Products 2005 2010 2015 2020 2025 2005 2015 2025 15/05 25/15
LPG 963 1,971 3,641 4,342 4,418 8.3 16.1 10.1 14.2 2.0
LPG Substituted 0 0 0 2,133 5,937 0.0 0.0 13.6
Gasoline 2,687 3,697 4,516 5,491 6,657 23.2 19.9 15.2 5.3 4.0
Kerosene 332 342 373 423 511 2.9 1.6 1.2 1.2 3.2
Jetfuel 534 736 1,031 1,415 1,872 4.6 4.5 4.3 6.8 6.2
Diesel 5,162 7,456 10,294 14,089 18,301 44.5 45.4 41.8 7.1 5.9
for General 5,149 7,456 10,294 14,089 18,301 44.4 45.4 41.8 7.2 5.9
for Power 13 0 0 0 0 0.1 0.0 0.0
Fuel oil 2,214 2,096 2,807 4,329 6,090 19.1 12.4 13.9 2.4 8.1
for General 1,616 2,020 2,742 3,939 5,295 13.9 12.1 12.1 5.4 6.8
for Power 598 76 65 390 795 5.2 0.3 1.8 -19.9 28.5
Total Oil demand 11,598 16,298 22,662 32,223 43,786 100.0 100.0 100.0 6.9 6.8
40
major demand sectors will be Light manufacturing: 15.3%, Household: 10.4% and Commercial sector:
5.7%. The potential demand of LPG is estimated to increase from the actual record of 1,000 ktoe in
2005 to 10,000 ktoe in 2025, indicating that serious supply problem would be incurred.
2) Gasoline Gasoline is mainly consumed by motorbikes and other motor vehicles, while certain quantity is also
used for driving small boats in Vietnam. According to the current classification, gasoline for small
boats is classified for the agriculture and fishery sector, and gasoline for motorbike and motor vehicles
for the transportation sector. However, the consumption in the transportation sector is
overwhelmingly big. Thus, the overall growth rate of annual 4.6% is very close to the demand
growth for motorbike and passenger car at 4.7%. Gasoline demand is projected to grow from 2,700
ktoe in 2005 to 6,700 ktoe in 2025 by 2.5 times, and 97% of which will be for motorbike and cars.
3) Kerosene Kerosene including jet fuel is used by aviation industry, light manufacturing sector as well as
commercial and residential sectors. Among them jet fuel demand shows 6.5% growth reflecting
internationalization and vigorous domestic economic activities. Kerosene may be extensively
consumed in the manufacturing sector as well, showing 6.8% annual growth during the projection
period. On the other hand consumption in the commercial and residential sectors may be replaced by
electricity and LPG, and consumption growth in these sectors may remain modest at 1.6% and 2.3%,
respectively. The total kerosene consumption is estimated to increase from 900 ktoe in 2005 to 2,400
ktoe in 2025 by 2.8 times.
4) Diesel Gas oil As diesel gas oil is widely used in transportation, manufacturing, agriculture, commercial and
residential sectors, the consumption in the transportation sector shares big amount. Since most of the
consumption in the manufacturing sector may be used for transportation of own cargos, diesel gas oil
may be deemed as mostly for transportation use. Consumption in the power sector is decreasing and
may be limited for use at independent local diesel generators in future. Demand in manufacturing
and transportation sectors will be large and their demands are estimated to increase at annual 8.0% and
6.5%, respectively, between 2005 and 2025. Consumption in residential and commercial sectors will
be also active to grow at 5.9% and 4.3%, respectively. The total diesel gas oil demand will increase
from 5,100 ktoe in 2005 to 18,000 ktoe in 2025 by 3.6 times.
5) Fuel Oil Fuel oil is widely used in manufacturing, electric power, transportation, commercial and residential
sectors. In particular, demand in manufacturing and power sectors are large, sharing 54% and 28%,
respectively, followed by transportation sector at 12%. These three are the major demand sectors,
while the aggregate share of agriculture, commercial and residential sectors is small at 7%. The same
tendency continues through 2025, and the demand composition then will be manufacturing 65%,
electric power 22% and transportation 9%. Average growth rates for 2005–2025 will be
manufacturing 6.7%, transportation 4.7% and electric power 4.3%; fuel oil consumption is estimated
to grow accompanying high growth of the manufacturing sector.
41
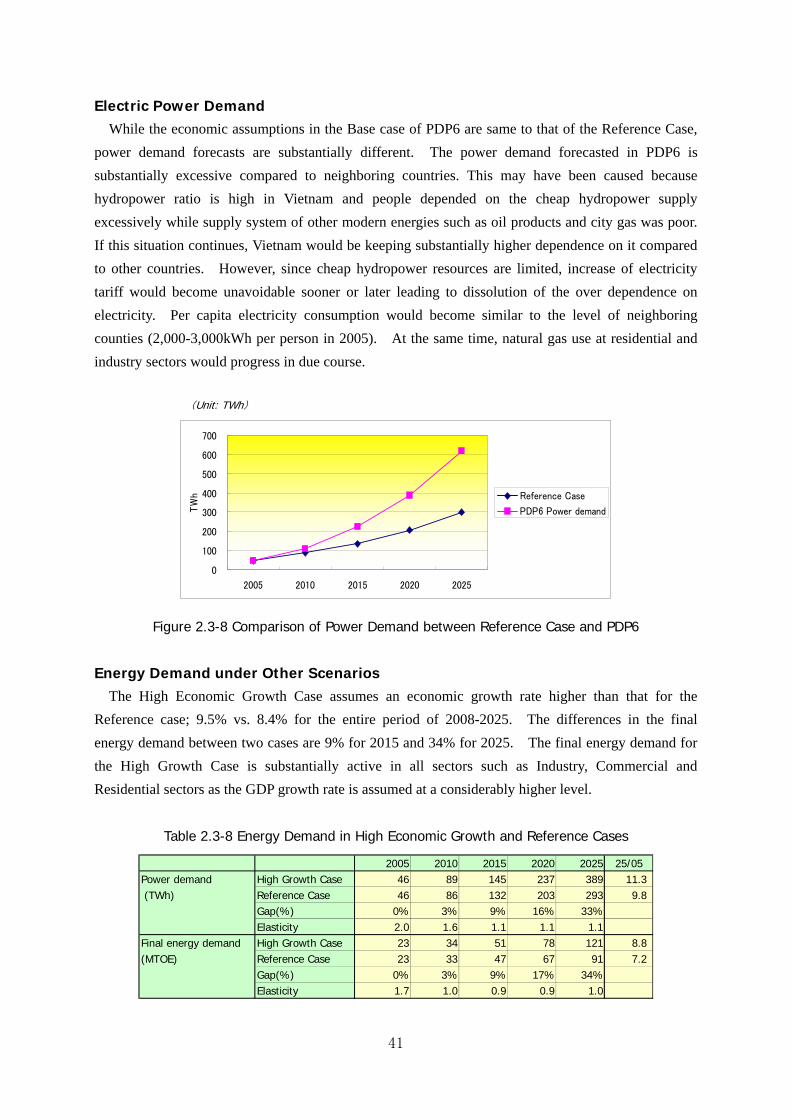
Electric Power Demand While the economic assumptions in the Base case of PDP6 are same to that of the Reference Case,
power demand forecasts are substantially different. The power demand forecasted in PDP6 is
substantially excessive compared to neighboring countries. This may have been caused because
hydropower ratio is high in Vietnam and people depended on the cheap hydropower supply
excessively while supply system of other modern energies such as oil products and city gas was poor.
If this situation continues, Vietnam would be keeping substantially higher dependence on it compared
to other countries. However, since cheap hydropower resources are limited, increase of electricity
tariff would become unavoidable sooner or later leading to dissolution of the over dependence on
electricity. Per capita electricity consumption would become similar to the level of neighboring
counties (2,000-3,000kWh per person in 2005). At the same time, natural gas use at residential and
industry sectors would progress in due course.
(Unit: TWh)
Figure 2.3-8 Comparison of Power Demand between Reference Case and PDP6
Energy Demand under Other Scenarios The High Economic Growth Case assumes an economic growth rate higher than that for the
Reference case; 9.5% vs. 8.4% for the entire period of 2008-2025. The differences in the final
energy demand between two cases are 9% for 2015 and 34% for 2025. The final energy demand for
the High Growth Case is substantially active in all sectors such as Industry, Commercial and
Residential sectors as the GDP growth rate is assumed at a considerably higher level.
Table 2.3-8 Energy Demand in High Economic Growth and Reference Cases
0
100
200
300
400
500
600
700
2005 2010 2015 2020 2025
TW
h Reference Case
PDP6 Power demand
2005 2010 2015 2020 2025 25/05Power demand High Growth Case 46 89 145 237 389 11.3 (TWh) Reference Case 46 86 132 203 293 9.8
Gap(%) 0% 3% 9% 16% 33%Elasticity 2.0 1.6 1.1 1.1 1.1
Final energy demand High Growth Case 23 34 51 78 121 8.8(MTOE) Reference Case 23 33 47 67 91 7.2
Gap(%) 0% 3% 9% 17% 34%Elasticity 1.7 1.0 0.9 0.9 1.0

42
As a reference, the Low Economic Growth Case is set as shown below. The final energy demand
in the Low Growth Case is 17% lower than the Reference case for 2015 and 41% for 2025. Power
demand is 19% lower for 2015 and 44% lower for 2025. In contrast to the high growth case, the
conceivable lowest case is calculated here. As its probability may be low, it may be thought as
criteria for the floor value. In such a case, it is important to refrain from excessive investment and try
to establish an efficient energy system.
Table 2.3-9 Low Economic Growth Case and Reference Cases
In the High Energy Price Case, we examine a scenario that energy prices increase, economic
activity is depressed by the high energy prices, and economic growth rate fall 0.5% lower from the
Reference Case.
Table 2.3-10 High Energy price Case and Reference case
(Note) Final energy demand does not include energies consumed in Transformation sector and power sector
Summary of Implications
1) Energy demand increase in the manufacturing and the household sectors The final energy demand is forecast to increase at annual 8.1% in Manufacturing sector and 7.2% in
Residential sector, uplifting the nation’s average demand increase of annual 7.2%. In the Reference
Case, energy conservation is scheduled to progress at 2% per year faster than the BAU Case.
Suppose this target were achieved, demand increase in manufacturing and residential sectors would
still be steep as above. In view of the domestic and world energy supply tightening in future, the
government is required to seriously consider promotion of energy conservation.
2) Rapid increase of LPG demand Potential demand for LPG is forecast to increase substantially in Manufacturing, Commercial and
Residential sectors. However, since domestic as well as international LPG supply is not abundant, it
2005 2010 2015 2020 2025 25/05Power demand Low Growth 46 86 126 176 233 8.5 (TWh) Reference 46 86 132 203 293 9.8
Gap(%) 0% -4% -19% -35% -44%Elasticity 2.0 1.6 0.9 0.8 0.9
Final energy demand Low Growth 23 33 44 57 71 5.9(MTOE) Reference 23 33 47 67 91 7.2
Gap(%) 0% -3% -17% -33% -41%Elasticity 1.7 1.0 0.6 0.6 0.7
2005 2010 2015 2020 2025 25/05Power demand High Price Case 46 83 124 186 261 9.1 (TWh) Reference Case 46 86 132 203 293 9.8
Gap(%) 0% -3% -6% -9% -11%Elasticity 2.0 1.6 1.1 1.0 0.9
Final energy demand High Price Case 23 32 44 61 80 6.5(MTOE) Reference Case 23 33 47 67 91 7.2
Gap(%) 0% -4% -6% -9% -12%Elasticity 1.7 0.9 0.8 0.8 0.8

43
is inevitable to face supply shortage if the demand continues to increase as projected in the Reference
Case, at annual 12% between 2005 and 2025. In many countries, natural gas is supplied in place of
or in addition to LPG as fuel for manufacturing, commercial and residential sectors. However,
construction of natural gas pipeline and delivery network requires long lead time and huge investment.
In Vietnam, it is necessary to study soonest possible on its future design toward creation of multi-mode
gas delivery system suitable for the geography.
3) Increase of motor vehicles and gasoline and diesel oil demand Motorbike is widely used in Vietnam as important transport measure of citizens. Although car
ownership is curbed under the national policy, those new type cars like INOVA of Toyota (7 seater)
with tax benefit are showing explosive sale. As passenger cars of 1,500 –2,000 cc class consume
ten-fold more gasoline compared with motorbike, it is inevitable that demand for gasoline and diesel
gas oil will increase rapidly as car ownership increases.
Once motor vehicle upsurge begins, serious traffic congestions may occur in big cities like Hanoi
and HCMC due to narrow and complicated road system. It is well known from experiences of Japan
and other countries that traffic congestion also causes air pollution and gives serious impact on the
health of citizens along the roads. In addition to securing stable supply of motor fuel, construction of
rational transport system and improvement of gasoline and diesel gas oil qualities are among the
important issues to be tackled with.
2.4 Energy Supply Analysis In this section, we analyze changes in energy supply pattern corresponding to different demand
forecasts and supply conditions. On the supply side, case studies are made relating to those with
greater impact such as nuclear power, natural gas, advancement of second and third refineries, increase
of renewable energy supply, restriction on CO2 emission, etc.
Assumptions on Energy Supply Conditions
1) Electric Power Sector Power resource composition of each case is set based on the annual development plan made by IE
following the Power Development Master Plan. Nuclear power plant will start operation in 2020 and
the generating capacity will reach 4000MW in 2025.
2) Coal Sector Domestic coal production capacity is set at 67.5 million tons at maximum in 2025 based on the
outlook of coal production projected in “Sustainable Development Strategy of Coal Industry” released
by VINACOMIN in May 2007. Among domestic coal, high quality coal will be exported if
beneficial in price, and any supply deficit against domestic demand will be imported.
3) Oil and natural Gas Sector Vietnamese oil and gas production forecast are quoted from the information presented at the IEA
workshop entitled as “Oil Security and National Emergency Preparedness” held in Bangkok,
September 2007. Oil production is anticipated to decrease gradually till around 2010, then, the
300,000 barrels per day level will be maintained up to 2025, i.e., 320,000 BD from 2015 to 2020,

44
300,000 BD for 2025, but this would require substantial efforts. On natural gas, already discovered
new fields will be developed and production will increase to 15 billion cubic meters per year in 2015,
and 16 billion cubic meters in 2025, from the current level of 7 billion cubic meters.
(Sourse) Tran Huu Truong Son, Ministry of Industry and Trade, Vietnam,
“VIETNAM OIL SECURITY POLICIES”, Oil Security and National Emergency Preparedness、 IEA, Bangkok: 17-18 September 2007
Figure 2.4-1 Crude oil and gas Production Past and Forecast
In the downstream sector, the first refinery now under construction in Dung Quat will come into
operation in 2009. At first, the feedstock is scheduled 100% with domestic crude oil, though 15%
will be shifted from 2020 to imported high-sulfur crude that is the maximum acceptable design limit.
The second refinery scheduled on stream in 2015 is planned to receive imported crude oil for 50% of
the feedstock from starting. In addition, strategic oil stockpiling will start from 2010 storing
imported crude oil.
4) Renewable Energy With regard to renewable energy development for power generation, the projection by IE will be
applied. Alternative motor fuel will be supplied that, by 2025, 30% of gasoline demand will be
substituted by E5 gasohol and 10% of diesel gas oil demand will be substituted by B5 bio-diesel.
Energy Supply/Demand Balance of Reference Case Energy supply/demand balances for major sectors for the Reference Case are as follows.
1) Crude Oil As no oil refinery is operating for the first four years from 2005, all the crude oil production goes to
export. The first oil refinery starts operation in 2009 and runs at full load through 2025. National
oil stockpiling starts from 2010 and increases stepwise. The second refinery starts in 2015 and
operates at full lord from the beginning. A half of the feedstock for the second refinery will be
imported crude oil, thus crude oil import starts from 2015 excluding those for oil stockpiling. At the
first refinery, 15% of the feedstock will be switched to import crude oil from 2020, increasing the total
Dầu đã phát hiện
Dầu mỏ mới
Dầu nước ngoài
Khí đã phát hiện
Khí mỏ mới
0
4
8
12
16
20
24
28
32
36
4019
8619
8719
8819
8919
9019
9119
9219
9319
9419
9519
9619
9719
9819
9920
0020
0120
0220
0320
0420
0520
0620
0720
0820
0920
1020
1120
1220
1320
1420
1520
1620
1720
1820
1920
2020
2120
2220
2320
2420
25
Dầu
kh
í, t
riệu
tấn
(q
uy đổ
i)
0
4
8
12
16
20
24
28
32
36
40
THỰC TẾ DỰ BÁOActual Production Actual Production
MM
TO
E
Estimated Production Estimated Production
Oil Discovery FieldsOil Discovery Fields
Oil New Oil New DiscoveryDiscovery
Oil OverseaOil Oversea
Gas Discovery FieldsGas Discovery Fields
Gas NewGas NewDiscoveryDiscovery
Year Oil (MM ton) Gas (BCM) TOE (MM ton)
2001 17.02 1.72 18.742002 17.07 2.17 19.242003 17.61 3.05 20.662004 20.35 6.17 26.522005 18.84 6.87 25.712006 17.25 6.95 24.20
2007 (Est) 16.12 7.27 23.39
45
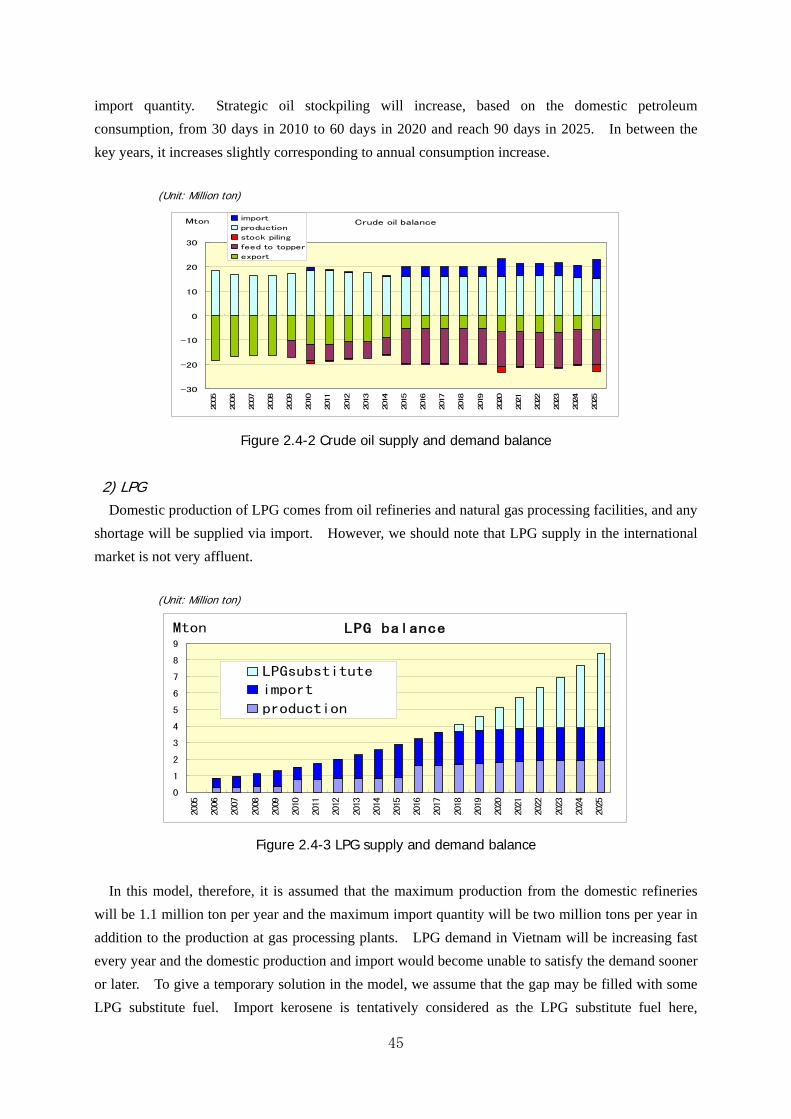
import quantity. Strategic oil stockpiling will increase, based on the domestic petroleum
consumption, from 30 days in 2010 to 60 days in 2020 and reach 90 days in 2025. In between the
key years, it increases slightly corresponding to annual consumption increase.
(Unit: Million ton)
Figure 2.4-2 Crude oil supply and demand balance
2) LPG Domestic production of LPG comes from oil refineries and natural gas processing facilities, and any
shortage will be supplied via import. However, we should note that LPG supply in the international
market is not very affluent.
(Unit: Million ton)
Figure 2.4-3 LPG supply and demand balance
In this model, therefore, it is assumed that the maximum production from the domestic refineries
will be 1.1 million ton per year and the maximum import quantity will be two million tons per year in
addition to the production at gas processing plants. LPG demand in Vietnam will be increasing fast
every year and the domestic production and import would become unable to satisfy the demand sooner
or later. To give a temporary solution in the model, we assume that the gap may be filled with some
LPG substitute fuel. Import kerosene is tentatively considered as the LPG substitute fuel here,
Crude oil balance
-30
-20
-10
0
10
20
30
200
5
200
6
200
7
200
8
200
9
201
0
201
1
201
2
201
3
201
4
201
5
201
6
201
7
201
8
201
9
202
0
202
1
202
2
202
3
202
4
202
5
import
production
stock piling
feed to topper
export
Mton
LPG balance
0
1
2
3
4
5
6
7
8
9
2005
2006
2007
2008
2009
2010
2011
2012
2013
2014
2015
2016
2017
2018
2019
2020
2021
2022
2023
2024
2025
LPGsubstitute
import
production
Mton
46
though it is necessary to consider it seriously how to satisfy the potential demand of L PG which will
be mainly required by many users in industry, commercial and residential sectors. It is most
desirable to substitute the supply with city gas in view of the needs on the demand side. if we could
develop natural gas delivery system in time.
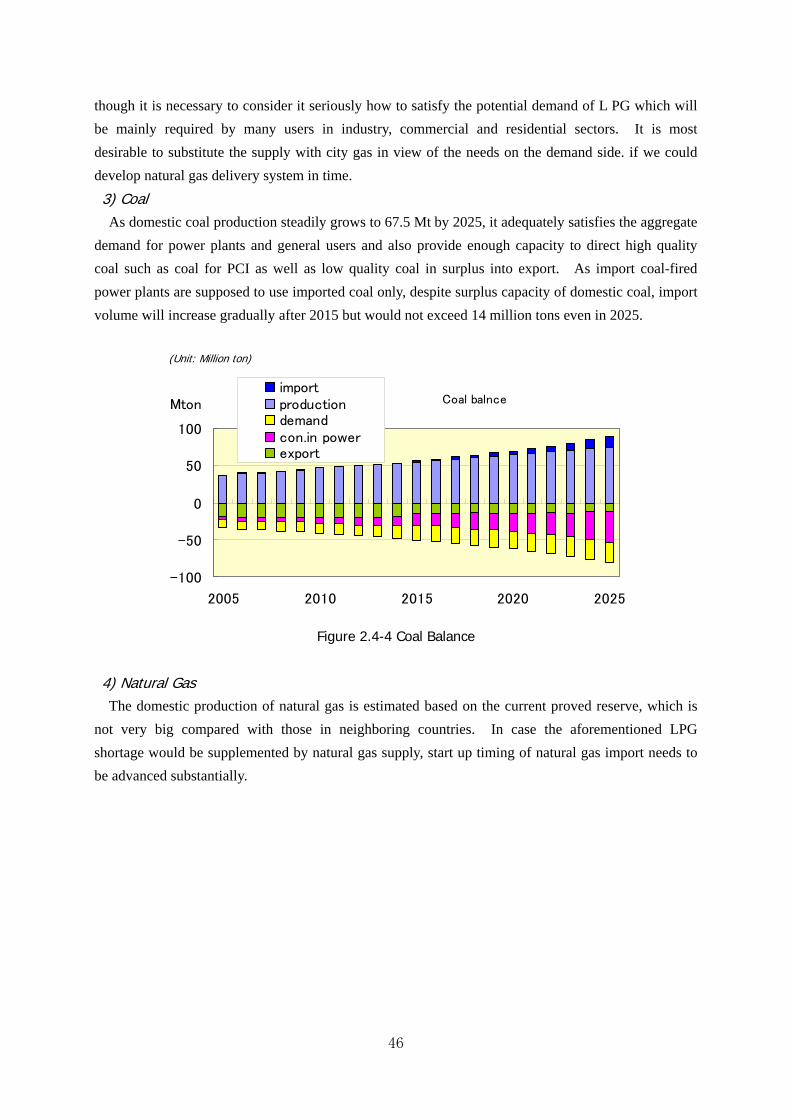
3) Coal As domestic coal production steadily grows to 67.5 Mt by 2025, it adequately satisfies the aggregate
demand for power plants and general users and also provide enough capacity to direct high quality
coal such as coal for PCI as well as low quality coal in surplus into export. As import coal-fired
power plants are supposed to use imported coal only, despite surplus capacity of domestic coal, import
volume will increase gradually after 2015 but would not exceed 14 million tons even in 2025.
(Unit: Million ton)
Figure 2.4-4 Coal Balance
4) Natural Gas The domestic production of natural gas is estimated based on the current proved reserve, which is
not very big compared with those in neighboring countries. In case the aforementioned LPG
shortage would be supplemented by natural gas supply, start up timing of natural gas import needs to
be advanced substantially.
Coal balnce
-100
-50
0
50
100
2005 2010 2015 2020 2025
importproductiondemandcon.in powerexport
Mton
47
(Unit: Million ton)
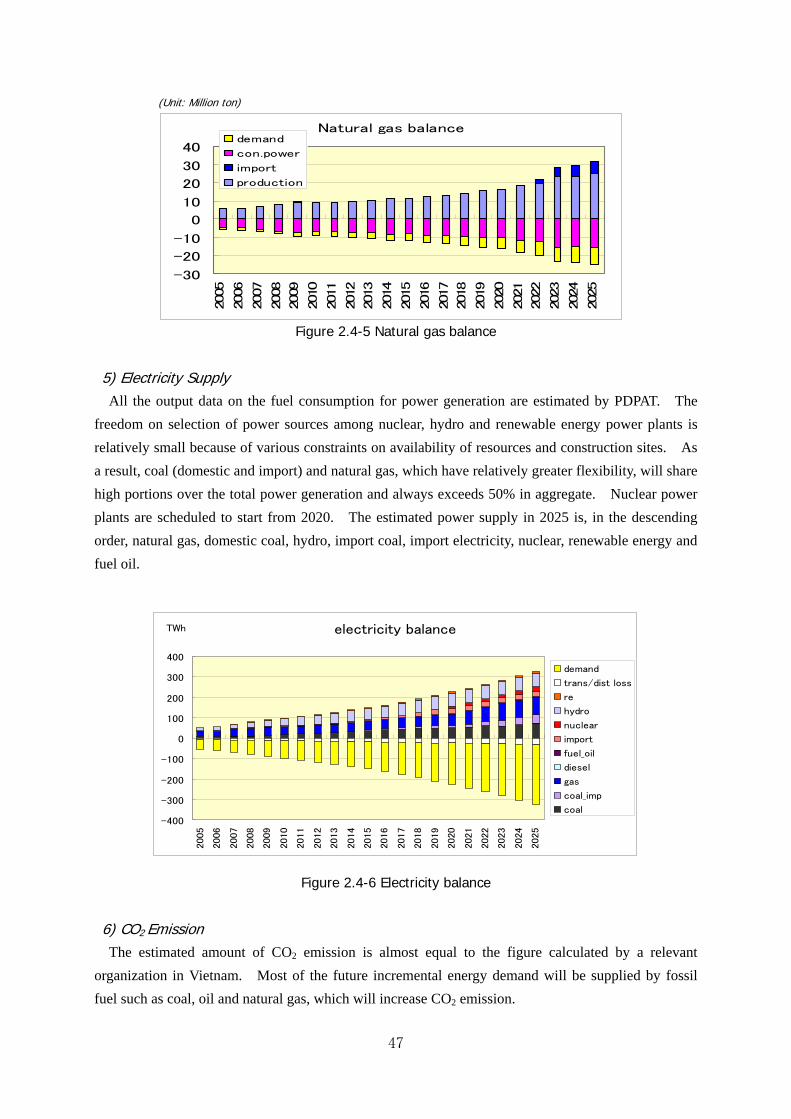
Figure 2.4-5 Natural gas balance
5) Electricity Supply All the output data on the fuel consumption for power generation are estimated by PDPAT. The
freedom on selection of power sources among nuclear, hydro and renewable energy power plants is
relatively small because of various constraints on availability of resources and construction sites. As
a result, coal (domestic and import) and natural gas, which have relatively greater flexibility, will share
high portions over the total power generation and always exceeds 50% in aggregate. Nuclear power
plants are scheduled to start from 2020. The estimated power supply in 2025 is, in the descending
order, natural gas, domestic coal, hydro, import coal, import electricity, nuclear, renewable energy and
fuel oil.
Figure 2.4-6 Electricity balance
6) CO2 Emission The estimated amount of CO2 emission is almost equal to the figure calculated by a relevant
organization in Vietnam. Most of the future incremental energy demand will be supplied by fossil
fuel such as coal, oil and natural gas, which will increase CO2 emission.
Natural gas balance
-30
-20
-10
0
10
20
30
40
2005
2006
2007
2008
2009
2010
2011
2012
2013
2014
2015
2016
2017
2018
2019
2020
2021
2022
2023
2024
2025
demand
con.power
import
production
electricity balance
-400
-300
-200
-100
0
100
200
300
400
2005
2006
2007
2008
2009
2010
2011
2012
2013
2014
2015
2016
2017
2018
2019
2020
2021
2022
2023
2024
2025
demand
trans/dist loss
re
hydro
nuclear
import
fuel_oil
diesel
gas
coal_imp
coal
TWh

48
Figure 2.4-7 CO2 emission
Energy Supply Patterns in Main Cases The most remarkable difference among the six cases appears in the energy import quantity and the
energy import ratio. This is because the future energy demand fluctuates subject to outlook on
economic growth and energy price, while the domestic production has certain limit and the same
energy supply scenario is applied to the six cases.
In the Reference Case, Vietnam will become a net energy importing country in 2017 save for oil
stockpiling. This will occur earliest in 2015 for the High Growth Case, BAU case, Low Price case
and latest in 2020 for the Low Growth Case. Anyway, Vietnam will shift from an energy exporting
to an energy importing country sooner or later, and it is the most important issue in the energy sector
to consider how to cope with such new position. Please refer to the principal report for detail
analysis on impacts on each energy sector.
Figure 2.4-8 Energy Import
0
50
100
150
200
250
300
350
2005
2006
2007
2008
2009
2010
2011
2012
2013
2014
2015
2016
2017
2018
2019
2020
2021
2022
2023
2024
2025
Million ton-CO2
Energy import
-40
-20
0
20
40
60
80
100
2005
2006
2007
2008
2009
2010
2011
2012
2013
2014
2015
2016
2017
2018
2019
2020
2021
2022
2023
2024
2025
High Growth
BAU
Ref
LowPrice
HighPrice
LowGrowth
Mtoe

49
Figure 2.4-9 Energy Import Ratio
Change of Conditions and Energy Supply
1) Energy Conservation Comparing the effect of EEC between the BAU Case and the Reference Case, the top three items
are all regarding the domestic and import coal used for power plant. The progress of EEC leads to
decrease of electricity demand, then generation by domestic and import coal, and consumption of such
fuel. As a result, decrease of coal import occurs.
Table 2.4-1 Effect of EEC on Individual Supply Items (at 2025)
Following these items, the demand of LPG would decrease by 29.4% leading to decrease of LPG
substitute’s import by 42.2%. In case of natural gas, demand decrease leads to decrease of import by
35.9%.
2) Economic Growth Rate In the High Growth Case, increase of electricity demand creates fuel consumption increase at coal
power plants, increase of coal import, and then increase of coal consumption. Increase of import of
import energy ratio
-80
-60
-40
-20
0
20
40
60
2005
2006
2007
2008
2009
2010
2011
2012
2013
2014
2015
2016
2017
2018
2019
2020
2021
2022
2023
2024
2025
High Growth
BAU
Ref
LowPrice
HighPrice
LowGrowth
%
order energy term unit reference BAU diffrenceratio
vs BAU %
1 coal import kton 14,226 53,026 -38,800 -73.22 power import coal fuel GWh 41,461 125,696 -84,235 -67.03 coal for power kton 43,716 85,785 -42,069 -49.04 LPG LPGsubstitute kton 5,259 9,099 -3,841 -42.25 natural gas import MMm3 6,911 10,781 -3,869 -35.96 naptha to gasoline kton 1,260 1,944 -684 -35.27 CO2 emission Mton 345 508 -163 -32.125 crude oil import kton 7,805 8,537 -732 -8.626 natural gas for power MMm3 15,512 15,472 40 0.327 power natural gas GWh 85,186 84,889 298 0.428 coal export kton 13,203 5,250 7,953 151.529 naptha export kton 844 160 684 427.3

50
natural gas and LPG substitute follow them. Changes in the economic growth rate by 1% would
substantially undermine the effect of EEC promotion at annual 2-3%.
Table 2.4-2 Effect of Growth Rate Changes (at 2025): High Growth
Table 2.4-3 Effect of Growth Rate Changes (at 2025): Low Growth
3) Energy Price In the High Price Case, as energy price increases, energy demand decreases and thus the energy
supply will be affected. The greatest effect appears in Naphtha. As gasoline demand is suppressed
because of high price, naphtha, otherwise to be blended into gasoline, goes for export. Then,
decrease of power generation by import coal leads to coal import reduction.
Table 2.4-4 Comparison between High Price and Reference Cases
order energy term unit High Growth reference differenceincrease ratio
(vs reference%)
1 coal import kton 48,300 14,226 34,074 239.52 power imoprt coal fuel GWh 109,213 41,461 67,752 163.43 natural gas import MMm3 12,385 6,911 5,474 79.24 naptha to gasoline kton 2,104 1,260 844 67.05 coal for power kton 80,412 43,716 36,697 83.96 LPG LPGsubstitute kton 9,302 5,259 4,044 76.99 CO2 emission Mton 507 345 162 46.931 coal export kton 5,250 13,203 -7,953 -60.232 naptha export kton 0 844 -844 -100.0
order energy term unit High price reference differenceratio
vs reference)1 naptha to gasoline kton 701 1,260 -559 -44.42 poer import coal fue GWh 25,838 41,461 -15,623 -37.73 coal import coal fue kton 8,920 14,226 -5,306 -37.34 natural gas import coal fue MMm3 4,663 6,911 -2,248 -32.55 coal for poweer kton 31,892 43,716 -11,824 -27.06 LPG LPG substitute kton 3,974 5,259 -1,284 -24.47 power coal fuel GWh 56,884 73,138 -16,254 -22.230 naptha export kton 1,403 844 559 66.231 coal export kton 23,133 13,203 9,931 75.2
order energy term unit Low Groth reference differenceration
(vs reference%)1 natural gas import MMm3 480 6,911 -6,432 -93.12 naptha to gasoline kton 420 1,260 -840 -66.73 power imort coal fuel GWh 16,270 41,461 -25,191 -60.84 coal import kton 5,686 14,226 -8,540 -60.05 LPG LPGsubstitute kton 2,947 5,259 -2,311 -43.96 coal for power kton 27,239 43,716 -16,477 -37.77 diesel import kton 8,598 12,958 -4,360 -33.69 CO2 emission Mton 252 345 -94 -27.130 naptha export kton 1,684 844 840 99.531 coal export kton 26,724 13,203 13,521 102.4

51
As the energy demand change from the Reference Case is small in the Low Price Case, there would
be least changes in the energy supply pattern between them.
Table 2.4-5 The comparison between Low Price and Reference Cases
Challenges in the Long-Term Energy Supply Today, harmonization of 3E (Economic development, Energy supply and Environment) and
reinforcement of 3S (Security, Sustainability and Stability) have become common objectives of energy
policy in the world. As integration with the world economy becomes stronger, Vietnam could not be
free from these policy challenges common in the world. Straightforward, promotion of energy
conservation and establishment of stable energy supply system are indispensable in order to
materialize the sustainable economic development.
Challenge 1:Efficient use of energy and promotion of energy conservation: In the BAU case, the economy will grow at annual 8.4% through to 2025. Primary energy supply
increases six-fold from 28.12 Mtoe in 2005 to 161.38 Mtoe in 2025. Vietnam will change from a net
energy exporting country to a net energy importing country and dependence on the importing energy
will be about 50%. In the Reference Case, therefore, energy conservation effort will be strengthened
by 2-3% more than the BAU case and curb the increase of energy consumption in order to reduce the
dependence on importing energy. As a result, the primary energy supply decreases by 27% to 117.06
Mtoe and dependence on importing energy could reduce down to 30%.
(unit:Ktoe)
(note)BAU: Business As Usual Case、Ref:reference Case、HEG:High Economic Growth Case、
LEG:Low Economic Growth Case
Figure 2.4-10 Comparison of estimated results of energy demand by case
order energy term unit Low Price reference differenceraio
vs reference %1 coal import kton 31,241 14,226 17,015 119.62 power import coal GWh 82,178 41,461 40,716 98.23 coal for power kton 63,790 43,716 20,074 45.94 LPG LPG substit kton 7,301 5,259 2,043 38.85 CO2 emission Mton 429 345 84 24.335 coal emssion kton 5,250 13,203 -7,953 -60.2
0
20,000
40,000
60,000
80,000
100,000
120,000
140,000
160,000
180,000
2005
2007
2009
2011
2013
2015
2017
2019
2021
2023
2025
BAU
Ref
HEG
LEG
52
In a case economic growth rate increases by 1% to 9.5% as the Vietnamese economy is growing
quite actively, the primary energy supply will be almost same as the BAU case. Dependence on
import energy exceeds 50% to highlight the energy security as a serious issue. In terms of primary
energy supply, the effect of one point percent change of economic growth rate almost counterbalances
to 2-3% improvement of energy conservation. On the contrary, in a case in which the economic
growth rate decreases by 1% to 7.4%, the primary energy supply is calculated to be 89.17 Mtoe in
2025. The 1% point decrease of economic growth rate has effected to 24% decrease in primary
energy supply from the Reference Case. Dependence of importing energy is greatly improved to
11%. Energy supply required to meet the High Growth Case would be extremely huge and cause big
issues of energy security, although it is a desirable selection that high economic growth will serve for
improving people’s life standard. In this sense, slowdown of the economic growth rate to that of the
Low Growth Case could be another desirable selection. In order to achieve the policy objectives of
3E and 3S, the conservation targets set out in the Reference Case should be realized by whatever
means.
Challenge 2: Establishment of Reliable and Efficient Energy Supply System In the primary energy supply mix, share of oil goes down and share of coal goes up as the economic
growth rate becomes higher. The natural gas more or less maintains the same share. The share of
hydropower decreases gradually because of constraints on resources, although it increases
occasionally during the projection period. Nuclear and renewable energy are highly important but
their shares are still small in 2025 over the primary energy supply. These trends reflect the different
conditions on energy resources as the precondition for their supply, such as relatively rich coal
resources, some constraints on oil resources and possibility of gas development, and constraints on the
demand side may also be reflected at the same time. Coal supply changes most greatly among cases
because electric power demand reacts to the change of the total demand first and greatest, and then
coal-fired thermal power will be influenced most.
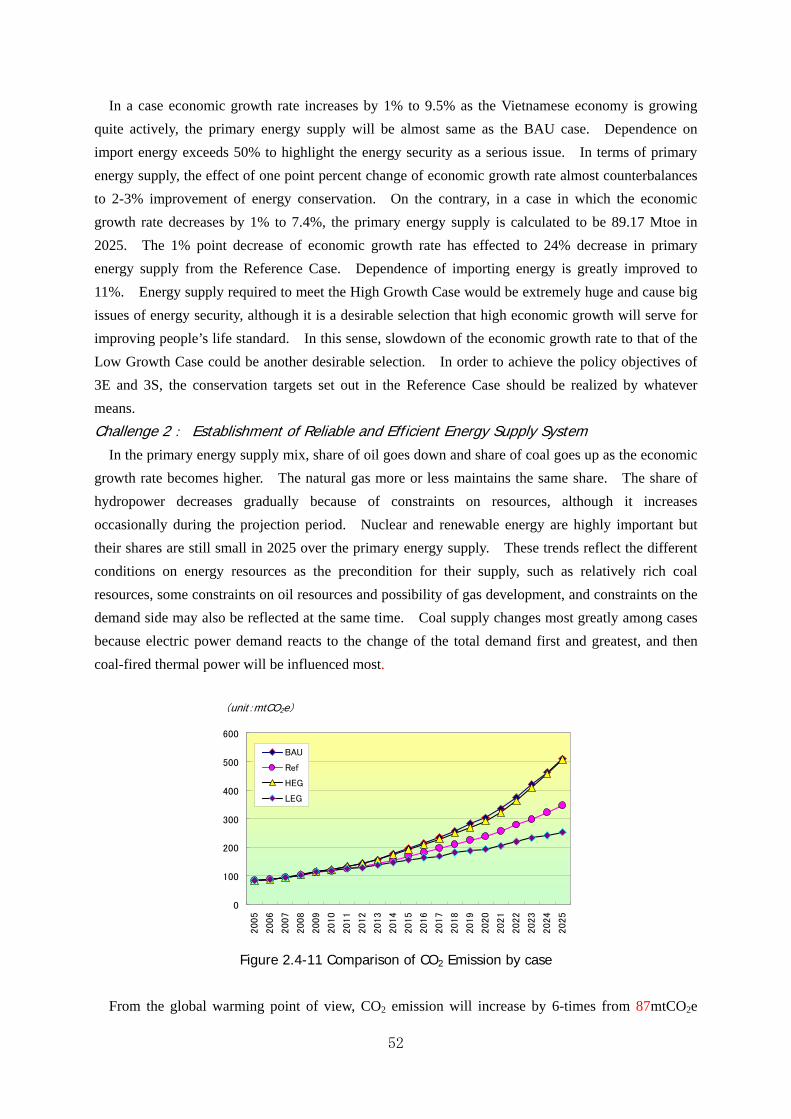
(unit:mtCO2e)
Figure 2.4-11 Comparison of CO2 Emission by case
From the global warming point of view, CO2 emission will increase by 6-times from 87mtCO2e
0
100
200
300
400
500
600
2005
2006
2007
2008
2009
2010
2011
2012
2013
2014
2015
2016
2017
2018
2019
2020
2021
2022
2023
2024
2025
BAU
Ref
HEG
LEG

53
-40
-20
0
20
40
60
80
100
2005 2010 2015 2020 2025
Gas
Oil
Coal
2005 2010 2015 2020 2025LG RC HG LG RC HG LG RC HG LG RC HG LG RC HG
Million toe
(million ton of CO2 equivalent) in 2005 to about 500mtCO2e in 2025 in the BAU. On the contrary, in
the Low Growth Case, the CO2 emission decreases to 3-times of the current level, a half of the BAU
Case, or 250mtCO2e in 2025. In the Reference Case, it decreases by 4.2-times or to 345mtCO2e
which is in the middle of these cases. Considering the global warming issues, Vietnam may be
requested to lower the CO2 emission at least to the level of the Reference Case.
Challenge 3: Stable Supply of Importing Energy and Strengthening of Energy Security As it is inevitable that Vietnam changes into a net energy importing country around 2015, stable
supply of import energy and reinforcement of energy security are the third challenge.
Figure 2.4-12 Net Energy Import
Since economics of scale works strongly in energy sector, world-class importing system should be
constructed in the oil and coal sectors. In addition, as the dependence on the global market increases,
it is necessary to promote energy supply enterprises, which will be able to overcome the rough
turbulences in the international market, as well as reinforcement of national emergency response
ability such as state oil stockpiling.
Challenge 4: Energy Sector Reform and Modernization of Energy Market It is desirable that policy objectives such as energy conservation and reinforcement of the energy
supply system should be realized through market mechanism based on economic principles. In the
modern society where size of economy has become tremendously huge and international linkage
become extremely closer, use of market mechanism is the strongest method to materialize various
economic objectives. However, market failures have been experienced in many countries in the
1990s. To proceed with marketization, we need to develop an appropriate market design.
In order to find solutions to various issues and challenges inferred from the foregoing analyses on
the long term energy demand forecast and supply outlook, it is necessary to identify the fundamental
direction of the energy policy, to formulate realistic roadmaps and action plans on energy conservation,
energy supply and marketization, and to implement them.

54
2.5 Strategic Environment Assessment
Background of applying Strategic Environment Assessment Human activities based on goodwill, whether they are policy formulation, preparation of a plan, or a
development project, aim at bringing benefits in society and environment. However, most people
may have known the possibility that those activities might be accompanied by negative side-effects.
When plans and projects with physical transformation and by-products of pollutants are prepared and
implemented, it is nowadays a global common sense that they must be accompanied with the activities
for ‘environmental and social considerations (ESC)’.
While EIA system is the most well known ESC activity internationally, it is not quite fitting to a
broad ranged planning activity and considerations in the very upstream of development plans.
Vietnam became actually a front runner among developing countries in requiring SEA by legislation
when she enforced it with the revised law on environmental protection in July 2006. However,
methods of SEA to treat energy master plan of a country as a whole like this study are yet to be fully
developed; this is the first trial in Vietnam.
Indicators and aggregation of environmental and social impact Analysis of environmental and social impact is conducted on each energy sub-sector of various
cases to be considered in the energy master plan study, and comparative study on alternative cases is
carried out using the common indicators as explained below.
The extent of the environmental and social impacts to be inferred on each alternative scenario such
as BAU Case, Reference Case or cases on different supply conditions shall be evaluated by the
formula shown as below relating to common indicator, weighting on indicators and the extent of
difficulties of mitigation on each alternative scenarios.
Table 2.5-1 Common indicators consistent to the respective sub-sectors
Source: The Study Team, The Inception Report, December 2006 Note: Load = Burden or Potential Impacts by the Project
The magnitude of environmental and social impacts assumed for each alternative scenario will be
given through the evaluation work based on the formula below, the combination of common indicators
with weights on indicators and mitigation difficulties for respective scenarios.
① Order of the size in total amount of greenhouse gas emission② Load (Impacts) on air pollution(SOx, NOx, Dust, etc.)③ Load on water environment and resources (water consumption, water pollution, disturbance of surface and coastal water, etc.)④ Load on forest resources (forest decrease, degraded function of disaster prevention)⑤ Social Fairness (Uneven distribution of development area, Load on the socially vulnerable groups)⑥ Transformation potential of living space (resettlement issues, land occupation & transformation, etc.)

55
Evaluation of Weights and Mitigation Terms are given on the points below.
Index for evaluation of sub-sectors As for the six main cases considered in this study, magnitude of environmental and social impacts is
compared based on the results on changes in economic indicators, energy demand/supply structure,
CO2 emission, etc., calculated by the supply optimization model and weighting coefficients (Wi and
Mi). The magnitudes of environmental and social impacts for 6 cases are evaluated by three sectors
(oil & gas, coal, and electricity including renewable energy).
Environmental and social impacts of 6 cases Range of ESI (Environmental and Social Index), which is used for assessment of overall impact of
environmental and social impact, is between 0 and 8,100 theoretically. Maximum ESI with 8,100 is
the worst-case scenario with “score 5” of weighting coefficient and level of difficulty, which indicates
that all of six indicators show worst number of five in weight (Wi: distance、continuing time, difficulty
of restoring to the original and frequency of impact) and mitigation difficulty (difficulty to mitigate the
impact). This implies a society facing destructive environment impact that would not happen in the
real world.
ESI =
n
i
MiWiVi1
**
jWicesignificanWij
3
1
)( kMik
3
1
Wi = Mi =
ESI: the magnitude of environmental and social impacts to be possibly caused by a corresponding case
Vi: the value (the relative rank in alternative cases) for the indicator-i given on the corresponding case
Wi: the weight on the indicator-i
Mi: the mitigation difficulty for the indicator-icorresponding to the respective case
n: the number of the indicators(set as 6)
Weights
• reach of impact area (in space)• duration of impact (in time)• irreversibility of impact• significance (or seriousness) of
potential impact in the sub-sector concerned
level of difficulty for mitigation measures
• technical difficulty(to find any effective measures to avoid or alleviate adverse impacts)
• economic difficulty(due to a large amount of cost for necessary measures)
• socio-political difficulty (due to social and political hurdles in realizing and taking necessary measures)

56
When scores of Wi and Mi are 3, we have to consider countermeasures to reduce the effects on the
environment. In general, if Vi, Wi, and Mi give scores of 3.5, 2, and 2 respectively, ESI becomes 756.
In this case, it is said that the environmental problems are appearing.
Comparing environmental and social impacts by each indicator, BAU Case shows the maximum
score of indicator at 5079 as a sum on all energy sectors. Result for the High Growth case of 9.5%
economic growth, as a sub-case of the Reference Case that assumes 3-4% energy conservation, is 5068,
slightly lower than the result for the BAU Case.
On the lower sector, maximum level is seen in the BAU Case and High Growth Case for the power
sector, 1,963 and 1,964, respectively. Maximum score for coal sector was seen in BAU case at 1,705
and for oil sector High Growth Case at 1,442.
The score 1,964 is the second or third largest one among the six cases in terms of environment
burden, and corresponds to the case where evaluation of weighting indicator and mitigation difficulty
are all at level three. On the other hand, the minimum impact case among six cases was Low Growth
Case of 1,839 for the total energy sector and coal for Low Growth Case at 299 among the lower
sectors.
Table 2.5-2 Environmental and Social Index (ESI) by 6 Cases
Table 2.5-3 Range of ESI
Impacts by indicator Comparing environmental and social impacts by each indicator, G-indicator (Global warming
factor) is the most effective factor in all sectors (refer to Table 2.5-4).
Table 2.5-4 Value of Vi, Wi, Mi, and ESI by sub-sector
BAU CaseReference
CaseHigh
GrowthLow
GrowthHigh Price
CaseLow Price
CaseBAU R HG LG HP LP
Oil and Gas 1410 893 1442 439 725 1211Coal 1705 915 1663 299 618 1292
Electric Power 1963 1510 1964 1101 848 1209Total of
all energy sectors 5079 3318 5068 1839 2191 3712
Sub Case Sector
0 < Range of ESI ≦ 8100 = 6*6*15*15 = (6 indicators)*(Max Vi)*(Max Wi)*(Max Mi)1944 = 6*4*9*94320 = 6*5*12*12 1701 = 6*3.5*9*9 756 = 6*3.5*6*6
Oil & Gas Sector Vi,Wi,Mi Value for respective indicators
BAU R HG LG HP LPG 5.8 3.4 6.0 1.0 2.1 4.7 10.6 10.1A 5.8 3.2 6.0 1.0 3.0 5.1 7.8 9.2W 5.1 3.1 5.2 1.8 2.6 4.3 3.3 7.1F 3.5 3.5 3.5 3.5 3.5 3.5 1.7 9.0S 3.5 3.5 3.5 3.5 3.5 3.5 3.7 8.0T 4.2 3.3 4.3 2.7 3.1 3.9 2.7 8.5
ViWi Mi
Oil & Gas Sector ESI for respective indicators
BAU R HG LG HP LPG 620.7 363.0 639.0 106.5 223.7 503.1A 415.4 225.1 424.7 71.0 210.3 360.2W 120.3 72.8 122.3 41.8 61.8 100.6F 54.6 54.6 54.6 54.6 54.6 54.6S 104.4 104.4 104.4 104.4 104.4 104.4T 94.8 73.6 97.0 60.9 70.2 87.7
ESI

57
Maximum scores of 639, 418, and 649 respectively for oil & gas, coal and electric power sectors
appear on G-indicator (Global warming factor). The reason of such outcome is that Wi factor
(affected area, affected time, difficulty of recovery, and appearance ratio of effect) and Mi factor (level
of difficulty) appears greater in G-indicator than other indicators.
Table 2.5-5 Contribution of Six Indicators in Reference Case
Magnitude of indicator depends on energy sector. In oil and gas sector, F-indicator (effect of forest
and ecology) is low in all alternative cases. Minimum index in oil and gas sector is W-indicator
(effect of water environment) of Low Growth Case. In coal sector, S-indicator (effect of social
G29%
A19%W
13%
F13%
S11%
T15%
G 363.0 223.9 376.0 962.8A 225.1 166.6 254.7 646.4W 72.8 148.8 206.3 427.9F 54.6 116.0 261.8 432.4S 104.4 96.4 158.6 359.3T 73.6 163.1 252.8 489.5
ElectricPower
TotalEnergy
Oil andGas
CoalG 40.6 24.5 24.9 29.0A 25.2 18.2 16.9 19.5W 8.2 16.3 13.7 12.9F 6.1 12.7 17.3 13.0S 11.7 10.5 10.5 10.8T 8.2 17.8 16.7 14.8
Total 100.0 100.0 100.0 100.0
%)Oil and
GasCoal
ElectricPower
TotalEnergy
Coal Sector Vi,Wi,Mi Value for respective indicators
BAU R HG LG HP LPG 6.0 3.2 5.9 1.0 1.8 4.6 7.2 9.8A 6.0 3.2 5.9 1.0 2.7 4.9 7.3 7.1W 6.0 3.2 5.8 1.0 2.1 4.4 6.4 7.3F 6.0 3.2 5.8 1.0 2.1 4.4 4.1 9.0S 5.6 3.2 5.4 1.4 2.4 4.2 3.8 7.9T 6.0 3.2 5.8 1.0 2.1 4.4 6.1 8.4
ViWi Mi
Coal Sector ESI for respective indicators
BAU R HG LG HP LPG 418.3 223.9 413.3 69.7 122.2 319.0A 310.3 166.6 302.8 51.7 137.2 252.7W 281.6 148.8 272.7 46.9 100.1 206.3F 219.6 116.0 212.7 36.6 78.0 160.9S 166.9 96.4 162.2 42.3 70.5 126.9T 308.8 163.1 299.1 51.5 109.7 226.2
ESI
Electric Power SectorVi,Wi,Mi Value for respective indicators
BAU R HG LG HP LPG 5.9 3.5 6.0 1.0 2.1 4.8 10.7 10.1A 5.5 4.1 5.5 2.9 1.5 2.2 7.7 8.1W 4.8 4.1 4.7 3.6 2.3 2.5 6.1 8.3F 5.4 4.7 5.3 4.1 1.6 1.8 5.9 9.5S 3.5 3.5 3.5 3.5 3.5 3.5 5.2 8.6T 4.4 4.0 4.3 3.8 2.6 2.7 6.1 10.2
ViWi Mi
Electric Power Sector ESI for respective indicators
BAU R HG LG HP LPG 640.2 376.0 649.4 108.2 228.0 517.6A 347.8 254.7 344.4 180.2 91.2 137.9W 240.1 206.3 238.3 182.7 113.7 127.5F 302.5 261.8 300.1 233.0 91.5 98.7S 158.6 158.6 158.6 158.6 158.6 158.6T 273.9 252.8 272.7 238.0 164.9 168.6
ESI

58
justice) is low in all alternative cases. Minimum index in coal sector shows F-indicator of Low
Growth Case. In power sector, there is no low indicator.
Focusing on Reference Case, G-indicator shows a high effect in all sub-sectors and 29% of the total
impacts come from G-indicator (refer to Table 2.5-5) followed by W-indicator with 19%, T-indicator
(effect of housing) with 15%.
Contribution of three Lower Sectors on the Total energy Sector Contribution of lower three sectors over the total energy sector is as follows. Regarding
G-indicator (global warming factor), power sector contributes most while oil and gas sector does
almost same. Same trend is observed on A-indicator (air quality factor), though contribution of coal
sector increases slightly. Regarding W-indicator (water quality factor), power sector will be
responsible for almost half followed by coal sector. Same trend is seen on F-indicator (forest and
ecology factor), yet power sector contribution substantially increases to 60%. Same trend is also
seen on T-indicator (factor to represent increasing burden or risk on transforming living sphere), and
power sector is responsible over 50%. In S-indicator (social fairness and equality factor), social
impacts are greater in the order of electric power sector, oil & gas sector and coal sector.
Table 2.5-6 Effects of 3 Sub-sectors (%) in Reference Case
G-indicator A-indicator W-indicator
F-indicator S-indicator T-indicator
G 37.7 23.3 39.0 100.0A 34.8 25.8 39.4 100.0W 17.0 34.8 48.2 100.0F 12.6 26.8 60.5 100.0S 29.0 26.8 44.1 100.0T 15.0 33.3 51.6 100.0
Total 26.9 27.6 45.5 100.0
Oil andGas
CoalElectricPower
TotalEnergy
Contribution of 3 Sectors to G
Oil and
Gas
38%
Coal
23%
Electric
Power
39%
Contribution of 3 Sectors to A
Oil and
Gas
35%
Coal
26%
Electric
Power
39%
Contribution of 3 Sectors to W Oil and
Gas
17%
Coal
35%
Electric
Power
48%
Contribution of 3 Sectors to F
Coal
27%Electric
Power
60%
Oil and
Gas
13%
Contribution of 3 Sectors to SOil and
Gas
29%
Coal
27%
Electric
Power
44%
Contribution of 3 Sectors to T
Electric
Power
52% Coal
33%
Oil and
Gas
15%
59
As seen above, impact of energy consumption increase is greatest. Among energy sectors, impact
of the electric power sector is greatest followed by the coal sector, while the high activity of the latter
is induced by high demand for electricity. Thus, promotion of energy efficiency and conservation
(EEC) and non-fossil power supply should be considered seriously in the energy policy from
environmental impact viewpoint.
2.5.4 Mitigation Method and Monitoring Plan From the foregoing analysis, we need to consider mitigation measures to ease anticipated impacts.
The following are the major mitigation measures based on the Reference Case analysis, which is the
standard case for the draft National Energy Master Plan.
1) G-indicator requiring mitigation measures Common for three sectors on activities to emit certain amount of CO2, methane, mono oxide
nitrogen and other greenhouse gases
2) A-indicator requiring mitigation measures Common for three sectors on activities to emit certain amount of air polluting substances such as
SOx, NOx, particulates, dusts (including heavy metals such as nickel and vanadium),
hydrocarbons and hydrogen sulfide.
For power sector, nuclear power plant plan that needs monitoring of radioactive level of the
exhaust gas during operation.
3) W-indicator requiring mitigation measures For power sector, cases of creating dam lake or water reservoir for hydropower, and also nuclear
power plant plan that needs monitoring radioactive level of the wastewater during operation.
4) F-indicator requiring mitigation measures For coal sector, big scale development requiring cutting down of primary jungles and tropical
natural forests widely.
For power sector including renewable energy sector, development plans to be located within
natural reserves, habitat of extinctive species, and habitat of ecologically important creations
such as coral reef, mangroves and lagoons, and nuclear power plant plan that needs monitoring
of radioactive level of the surrounding environment during operation.
5) S-indicator requiring mitigation measures For power sector, nuclear power plant plan that needs concurrence of IAEA and understanding of
international society and other organizations.
6) T indicator requiring mitigation measures For coal sector, development plans close to world heritage and important cultural heritages
(archaeological, historical, cultural and religious) and development plans to be located on or to
give serious impact to famous and/or precious scenic spots. In addition, site after closure of
mine that needs appropriate environment protection such as land reclamation, reforestation and
processing of mine wastewater and also candidate dump site for waste mud and stone or waste
mine processing ponds that would be vulnerable for collapse of slope and soil wash away

60
For power sector including renewable energy sector, site selection plan to secure land and
system to appropriately process and dispose wastes. Technical background to secure safe
operation that should be prepared in the nuclear power plant plan with regard to necessary
institution (law and regulation, safety standard, guidelines), development of organization and
workforce, and accumulation of knowledge on worldwide accident record in the sector. Site
selection of nuclear power station with regard to thorough and proper survey of geology,
hydrogeology and geography and securing of unloading port, transport route and storage of
nuclear fuel. Carefully worked out plan on disposal process of nuclear fuel including final
disposal site of nuclear fuel waste, processing cost, transportation and temporary storage.
Study on final closure plan of power station after expiration of facility life.
In the course of implementing the National Energy Master Plan, we should monitor and audit
performance of environmental factors as discussed above. To this end, we need to define the concept
of environment management system relating to energy activities. Then, we should construct database,
monitoring and auditing system for evaluation and analysis of environmental elements. For the
overall management, it is desirable to establish multi-layer system comprising national and regional
energy-environment committees to periodically review status of environmental and social
considerations on general energy policy as well as major energy projects.
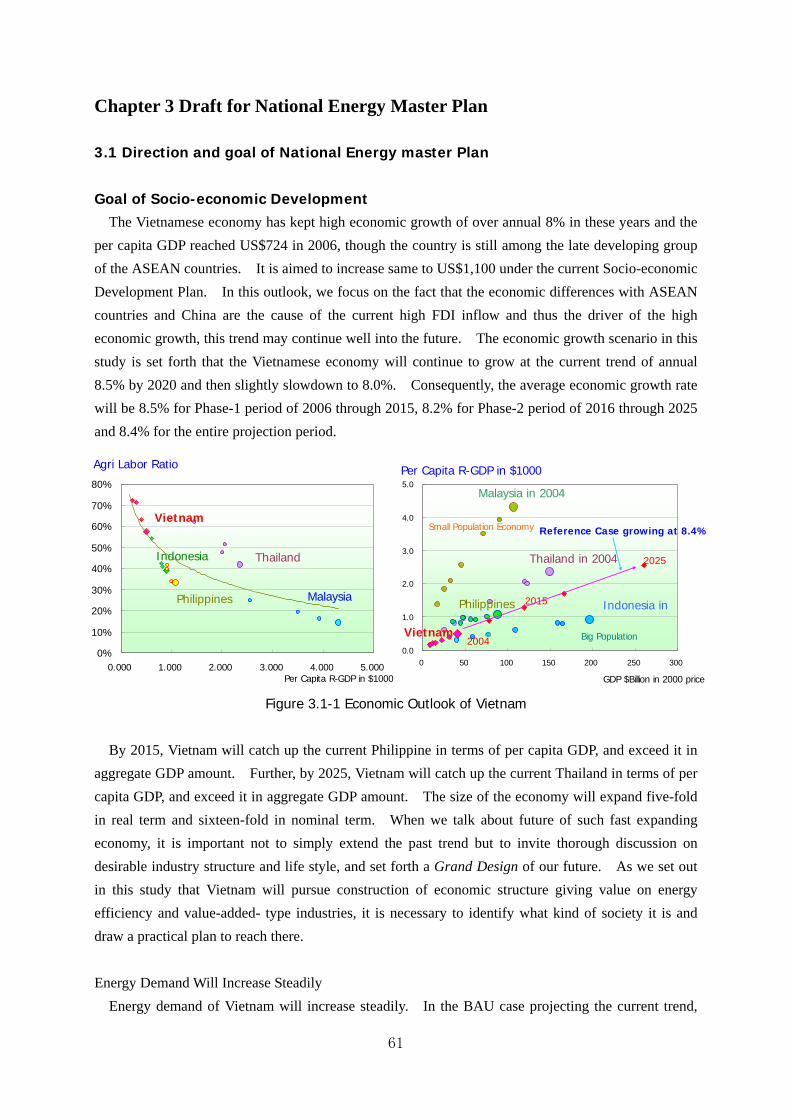
61
0%
10%
20%
30%
40%
50%
60%
70%
80%
0.000 1.000 2.000 3.000 4.000 5.000
Malaysia
ThailandIndonesia
Philippines
Vietnam
Per Capita R-GDP in $1000
Agri Labor Ratio
0.0
1.0
2.0
3.0
4.0
5.0
0 50 100 150 200 250 300
GDP $Billion in 2000 price
2025
Malaysia in 2004
Thailand in 2004
Indonesia inPhilippines
Vietnam
Per Capita R-GDP in $1000
Small Population Economy
Big Population
2015
2004
Reference Case growing at 8.4%
Chapter 3 Draft for National Energy Master Plan
3.1 Direction and goal of National Energy master Plan
Goal of Socio-economic Development The Vietnamese economy has kept high economic growth of over annual 8% in these years and the
per capita GDP reached US$724 in 2006, though the country is still among the late developing group
of the ASEAN countries. It is aimed to increase same to US$1,100 under the current Socio-economic
Development Plan. In this outlook, we focus on the fact that the economic differences with ASEAN
countries and China are the cause of the current high FDI inflow and thus the driver of the high
economic growth, this trend may continue well into the future. The economic growth scenario in this
study is set forth that the Vietnamese economy will continue to grow at the current trend of annual
8.5% by 2020 and then slightly slowdown to 8.0%. Consequently, the average economic growth rate
will be 8.5% for Phase-1 period of 2006 through 2015, 8.2% for Phase-2 period of 2016 through 2025
and 8.4% for the entire projection period.
Figure 3.1-1 Economic Outlook of Vietnam
By 2015, Vietnam will catch up the current Philippine in terms of per capita GDP, and exceed it in
aggregate GDP amount. Further, by 2025, Vietnam will catch up the current Thailand in terms of per
capita GDP, and exceed it in aggregate GDP amount. The size of the economy will expand five-fold
in real term and sixteen-fold in nominal term. When we talk about future of such fast expanding
economy, it is important not to simply extend the past trend but to invite thorough discussion on
desirable industry structure and life style, and set forth a Grand Design of our future. As we set out
in this study that Vietnam will pursue construction of economic structure giving value on energy
efficiency and value-added- type industries, it is necessary to identify what kind of society it is and
draw a practical plan to reach there.
Energy Demand Will Increase Steadily
Energy demand of Vietnam will increase steadily. In the BAU case projecting the current trend,

62
final energy consumption will increase from 22.6 million toe in 2005 to 118.2 million toe in 2025.
However, to realize sustainable development under the circumstance that the world energy supply is
turning tighter, it is necessary to establish development strategy that makes it possible to avoid the
situation that energy demand increase would become serious constraints.
Figure 3.1-2 Outlook of Final Energy Demand
Under the circumstance, we set out the standard scenario (Reference Case) for the draft National
Energy Master Plan that, compared to the BAU Case, energy conservation efforts should be enhanced
to curb demand increase. Even in this case, the final energy demand will increase four-fold by 2025.
If possible, it is desirable to realize Super EEC.
Among energy types, electricity and oil will share the core part of energy demand in line with
modernization of life and industry. Gas demand will also increase as clean and convenient fuel.
Coal consumption will also increase in the industrial sector, while it may decline in the household
sector. The non-commercial energy currently sharing 1/3 of the energy consumption would not
decrease in absolute volume, but will sharply decrease its share.
Figure 3.1-3 Final Energy Demand by Energy Type
0
5
10
15
20
25
30
35
40
45
50
1990 1995 2000 2005 2010 2015 2020 20250.0%
10.0%
20.0%
30.0%
40.0%
50.0%Coal
Oil
Natural Gas
Power
Non-C
Power Ratio
Million TOE Power Ratio
0
20
40
60
80
100
120
140
160
2005 2010 2015 2020 2025
BAU Reference Super EEC
2005 2015 2025 15/05 25/15 25/05MTOE MTOE MTOE % % %
BAU 22.6 51.4 118.2 8.6 8.7 8.6Reference 22.6 46.7 90.7 7.5 6.9 7.2Super EEC 22.6 44.0 77.4 6.9 5.8 6.3
Million TOE

63
0.0
0.5
1.0
1.5
2.0
2.5
0.0 1.0 2.0 3.0 4.0
Chin
PDP6 Pre-Study
Malaysia in 1995Thailand in 2004
Indonesia
PhilippinesVietnam
Per Capita R-GDP in $1000
Per Capita Energy Consumption in TOE
Energy Intensive Economy
Light Energy Economy
Reference Case
BAU Case
-27.5%
2004
0.0
0.5
1.0
1.5
2.0
2.5
3.0
3.5
4.0
4.5
0.0 2.0 4.0
China
Per Capita Power Genration in 1000 kWH
PDP6 Pre-Study
Malaysia in 1995Thailand in 2004
Indonesia
PhilippinesVietnam
Per Capita R-GDP in $1000
Electricity Intensive Economy
Light Energy Economy
BAU Case
High Price
Reference Case
High Growth (9.5%)
ASEAN Trend
-27%
Table 3.1-1 Final Energy Demand Outlook
When we compare the above energy outlook with ASEAN countries, in terms of total energy
consumption, the demand of the Reference Case slightly undershoots the trend of ASEAN countries.
However, while substantially lower than the previous forecasts, electricity demand trend of Vietnam
still overshoot the ASEAN trend considerably. In Vietnam, electricity used to be supplied at
relatively cheaper tariff based on the abundant hydropower while supply system of other modern
energies such as petroleum products and city gas were poor. It is one of the important energy issues
how to improve the resultant high electricity consumption rate.
Figure 3.1-4 International Comparison of Energy Demand
In the other sectors, large increases are forecast in the less energy intensive general manufacturing
industry and the residential and commercial sectors. In these general manufacturing industries,
however, although energy intensity is low, its energy demand growth rate will be highest among
sectors reaching almost annual 10%. In these industries where energy is not the main input,
electricity and gas will be preferred as they are clean and convenient to use. Then, we should note
2005 2010 2015 2020 2025 15/05 25/15 25/05MTOE MTOE MTOE MTOE MTOE % % %
Coal 6.1 7.7 9.6 12.0 14.1 4.5 4.0 4.2Oil (incl. LPG) 11.3 16.2 22.6 31.8 43.0 7.2 6.6 6.9Natural Gas 1.3 1.9 3.2 5.5 8.3 9.8 10.0 9.9Electricity 3.9 7.4 11.4 17.5 25.2 11.2 8.3 9.8Commercial Energ 22.6 33.2 46.7 66.9 90.7 7.5 6.9 7.2Non-Commercial 14.7 14.3 13.9 13.3 12.1 -0.6 -1.4 -1.0
Total 37.3 47.5 60.6 80.2 102.8 5.0 5.4 5.2% % % % % % % %
Coal 27.1 23.2 20.4 18.0 15.5 -2.8 -2.7 -2.7 Oil (incl. LPG) 49.9 48.9 48.4 47.6 47.4 -0.3 -0.2 -0.3 Natural Gas 5.6 5.8 6.9 8.3 9.2 2.1 3.0 2.6Electricity 17.4 22.2 24.3 26.2 27.8 3.4 1.4 2.4Commercial Energ 100.0 100.0 100.0 100.0 100.0 0.0 0.0 0.0Non-Commercial 65.0 43.1 29.8 19.9 13.4 -7.5 -7.7 -7.6 Electricity Ratio 17.4% 22.2% 24.3% 26.2% 27.8% 3.4 1.4 2.4

64
that energy conservation might not be given priorities. In order to forecast energy demand trend in
these sectors and make appropriate supply plans, it is important to draw the Grand Design of the
industry structure with regard to what type of economic structure Vietnam should aim at and which
sector Vietnam should give priority in the future economic development.
Table 3.1-2 Final Energy Demand by Sector
Vietnam will become a Net Energy Importing Country around 2015 The primary energy supply excluding the non-commercial energy would increase during the
Phase-1 period up to 2015 from 28.2 million toe in 2005 to 5.82 million toe in 2015 or 2.2 fold, and
further expand double in the Pahse-2 up to 2025 to reach 117 million toe. Fossil fuels such as coal,
oil and gas are supposed to supply the major portion of it. It is not easy to materialize such huge
increase of energy supply. On top of it, the big structural change facing Vietnam is that the country is
going to shift from an energy exporting to an energy importing country.
At present, Vietnam is a net energy exporting country selling coal and crude oils in the
international market. However, while the domestic energy demand is forecast to increase
dramatically, the indigenous energy production would be maturing due to constraints of the energy
resources. As a result, Vietnam is anticipated to turn into an energy net import country at around
2015 as follows.
2005 2010 2015 2020 2025 05-15 15-25 05-25kTOE kTOE kTOE kTOE kTOE % % %
Final Demand (excl. Non-Com) 22,590 33,199 46,717 66,880 90,655 7.5 6.9 7.2Agriculture 570 716 830 946 1,159 3.8 3.4 3.6Industry 10,549 15,540 23,038 35,705 49,957 8.1 8.0 8.1
Materials 5,626 8,903 14,452 24,822 36,661 9.9 9.8 9.8Non-materials 4,922 6,638 8,586 10,883 13,296 5.7 4.5 5.1
Transportation 6,687 9,592 12,708 16,549 20,781 6.6 5.0 5.8Commercial & Services 1,322 1,874 2,410 2,974 3,868 6.2 4.8 5.5Residentail & Others 3,462 5,477 7,731 10,706 14,890 8.4 6.8 7.6
Composition % % % % %
Agriculture 2.5 2.2 1.8 1.4 1.3Industry 46.7 46.8 49.3 53.4 55.1
Materials 24.9 26.8 30.9 37.1 40.4Non-materials 21.8 20.0 18.4 16.3 14.7
Transportation 29.6 28.9 27.2 24.7 22.9Commercial & Services 5.9 5.6 5.2 4.4 4.3Residentail & Others 15.3 16.5 16.5 16.0 16.4
Total 100.0 100.0 100.0 100.0 100.0

65
Figure 3.1-5 Primary Energy Consumption of Vietnam (Reference Case)
Table 3.1-3 Import Dependence Ratio of Energy
Vietnam may turn into a net energy importing country around 2015 and its import dependence
would further progress as the domestic energy demand increases. In the BAU case, it would increase
closer to 50% by 2025. This is a particularly serious issue in view of stable energy supply as well as
national security. In this consideration, the Reference Case is set forth in this study in which energy
conservation should be thoroughly promoted and the energy import dependence should be controlled
at around 1/3 in 2025. Nevertheless, the increasing trend of import dependence continues to be
dominant in the background. We need to project the long-term energy plan with a definite
assumption that the energy structure of Vietnam shall turn into an import dependent type.
0
20
40
60
80
100
120
140
1990 1995 2000 2005 2010 2015 2020 2025
Non-CommercialNRE
Power Import
Nuclear
Hydro
Natural Gas
LPG
Oil
Coal
Million toe
2005 to 2025Total 301%Non-Commercial 82%Commercial 416%
Primary EP 712%
Natural Gas 390%
LPG 459%
Oil 370%
Coal 443%
Domestic SupplyCoal Production increased 19.6MMt between 2003 and 2006.
Commercial Energy Demand
2005 2010 2015 2020 2025Net Import MTOE MTOE MTOE MTOE MTOE
Coal -9.2 -12.1 -9.5 -7.5 0.9Oil -7.5 -3.5 5.7 14.6 26.8Natural Gas 0.0 0.0 0.0 0.0 6.2Power 0.0 0.4 0.7 2.1 2.1
Total -16.6 -15.1 -3.1 9.2 36.0Import Ratio % % % % %
Refference -58.8% -37.6% -5.3% 11.1% 30.8% BAU -58.8% -35.9% 4.3% 27.3% 49.8%
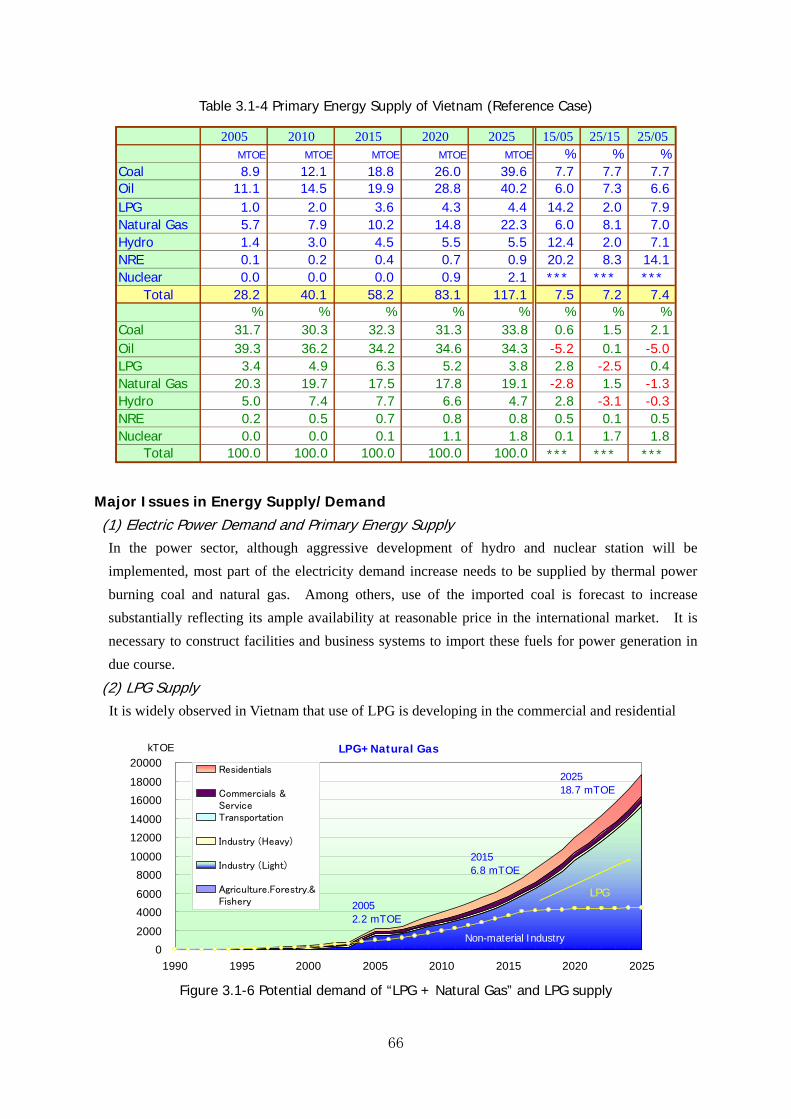
66
Table 3.1-4 Primary Energy Supply of Vietnam (Reference Case)
Major Issues in Energy Supply/Demand
(1) Electric Power Demand and Primary Energy Supply In the power sector, although aggressive development of hydro and nuclear station will be
implemented, most part of the electricity demand increase needs to be supplied by thermal power
burning coal and natural gas. Among others, use of the imported coal is forecast to increase
substantially reflecting its ample availability at reasonable price in the international market. It is
necessary to construct facilities and business systems to import these fuels for power generation in
due course.
(2) LPG Supply It is widely observed in Vietnam that use of LPG is developing in the commercial and residential
Figure 3.1-6 Potential demand of “LPG + Natural Gas” and LPG supply
0
2000
4000
6000
8000
10000
12000
14000
16000
18000
20000
1990 1995 2000 2005 2010 2015 2020 2025
Residentials
Commercials &Service Transportation
Industry (Heavy)
Industry (Light)
Agriculture.Forestry.&Fishery
kTOE
20052.2 mTOE
20156.8 mTOE
202518.7 mTOE
Non-material Industry
LPG
LPG+Natural Gas
2005 2010 2015 2020 2025 15/05 25/15 25/05MTOE MTOE MTOE MTOE MTOE % % %
Coal 8.9 12.1 18.8 26.0 39.6 7.7 7.7 7.7Oil 11.1 14.5 19.9 28.8 40.2 6.0 7.3 6.6LPG 1.0 2.0 3.6 4.3 4.4 14.2 2.0 7.9Natural Gas 5.7 7.9 10.2 14.8 22.3 6.0 8.1 7.0Hydro 1.4 3.0 4.5 5.5 5.5 12.4 2.0 7.1NRE 0.1 0.2 0.4 0.7 0.9 20.2 8.3 14.1Nuclear 0.0 0.0 0.0 0.9 2.1 *** *** ***
Total 28.2 40.1 58.2 83.1 117.1 7.5 7.2 7.4% % % % % % % %
Coal 31.7 30.3 32.3 31.3 33.8 0.6 1.5 2.1Oil 39.3 36.2 34.2 34.6 34.3 -5.2 0.1 -5.0 LPG 3.4 4.9 6.3 5.2 3.8 2.8 -2.5 0.4Natural Gas 20.3 19.7 17.5 17.8 19.1 -2.8 1.5 -1.3 Hydro 5.0 7.4 7.7 6.6 4.7 2.8 -3.1 -0.3 NRE 0.2 0.5 0.7 0.8 0.8 0.5 0.1 0.5Nuclear 0.0 0.0 0.1 1.1 1.8 0.1 1.7 1.8
Total 100.0 100.0 100.0 100.0 100.0 *** *** ***
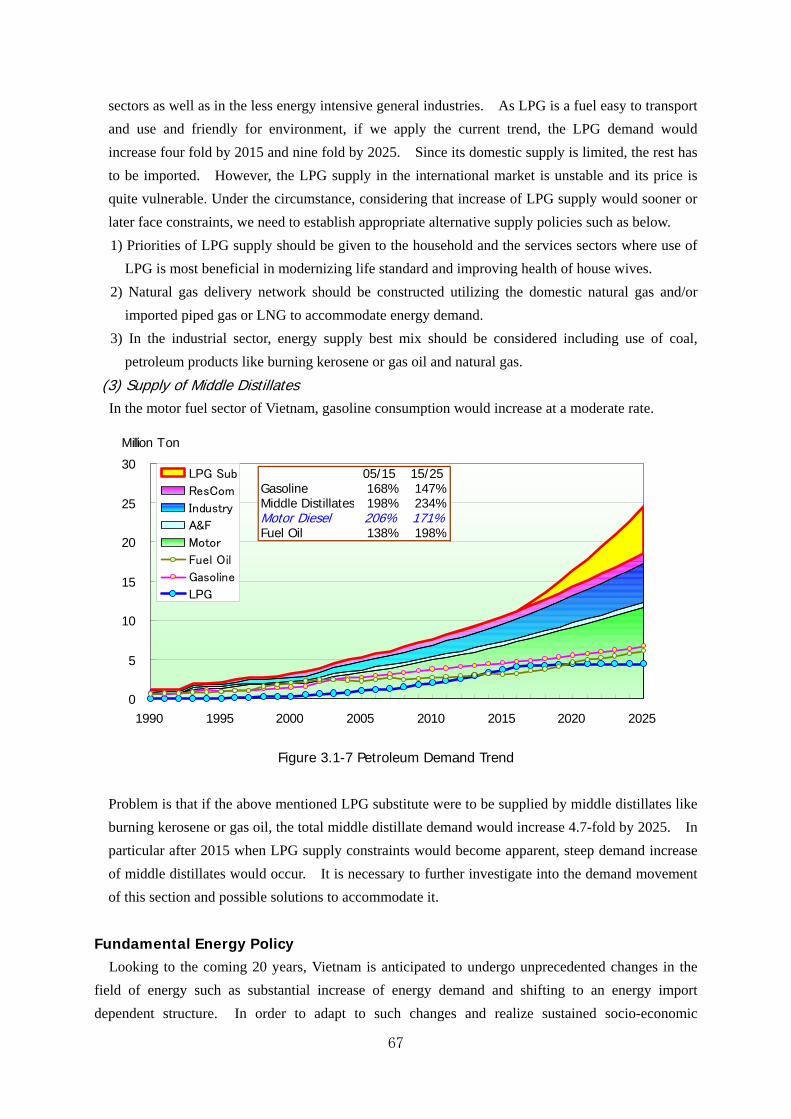
67
sectors as well as in the less energy intensive general industries. As LPG is a fuel easy to transport
and use and friendly for environment, if we apply the current trend, the LPG demand would
increase four fold by 2015 and nine fold by 2025. Since its domestic supply is limited, the rest has
to be imported. However, the LPG supply in the international market is unstable and its price is
quite vulnerable. Under the circumstance, considering that increase of LPG supply would sooner or
later face constraints, we need to establish appropriate alternative supply policies such as below.
1) Priorities of LPG supply should be given to the household and the services sectors where use of
LPG is most beneficial in modernizing life standard and improving health of house wives.
2) Natural gas delivery network should be constructed utilizing the domestic natural gas and/or
imported piped gas or LNG to accommodate energy demand.
3) In the industrial sector, energy supply best mix should be considered including use of coal,
petroleum products like burning kerosene or gas oil and natural gas.
(3) Supply of Middle Distillates In the motor fuel sector of Vietnam, gasoline consumption would increase at a moderate rate.
Figure 3.1-7 Petroleum Demand Trend
Problem is that if the above mentioned LPG substitute were to be supplied by middle distillates like
burning kerosene or gas oil, the total middle distillate demand would increase 4.7-fold by 2025. In
particular after 2015 when LPG supply constraints would become apparent, steep demand increase
of middle distillates would occur. It is necessary to further investigate into the demand movement
of this section and possible solutions to accommodate it.
Fundamental Energy Policy Looking to the coming 20 years, Vietnam is anticipated to undergo unprecedented changes in the
field of energy such as substantial increase of energy demand and shifting to an energy import
dependent structure. In order to adapt to such changes and realize sustained socio-economic
0
5
10
15
20
25
30
1990 1995 2000 2005 2010 2015 2020 2025
LPG Sub
ResCom
Industry
A&F
Motor
Fuel Oil
Gasoline
LPG
Million Ton
05/15 15/25Gasoline 168% 147%Middle Distillates 198% 234%Motor Diesel 206% 171%Fuel Oil 138% 198%

68
development, the following five policies shall be set forth as the fundamental objectives of the
National Energy Master Plan.
1) Promotion of energy efficiency and conservation
2) Construction of reliable and efficient energy supply system
3) Securing stable energy import and reinforcement of energy security
4) Energy sector reform and modernization of energy market
5) Establishment of measures to raise fund necessary for implementation of energy policies
3.2 Roadmap for the Fundamental Energy Policy The fundamental objectives of the energy policy set out as above may be classified into the
following three categories.
1) Measures to implement the comprehensive energy policy
2) Promotion of energy efficiency and conservation
3) Modernization of the energy market and energy industry policy
On the above each category, we will try to identify important measures to be promoted and propose
roadmaps to implement them. Required investment amount in each sector will also be presented.
Comprehensive Energy Policy Energy is an essential material being used in every sector of the economy and it is indispensable for
socio-economic development to secure stable energy supply. To secure this requirement, it is
considered necessary to establish an institutional system to implement consistent and coherent energy
policies taking the following measures.
1) Establish the organization responsible for energy policy planning
2) Review the long term energy outlook and set forth the fundamental energy policy
3) Review or newly set up laws and regulations and responsible organizations for implementation
of energy policy
In order to implement energy supply stabilization policy, it is necessary to secure the fund to back
up the construction of energy infrastructure and provide subsidies as a part of energy policy campaign,
though it is also important to mobilize the vital power of the private sector. The followings may
show candidate sources for such fund.
1) Fund from OPA/PPP for sub-commercial projects
2) Fund generated under international schemes such as CDM
3) Fund procured through issuance of national bond
4) Tax on energy such as petroleum product tax
Among the above candidates, various conditions are put on those provided from overseas. As they
should be properly expended subject to the purposes and supply conditions, it is not possible to meet
all requirements by these funds being provided under certain conditions, since, for example,
construction of energy infrastructure may require huge investments but some of them might not
qualify for the international aid criteria. While such fund is presently being procured through
issuance of national bond, it may be appropriate to consider generating funds through taxation on

69
energy, as widely adopted in developed countries, with due consideration on the tax bearing capacity
of the society.
Figure 3.2-1 Roadmap-1: Construction of System for Comprehensive Energy Policy and Its
Implementation
Promotion of Energy Efficiency and Conservation In the draft Energy Master Plan, the target energy efficiency and conservation is set forth to reduce
the energy consumption by 10% in 2015 and 25% plus in 2025 compared with the amount forecast in
the BAU Case. This is a very ambitious plan to reduce the primary energy consumption form 161
million toe of the BAU Case to 117 million. Considering the current oil production level of Vietnam
being at 17.0 million tons, achievement of this target is a big business compares to discoveries of huge
oil fields. However, since effect of energy conservation efforts can be obtained only cumulatively, it
is required to steadily pile up daily persevering efforts. The proposed roadmap for achievement of
→ → → → → 15 → → → → → → 25
1. System for Comprehensive Energy Planning and Implementation
1) Energy policy Planning System ○
x Office in charge and Responsib → Intermediate Evaluationx Inter-ministry and Advisory Committees ↓ Review Review Review
2) National Energy master Plan ◎ ● ◎ ● ◎ ● ◎
x National Energy Database →
x Forming of drafting team →
x Study on relevant plans at various offices
x Setting forth Fundamental Energy Policy Review Review Review3) Laws and Regulations ◎ → → → ◎ → → → ◎ → → → ◎
x Energy industry policy →
x Energy Efficiency and Conservation →
x Policies on environment and transpo→
2. Fund Preparation for Implementing Energy Policy
1) Estimation of Business Plans and Budget ◎
x Government role in energy & en →
x Examination of project plans at → →
x Classification of fund source and pr →
2) Taxation Method
x Review of international examples ○
x Evaluation and selection of taxation →
x Preparation of institution and facilit → → Stage -13) Stage-1 ◎
x Preparation of laws and regulations → → Intermediate Evaluation Intermediate Evaluation4) Evaluation and Review ● ●
x Impact on economy → →
x Rewuirement by energy and environment policy →
x Review of institution → → Stage-25) Moving to Stage-2 → ◎
Phase-1 Phase-22010 2020

70
the foregoing target is shown as follows.
Figure 3.2-2 Road map 2: Promotion of Energy Efficiency and Conservation
Modernization of Energy Sector and Energy Industry Policy For the purpose to secure stable and sufficient balance of energy demand and supply and improve
energy efficiency, while the country’s energy sector transforms from energy exporting to importing
structure, core principles of the national energy policy shall be changed from those of state controlled
to market controlled and create/modernize the energy market.
To this end, identifying the role of government sector as the national leader to show the grand
design of social development and the regulation administration and the role of the private sector as
active players in the market, appropriate measures should be taken in the following areas.
1) Government roles and businesses in the energy sector
2) Energy sector reform and modernization
3) Energy price policy to promote rational and efficient energy market
→ → → → → 15 → → → → → → 25
1.Building of energy data base system
Revision Revision
1)Institutional building for data base ◎ ◎ ◎
*Authorized structure and organization
Interim evaluation Interim evaluation Interim evaluation
2)Grasp the structure of energy consumption ◎ ● ● ●
*Actual energy consumption survey by sector
*Analysis and conclusion of the actual base
Revision Revision Revision
3)Energy intensity management and maintenance ◎ ◎ ◎ ◎
*Intensive of energy intensity by sector
*Technological data collection
*Evaluation on measures and set up the target
2.Energy efficiency and conservation
Interim evaluation
1)Maintenance of legal frame work ◎ ●
*Publication of EE & C Law
*Set up the authorized organization
*Planning for the activites Interim evaluation
2)Maintenance of System and Program ◎ ●
*Survey on systems of advanced countries
*Evaluation and selection of EE&C system
*Finalization of system and work program Phase 1
3)Implementaion of the Pase 1 ◎
*Operation of the rules and regulations Interim evaluation Interim evaluation
4)Evaluation and revision ● ●
*Evaluation on social-economic Impact
*Review of policy and envoronmental issues*Evaluation and revision of the system Phase 2
5) Transition to Phase 2 ◎
2010 2020Phase-1 Phase-2

71
Figure 3.2-3 Road map 3: Modernization of Energy Market and Energy Industry Policy
Major Investment in the Energy Sector Preliminary amount and timing of required investments in energy facilities of coal, power, oil, and
renewable energy sector are examined as shown in Figure 3.2-4. Required investment of the
facilities to meet the future energy demand is calculated based on the Reference Case. Required
→ → → → → 15 → → → → → → 25
1. Government Businesses in the Energy Sector1)Work plan ◎
x List of candidate businesses →
x Project plan →
x Preparation of laws, regulations Stage-12)Stage-1 Projects → ● ◎
x Transportation Infrastructure → Ports, Pipelines, Transmission Lines, Railways, Highwaysx Energy Security → National Oil Stock Piling Stage-2
3)Stage-2 Projects ● → → → ◎
x Energy Infrastructure → Nuclear Power Station, LNGx Energy Security → Energy linkage with neighboring countries
2. Energy Sector Reform and Market Modernization1)Energy Sector Reform Basic Plan Evaluation Revision Evaluation Revision
x Role and Function of Public Entities ◎ ● ◎ ● ◎
x Nurturing Private Players → → → → → → →
2)Market Modernization Basic Plan Evaluation Stage-1 Stage-2x Fundamental Principles → ◎ → → ● ◎ ◎
x Time Schedule →
x Rules and Regulations → → → → → →
3. Efficient Energy Market and Price Policy Full Internationalization
1)Internationalization of Energy Price ● ◎
x Review on Tax and Subsidy →
x Time Schedule → Full Internationalization Revision2)Remuval of non-Tariff Barrier ● ◎ ● ◎
x Review of Product Standardx Any other barriers
4.1 Government business in the power sector Check&review Check&review Check&review
◎ → → ● → → ● → → ●
◎ → → ● → → ● → → ●
● ◎ ◎
4.2 Equitization and deregulation of entry barrier to the power industryUnbundling Power Generation Wholesale Retail Sales
● ● ●
2)Equitization of EVN ● Step-by-step privatization ◎ ◎
4.3 Efficient power Industry and Price Policy Market pricing for Market pricing for Cost-based power tariff Wholesale Retail Sales
1)Set up proper power tariff ● ● ●
Electrification Ratio
2)Universal service, especially for poverty gro ◎ ◎
Phase-1 Phase-22010 2020
90% 100%
1)Establishment of power systemdevelopment mechanism
2)Management of power systemdevelopment execution
3)Finance contribution to the powerprojects
1)Demarcation between regulatedand unregulated business domains
Management of financial resourcesfrom ODA and EVN asset equitization
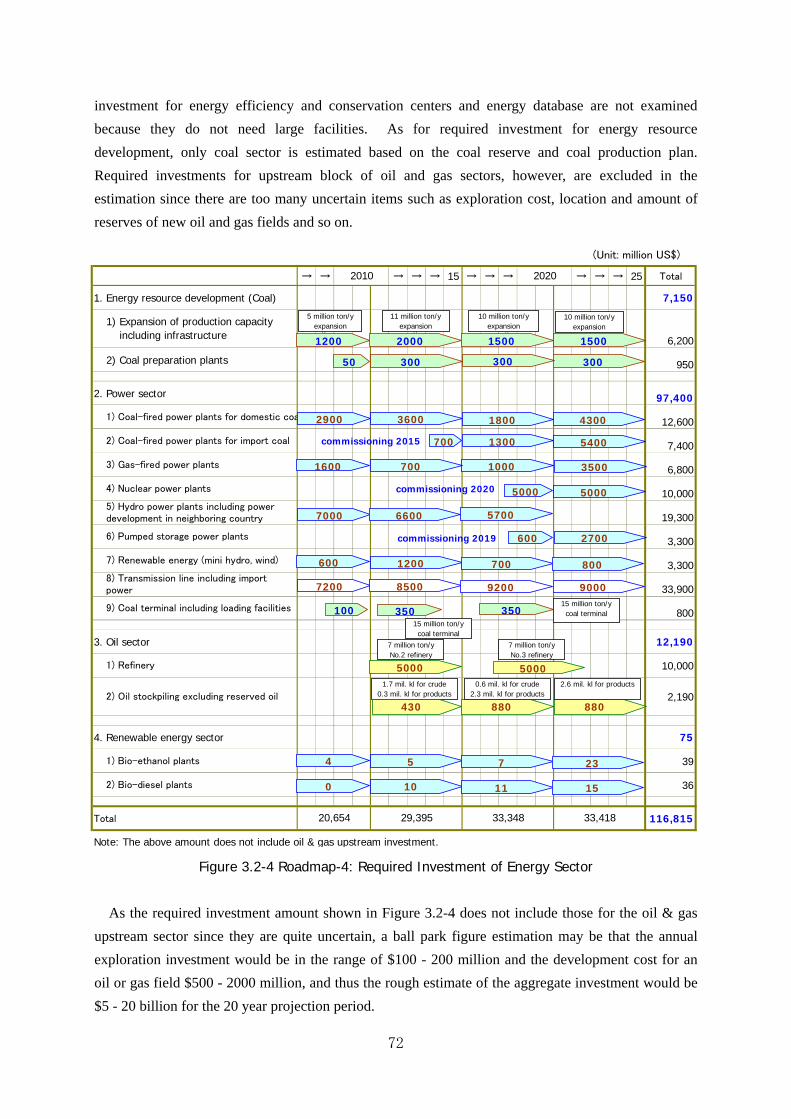
72
investment for energy efficiency and conservation centers and energy database are not examined
because they do not need large facilities. As for required investment for energy resource
development, only coal sector is estimated based on the coal reserve and coal production plan.
Required investments for upstream block of oil and gas sectors, however, are excluded in the
estimation since there are too many uncertain items such as exploration cost, location and amount of
reserves of new oil and gas fields and so on.
Figure 3.2-4 Roadmap-4: Required Investment of Energy Sector
As the required investment amount shown in Figure 3.2-4 does not include those for the oil & gas
upstream sector since they are quite uncertain, a ball park figure estimation may be that the annual
exploration investment would be in the range of $100 - 200 million and the development cost for an
oil or gas field $500 - 2000 million, and thus the rough estimate of the aggregate investment would be
$5 - 20 billion for the 20 year projection period.
(Unit: million US$)
→ → → → → 15 → → → → → → 25 Total
1. Energy resource development (Coal) 7,150
# # # #6,200
2) Coal preparation plants 50 # # # 950
2. Power sector 97,400
# # # # 12,600
# # # 7,400
# # # # 6,800
# # 10,000
# # # 19,300
# # 3,300
# # # # 3,300
# # # # 33,900
# 350 350 800
3. Oil sector 12,190
# # 10,000
# # # 2,190
4. Renewable energy sector 75
4 5 7 23 39
0 10 11 15 36
Total 116,815
Note: The above amount does not include oil & gas upstream investment.
1) Expansion of production capacity including infrastructure
1) Coal-fired power plants for domestic coa
2) Coal-fired power plants for import coal
2010 2020
20,654 29,395 33,348 33,418
3) Gas-fired power plants
4) Nuclear power plants
5) Hydro power plants including powerdevelopment in neighboring country
6) Pumped storage power plants
2) Oil stockpiling excluding reserved oil
1) Bio-ethanol plants
2) Bio-diesel plants
7) Renewable energy (mini hydro, wind)
8) Transmission line including importpower
9) Coal terminal including loading facilities
1) Refinery
1.7 mil. kl for crude0.3 mil. kl for products
1200 2000
30050
15 million ton/ycoal terminal
5 million ton/yexpansion
11 million ton/yexpansion
10 million ton/yexpansion
10 million ton/yexpansion
7 million ton/yNo.2 refinery
commissioning 2019
2900
commissioning 2015
3600
700
commissioning 2020
1500 1500
300300
43001800
54001300
350010007001600
50005000
7000 6600 5700
600 2700
7200
600 1200
8500
700
9200 9000
800
5000
430 880880
4 5 7 23
0 10 11 15
0.6 mil. kl for crude2.3 mil. kl for products
2.6 mil. kl for products
350 35015 million ton/ycoal terminal
100
5000
7 million ton/yNo.3 refinery
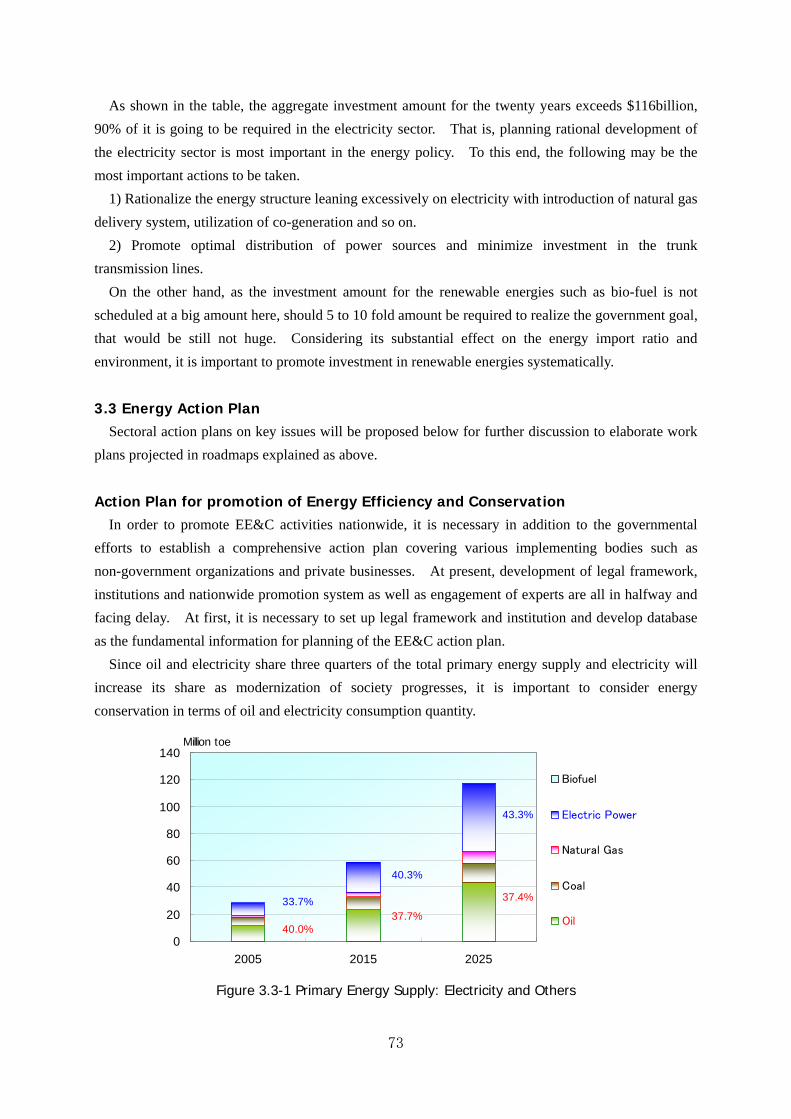
73
As shown in the table, the aggregate investment amount for the twenty years exceeds $116billion,
90% of it is going to be required in the electricity sector. That is, planning rational development of
the electricity sector is most important in the energy policy. To this end, the following may be the
most important actions to be taken.
1) Rationalize the energy structure leaning excessively on electricity with introduction of natural gas
delivery system, utilization of co-generation and so on.
2) Promote optimal distribution of power sources and minimize investment in the trunk
transmission lines.
On the other hand, as the investment amount for the renewable energies such as bio-fuel is not
scheduled at a big amount here, should 5 to 10 fold amount be required to realize the government goal,
that would be still not huge. Considering its substantial effect on the energy import ratio and
environment, it is important to promote investment in renewable energies systematically.
3.3 Energy Action Plan Sectoral action plans on key issues will be proposed below for further discussion to elaborate work
plans projected in roadmaps explained as above.
Action Plan for promotion of Energy Efficiency and Conservation
In order to promote EE&C activities nationwide, it is necessary in addition to the governmental
efforts to establish a comprehensive action plan covering various implementing bodies such as
non-government organizations and private businesses. At present, development of legal framework,
institutions and nationwide promotion system as well as engagement of experts are all in halfway and
facing delay. At first, it is necessary to set up legal framework and institution and develop database
as the fundamental information for planning of the EE&C action plan.
Since oil and electricity share three quarters of the total primary energy supply and electricity will
increase its share as modernization of society progresses, it is important to consider energy
conservation in terms of oil and electricity consumption quantity.
Figure 3.3-1 Primary Energy Supply: Electricity and Others
0
20
40
60
80
100
120
140
2005 2015 2025
Biofuel
Electric Power
Natural Gas
Coal
Oil
33.7%
40.0%
43.3%
37.4%
40.3%
37.7%
Million toe

74
Figure 3.3-2 Action plan for the Energy Efficiency and Conservation
Action Plan for Power Sector In the power sector, establishment of long-term development plan and its implementation is most
important to assure stable power supply. In order to secure efficient implementation, it is necessary
1. Government Level
1) Introduction of Laws and Systems
a) Energy Use Law
b)Energy ManagementSystem
c) Energy Service Business
2) Others
a) Educational Campains andPublic Relations
b) Standards Setting ofEnergy Efficiency
c) Technical Support forEfficiency Improvement
d) Selection of Energy SavingModel Case
e) Discussion of TransportSyetem and Environment
2. Private Sector Level
1) Household and Commercial Sector
a) Modification of Efficiencyand System for Instrument
b) Energy Saving of HE andDSM
c) Energy Saving of Buildings
2) Industrial Sector
a) High-Efficiency Instrument
b) Energy Saving ofInstrument
c) EMS
d)Energy Saving Technology
3) Transport Sector
a) Tranport Vehicle
b) Transport Plan and EMS
4) Machinary and Sales Sector
a) Energy Saving Information
b) Production Technology
ITEM 20252006 2010 2015 2020
Construction of Energy Saving Planand Bulding Database
Introduction of Qualification System against Specific EnergyConsumers
Clasification of Energy Consumption Efficiency and its Shareby Efficient Level
Introduction to Operation and Maintenance, and Ensuring ofEquipment Diagnosis
Replace of Gas Guzzling Cars and Introduction of FuelEfficient Cars
Application and Ensuring of Energy Saving Policies at Esch Stageof Plan, Design and Construction
Efficiency Improvement of Instrument such as Air Conditioning,Hot Water Supply and Lighting, and ensuring of BEMS and HEMS
Development of Transport Plan and Management and Modificationof Energy Useage
Introduction and Development of Production Technologies for High-Efficienct Equipment
Selection of EMS andEnergy Saving Projects
Introduction of Energy Saving and High Efficiency Type HomeElectronics and DSM
Introduction of ESCO Businesses Recognition System andits Reccommendation
Discussion of Environmentally-Friendly Transport System and FieldTest of Bio Fuel
Declaration of Standards Setting of Energy Efficiency andProvision of Energy Saving Information
Increasing of Public Awareness on Efficient Utilization of Energy andEnergy Saving
Introduction
Start-up
Modification and Replacement of Equipment and Instrument for high-Efficiency
Energy Saving Countermeasurs for Compressed Air, Steam, AirCondition, Boiler and Industrial Furnace, etc
Introduction
Introduction
1st Stage 2nd Stage
Evaluation& Review
Evaluation& Review
Collection Domestic andForeign Data and
Introduction of New and Energy Saving Technologies
Review

75
to progress industry reform/deregulation and pricing policy in an appropriate manner.
Figure 3.3-3 Action Plan of Power Sector
Coal Sector While most of the coal supply in Vietnam comes from domestic sources at present, it is necessary to
construct new coal supply system to correspond to future demand increase. In construction of such
system, it is necessary to consider the following features. Firstly, almost of the domestic resources
and production are centered in Quang Ninh Province in the north, secondly coal demand also is
2010 2015 2020 2025
Formation of Reliable Power Supply System
(1) Formation of strong organizational structures
①Adoption of rolling plan system
②Project progress management
③Effective use of financial resources
(2) Expansion of power infrastructures and their operations
①Hydropower
②Coal thermal
③Gas thermal
Generation by domestic gas
④Nuclear power
⑤Pumped storage power
⑥Renewable power
⑦Power import
⑧Network development
(3) Human resource development
Deregulation and Power Industry Development Policy
(1) Promotion of deregulation
①Private investors participation
(2) Staged formation of power market
①Power market development
②Organization development
(3) Structuring reform of EVN
Power Pricing Policy
(1) Proper power tariff setting
(2) Provision of universal services
①Promotion of rural electrification
Generation by domestic coal
Generation by import coal
Generation by import gas
Review of power development plan in every 1-2 years
Stable development of hydro potential
Infrastructure development for transport
Stable development of power plants as planned
Stable development of power plants as planned
Study for LNG & pipeline
Sseaports & power plants dev.
Locational research (incl. EIA)
Commencement◎ Second projects
Contract negotiation
Contract negotiation
Selection of projects to be developed by ODA & self-financing
Clarification of participation rules
Commencement◎
Curriculum and rules and organization development
Commencement◎
Expansion of power network and capacity increase
Study on backbone transmission lines
Construction
Second dev.
Second dev.Study, design
ConstructionStudy, design
Public acceptance, security, international cooperation
RE M/P Development (small hydro, wind, biomass)
Development by private investors
Generation Competition◎
Wholesale Competition◎
Retail Competition◎
Establishment of MO, SO, Strengthening of regulatory authority
Privatization & restruturing of EVN group
Household electrification rate 90%◎
Household electrification rate100%◎
Competition base tariff settingCost base tariff setting
Check & review Check & review
Rules for rural electrification in deregulation process、financial resource mobilization, implementation
Risk mitigation for private investors
Supervision of project progress, proposal of countermeasures for delayed projects
Construction of terminals and power plants
Project development (Lao PDR and Cambodia), Import capacity increase (China)

76
centered in the northern provinces while some are developing in the central and southern provinces,
and thirdly the coal quality may be divided into two, namely, domestic coal and imported coal.
Regional feature of coal demand/supply balance may be described that domestic coal will be
supplied to both power generation and general industry in the north, mix of domestic and import coal
for power generation in the central, and mainly import coal for power generation in the south. While
domestic coal will be supplied utilizing the existing system to the maximum extent in the north,
construction of import-coal burning power stations is scheduled in the central and southern regions so
that new coal supply system should be constructed to accommodate them.
Figure 3.3-4 Action Plan on the Coal Sector
Development Plan
(1) Coal Reserves
(2)Private and ForeignCapital and Advanced
(3)Coal Development andExport
(4) Coal Mine Safety
(5) Coal Preparation
(6) Bio Coal Briquttee
(7) Environment Protection
(8)Overseas Coal Equity andCoal distributionship to VN
(9)Import CoalTransshipment Station
(10)Next GenerationCombussion Technology
Industrial Policy
(1)Entry of and Authorizationto Private and Foreign
(2)Privatization of CoalMining Companies
(3)Low Interest LoanProgram
(4)Clean Coal TechnologyCenter
(5)Educational Activity forEnergy Conservtion
Price Policy
(1) Liberalization of Coal Price
(2)Internationalization of coalPrice
(3)Tariff Rates on CoalExport and Import
(4) Exemption of the Tax
(5)Entry of Private andForeign Firms to Coal
ITEM 20252006 2010 2015 2020
Confirm Sufficient Economical Saleable Coal Reserves across the Country
Develop Coal to meet Domestic Demand and Continue Coal Export of Existing Long-termContracts
Process Alll Raw Coal Preparation
Acquire Overseas Coal Mine Equity and Coal Distributionship toVietnam that is Represented 50% of Coal Import
Establish the Center forClean Coal Technology
Enshure Positive Educational Activity for Replacing Old Instrumentsagainst Coal Consumers, and Introduce Low Interest Loan Program by
Introduce Low Interest Loan Program by Government for OverseasCoal Mine Equitry
Guratuated Entry of Private and Foreign Firms to Coal Industry and Giving Private andForeign Firms Exploration, Mineral and Mining Rights
Achieve Full Liberalization of CoalPrice and Trade by Market Price
Change Tariff Rates on Coal Exportand Import
Ensure Reduced Rates and Exemption to the Tax for a Limited Time againstPrivate and Foreign Firms
Promote Bio CoalBriquettee as
Introduce Capital and Advanced Technologies by Private andForeign Firms as a Result of Promoting Privatization of National
Enter Private and Foreign Firms, and Introduce Overseas Advanced Technologies to CoalIndustry
Strengthen Coal Mine Safety Training and Improve InjuryFrequency as same as Advanced Countries
Plan and Implement Complied with the Environment Standard which make considerationfor Natural and Living Environments on the Whole Coal Flow
Introduce Existing Advance Combussion Technologies, and FollowResearch and Development for the Next Generation Combussion
Exempt the Tax from intorducing Advanced Technologies and Instruments
Ensure Coal Trading based on theInternational Market Coal Price
Construct Import CoalCenter in Souther Region
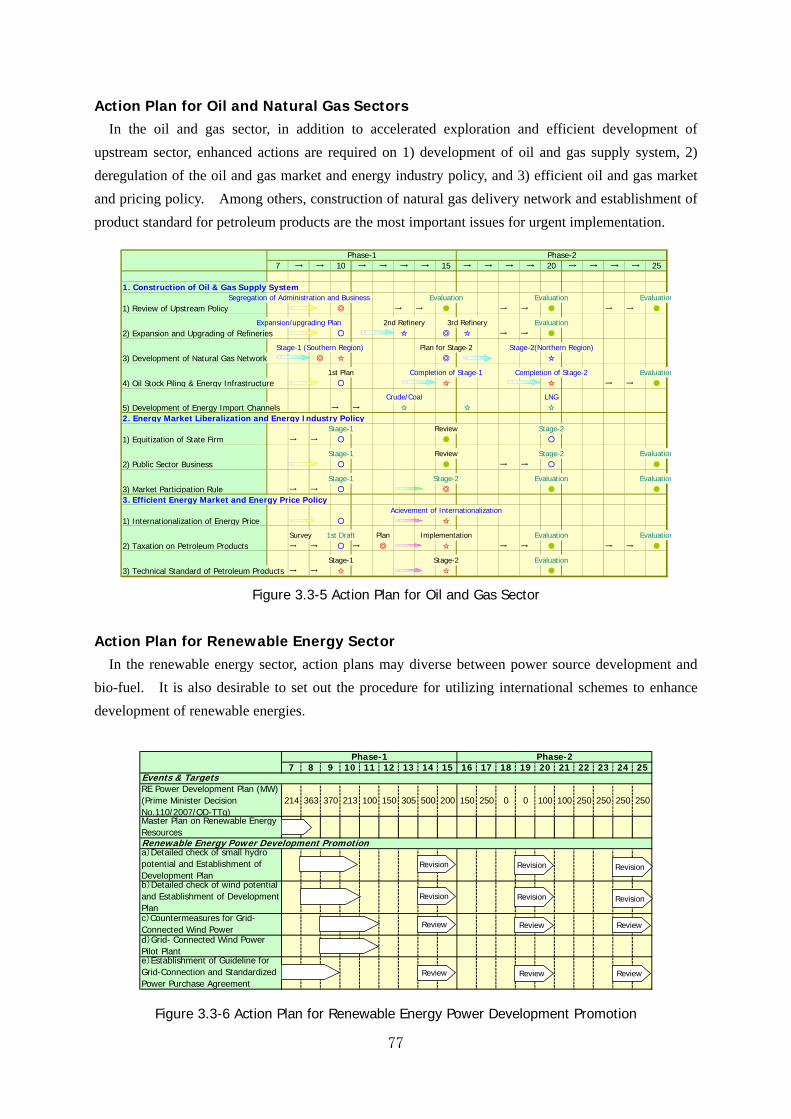
77
Action Plan for Oil and Natural Gas Sectors In the oil and gas sector, in addition to accelerated exploration and efficient development of
upstream sector, enhanced actions are required on 1) development of oil and gas supply system, 2)
deregulation of the oil and gas market and energy industry policy, and 3) efficient oil and gas market
and pricing policy. Among others, construction of natural gas delivery network and establishment of
product standard for petroleum products are the most important issues for urgent implementation.
Figure 3.3-5 Action Plan for Oil and Gas Sector
Action Plan for Renewable Energy Sector In the renewable energy sector, action plans may diverse between power source development and
bio-fuel. It is also desirable to set out the procedure for utilizing international schemes to enhance
development of renewable energies.
Figure 3.3-6 Action Plan for Renewable Energy Power Development Promotion
7 8 9 10 11 12 13 14 15 16 17 18 19 20 21 22 23 24 25
RE Power Development Plan (MW)(Prime Minister DecisionNo.110/2007/QD-TTg)
214 363 370 213 100 150 305 500 200 150 250 0 0 100 100 250 250 250 250
Master Plan on Renewable EnergyResources
a)Detailed check of small hydropotential and Establishment ofDevelopment Planb)Detailed check of wind potentialand Establishment of DevelopmentPlanc)Countermeasures for Grid-Connected Wind Powerd)Grid- Connected Wind PowerPilot Plante)Establishment of Guideline forGrid-Connection and StandardizedPower Purchase Agreement
Events & Targets
Phase-1 Phase-2
Renewable Energy Power Development Promotion
Revision
Review
Revision
Review
Revision
Revision Revision Revision
Review
Review Review Review
7 → → 10 → → → → 15 → → → → 20 → → → → 25
1. Construction of Oil & Gas Supply SystemSegregation of Administration and Business Evaluation Evaluation Evaluation
1) Review of Upstream Policy ◎ → → ● → → ● → → ●
Expansion/upgrading Plan 2nd Refinery 3rd Refinery Evaluation2) Expansion and Upgrading of Refineries ○ ☆ ◎ ☆ → → ●
Stage-1 (Southern Region) Plan for Stage-2 Stage-2(Northern Region)3) Development of Natural Gas Network ◎ ☆ ◎ ☆
1st Plan Completion of Stage-1 Completion of Stage-2 Evaluation4) Oil Stock Piling & Energy Infrastructure ○ ☆ ☆ → → ●
Crude/Coal LNG5) Development of Energy Import Channels → → ☆ ☆ ☆
2. Energy Market Liberalization and Energy Industry PolicyStage-1 Review Stage-2
1) Equitization of State Firm → → ○ ● ○
Stage-1 Review Stage-2 Evaluation2) Public Sector Business ○ ● → → ○ ●
Stage-1 Stage-2 Evaluation Evaluation3) Market Participation Rule → → ○ ◎ ● ●
3. Efficient Energy Market and Energy Price PolicyAcievement of Internationalization
1) Internationalization of Energy Price ○ ☆
Survey 1st Draft Plan Implementation Evaluation Evaluation2) Taxation on Petroleum Products → → ○ → ◎ ☆ → → ● → → ●
Stage-1 Stage-2 Evaluation3) Technical Standard of Petroleum Products → → ☆ ☆ ●
Phase-1 Phase-2
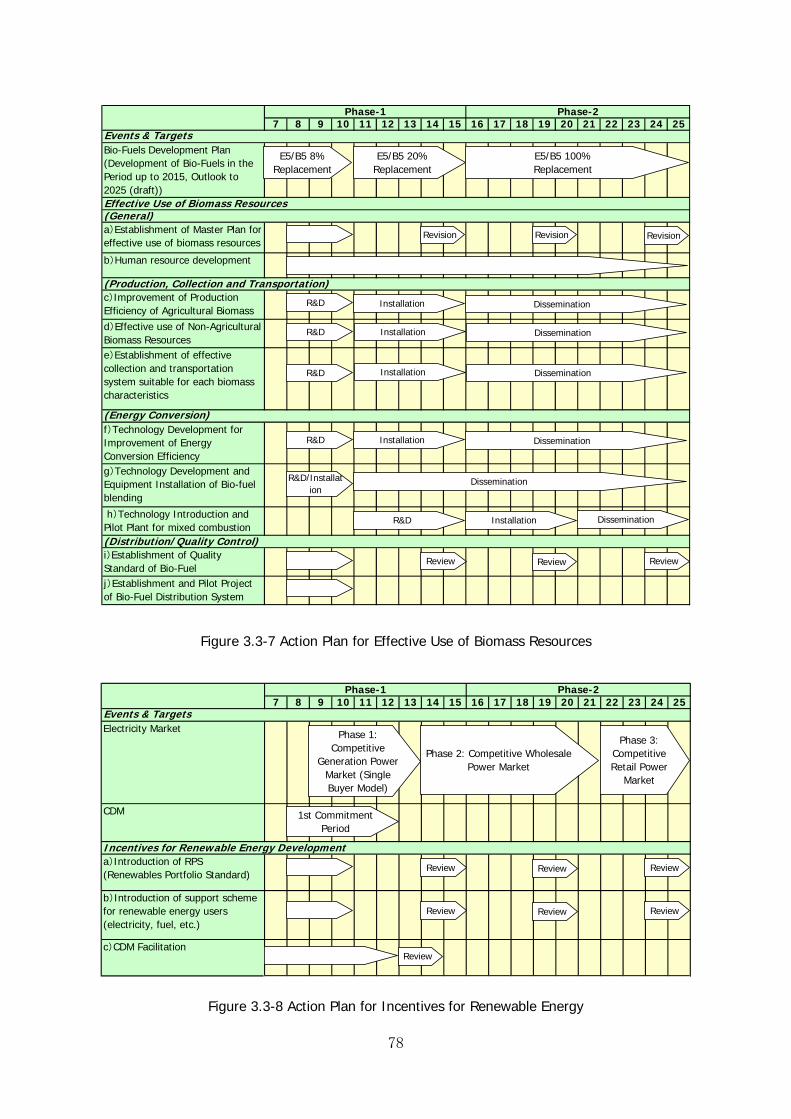
78
Figure 3.3-7 Action Plan for Effective Use of Biomass Resources
Figure 3.3-8 Action Plan for Incentives for Renewable Energy
7 8 9 10 11 12 13 14 15 16 17 18 19 20 21 22 23 24 25
Bio-Fuels Development Plan(Development of Bio-Fuels in thePeriod up to 2015, Outlook to2025 (draft))
a)Establishment of Master Plan foreffective use of biomass resources
b)Human resource development
c)Improvement of ProductionEfficiency of Agricultural Biomassd)Effective use of Non-AgriculturalBiomass Resourcese)Establishment of effectivecollection and transportationsystem suitable for each biomasscharacteristics
f)Technology Development forImprovement of EnergyConversion Efficiencyg)Technology Development andEquipment Installation of Bio-fuelblending
h)Technology Introduction andPilot Plant for mixed combustion
i)Establishment of QualityStandard of Bio-Fuelj)Establishment and Pilot Projectof Bio-Fuel Distribution System
Effective Use of Biomass Resources
Events & Targets
(Distribution/Quality Control)
(General)
(Production, Collection and Transportation)
(Energy Conversion)
Phase-1 Phase-2
E5/B5 8%Replacement
E5/B5 20%Replacement
E5/B5 100%Replacement
RevisionRevision Revision
Review Review Review
R&D/Installation
R&D
Dissemination
Installation
R&D
Dissemination
Installation Dissemination
R&D
R&D
R&D
Installation Dissemination
Installation Dissemination
Installation Dissemination
7 8 9 10 11 12 13 14 15 16 17 18 19 20 21 22 23 24 25
Electricity Market
CDM
a)Introduction of RPS(Renewables Portfolio Standard)
b)Introduction of support schemefor renewable energy users(electricity, fuel, etc.)
c)CDM Facilitation
Incentives for Renewable Energy Development
Events & Targets
Phase-1 Phase-2
1st CommitmentPeriod
Phase 1:Competitive
Generation PowerMarket (SingleBuyer Model)
Phase 2: Competitive WholesalePower Market
Phase 3:CompetitiveRetail Power
Market
Review
Review Review Review
Review Review Review

79
Construction of Energy Database In order to grasp the exact record of energy supply and demand for energy policy making, it is
highly important to create the National Energy Database. At present, there is no organization in
Vietnam responsible for comprehensive energy database. For creating energy database, it is
important to define the purpose of the database, necessary data items, and how to collect necessary
data and create institution and organization for management and maintenance of the database. In
view of the current administration system in Vietnam, collaboration of MOIT and GSO is
recommended. It is also important to pay attention to implementation possibility, operability and
confidentiality of the required work.
Figure 3.3-9 Action Plan for Energy Statistics Development
1Q 2Q 3Q 4Q 1Q 2Q 3Q 4Q 1Q 2Q 3Q 4Q 1Q 2Q 3Q 4Q
MOITEstablish neworganization in MOIT
MOITEstablish committee forenergy statistics
MOITGSO
Designated industries forquestionnaire survey
MOITGSO
Prepare questionnairesheet
GSOImplement questionnairesurvey
GSO Prepare monthly report
MOTIGSO
Sample survey forresidential & Commercial
MOITEstimation of energysupply & demand
MOIT Publish energy statistics
Technical Assistance forenergy estimation
2011 2012ItemOrg.
2009 2010

80
Closing Remarks In this study, we aimed to construct a comprehensive energy analysis model of Vietnam to project
long-term energy outlook and to produce an example of National Energy Master Plan through various
studies using the model. After the study of almost two years, we believe that we have successfully
achieved the original objective, yet there are many points to be improved. We hope that the system
shall be repeatedly tested and upgraded by the hands of Vietnamese colleagues.
At the workshop held on January 23, 2008, there were many opinions that we need to conduct
further analyses and studies to formulate a firm master plan. The study team also thinks that we need
additional studies, which may be classified into following categories.
Category-1: Further studies on important factors, preconditions and/or scenarios to be considered or
incorporated into the comprehensive energy plan.
Caterogy-2: Detail studies on sectoral demand and supply trends, which are important components
of sectoral plans as well as important elements of the overall national plan.
Category-3: In-depth analyses on various themes that should support sectoral plans.
In addition, because of time constraints, those changes that occurred after October 2007 are not
incorporated in the study, such as changes in the global economy and energy in particular abrupt rise
of crude oil price and financial instability that followed. Models also need to be reviewed to better
reflect the national and global change of circumstance. We hope that studies will be continued on
these points, since this report is just a starting point. We look forward to the day when people of
Vietnam will take in these models as your own tool, improve them and establish the process to
construct your own National Energy Master Plan.
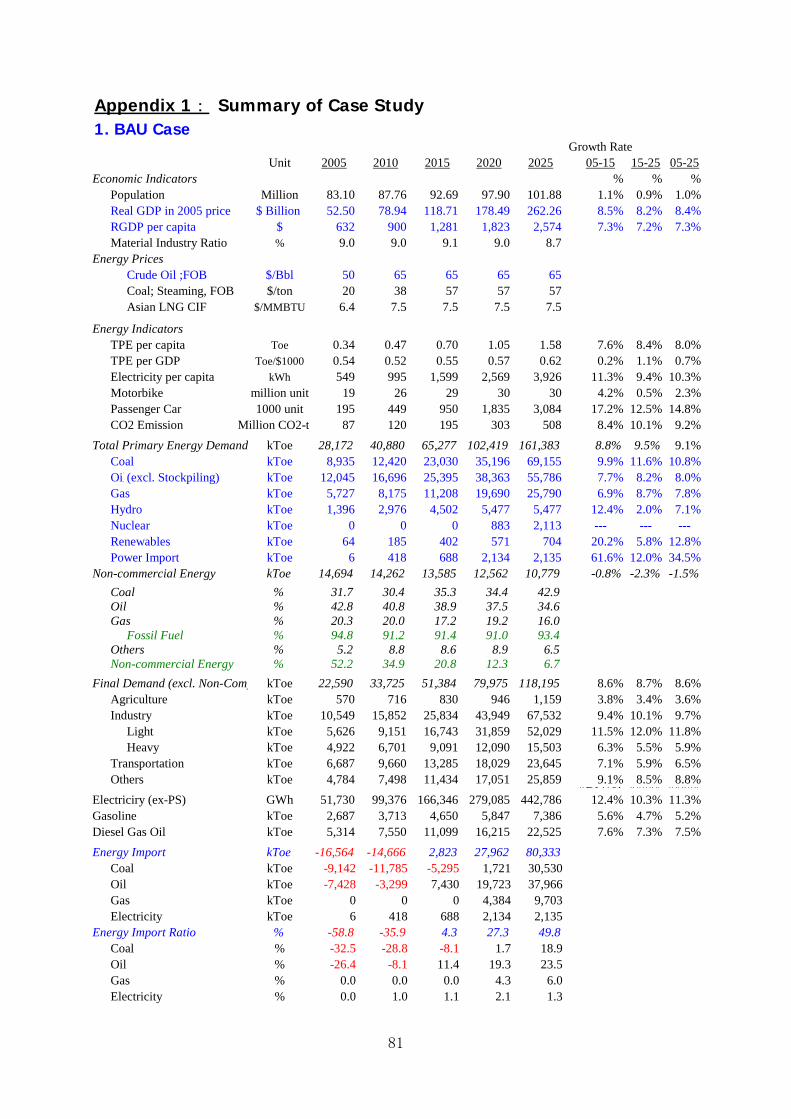
81
Appendix 1: Summary of Case Study 1. BAU Case
Growth RateUnit 2005 2010 2015 2020 2025 05-15 15-25 05-25
Economic Indicators % % %Population Million 83.10 87.76 92.69 97.90 101.88 1.1% 0.9% 1.0%Real GDP in 2005 price $ Billion 52.50 78.94 118.71 178.49 262.26 8.5% 8.2% 8.4%RGDP per capita $ 632 900 1,281 1,823 2,574 7.3% 7.2% 7.3%Material Industry Ratio % 9.0 9.0 9.1 9.0 8.7
Energy PricesCrude Oil ;FOB $/Bbl 50 65 65 65 65Coal; Steaming, FOB $/ton 20 38 57 57 57Asian LNG CIF $/MMBTU 6.4 7.5 7.5 7.5 7.5
Energy IndicatorsTPE per capita Toe 0.34 0.47 0.70 1.05 1.58 7.6% 8.4% 8.0%TPE per GDP Toe/$1000 0.54 0.52 0.55 0.57 0.62 0.2% 1.1% 0.7%Electricity per capita kWh 549 995 1,599 2,569 3,926 11.3% 9.4% 10.3%Motorbike million unit 19 26 29 30 30 4.2% 0.5% 2.3%Passenger Car 1000 unit 195 449 950 1,835 3,084 17.2% 12.5% 14.8%CO2 Emission Million CO2-t 87 120 195 303 508 8.4% 10.1% 9.2%
Total Primary Energy Demand kToe 28,172 40,880 65,277 102,419 161,383 8.8% 9.5% 9.1%Coal kToe 8,935 12,420 23,030 35,196 69,155 9.9% 11.6% 10.8%Oil(excl. Stockpiling) kToe 12,045 16,696 25,395 38,363 55,786 7.7% 8.2% 8.0%Gas kToe 5,727 8,175 11,208 19,690 25,790 6.9% 8.7% 7.8%Hydro kToe 1,396 2,976 4,502 5,477 5,477 12.4% 2.0% 7.1%Nuclear kToe 0 0 0 883 2,113 --- --- ---Renewables kToe 64 185 402 571 704 20.2% 5.8% 12.8%Power Import kToe 6 418 688 2,134 2,135 61.6% 12.0% 34.5%
Non-commercial Energy kToe 14,694 14,262 13,585 12,562 10,779 -0.8% -2.3% -1.5%
Coal % 31.7 30.4 35.3 34.4 42.9Oil % 42.8 40.8 38.9 37.5 34.6Gas % 20.3 20.0 17.2 19.2 16.0
Fossil Fuel % 94.8 91.2 91.4 91.0 93.4Others % 5.2 8.8 8.6 8.9 6.5Non-commercial Energy % 52.2 34.9 20.8 12.3 6.7
Final Demand (excl. Non-Com) kToe 22,590 33,725 51,384 79,975 118,195 8.6% 8.7% 8.6%Agriculture kToe 570 716 830 946 1,159 3.8% 3.4% 3.6%Industry kToe 10,549 15,852 25,834 43,949 67,532 9.4% 10.1% 9.7%
Light kToe 5,626 9,151 16,743 31,859 52,029 11.5% 12.0% 11.8%Heavy kToe 4,922 6,701 9,091 12,090 15,503 6.3% 5.5% 5.9%
Transportation kToe 6,687 9,660 13,285 18,029 23,645 7.1% 5.9% 6.5%Others kToe 4,784 7,498 11,434 17,051 25,859 9.1% 8.5% 8.8%#DIV/0! ##### #####
Electriciry (ex-PS) GWh 51,730 99,376 166,346 279,085 442,786 12.4% 10.3% 11.3%Gasoline kToe 2,687 3,713 4,650 5,847 7,386 5.6% 4.7% 5.2%Diesel Gas Oil kToe 5,314 7,550 11,099 16,215 22,525 7.6% 7.3% 7.5%
Energy Import kToe -16,564 -14,666 2,823 27,962 80,333Coal kToe -9,142 -11,785 -5,295 1,721 30,530Oil kToe -7,428 -3,299 7,430 19,723 37,966Gas kToe 0 0 0 4,384 9,703Electricity kToe 6 418 688 2,134 2,135
Energy Import Ratio % -58.8 -35.9 4.3 27.3 49.8Coal % -32.5 -28.8 -8.1 1.7 18.9Oil % -26.4 -8.1 11.4 19.3 23.5Gas % 0.0 0.0 0.0 4.3 6.0Electricity % 0.0 1.0 1.1 2.1 1.3
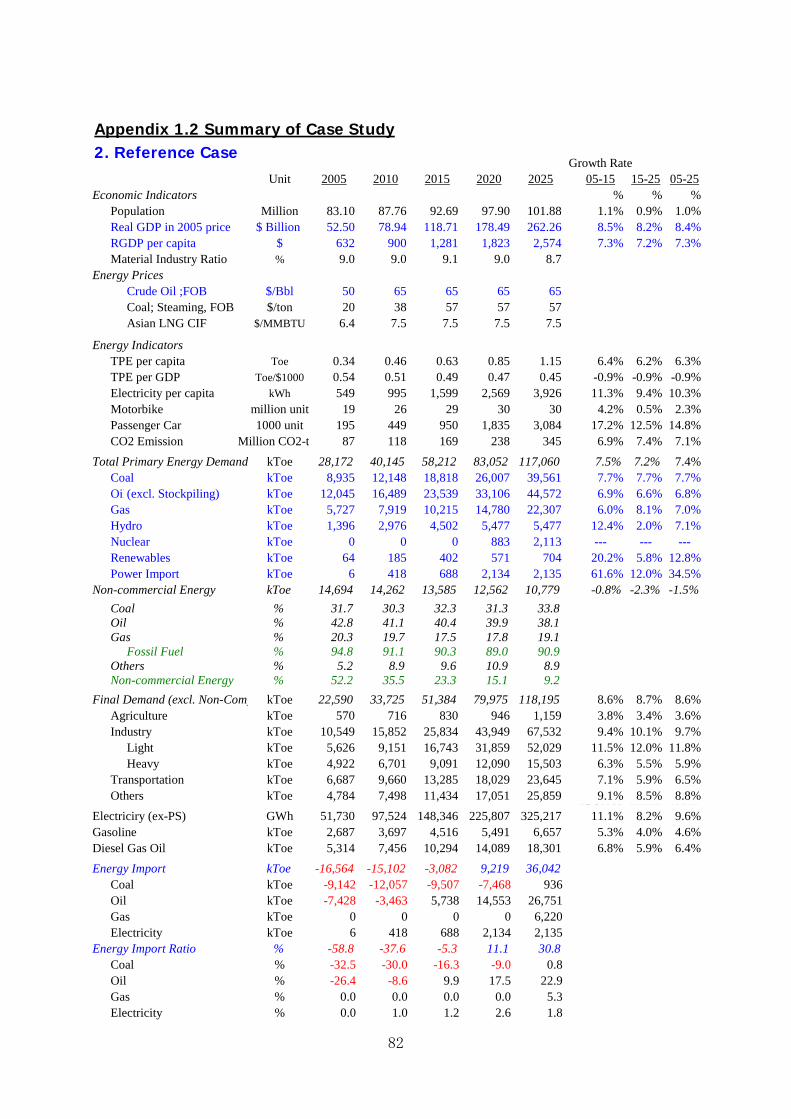
82
Appendix 1.2 Summary of Case Study 2. Reference Case
Growth RateUnit 2005 2010 2015 2020 2025 05-15 15-25 05-25
Economic Indicators % % %Population Million 83.10 87.76 92.69 97.90 101.88 1.1% 0.9% 1.0%Real GDP in 2005 price $ Billion 52.50 78.94 118.71 178.49 262.26 8.5% 8.2% 8.4%RGDP per capita $ 632 900 1,281 1,823 2,574 7.3% 7.2% 7.3%Material Industry Ratio % 9.0 9.0 9.1 9.0 8.7
Energy PricesCrude Oil ;FOB $/Bbl 50 65 65 65 65Coal; Steaming, FOB $/ton 20 38 57 57 57Asian LNG CIF $/MMBTU 6.4 7.5 7.5 7.5 7.5
Energy IndicatorsTPE per capita Toe 0.34 0.46 0.63 0.85 1.15 6.4% 6.2% 6.3%TPE per GDP Toe/$1000 0.54 0.51 0.49 0.47 0.45 -0.9% -0.9% -0.9%Electricity per capita kWh 549 995 1,599 2,569 3,926 11.3% 9.4% 10.3%Motorbike million unit 19 26 29 30 30 4.2% 0.5% 2.3%Passenger Car 1000 unit 195 449 950 1,835 3,084 17.2% 12.5% 14.8%CO2 Emission Million CO2-t 87 118 169 238 345 6.9% 7.4% 7.1%
Total Primary Energy Demand kToe 28,172 40,145 58,212 83,052 117,060 7.5% 7.2% 7.4%Coal kToe 8,935 12,148 18,818 26,007 39,561 7.7% 7.7% 7.7%Oil(excl. Stockpiling) kToe 12,045 16,489 23,539 33,106 44,572 6.9% 6.6% 6.8%Gas kToe 5,727 7,919 10,215 14,780 22,307 6.0% 8.1% 7.0%Hydro kToe 1,396 2,976 4,502 5,477 5,477 12.4% 2.0% 7.1%Nuclear kToe 0 0 0 883 2,113 --- --- ---Renewables kToe 64 185 402 571 704 20.2% 5.8% 12.8%Power Import kToe 6 418 688 2,134 2,135 61.6% 12.0% 34.5%
Non-commercial Energy kToe 14,694 14,262 13,585 12,562 10,779 -0.8% -2.3% -1.5%
Coal % 31.7 30.3 32.3 31.3 33.8Oil % 42.8 41.1 40.4 39.9 38.1Gas % 20.3 19.7 17.5 17.8 19.1
Fossil Fuel % 94.8 91.1 90.3 89.0 90.9Others % 5.2 8.9 9.6 10.9 8.9Non-commercial Energy % 52.2 35.5 23.3 15.1 9.2
Final Demand (excl. Non-Com) kToe 22,590 33,725 51,384 79,975 118,195 8.6% 8.7% 8.6%Agriculture kToe 570 716 830 946 1,159 3.8% 3.4% 3.6%Industry kToe 10,549 15,852 25,834 43,949 67,532 9.4% 10.1% 9.7%
Light kToe 5,626 9,151 16,743 31,859 52,029 11.5% 12.0% 11.8%Heavy kToe 4,922 6,701 9,091 12,090 15,503 6.3% 5.5% 5.9%
Transportation kToe 6,687 9,660 13,285 18,029 23,645 7.1% 5.9% 6.5%Others kToe 4,784 7,498 11,434 17,051 25,859 9.1% 8.5% 8.8%#DIV/0! ##### #####
Electriciry (ex-PS) GWh 51,730 97,524 148,346 225,807 325,217 11.1% 8.2% 9.6%Gasoline kToe 2,687 3,697 4,516 5,491 6,657 5.3% 4.0% 4.6%Diesel Gas Oil kToe 5,314 7,456 10,294 14,089 18,301 6.8% 5.9% 6.4%
Energy Import kToe -16,564 -15,102 -3,082 9,219 36,042Coal kToe -9,142 -12,057 -9,507 -7,468 936Oil kToe -7,428 -3,463 5,738 14,553 26,751Gas kToe 0 0 0 0 6,220Electricity kToe 6 418 688 2,134 2,135
Energy Import Ratio % -58.8 -37.6 -5.3 11.1 30.8Coal % -32.5 -30.0 -16.3 -9.0 0.8Oil % -26.4 -8.6 9.9 17.5 22.9Gas % 0.0 0.0 0.0 0.0 5.3Electricity % 0.0 1.0 1.2 2.6 1.8

83
Appendix 2: Sample of Summary Report Sheets 2.1 Overall energy Outlook: Reference Case
Note: Sample sheets are attached to illustrate items included in the summary sheets, while
estimation is made for all the years from 2005 through 2025. Please refer to annual
figures, if necessary, developed on the Excel spread sheet on computer screen.
reference Summary sheet Growth RateTERM 1 TERM 2 TERM 3 Unit 2005 2010 2015 2020 2025 10/05 15/10 20/15 25/20
Economic Indicat Exchange rate VND/US$ 15,959 16,856 17,947 19,610 21,168 1.1 1.3 1.8 1.5Population Million 83 88 93 98 102 1.1 1.1 1.1 0.8GDP at current price on US $ base Million US$ 52,502 100,022 189,032 348,122 634,122 13.8 13.6 13.0 12.7GDP at 2005 price on US $ base Million US$ 52,502 78,944 118,705 178,492 262,263 8.5 8.5 8.5 8.0GDP at 2005 price on VND base Trillion VND 838 1,260 1,894 2,848 4,185 8.5 8.5 8.5 8.0GDP per capita on 2005 US$ base US$/person 632 900 1,281 1,823 2,574 7.3 7.3 7.3 7.1Material Industry at 2005 price Trillion VND 76 114 173 256 362 8.5 8.8 8.1 7.2Material Industry Ratio % 9.0 9.0 9.1 9.0 8.7 0.0 0.2 -0.3 -0.7
Energy IndicatorsWorld Energy Price IEA Crude Oil FOB $/Bbl 49.9 65.0 65.0 65.0 65.0 5.4 0.0 0.0 0.0World Energy Price Coal FOB $/ton 19.7 38.1 56.5 56.5 56.5 14.1 8.2 0.0 0.0World Energy Price Asian LNG CIF $/MMBTU 6.4 7.5 7.5 7.5 7.5 3.2 0.0 0.0 0.0TPE per capita TOE / person 0.3 0.5 0.6 0.8 1.1 6.2 6.5 6.7 6.8TPE per GDP TOE/$1000 0.5 0.5 0.5 0.5 0.4 -1.1 -0.7 -0.6 -0.5Electricity per capita kWh / person 549 995 1,599 2,569 3,926 12.6 9.9 10.0 8.9
Vehicle number Motorbike 1000Unit 19,073 25,985 28,801 29,941 30,141 6.4 2.1 0.8 0.1Car 1000Unit 195 449 950 1,835 3,084 18.2 16.2 14.1 10.9Motorbike per personunit/1000psn 229.5 296.1 310.7 305.8 295.8 5.2 1.0 -0.3 -0.7Car per person unit/1000psn 2.3 5.1 10.2 18.7 30.3 16.9 14.9 12.8 10.1
Energy Efficiency Factor Industry (Light) % 100 94 88 83 79 -1.2 -1.3 -1.2 -1.1Industry (Heavy) % 100 93 83 74 67 -1.4 -2.3 -2.2 -2.1Commercial % 100 97 90 84 78 -0.7 -1.4 -1.4 -1.4Residential % 100 98 92 87 82 -0.4 -1.2 -1.2 -1.2
CO2 Emission CO2-Mton 87 118 169 238 345 6.3 7.5 7.0 7.7SO2-Kton 239 337 607 841 1114 7.1 12.5 6.8 5.8
Total Primary Energy Commercial Total kTOE 28,172 40,145 58,212 83,052 117,060 7 7.7 7.4 7.1Domestic Requirement Coal kTOE 8,935 12,148 18,818 26,007 39,561 6.3 9.1 6.7 8.8excluding Stockpiling Oil(incl.LPG) kTOE 12,045 16,489 23,539 33,106 44,572 6.5 7.4 7.1 6.1
Gas kTOE 5,727 7,919 10,215 14,780 22,307 6.7 5.2 7.7 8.6 Fossil total kTOE 26,707 36,556 52,572 73,893 106,439 6.5 7.5 7.0 7.6 Fossil rate % 94.8 91.1 90.3 89.0 90.9 -0.8 -0.2 -0.3 0.4
Hydro kTOE 1,396 2,976 4,502 5,477 5,477 16.3 8.6 4.0 0.0 Nuclear kTOE 0 0 0 883 2,113 0.0 0.0 0.0 19.1 Renewable EP kTOE 64 185 402 571 704 23.8 16.7 7.3 4.3 Import kTOE 6 418 688 2,134 2,135 136.2 10.5 25.4 0.0
EP Total kTOE 1,465 3,579 5,592 9,065 10,429 19.6 9.3 10.1 2.8Bio Fuel kTOE 0 9 48 94 191 0.0 39.2 14.2 15.3Non-Commercials kTOE 14,694 14,262 13,585 12,562 10,779 -0.6 -1.0 -1.6 -3.0Total kTOE 42,866 54,407 71,797 95,614 127,839 -0.6 -0.6 -0.9 -1.9
Final Energy Demand Total kTOE 22,590 33,725 51,384 79,975 118,195 8.3 8.8 9.3 8.1 Agricluture kTOE 570 716 830 946 1,159 4.6 3.0 2.6 4.2 Industry (Light) kTOE 5,626 9,151 16,743 31,859 52,029 10.2 12.8 13.7 10.3 Industry (Heavy) kTOE 4,922 6,701 9,091 12,090 15,503 6.4 6.3 5.9 5.1 Transportation kTOE 6,687 9,660 13,285 18,029 23,645 7.6 6.6 6.3 5.6 Commercial kTOE 1,322 1,913 2,724 3,723 5,362 7.7 7.3 6.4 7.6 Residential kTOE 3,341 5,434 8,508 13,058 20,142 10.2 9.4 8.9 9.1 Others kTOE 120 152 203 270 355 4.8 5.9 5.9 5.6
Energy Net Import Total kTOE -16,564 -15,102 -3,082 9,219 36,042 0.0 0.0 0.0 31.3 Coal kTOE -9,142 -12,057 -9,507 -7,468 936 0.0 0.0 0.0 0.0 Oil kTOE -7,428 -3,463 5,738 14,553 26,751 0.0 0.0 20.5 12.9 Gas kTOE 0 0 0 0 6,220 0.0 0.0 0.0 0.0 Electricity kTOE 6 418 688 2,134 2,135 136.2 10.5 25.4 0.0 (Electricity) GWh 66 4,858 7,997 24,815 24,830 136.3 10.5 25.4 0.0
Import Ratio Total % -58.8 -37.6 -5.3 11.1 30.8 0.0 0.0 0.0 22.6 (excl. oil stockpiling) Coal % -32.5 -30.0 -16.3 -9.0 0.8 0.0 0.0 0.0 0.0
Oil % -26.4 -8.6 9.9 17.5 22.9 0.0 0.0 12.2 5.5 Gas % 0.0 0.0 0.0 0.0 5.3 0.0 0.0 0.0 0.0 Electricity % 0.0 1.0 1.2 2.6 1.8 120.1 2.6 16.8 -6.6

84
2.2 Oil and Gas Sector Outlook: Reference Case
reference Oil and Gas Sector G R O W T H R ATERM 1 TERM 2 TERM 3 Unit 2005 2010 2015 2020 2025 10/05 15/10 20/15 25/20
Economic Indicat Population Million 83 88 93 98 102 1.1 1.1 1.1 0.8GDP at current price on US $ base Million US$ 52,502 100,022 189,032 348,122 634,122 13.8 13.6 13.0 12.7GDP at 2005 price on US $ base Million US$ 52,502 78,944 118,705 178,492 262,263 8.5 8.5 8.5 8.0GDP at 2005 price on VND base Trillion VND 838 1,260 1,894 2,848 4,185 8.5 8.5 8.5 8.0GDP per capita on 2005 US$ base US$/person 632 900 1,281 1,823 2,574 7.3 7.3 7.3 7.1Real Private consumption per capita US$/person 76 114 173 256 362 8.5 8.8 8.1 7.2Material Industry Ratio % 9.0 9.0 9.1 9.0 8.7 0.0 0.2 -0.3 -0.7
Energy IndicatorsWorld Energy Price IEA Crude Oil FOB $/Bbl 49.9 65.0 65.0 65.0 65.0 5.4 0.0 0.0 0.0World Energy Price Coal FOB $/ton 19.7 38.1 56.5 56.5 56.5 14.1 8.2 0.0 0.0World Energy Price Asian LNG CIF $/MMBTU 6.4 7.5 7.5 7.5 7.5 3.2 0.0 0.0 0.0TPE per capita TOE / person 0.3 0.5 0.6 0.8 1.1 6.2 6.5 6.2 6.3TPE per GDP TOE/$1000 0.5 0.5 0.5 0.5 0.4 -1.1 -0.7 -1.0 -0.8
Vehicle fuel per capita Do : Car & Bus per C Liter/Unit/Yea 3197 3150 3135 3126 3121 -0.3 -0.1 -0.1 0.0Gaso : Car per capitaLiter/Unit/Yea 1866 1805 1788 1777 1771 -0.7 -0.2 -0.1 -0.1Do : Truck per capita Liter/Unit/Yea 8745 8447 8369 8318 8291 -0.7 -0.2 -0.1 -0.1Gaso : Bike per capitaLiter/Unit/Yea 174 173 172 172 171 -0.2 -0.1 0.0 0.0
Vehicle number Motorbike 1000Unit 19,073 25,985 28,801 29,941 30,141 6.4 2.1 0.8 0.1Passenger Car 1000Unit 195 449 950 1,835 3,084 18.2 16.2 14.1 10.9
Tax on Oil products GasolineDOFOLPG
Oil sector Final oil demand Total kTOE 12,045 16,298 22,662 32,223 43,786 6.2 6.8 7.3 6.3 LPG kTOE 963 1,971 3,641 4,342 4,418 15.4 13.1 3.6 0.3 LPG substitute kTOE 0 0 0 2,133 5,937 0.0 0.0 0.0 22.7
including Bio-Fuel Gasoline kTOE 2,687 3,697 4,516 5,491 6,657 6.6 4.1 4.0 3.9 Kerosene kTOE 332 342 373 423 511 0.6 1.8 2.6 3.8 Jet fuel kTOE 534 736 1,031 1,415 1,872 6.6 7.0 6.5 5.8
including Bio-Fuel Diesel kTOE 5,314 7,456 10,294 14,089 18,301 7.0 6.7 6.5 5.4 General kTOE 5,149 7,456 10,294 14,089 18,301 7.7 6.7 6.5 5.4 EP kTOE 165 0 0 0 0 -100.0 0.0 0.0 0.0 Fuel oil kTOE 2,215 2,096 2,807 4,329 6,090 -1.1 6.0 9.1 7.1 General kTOE 1,616 2,020 2,742 3,939 5,295 4.6 6.3 7.5 6.1 EP kTOE 599 76 65 390 795 -33.8 -3.1 43.1 15.3
Crude oil Production kTOE 18,530 18,649 16,120 16,120 15,172 0.1 -2.9 0.0 -1.2(included condensatekTOE 613 848 1,094 1,582 1,722 6.7 5.2 7.7 1.7Import kTOE 0 1,208 3,813 7,043 7,805 0.0 25.8 13.1 2.1Processing kTOE 0 6,950 14,396 14,396 14,396 0.0 15.7 0.0 0.0StockPiling kTOE 0 1,208 90 2,277 3,039 0.0 -40.5 90.9 5.9Export KTOE 18,530 11,699 5,447 6,490 5,542 -8.8 -14.2 3.6 -3.1Net Balance KTOE 18,530 10,492 1,635 -553 -2,263 -10.8 -31.1 -180.5 0.0
Oil product net import Total KTOE 11,102 8,236 7,462 16,277 27,528 -5.8 -2.0 16.9 11.1 LPG KTOE 633 1,103 1,849 2,258 2,258 11.7 10.9 4.1 0.0 LPG substitute KTOE 0 0 0 2,133 5,937 0.0 0.0 0.0 22.7 Light Naptha KTOE 0 -90 -1,578 -1,853 -886 0.0 0.0 0.0 Gasoline KTOE 2,074 0 -889 0 0 -100.0 0.0 0.0 0.0 Kerosene KTOE 332 342 373 423 511 0.6 1.8 2.6 3.8 Jet fuel KTOE 534 294 245 630 1,087 -11.3 -3.5 20.8 11.5 Diesel KTOE 5,314 4,738 5,298 8,979 13,152 -2.3 2.3 11.1 7.9 Fuel oil KTOE 2,215 1,849 2,164 3,707 5,468 -3.6 3.2 11.4 8.1
Gas sector Demand Total KTOE 5,727 7,919 10,215 14,780 22,307 6.7 5.2 7.7 8.6 Power consumption KTOE 4,473 6,003 7,011 9,246 13,961 6.1 3.2 5.7 8.6 Others KTOE 1,254 1,916 3,204 5,534 8,346 8.8 10.8 11.6 8.6
Supply Total KTOE 5,727 7,919 10,215 14,780 22,307 6.7 5.2 7.7 8.6 Production KTOE 5,727 7,919 10,215 14,780 16,087 6.7 5.2 7.7 1.7 Import KTOE 0 0 0 0 6,220 0.0 0.0 0.0 0.0
LPG Sector Potential Demand KTOE 963 1,971 3,641 6,475 10,355 15.4 12.2 10.4 9.8Supply Supply Total kTOE 963 1,971 3,641 4,342 4,418 15.4 5.6 0.7 0.3
Production KTOE 330 868 1,792 2,084 2,159 21.4 15.6 3.1 0.7 Gas Field KTOE 330 456 588 851 926 6.7 5.2 7.7 1.7

85
2.3 Electric Power Sector Outlook: Reference Case
2.4 Coal and Renewable Energy Outlook: Reference Case
reference Coal & Renewable Energy Sector G R O W T H R ATERM 1 TERM 2 TERM 3 Unit 2005 2010 2015 2020 2025 10/05 15/10 20/15 25/20
Economic Indicat Population Million 83 88 93 98 102 1.1 1.1 1.1 0.8GDP at current price on US $ base Million US$ 52,502 100,022 189,032 348,122 634,122 13.8 13.6 13.0 12.7GDP at 2005 price on US $ base Million US$ 52,502 78,944 118,705 178,492 262,263 8.5 8.5 8.5 8.0GDP at 2005 price on VND base Trillion VND 838 1,260 1,894 2,848 4,185 8.5 8.5 8.5 8.0GDP per capita on 2005 US$ base US$/person 632 900 1,281 1,823 2,574 7.3 7.3 7.3 7.1Material Industry Ratio % 9.0 9.0 9.1 9.0 8.7 0.0 0.2 -0.3 -0.7
Energy IndicatorsWorld Energy Price IEA Crude Oil FOB $/Bbl 49.9 65.0 65.0 65.0 65.0 5.4 0.0 0.0 0.0World Energy Price Coal FOB $/ton 19.7 38.1 56.5 56.5 56.5 14.1 8.2 0.0 0.0World Energy Price Asian LNG CIF $/MMBTU 6.4 7.5 7.5 7.5 7.5 3.2 0.0 0.0 0.0TPE per capita TOE / person 0.3 0.5 0.6 0.8 1.1 6.2 6.5 6.2 6.3TPE per GDP TOE/$1000 0.5 0.5 0.5 0.5 0.4 -1.1 -0.7 -1.0 -0.8
Coal sector Demand Total 1000ton 31,882 42,739 51,125 62,880 81,726 6.0 8.1 4.5 4.0 Domestic use 1000ton 13,895 18,932 30,319 42,235 65,541 6.4 8.7 12.2 9.6 Power 1000ton 5,042 8,027 16,555 24,645 43,716 9.7 15.2 15.5 16.6 Domestic 1000ton 4,751 7,588 14,930 20,265 29,490 9.8 16.2 16.3 18.0 Import 1000ton 291 439 1,625 4,380 14,226 8.6 3.2 4.3 -3.0 other sectors 1000ton 8,853 10,905 13,764 17,591 21,825 4.3 4.8 10.4 6.0 Export 1000ton 17,987 23,807 20,806 20,645 16,185 5.8 7.6 -1.6 -2.2
Supply Total 1000ton 31,882 42,739 51,125 62,880 81,726 6.0 3.6 4.2 5.4 Production 1000ton 31,591 42,300 49,500 58,500 67,500 6.0 3.2 3.4 2.9 High quality coal 1000ton 8,775 11,750 13,750 16,250 18,750 6.0 3.2 3.4 2.9 Middle quality co 1000ton 15,795 21,150 24,750 29,250 33,750 6.0 3.2 3.4 2.9 Low quality coal 1000ton 7,020 9,400 11,000 13,000 15,000 6.0 3.2 3.4 2.9 Import 1000ton 291 439 1,625 4,380 14,226 8.6 29.9 21.9 26.6 Production KTOE 18,077 24,205 28,325 33,475 38,625 6.0 3.2 3.4 2.9
Renewable Power supply Total GWh 741 2,157 4,675 6,637 8,181 23.8 16.7 7.3 4.3Solar GWhWind GWhSmall Hydro GWhBiomass GWh
Fuel Supply Total 1000kl 0.0 33.6 89.1 176.3 448.8 21.5 14.6 20.5Bio-fuel(Etharnol) 1000kl 0.0 11.9 29.0 52.9 128.3 19.6 12.8 19.4Bio-fuel(Diesel) 1000kl 0.0 21.8 60.1 123.3 320.4 22.5 15.5 21.0ratio(Ethanol) % 0.0 5.0 10.0 15.0 30.0 14.9 8.4 14.9ratio(Diesel) % 0.0 0.0 5.0 7.5 10.0 0.0 8.4Bio-fuel(Etharnol) kTOE 0.0 9.2 22.6 41.2 99.9 19.6 12.8 19.4Bio-fuel(Diesel) kTOE 0.0 0.0 25.7 52.8 91.5 0.0 15.5 11.6
reference Electric Power Sector G R O W T H R ATERM 1 TERM 2 TERM 3 Unit 2005 2010 2015 2020 2025 10/05 15/10 20/15 25/20
Economic Indicat Population Million 83 88 93 98 102 1.1 1.1 1.1 0.8GDP at current price on US $ base Million US$ 52,502 100,022 189,032 348,122 634,122 13.8 13.6 13.0 12.7GDP at 2005 price on US $ base Million US$ 52,502 78,944 118,705 178,492 262,263 8.5 8.5 8.5 8.0GDP at 2005 price on VND base Trillion VND 838 1,260 1,894 2,848 4,185 8.5 8.5 8.5 8.0GDP per capita on 2005 US$ base US$/person 632 900 1,281 1,823 2,574 7.3 7.3 7.3 7.1Material Industry Ratio % 9.0 9.0 9.0 9.0 9.0 0.0 0.0 0.0 0.0
Energy IndicatorsPower Generation GWh 51,770 99,376 166,346 278,858 440,734 13.9 10.9 10.9 9.6Peak Demand (estimated) MW 8,443 16,206 27,128 45,476 71,874 13.9 10.9 10.9 9.6Electricity Tariff Agriculture use VND/kWh 660 1,012 1,118 1,236 1,365 8.9 2.0 2.0 2.0
Residential use VND/kWh 695 1,065 1,177 1,301 1,437 8.9 2.0 2.0 2.0Industry use VND/kWh 829 1,271 1,405 1,553 1,716 8.9 2.0 2.0 2.0Commercial use VND/kWh 1,359 2,083 2,302 2,544 2,811 8.9 2.0 2.0 2.0
Electricity per capita kWh/person 549 995 1,599 2,569 3,926 12.6 9.9 10.0 8.9
Sectoral Demand Total GWh 45,603 87,350 148,207 251,541 400,003 13.9 11.2 11.2 9.7 Agriculture GWh 574 1,034 1,441 1,916 2,683 12.5 6.9 5.9 7.0 Industry (Light) GWh 17,248 34,465 58,057 105,871 168,840 14.8 11.0 12.8 9.8 Industry (Heavy) GWh 4,054 6,172 9,357 13,654 18,920 8.8 8.7 7.9 6.7 Transportation GWh 337 745 1,216 1,971 3,010 17.2 10.3 10.2 8.8 Commercial GWh 2,162 4,659 8,683 14,599 24,859 16.6 13.3 11.0 11.2 Residential GWh 19,831 38,512 67,099 110,387 177,562 14.2 11.7 10.5 10.0 Others GWh 1,397 1,764 2,355 3,144 4,129 4.8 5.9 5.9 5.6
Power Supply Total GWh 51,730 97,524 148,346 225,807 325,217 13.5 8.8 8.8 7.6 Domestic Coal GWh 8,472 18,198 36,618 49,818 73,138 16.5 15.0 6.4 8.0 Imported Coal GWh 567 857 4,347 12,423 41,461 8.6 38.4 23.4 27.3 Oil GWh 2,174 269 230 2,149 4,162 -34.2 -3.0 56.3 14.1 Natural Gas GWh 23,480 36,582 42,128 56,007 85,186 9.3 2.9 5.9 8.7 Hydro GWh 16,230 34,604 52,351 63,689 63,691 16.3 8.6 4.0 0.0 Nuclear GWh 0 0 0 10,268 24,566 0.0 0.0 0.0 19.1 Renewables GWh 741 2,157 4,675 6,637 8,181 23.8 16.7 7.3 4.3 Power Import GWh 66 4,858 7,997 24,815 24,830 136.3 10.5 25.4 0.0
Power Capacity Total MW 11,001 21,380 30,674 41,025 57,420 14.2 13.0 9.8 11.2 Domestic Coal MW 1,345 3,865 7,075 8,675 12,470 23.5 22.7 14.8 23.5 Imported Coal MW 150 150 750 1,950 6,750 0.0 0.0 0.0 0.0 Oil MW 871 946 524 1,184 1,184 1.7 -8.7 0.3 0.3 Diesel MW 341 131 0 0 0 -17.4 -8.2 -7.2 -6.2 Natural Gas MW 4,089 6,484 7,534 9,034 14,284 9.7 6.8 1.2 5.1 Hydro MW 4154 9,337 13,524 16,465 16,465 17.6 19.7 16.4 13.2 Nuclear MW 0 0 0 2,000 4,000 0.0 0.0 0.0 0.0 Renewables MW 50 467 1,267 1,717 2,267 56.3 21.8 19.9 15.1