chapter 2 materials and methods -...
TRANSCRIPT
Materials and Methods
40
CHAPTER 2
Materials and Methods
2.1 Synthesis and physico-chemical characterization of of ZnO NCs
All chemicals used for the synthesis of ZnO Nanocrystals (NCs) were of
reagent grade and procured from Sigma Aldrich, USA. The synthesis of ZnO
NCs involves mainly the reaction of zinc salt with an alkali hydroxide in alcoholic
or aqueous medium. Depending on the size, shape and surface-chemistry
properties of NCs needed for the present study, we optimized six different
methods of synthesis.
2.1.1 Preparation of ~ 5 nm size NCs:
An ethoxyethanol route is selected for making fluorescent, 5 nm sized
crystalline ZnO quantum dots (1). In a typical preparation, 50 ml of 0.1 M of zinc
acetate dihydrate is made to react with 50 ml of 0.1 M of NaOH in ethoxyethanol
medium. The reaction mixture was stirred for 30 mins at ambient temperature.
The clear solution thus obtained was found to show bright fluorescence under UV
excitation, thereby indicating formation of ZnO NCs. The possible chemical
reaction is given below.
(CH3COO)2 Zn.2H2O + 2NaOH → Zn(OH)2+2CH3COONa +2H2O
Zn(OH)2 + 2MeOH → Zn2++ 2OH-+ 2MeOH
→ Zn(OH)42- + 2Me+
Zn(OH)42- → ZnO + H2O + 2OH-
Typically, 0.1M of zinc acetate was stirred in 25 ml of alcoholic solution
for 15-20 minutes and then .025 M of NaOH were allowed to dissolve
completely in 25 ml of alcoholic solution by constant stirring. After that both the
Materials and Methods
41
pre-cursor solutions were mixed well by stirring for about 30 min in order to get
the fine ZnO nano particles. Size tuning of these synthesized nano particles can
be done by repeating the same procedure by varying the molar concentration of
NaOH in the range 0.025 to .225 with a step increase of .025 each experiment.
2.1.2 Preparation of 200 nm size ZnO:
Forced hydrolysis of zinc acetate in diethylene glycol (DEG) at 160°C was
done as previously described (2). In a typical synthesis, 0.03 M zinc acetate was
added to 300 ml DEG. This solution was heated under reflux to 160°C. The
particle size and shape were controlled by optimising the precursor concentration
and hydrolysis ratio. The possible chemical reaction is given below.
Zn(CH3COO)2 + xH2O → Zn(OH-)x (CH3COO-)2-X + xCH3COOH (1)
Zn(OH-)X (CH3COO-)2-X→ Zno + (x-1) H2O+(2-x) CH3COOH (2)
(Adapted from Ref. 3)
In equation (1), Above 110º C the zinc acetate dehydrated and remove
acetic acid to form zinc hydroxyde. In equation (2), As zinc hydroxide phase is
not stable in higher temparature and further converted in to pure ZnO. Then the
reaction temperature was increased to 160 ºC and maintained for aging for 1 h.
After 1 hr the reaction mixture was cooled down to room temparature and washed
by repeated centfigugation and resuspended in distilled water for further analysis.
2.1.3 Starch coated ZnO NCs:
For starch coated samples, we followed aqueous phase synthesis as
reported by Vigneshwaran et al (4). In a typical preparation, 0.1 M zinc nitrate
hexahydrate was dissolved in 500 ml of 0.5% soluble starch solution by stirring.
After complete dissolution, 500 ml of 0.2 M sodium hydroxide solution was added
drop-wise under constant stirring. The reaction was allowed to proceed for 2 h
after the complete addition of sodium hydroxide. The solution was centrifuged
and washed with distilled water. After complete washing, ZnO NCs were dried at
80°C for 3 h. All synthesized particles were washed with ethanol and water to
Materials and Methods
42
remove unreacted molecules and by-products. The obtained precipitate was
redispersed in distilled water for toxicity studies. The possible chemical reaction
is given below.
Zn(NO3)2·6H2O + 2NaOH→ Zn(OH)2 + 2NaNO3 + 6H2O (1)
Zn(OH)2 + 2H2O →Zn2+ + 2OH− + 2H2O→Zn(OH)2−
4 + 2H+ (2)
Zn(OH)2− 4 →ZnO + H2O + 2OH−. (3)
(Adapted from Ref. 4)
2.1.4 Silica capped ZnO
In order to obtain silica capping on the surface of these NCs, a modified
Stöber method was followed (5) . Typically, ~ 200 µl of tetra-ethyl-ortho-silicate
(TEOS) solution was added to the as prepared ZnO nanocrystal solution with
stirring, followed by a step-wise addition of 500 µl water and 200 µl ammonia.
Formation of silica layer over ZnO was confirmed by FTIR.
2.1.5 PEGylated ZnO
Spherical nanoparticles of PEGylated ZnO NCs were synthesized by
reacting 0.1 M of zinc acetate dihydrate and 0.025-0.2 M of NaOH in methanol.
The reaction mixture was vigorously stirred for 20 min at ambient temperature
with polyethylene glycol (PEG) as a surfactant during synthesis. The amount of
added PEG per unit gm of ZnO was selected so as to get approximate monolayer
coverage over 40 nm size nanoparticles. A rough calculation will show that this
corresponds approximately to 0.1 g of PEG per gm of ZnO. There are reports that
PEG molecules link with ZnO through hydrogen bonding (6). In the present case,
PEG molecules with average molecular weight 8000 has a chain length of ~ 87
nm. The average surface area of a molecule of this length is about 19 nm2. The
surface area of a ZnO particle of size 40 nm is about 500 nm2, so that about 25
molecules of PEG is required to provide full surface coverage. This corresponds
to about 0.1 g PEG per gm ZnO. In order to remove the byproducts (sodium
acetate) the precipitate was washed several times with de-ionized water and then
re-dispersed in de-ionized water by ultrasonication.

Materials and Methods
43
2.1.6 ZnO nanorods
The ZnO nanorods were synthesized according to the method documented
in reference (7) with slight modification. Typically, 0.5M Zinc nitrate
hexahydrate was dissolved in 0.5 % soluble starch solution and 1M NaOH was
dissolved in deionized water. Under constant stirring, the zinc nitrate solution was
added slowly (drop wise for 30 min) to NaOH solution which was maintained at ~
70oC. After 2 h reaction time, the white precipitate deposited at the bottom of the
flask was collected and washed several times with absolute ethanol and distilled
water. ZnO samples were obtained by centrifugation and dehydration of the
precipitate in vacuum at 60–70 °C and finally re-dispersed in de-ionized water by
ultrasonication.
Zn(NO3)2·6H2O + 2NaOH = Zn(OH)2 (gel) + 2NaNO3 + 6H2O (1)
Zn(OH)2(gel)+ 2H2O →Zn2+ + 2OH− + 2H2O→Zn(OH)2−
4 + 2H+ (2)
Zn(OH)2− 4 = ZnO + H2O + 2OH−. (3)
In the above first reaction zinc nitrate reacted with sodium hydroxide and
form Zn(OH)2 colloids. In the second reaction scheme Zn(OH)2 get dissolved
and form Zn2+ and OH−. In the third reaction, when the concentration attained in
the supersaturation level, ZnO nuclei will form.
Figure 2.1. Schematic diagram depicting the growth scheme of ZnO nano rod by
the hydrothermal process (Adapted from Ref. 7).
Materials and Methods
44
2.1.7 physicochemical characterization
Nanoparticle size, shape and structure were characterized using scanning
electron microscope (JEOL, JSM-6490LA) and high resolution Transmission
electron microscope (JEOL-JEM-200CX). Crystallinity of the samples was
studied using an X–ray diffractometer [Rigaku Dmax-C] fitted with a Cu-Kα
source. The phase identification was carried out with the help of standard JCPDS
database. A Nicomp Particle Size Analyser (Nicomp 380, Particle Sizing
Systems, USA) was utilized for the particle size analysis, employing the technique
of Dynamic Light Scattering. The average particle size as well as dispersion in
size could be noted from this measurement. Zn2+ concentration and
microelectrode was used to detect extracellular pH variations.
2.2 Synthesis and physico-chemical characterization of graphene
2.2.1 Synthesis of graphene by arc-discharge method:
To prepare pristine graphene (p-G), direct current arc discharge of graphite
evaporation was carried out in a water-cooled stainless steel chamber filled with a
mixture of hydrogen and helium in different proportions without using any
catalyst (8). The proportion of H2:He used in our experiments is 200:500 torr. In a
typical experiment, a 6 mm wide and 50 mm long graphite rod (Alfa Aesar;
99.99% purity) was used as the anode and a 13 mm wide and 60 mm long graphite
rod was used as the cathode. The discharge current was 125 A, with an open
circuit voltage of 60 V. The arc was maintained by continuously translating the
cathode to maintain a constant distance of 2 mm from the anode. After the
chamber has cooled down to room temperature, p-G was collected from the inner
walls of the chamber and used for further characterization.
2.2.2 Surface functionalization:
The surface functionalization was carried out according to the method
documented in reference (9). Typically, as prepared graphene (25 mg) was
refluxed with dilute nitric acid (2 M) for ~12 h. The product was washed with
distilled water and centrifuged repeatedly to remove traces of acid. Graphene thus
obtained, functionalized with hydrophilic groups, could be dispersed in water or
physiological medium .
45
2.2.3 Labeling of f-G with Tc-DTPA Typically 4mg of f-G was dispersed in 2 ml of distilled water using probe sonication for 10 min. 2ml of 8mCi 99mTc-DTPA was added and again probe sonicated for 5 min and boiled this sol in water bath (90-95oC) for 1 hour. After this the solution was vortexed for 2 min. then centrifuged @14500 rpm/5min. Then the settled sample pellet was re-dispersed in 2 ml of distilled water and repeated the centrifugation to wash of the free Tc-DTPA. Finally the above obtained 99mTc-DTPA tagged FG pellet sample is dispersed in 2 ml of distilled water. 2.2.4 Physico-chemical characterization: Raman spectra was recorded using LabRAM HR High Resolution Raman spectrometer (Horiba Jobin Yvon, USA), with a He–Ne Laser (λ=632.8 nm). HR-TEM images were obtained with JEOL JEM 3010 (JEOL, Japan). AFM measurements were performed using a Dimension 3100 Nanoman AFM (Veeco, NY).
2.2.5 Contact angle measurement: Hydrophobic/hydrophilicity of pristine and COOH-functionalized graphene samples were obtained by measuring the contact angle of spreading sessile drops, with distilled water as the contacting solvent. A drop shape analyzing system (DSA 100 EasyDrop Contact Angle Measuring System, KRÜSS, Germany) was used to determine the surface contact angles. A 0.5-1.0 µl droplet of distilled water was suspended from the tip of the micro liter syringe. The syringe tip was advanced toward the disk surface until the droplets made contact with the disk surface. Images were collected using the attached CCD camera and contact angle between the drop and the substrate was measured from the magnified image. Three samples each from the different surface modification processes were used to collect the contact angle data. 2.3 Antibacterial activity studies The wild type Escherichia coli (W3110) was obtained from E.coli genetic stock center (Yale) and Staphylococcus aureus (ATCC 25923) was from the Microbiology Lab of Amrita Institute of Medical Sciences, Kochi, India. Luria-Bertani (LB) medium was used for growing and maintaining E.coli, while Brain Heart Infusion (BHI) broth (Himedia Laboratories, Mumbai, India) was used for S.aureus.
Materials and Methods
46
concentration of 106 colony-forming units per milliliter (CFU/ml) was inoculated
to 10 ml media. The culture tubes containing the nanoparticles were incubated
with shaking (200 rpm) in a water bath at 37 ºC. After 24 h, cell viability was
measured by serial dilution of the culture in 10 mM MgSO4, followed by plating
on solid media. The viable cell number was recorded by counting the number of
bacterial colonies grown on the plate multiplied by the dilution factor and
expressed as CFU/ml. The surface morphology of both treated and untreated
E.coli was studied using SEM.
2.3 Cell culture experiments
Human umbilical vein endothelial cells (HUVECs) were isolated and
cultured from the umbilical cord veins using the method of Baudin et al (10).
Umbilical cord was obtained from female donors after informed consent and
approval by the Institute Ethical Committee (IEC) at Amrita Institute of Medical
Sciences and Research Centre, Kochi, Kerala, India. In brief, the cords were
obtained in sterile Hanks Balanced Salt Solutions (HBSS) and washed thoroughly
with HBSS, cannulating the vein to wash out the blood within the lumen with
HBSS. Subsequently, the vein was filled with 0.1% Type I collagenase
(Invitrogen, USA) in HBSS (GIBCO, Invitrogen, USA) and incubated for 15 min
at 37 °C. Subsequently, the separated cells were collected by perfusion with HBSS
and washed in HBSS. The harvested cells resuspended in complete medium MI99
(GIBCO, Invitrogen) supplemented with 20 % Fetal Bovine Serum (GIBCO,
FBS), 50 IU/ml penicillin 50 µg/ml streptomycin and 50 µg/ml amphotericin and
50 µg/ml ECGF respectively. The HUVECs were culturing on the tissue flask
precoated with 2% gelatin (Sigma Aldrich, USA). The culture were incubated at
37oC under a humidified atmosphere with 5% CO2, confluent cells in the 3-4
passage having a typical cobble stone morphology were used for all the studies.
The phenotype of the isolated cells was confirmed by the analysis of the
expression of the endothelial cell specific markers such as CD62E and CD31 by
using flow cytometry. Typically, 1 X 10⁴ cells/ml were resupended in 100 µl of
PBS, 5 µl of PE conjugated mouse anti-human CD62E and 5 µl FITC conjugated

Materials and Methods
47
mouse anti-human CD31 were incubated for 15 min at room temperature in dark
condition and analysed by flow cytometry.
Peripheral blood mononuclear cells (PBMC) were isolated from human
peripheral blood after obtaining approval from IEC, using the method Ficoll-
Hypaque (Histopaque- 1077, Sigma, St Louis, MO) density gradient
centrifugation. Cells were washed twice with HBSS and resuspended in RPMI
supplemented with 10 % FBS. Normal Human Dermal Fibroblasts (NHDF) were
procured from PromoCell, Germany and cultured in fibroblast growth medium
kindly provided by them. Breast adenocarcinoma cell line (MCF-7),
nasopharyngeal carcinoma cell line and MDA-MB-231cell line were acquired
from National Centre for Cell Science (NCCS), Pune, India. HUVEC cells
maintained in Iscove's Modified Dulbecco's Medium (IMDM; Invitrogen, CA,
USA) supplemented with Endothelial Cell Growth Supplement (ECGS; Sigma, St.
Louis, USA). Eagles’ Minimal Essential Medium (MEM; Invitrogen, CA, USA)
supplemented with 10% FBS was used to culture cancer cells. Both the media
were supplemented with 50 IU ml−1 penicillin and 50 µg ml−1 streptomycin
(Invitrogen, CA, USA). Cells were incubated in a humidified atmosphere of 5%
CO2 at 37 ºC. Murine macrophage cell line (RAW 264.7) was procured from
National Centre for Cell Science (NCCS), Pune, India, and maintained in DMEM
(Invitrogen, CA, USA). Both media were supplemented with 10% fetal bovine
serum (FBS; Invitrogen, CA, USA), 50 IU mL-1 penicillin and 50 µg mL-1
streptomycin (Invitrogen, CA, USA). Cells were incubated in a humidified
atmosphere of 5% CO2 at 37 °C.
2.4 ZnO NCs toxicity analysis
We employed seven different cell function assays such as MTT, Alamar
blue and lactate dehydrogenase (LDH) assays for cell viability and plasma
membrane integrity studies, 2, 7-dichlorofluorescein diacetate (DCFH-DA) assay
to detect intracellular levels of ROS, MitoSOX Red assay to register
mitochondrial superoxide generation, JC-1 assay to assess alteration of
mitochondrial membrane potential, Newport Green DCF assay to determine the
intracellular Zn2+ concentration and Annexin V/Propidium iodide assay to detect

Materials and Methods
48
apoptosis. For flow cytometric analysis, ten thousand events gated on size
(forward scatter; FSC) and granularity (side scatter; SSC) were acquired and
analyzed, and the percentage of positively stained cells was determined by
comparing with the negative controls. The possibility of interference from the
fluorescence of ZnO NCs, in FACS and confocal measurements, were excluded
by invoking appropriate gating measures or background subtraction (ZnO
excitation: 365 nm, emission: 555 nm).
2.4.1 Detection of cell viability
MTT assay was used to evaluate the mitochondrial activity according to
the protocol developed by Mossman (11). When cells reached 80% confluency,
they were harvested and 104 cells/ml were seeded in 96 well plates and incubated
for 24 h. Triton X-100 (1%) was used as positive control for toxicity and NCs-free
culture media served as the negative control. Cells were then treated with
different concentrations of ZnO NCs. The final concentrations of ZnO NCs in
each well were 0, 10, 25, 50, 100, 300 and 500 µM, (dissolved in appropriate
medium) respectively. The cells were then incubated for 12 and 24 h and MTT
assay was performed. Optical absorbance was measured in a microplate
spectrophotometer (Biotek PowerWave XS, USA) at 570 nm with 660 nm set as
the reference wavelength. Cell viability was calculated by the following equation:
[A]test / [A]control × 100, where [A]test was the absorbance of the test cells treated
with ZnO NCs and [A]control was the absorbance of cells without ZnO NCs. The
results were expressed as percentage viability compared to the untreated controls.
Figure 2.2. Schematic diagrom depicting the reduction of MTT by mitochondrial
dehydrogenase enzyme and form formzan crystals. [Adapted from
http://www.biocompare.com]
Materials and Methods
49
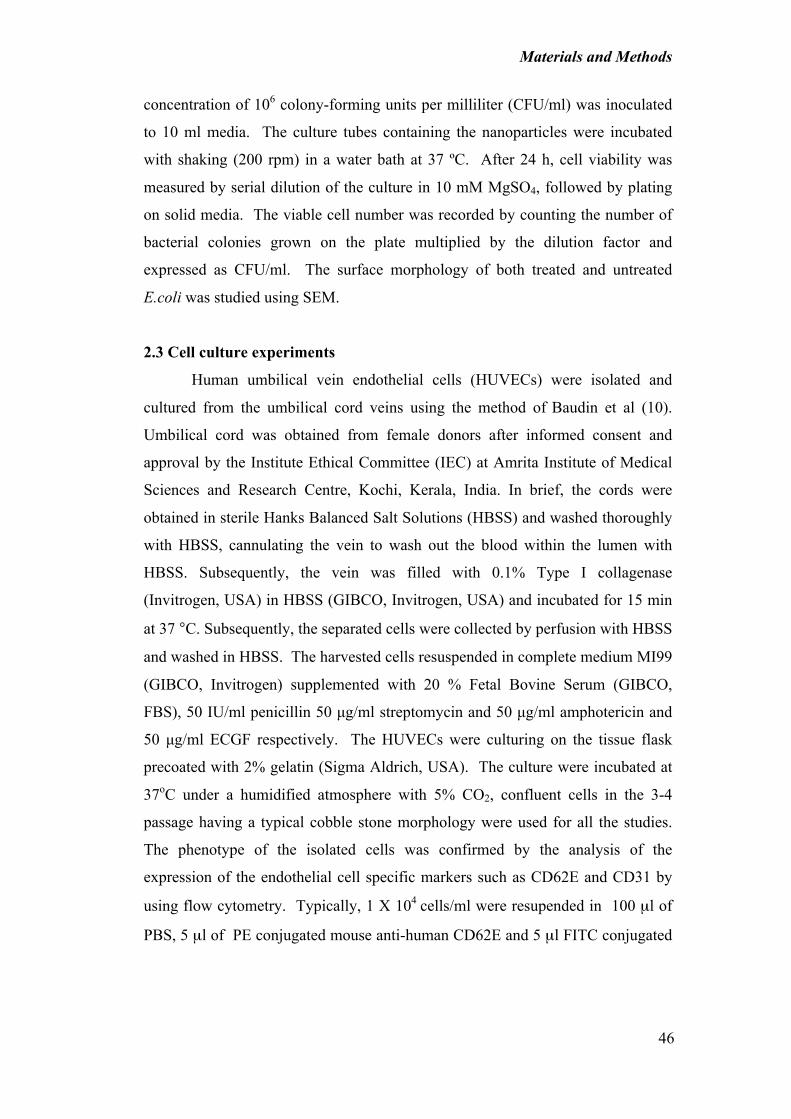
2.4.2 Detection of LDH release
Cytoplasmic membrane integrity assays are particularly important as a
measure of cellular damage. LDH is a stable cytoplasmic enzyme that is normally
released upon cell membrane disruption or cell death (12). The LDH assay,
therefore, is a measure of cytoplasmic membrane integrity. The amount of LDH
released is proportional to the number of damaged or dead cells. Presence of
LDH in extracellular medium was assessed using a commercial test kit using
manufacturer’s protocol.
Figure 2.3. Schematic diagram depicting the enzymatic conversion of the
tetrazolium salt [iodonitrotetrazolium (INT)]in to puprle cloured formazan.
[Adapated from http://www. gbiosciences.com]
The detection principle was based on the NADH consumption during the
conversion of pyruvate into lactate, which promotes conversion of tetrazolium
salt, INT to water-soluble formazan crystals, which is detected
spectrophotometrically. After incubation with nanoparticles for 12 h and 24 h the
cell culture medium was collected for LDH measurement. After the incubation
with nanoparticle the cell culture medium was collected and centrifuged at 10000
rpm for 10 min. An aliquot of 50 µl culture medium was used to measure LDH
leakage and absorbance was measured in a microplate spectrophotometer (Biotek
PowerWave XS, USA) at 490 nm with 690 nm set as the reference wavelength.

Materials and Methods
50
2.4.3 Cytoskletal imaging The cytoskeleton is a crucial component of the cell’s structure. After treatment with different concentrations of ZnO [0 - 200µM] the cells were fixed with 4% paraformaldehyde and permeabilized with 0.1% Triton X-100. Cells were then stained with Alexa Fluor 488 conjugated Phalloidin (Invitrogen, CA, USA) specific for F-actin filaments (13). Cytoskeletal alignment was visualized using confocal laser scanning microscopy (He-Ne and Ar laser). 2.4.4 Detection of intracellular ROS In order to determine the role of ROS generation in cytotoxicity, intracellular ROS generation was measured using an oxidation sensitive dye 2,7-dichlorofluorescein diacetate (DCFH-DA; Invitrogen, CA, USA) according to the procedure as reported (14). DCFH-DA is a non-fluorescent compound that diffuse through the plasma membrane, then enzymatically hydrolyzed by intracellular estrase to form DCFH. The deacetylated DCFH is rapidly reacted with intracellular ROS and form fluorescent dichlorofluorescin (DCF). The oxidation product of DCFH-DA has excitation/emission maxima of 495 nm/529 nm enabling detection using flow cytometry (FACS Aria; BD Biosciences, CA, USA) and Confocal laser scanning microscopy (Leica TCS SP5 II; He-Ne laser).
Figure 2.4. Schematic diagram of depicting the mechanism of the oxidation of
DCFH-DA (adapted from Ref. 15).
Materials and Methods
51
Typically 1 X 10⁵ cells after 24 h of exposure to ZnO NCs were re-
suspended in PBS buffer containing 5 µM of DCFH-DA for 30 minutes and the
cells were washed twice with PBS buffer. The level of intracellular ROS
generation was evaluated using flow cytometry and confocal microscopy. The
cells without nanoparticle treatment and 5 mM DEM (Diethyl maleate) were used
as negative control and positive control respectively.
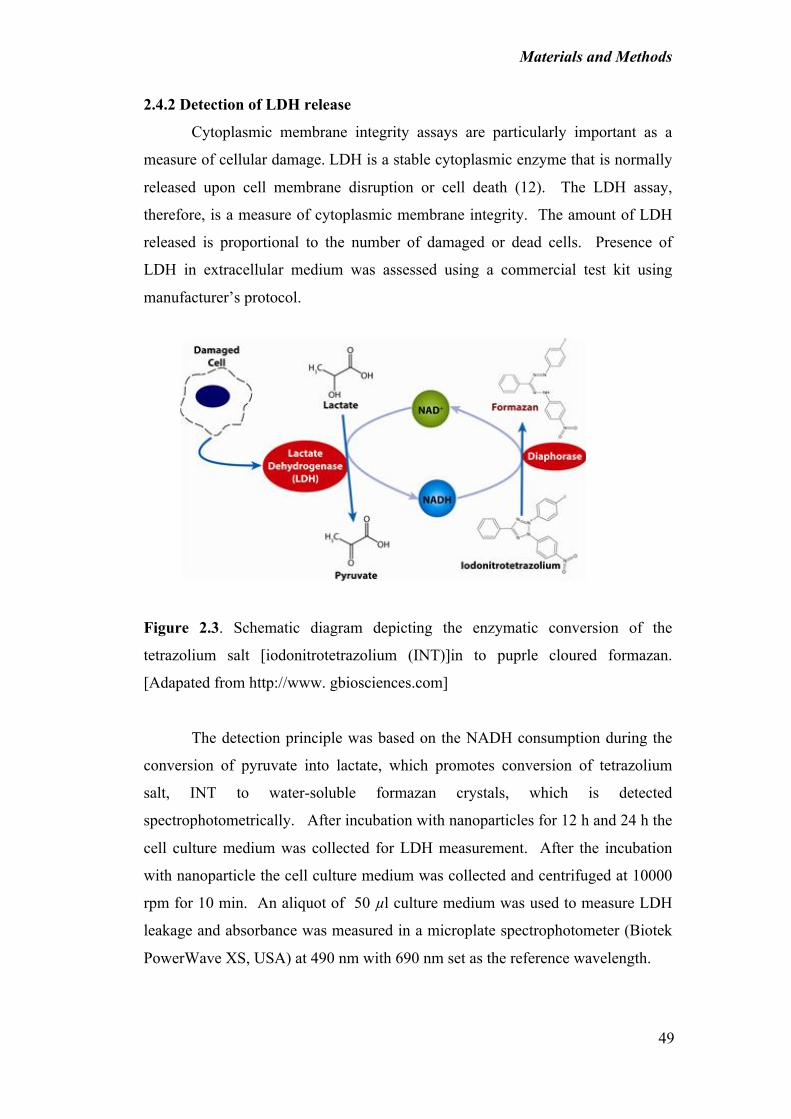
2.4.5 Detection of mitochondrial superoxide
Mitosox red is a cell permeant cationic derivative of dihydroethidium dye
and is selectively translocated to mitochondria of live cells (15). The cationic
triphenylphos- phonium substituent of MitoSOX Red indicator is responsible for
the electrophoretically mediated uptake of the MitoSox Red indicator to actively
respiring mitochondria. Once inside the mitochondria, MitoSOX gets oxidised
rapidly by superoxide and emits red fluorescence (ex/em: 400/580 nm). Typically
1 X 10⁵ cells after 24 h of exposure to ZnO NCs were re-suspended in HBSS
containing 5 µM of MitoSOX red dye for 10 minutes and the level of
mitochondrial superoxide was evaluated using flow cytometry.
Figure 2.5. Schematic diagram depiting oxidation of MitoSox Red in to 2-
hydroxy- 5-(triphenylphosphonium) hexylethidium. (Adapted from Ref. 16).
2.4.6 Assessment of mitochondrial membrane potential
To further assess ZnO NCs interaction with mitochondria, we used JC-1
(5, 5, 0, 6, 6, 0 -tetrachloro-1, 1, 0, 3, 3, 0 – tetraethyl - benzimidazol
carbocyanine iodide) assay (BD Biosciences, CA, USA) for the flow cytometric
and confocal microscopic estimation of mitochondrial membrane potential (17).

Materials and Methods
52
JC-1 can exist in two different forms aggregates or monomers, with different
emission spectra.
Figure 2.6. Schematic diagram depiting the mechanism of the ΔΨm dependent
accumulation of JC-1 in to healthy mitochondria. (Adapted from
http://lcbim.epfl.ch /research).
Once the healthy cells are incubated with JC-1, JC-1 enters in to the cyosol
as a monomer. Accumulation of JC-1 into mitochondria is specefically mediated
by the Δψ. The cells with heatly mitochondria with polarized Δψ are rapidly
taken up the JC-1 in to mitochondria and leading to the formation of JC-1
aggregates and shows red fluorescence. The cells with depolarized mitochondria,
JC-1 exist as monomer in the cytosol and exhibit green fluorescence. The
mitochondrial membrane integrity can be studied by measuring the red to green
fluorescence ratio by flow cytometry.
The procedure is as following: After 24 h incubation with different
concentrations of ZnO NCs, the cells (HUVECs and KB) were washed and
stained with 500 µl JC-1 according to the manufacturer´s protocol, at room
Materials and Methods
53
temperature in the dark. After incubation for 15 minutes, cells were washed twice
with 1X assay buffer and resuspended in the same buffer. The stained cells were
analyzed in FACS. For confocal microscopic analysis HUVEC and KB cells were
cultured on 13 mm coverslips and treated with ZnO NCs. The cells were stained
with JC-1 and fixed using 3.7% paraformaldehyde.
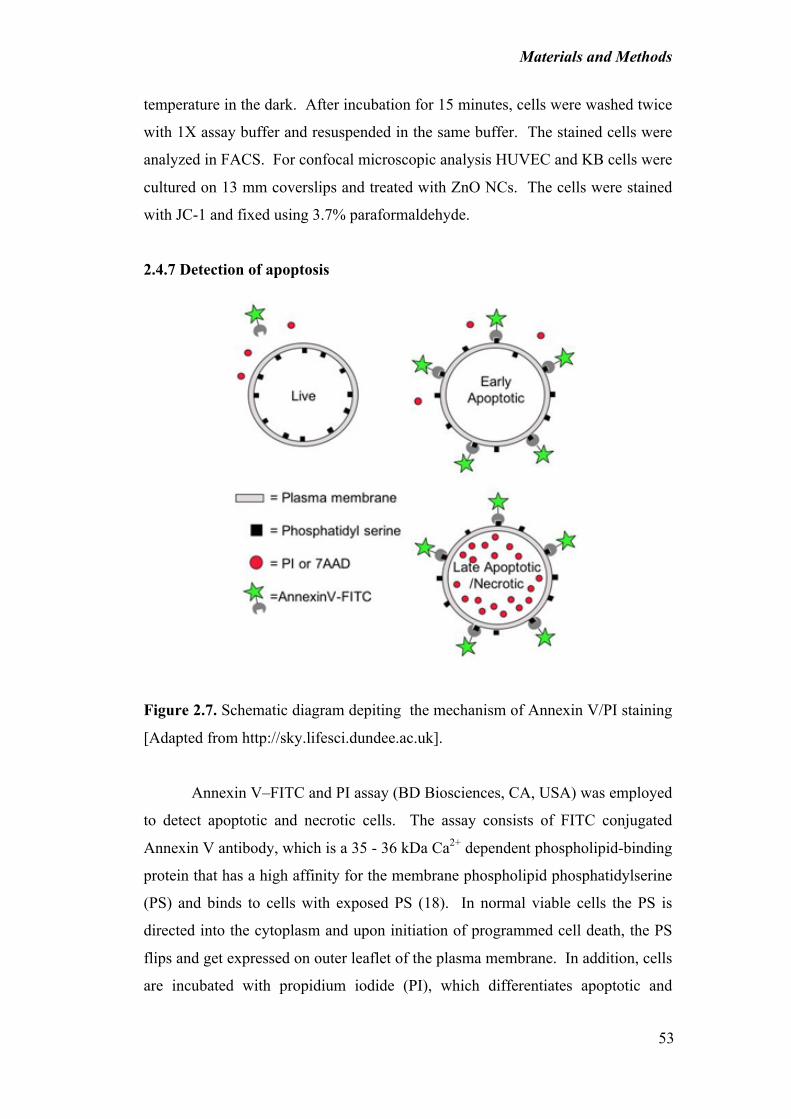
2.4.7 Detection of apoptosis
Figure 2.7. Schematic diagram depiting the mechanism of Annexin V/PI staining
[Adapted from http://sky.lifesci.dundee.ac.uk].
Annexin V–FITC and PI assay (BD Biosciences, CA, USA) was employed
to detect apoptotic and necrotic cells. The assay consists of FITC conjugated
Annexin V antibody, which is a 35 - 36 kDa Ca2+ dependent phospholipid-binding
protein that has a high affinity for the membrane phospholipid phosphatidylserine
(PS) and binds to cells with exposed PS (18). In normal viable cells the PS is
directed into the cytoplasm and upon initiation of programmed cell death, the PS
flips and get expressed on outer leaflet of the plasma membrane. In addition, cells
are incubated with propidium iodide (PI), which differentiates apoptotic and
Materials and Methods
54
necrotic cells. Using both dyes in combination with two-wavelength flow
cytometry, they identify the apoptotic (AnV+) and necrotic cells (PI+) separately.
Following 12 h and 24 h incubation with different concentration of ZnO
NCs, cells were washed and stained with Annexin V and PI. Typically 1 X 10⁵
cells were resuspended in 100 µl of binding buffer and 5 µl of FITC-conjugated
Annexin V (Annexin V–FITC) and 5 µl of propidium iodide (PI) were added
sequentially at room temperature in the dark. After incubation for 15 minutes,
stained cells were diluted with 400 µl of binding buffer and directly analyzed in
FACS, measuring the fluorescence emission at 530 nm and 575 nm. Apoptotic
cells were visualized by confocal microscopy (He-Ne and Ar laser).
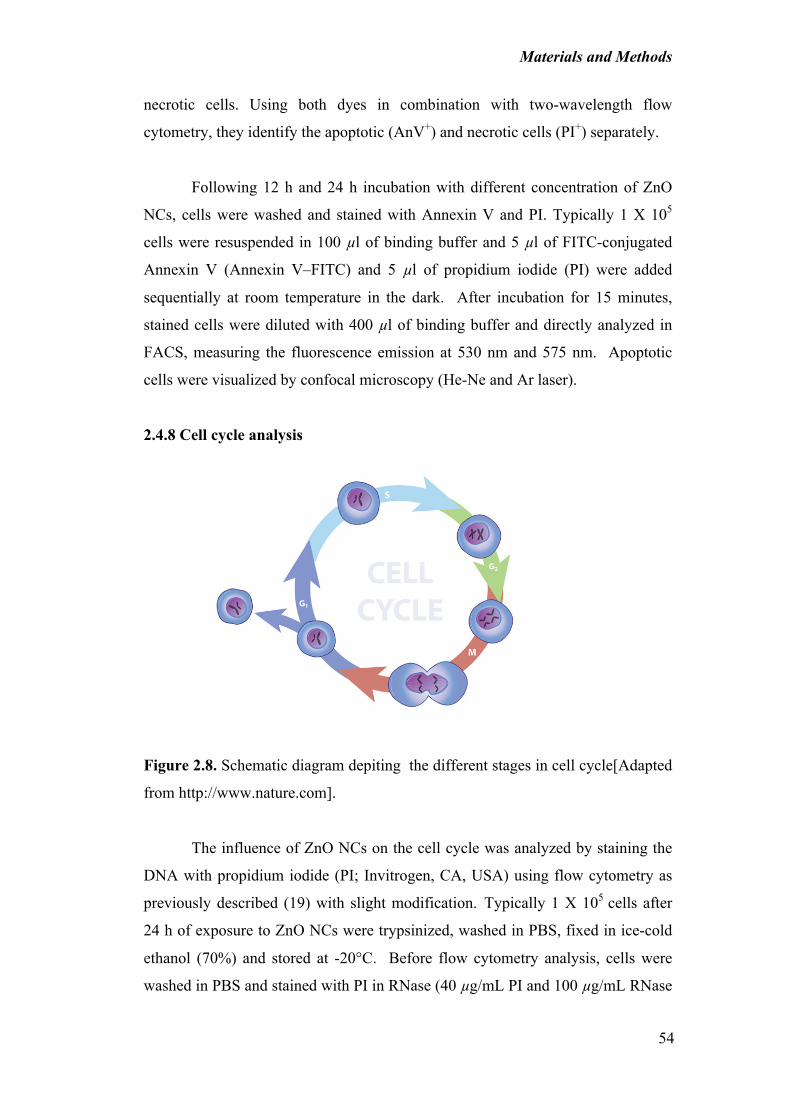
2.4.8 Cell cycle analysis
Figure 2.8. Schematic diagram depiting the different stages in cell cycle[Adapted
from http://www.nature.com].
The influence of ZnO NCs on the cell cycle was analyzed by staining the
DNA with propidium iodide (PI; Invitrogen, CA, USA) using flow cytometry as
previously described (19) with slight modification. Typically 1 X 10⁵ cells after
24 h of exposure to ZnO NCs were trypsinized, washed in PBS, fixed in ice-cold
ethanol (70%) and stored at -20°C. Before flow cytometry analysis, cells were
washed in PBS and stained with PI in RNase (40 µg/mL PI and 100 µg/mL RNase

Materials and Methods
55
A) and incubated at 37°C for 30 mins, followed by incubation at 4°C until
analysis.
2.4.9 Detection of intracellular and extra cellular Zn2+ ions
The cell permeable Zn2+ selective indicator Newport Green DCF
(Invitrogen, CA, USA) was used to study whether the toxicity of ZnO NCs is
associated with the intracellular release of Zn2+. Newport Green DCF is a cell
permeant acetate ester molecule, Once inside the cells the intracellular estrase
cleave the diacetate moiety and the dye molecule become charged, inhibiting the
escape from the cells and allowing specifically bind to the Zn2+. For Newport
green DCF, excitation was set at 490 nm and emission at 530 nm. Typically 1 X
105 HUVECs and KB cells after 24 h of exposure to nanoparticles were re-
suspended in phenol red free culture medium loaded with 5 µM Newport Green
for 30 mins and intracellular Zn2+ release was studied using FACS. We confirmed
no interference from the fluorescence of ZnO NCs in the measurements as the
undissoluted ZnO give emission only by exciting at 365 nm and not at 490 nm.
Confocal microscopy (He-Ne laser) was used for the direct visualisation of
intracellular ionised zinc.
For detecting ZnO dissolution at different pH conditions that mimic the
extracellular pH, Inductively Coupled Plasma (ICP) technique was employed.
Different concentrations of ZnCl2 (0 - 1 mM) were used to create standard curve.
For dissolution studies, varied concentration of ZnO NCs were incubated at pH 5
and 7.4 over 24 h at 37 °C and the supernatant is collected after centrifugation at
25000 rpm for 30 mins. No additional digestion step is used for detecting the Zn2+
ions that is spontaneously dissoluted due to the effect of pH.
2.4.9.1 Estimation of extracellular pH
The extracellular pH of normal primary cells and cancer cells were
measured by monitoring the pH near to the outer membrane of the cells in a
culture plate using a microelectrode set-up (Thermo Scientific; Orion). The
primary HUVEC and cancer cells (KB) were cultured in 6 well plates and the pH
Materials and Methods
56
was measured after 24 h. The initial pH recorded was 7.4 which served as the 0th
reading.
2.4.9.2 Statistical analysis
Statistical analyses of the values for all experiments are expressed as mean
± standard deviation of three independent experiments. The data were analyzed
using Student’s t-test (Microsoft Excel, Microscoft Corporation, USA) where
statistical significance was calculated using untreated and ZnO NCs treated
samples. * denotes p < 0.05 compared with control.
2.5 Graphene toxicity analysis
2.5.1 Kidney epithelial cells (Vero) cells
2.5.1.1 Cellular uptake studies using flow cytometry
We have adopted a flow cytometric light scatter based method for the
intracellular uptake of nanoparticles. In this method make use of the forward
scatter (FSC) and side scatter (SSC). Forward scatter (FSC) correlates to the size
of the cells and side scatter (SSC) depends on the inner complexity of the cells.
Typically, the cells were treated with different doses of nanoparticles and
incubated for 24h. After treatment th cells were trypsinized and washed with PBS
and suspended in PBS. The intracellular uptake was further quantified by flow
cytometry using 488 nm laser, and measured the forward and side scattering
intensities.
2.5.1.2 Detection of cell viability (Alamar blue Assay)
Alamar blue (Invitrogen, CA, USA) assay was used to evaluate the cell
viability. When cells reached 80% confluency, they were harvested and 3 × 10⁴
cells/ml were seeded in 24 well plates and incubated for 24 h at 37 °C. The cells
were then treated with different concentrations of p-G and f-G for 24 h at 37 °C
and Alamar Blue assay was performed. Fluorescence was recorded using a
fluorescence microplate reader (Beckman Coulter DTX 880 Multimode Detector,
USA) using 560/590 nm ex/em filter settings.

Materials and Methods
57
Figure 2.9. Schematic diagram represent the Alamar blue assay priniciple. Non
fluorescent Resazurin get converted to highly fluorescent Resorufin. [Adapated
from http://www.bmglabtech.com]
2.5.1.3 Detection of LDH release:
After incubation with different concentrations of graphene for 24 h at 37 °C the cell culture medium was collected and centrifuged at 10000 rpm for 10 min.
LDH level in the extracellular medium was assessed using a commercial test kit
(Sigma, St. Louis, USA) using manufacturer’s protocol. An aliquot of 50 µl
culture medium was used to measure LDH leakage and optical absorbance was
measured in a microplate spectrophotometer (Biotek PowerWave XS, USA) at
490 nm with 690 nm set as the reference wavelength.
2.5.1.4 Cytoskletal imaging:
After treatment with p-G and f-G the Vero cells were fixed with 4%
paraformaldehyde and permeabilized with 0.1% Triton X-100. Cells were then
stained with Alexa Fluor 488 conjugated Phalloidin (Invitrogen, CA, USA)
specific for F-actin filaments. Nuclei were further stained with propidium iodide
(PI). Cytoskeletal alignment was visualized using confocal laser scanning
microscopy (He-Ne and Ar laser).
2.5.1.5 Detection of apoptosis:
Annexin V–FITC and PI assay (BD Biosciences, CA, USA) was employed
to detect apoptotic and necrotic cells. After incubation with a dose range of
graphene for 24 hr at 37 °C, the cells were washed and stained with Annexin V

Materials and Methods
58
and PI. Typically 2 × 10⁵ cells were resuspended in 100 µl of binding buffer and 5
µl of FITC-conjugated Annexin V (Annexin V–FITC) and 5 µl of propidium
iodide (PI) were added sequentially at room temperature in the dark. After
incubation for 15 min, stained cells were diluted with 400 µl of binding buffer and
directly analyzed in flowcytometry (BD FACSAria; BD Biosciences, CA, USA),
measuring the fluorescence emission at 530 nm and 575 nm.
2.5.1.6 Detection of intracellular ROS:
Intracellular ROS generation was measured using an oxidation sensitive
dye 2,7-dichlorofluorescin diacetate (DCFH-DA; Invitrogen, CA, USA). DCFH-
DA is a non-fluorescent dye that undergoes intracellular de-acetylation, followed
by ROS mediated oxidation to a fluorescent dichlorofluorescin (DCF) which has
an excitation/emission maxima of 495 nm/ 529 nm. Typically 2 × 10⁵ Vero cells
after 24 h at 37 °C of exposure to graphene were re-suspended in HBSS containing
5 µM of DCFH-DA for 30 min and intracellular ROS generation was evaluated
using flow cytometry.
2.5.2 Murine macrophage cells (RAW 264.7)
2.5.2.1 cell culture
Peripheral blood samples were obtained from healthy volunteers after
informed consent and approval by the Institute Ethical Committee (IEC) at Amrita
Institute of Medical Sciences and Research Centre, Kochi, Kerala, India.
Peripheral blood mononuclear cells (PBMCs) were isolated by density gradient
centrifugation (Histopaque-1077; Sigma, St Louis, USA) from anticoagulated
blood samples. The isolated PBMCs were washed thrice with Hanks balanced salt
solution (HBSS; Sigma, St.Louis, USA) and cultured in RPMI medium
(Invitrogen, CA, USA). Murine macrophage cell line (RAW 264.7) was procured
from National Centre for Cell Science (NCCS), Pune, India, and maintained in
DMEM (Invitrogen, CA, USA). Both media were supplemented with 10% fetal
bovine serum (FBS; Invitrogen, CA, USA), 50 IU mL-1 penicillin and 50 µg mL-1
streptomycin (Invitrogen, CA, USA). Cells were incubated in a humidified
atmosphere of 5% CO2 at 37 °C.
Materials and Methods
59
2.5.2.2 Intracellular uptake studies
To investigate intracellular uptake of both graphene systems in
macrophage cells, we have employed a laser scanning confocal microscopy (TCS
SP5 II, Leica Microsystems, USA) and confocal Raman spectral mapping (Alpha
300RA, Witec, Germany). RAW 264.7 cells were grown on 13 mm cover slips,
treated with both p-G and f-G and analyzed. Z-plane stacks were acquired with
confocal Raman microscope to create 3-D Raman spectral image. The surface
morphology of both p-G and f-G treated cells were studied using scanning
electron microscopy (JSM-6490 LA, JEOL, Japan).
2.5.2.3 Cytoskeletal imaging
After 24h incubation with p-G and f-G, RAW 264.7 cells were
immunostained for F-actin as previously reported by our group.[41] Briefly, the
cells were fixed with 4% paraformaldehyde (Polysciences, USA) in phosphate
buffer saline (PBS) for 10 min and permeabilized with 0.1% Triton X-100 in PBS
for 3 min. Cells were then incubated with Alexa Fluor 488 conjugated Phalloidin
(Invitrogen, CA, USA) for 30 min. Subsequently, cells were washed thrice with
PBS and the cytoskeletal alignment was analyzed using confocal laser scanning
microscopy (He-Ne and Ar laser).
2.5.2.4 Cell viability (Alamar Blue Assay)
Alamar blue assay was employed to evaluate the cell viability. When
RAW 264.7 cells reached 80% confluency, they were harvested and 1 x 10⁵ cells
were seeded in 24 well plates and incubated for 24 h at 37 °C with 5% CO2. After
treating with graphene for 48 h, cells were washed twice with PBS, and Alamar
Blue was added and further incubated for 4 h. The relative cell viability was
calculated using the following equation.
Where [F]test was the fluorescence of graphene treated cells and [F]control was the
fluorescence of untreated cells. Fluorescence was recorded using a fluorescence

Materials and Methods
60
microplate reader (Beckman Coulter DTX 880 Multimode Detector, USA) using
560/590 nm ex/em filter settings.
2.5.2.5 Detection of plasma membrane integrity (LDH Assay)
Lactate dehydrogenase leakage (LDH) was evaluated to determine the
integrity of the plasma membrane using a commercial kit (Sigma, St. Louis, USA)
according to manufacturer’s protocols. Briefly, after incubation with various
concentrations of graphene for 24 h, cell culture medium was collected and
centrifuged at 10,000 rpm for 10 min. An aliquot of 50 µl culture medium was
used to quantify the LDH level. Absorbance was measured in a microplate
spectrophotometer (Biotek PowerWave XS, USA) at 490 nm with 690 nm set as
the reference wavelength.
2.5.2.6 Detection of ROS (DCFH-DA Assay)
Intracellular ROS generation was detected using 2,7-dichlorofluorescin
diacetate (DCFH-DA; Invitrogen, CA, USA). Typically 3 x 10⁵ cells treated with
graphene for 24 h were resuspended in HBSS containing 5 µM of DCFH-DA for
30 min and intracellular ROS generation was evaluated using flow cytometry (BD
FACSAria; BD Biosciences, CA, USA) as described previously. For flow
cytometric analysis, ten thousand events gated on size (forward scatter; FSC) and
granularity (side scatter; SSC) were acquired and analyzed, and the percentage of
positively stained cells were determined by comparing with untreated cells.
2.5.2.7 Detection of Apoptosis (Annexin V-FITC/PI Assay)
Annexin V–FITC/PI dual staining (BD Biosciences, CA, USA) was
employed to detect apoptotic and necrotic cells. After incubation with various
concentrations of both graphene for 24 h, the cells were washed and stained with
Annexin V and PI. Typically 3 x 10⁵ cells were resuspended in 100 µl binding
buffer followed by the sequential addition of 2.5 µL of FITC-conjugated Annexin
V (Annexin V–FITC) and 2.5 µL of propidium iodide (PI). After incubation for
15 min in the dark at room temperature, stained cells were resuspended in 400 µL
binding buffer and directly analyzed in flow cytometry measuring the
Materials and Methods
61
fluorescence at 530 nm and 575 nm. Apoptotic cells were imaged using confocal
microscopy (He-Ne and Ar laser).
2.5.3 Human primary blood cells
Blood was drawn from healthy human donors who were not under any
medications, and collected in tubes containing citrate phosphate dextrose solution
with adenine (CPDA; Sigma, St. Louis, USA) at ratio of 9:1 blood:anticoagulant.
In order to rule out endotoxin contamination, all experiments were performed
under aseptic conditions. Endotoxin level in as prepared graphene was quantified
using Limulus Amoebocyte Lysate (LAL) endotoxin assay kit (Genscript, USA)
as per the manufacturers’ protocol.
2.5.3.1 Hemolysis
Hemolytic potential of graphene was detected by Soret band based
absorption of free hemoglobin (Hb) at 415 nm in the plasma using
spectrophotometer. Whole blood was collected into tube containing
anticoagulant. 450 µL whole blood was treated with 50 µL of graphene sample for
3 h at 37 °C on a shaker. Diluted blood incubated with normal saline (0% lysis)
and 1% Triton X-100 (100% lysis) served as negative and positive controls
respectively and the analysis was done as reported earlier (20),(21). Samples were
centrifuged at 4000 rpm for 15 min to collect plasma. Plasma obtained was diluted
with 0.01% sodium carbonate and absorbance was measured at 380 nm, 415 nm
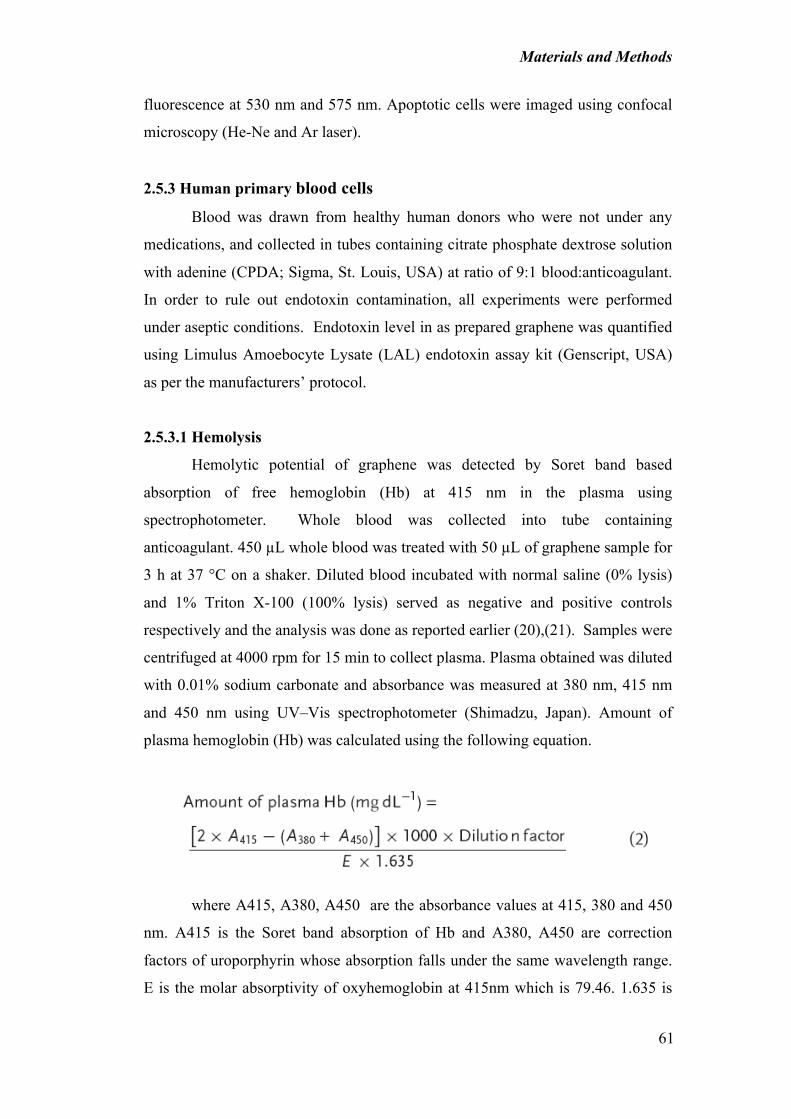
and 450 nm using UV–Vis spectrophotometer (Shimadzu, Japan). Amount of
plasma hemoglobin (Hb) was calculated using the following equation.
where A415, A380, A450 are the absorbance values at 415, 380 and 450
nm. A415 is the Soret band absorption of Hb and A380, A450 are correction
factors of uroporphyrin whose absorption falls under the same wavelength range.
E is the molar absorptivity of oxyhemoglobin at 415nm which is 79.46. 1.635 is

Materials and Methods
62
the correction factor applied for the turbidity of plasma sample. Hemolytic
property of graphene samples was plotted as percentage hemolysis of various
sample concentrations as per the following equation.
2.5.3.2 Platelet activation and aggregation study:
Platelet rich plasma (PRP) was obtained by centrifuging whole blood at
150 g for 10 min at 20 °C. PRP was diluted ten times using normal saline and
the mixture was equilibrated for 30 min at 37 °C in a water bath. 450 µL of
diluted PRP was treated with 50 µL of sample for 20 min. Saline and 50 µM
Adenosine diphosphate (ADP; Sigma, St. Louis, USA) served as negative and
positive controls respectively. 100 µL of treated PRP was incubated with 20 µL of
PerCP–Cy5 labeled CD62P and FITC labeled CD42b (BD Biosciences, CA,
USA) antibodies and incubated for 30 min after which the sample was diluted
with PBS and analyzed using flow cytometry. In platelet aggregation analysis,
PRP was treated with both graphene systems for 30 min and platelet count was
done using hematology analyzer (Abbott CELL-DYN 3700).
2.5.3.3 Plasma coagulation studies
Peripheral blood was centrifuged at 4000 rpm for 15 min at 19 °C to obtain
platelet poor plasma (PPP). 50 µL sample was treated with 450 µL of PPP for 30
min at 37 °C. 100 µL of prothrombin reagent (Diagnostica Stago, France) was
added to 50 µL of treated plasma and time taken for the plasma to coagulate was
measured as prothrombin time (PT). In activated partial thromboplastin time
(aPTT) analysis 50 µL of aPTT activator (Diagnostica Stago; France) was added
to 50 µL of treated plasma and incubated for 180 sec followed by the addition of
0.025 M CaCl2 and analyzed. aPTT value was expressed as a ratio, calculated by
the following equation.
Materials and Methods
63
2.5.3.4 Inflammation analysis
The effect of graphene treatment on cytokine secretion by PBMCs was
studied using human inflammation kit (BD Biosciences, CA, USA) as per the
manufacturer’s protocol. Cytokines such as Interleukin-8 (IL-8), Interleukin-1β
(IL-1β), Interleukin-6 (IL-6), Interleukin-10 (IL-10), Tumor Necrosis Factor
(TNF), and Interleukin-12p70 (IL-12p70) were quantified. The isolated PBMCs
were treated with various concentrations of both graphene systems and incubated
for 24 h. PBS and 1 µg mL-1 lipopolysacharide (LPS; Sigma, St.Louis, USA)
served as negative (0% activation) and positive controls (100% activation)
respectively. After incubation the cells were centrifuged at 4000 rpm for 10 min
and the supernatant was collected for the quantification of cytokines using flow
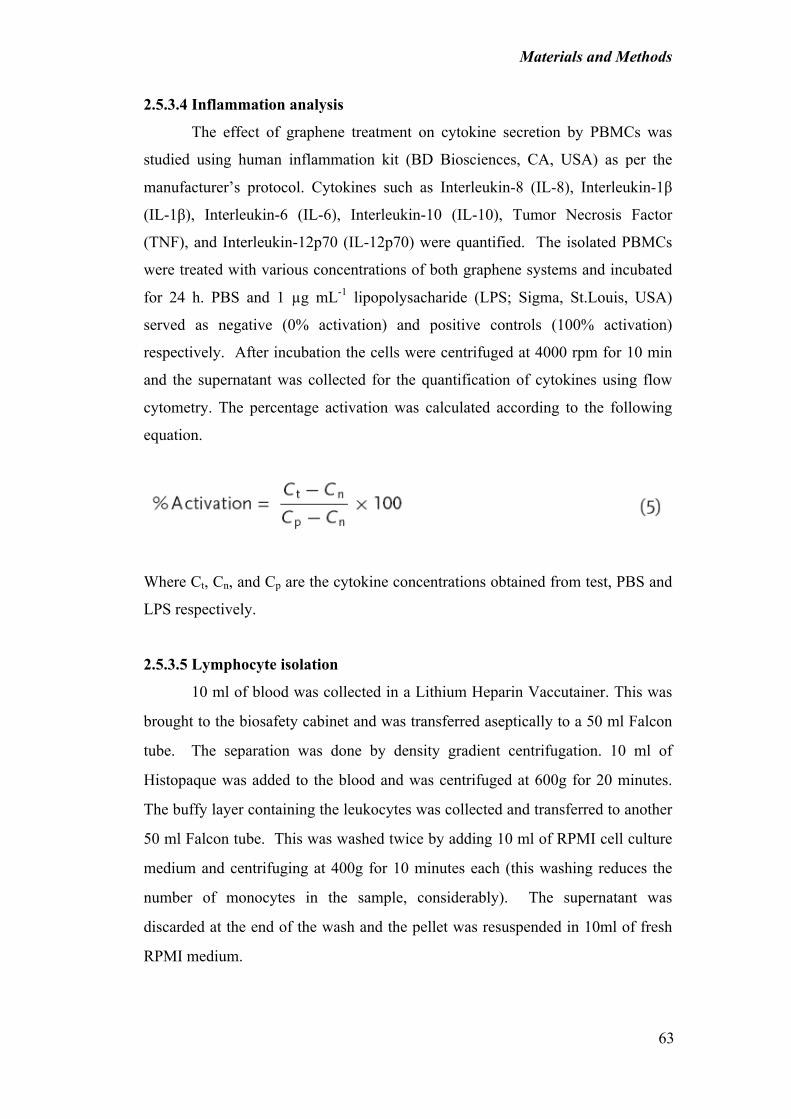
cytometry. The percentage activation was calculated according to the following
equation.
Where Ct, Cn, and Cp are the cytokine concentrations obtained from test, PBS and
LPS respectively.
2.5.3.5 Lymphocyte isolation
10 ml of blood was collected in a Lithium Heparin Vaccutainer. This was
brought to the biosafety cabinet and was transferred aseptically to a 50 ml Falcon
tube. The separation was done by density gradient centrifugation. 10 ml of
Histopaque was added to the blood and was centrifuged at 600g for 20 minutes.
The buffy layer containing the leukocytes was collected and transferred to another
50 ml Falcon tube. This was washed twice by adding 10 ml of RPMI cell culture
medium and centrifuging at 400g for 10 minutes each (this washing reduces the
number of monocytes in the sample, considerably). The supernatant was
discarded at the end of the wash and the pellet was resuspended in 10ml of fresh
RPMI medium.
Materials and Methods
64
2.5.3.6 Lymphocyte proliferation analysis
Lymphocytes were isolated from anticoagulated peripheral blood by
density gradient centrifugation. The isolated PBMCs were washed twice with
HBSS at 250 g for 10 min. PBS and 100 µg mL-1 PHA-M (Phytohemagglutinin;
Sigma, St.Louis, USA) served as the negative (0 % proliferation) and positive
control (100% proliferation) respectively. After incubation for 72 h, Alamar Blue
assay was used to study the lymphocyte proliferation. Immunosuppression
analysis was studied using lymphocytes cultured in the presence of 100 µg mL-1
PHA-M and different concentrations of both graphene systems for 72 h. After
incubation Alamar Blue assay was performed to evaluate the possibility of the
interferences of both graphene systems in lymphocyte proliferation induced by a
mitogen, PHA-M.
2.5.4 Genotoxicity evaluations of Graphene
2.5.4.1 Comet Assay
We have adopted single cell gel electrophoresis assay to detect the DNA
damages in single cell level. Comet analysis was done according to the protocol
devoloped by Alok Dhawan’s group (22) with slight modification.
2.5.4.2 Materials
Low melting point agarose (LMPA), normal melting agarose (NMA),
phos- phate buffered saline-PBS (Ca2+, Mg2+ free), ethylene diamine tetraacetic
acid disodium salt (EDTA), propidium iodide, sodium chloride (NaCl), sodium
hydroxide (NaOH), Triton X-100, trizma base.
Microscope slides (frosted end, 75mm x 25mm), coverslips (24 x 60 mm),
eppendorf tubes, micropipettors and tips, Coplin jars.
2.5.4.3 Preparation of reagents
1. Prepare Ca2+, Mg2+ free PBS 1000 ML (PH 7.4).
2. Prepare 0.75% LMPA and 0.75% NMA in PBS.
3. Prepare lysing solution Lysing solution (2.5 M NaCl, 100 mM EDTA, 10
mM Trizma base). Add all the above ingredients to about 70 mL dH2O
with 0.8 g NaOH and dissolved. NaO is using for dissolving the EDTA.
Materials and Methods
65
Final solution should be prepared freshly which containg 10% DMSO and
1% Triton and refirgerate for at least 1 hr.
4. Prepare electrophoresis buffer (1X solution: 300 mM NaOH/1 mM
EDTA). For the experiment, 1X Buffer is made freshly before each
electrophoretic analysis. Mix 30 mL NaOH and 5 mL EDTA stock
solutions and make up to 1000mL with chilled dH2O, the final pH of the
electrophoresis buffer has to be >13.
5. Prepare neutralisation buffer (0.4M Tris). 6. Staining solution: Propidium iodide (10 µg/ml).
2.5.4.4 Preparation of base slides The NMA (0.75%) is hot (45°C), the slides are dipped up to one-third the
frosted area and gently removed. The bottom of the slide is wiped to remove
agarose and the slides kept on a flat surface to dry.
2.5.4.5 Prepartion of cells
Following the nanoparticle treatment, the cells were washed with PBS and
detach the cells by trpsinization. The cells wre suspended in cold FBS containg
medium and collect the cell pellet by centrifugation and resuspend the cells in
cold fbs containg medium and adjust the cell density at 4 x 10⁶ cells/ml. Remove
two 10 µl aliquots from each tube and add to separate eppendorf tubes. Kept the
both tubes on ice.
2.5.4.6 Prepartion of microgel slides
Add 75 µl of LMP agarose to the cell suspension, mix by pipetting up and
down a fewt imes then layer the agarose/cell mix on to predipped 0.75% NMP
agarose. Allow the agarose to solidify,then place the slides on ice for ~5mins.
Take the slides off the ice and allow them to retrn to room temparature. Remove
the coverslips then add a further layer of LMP agarose (85 µl) and leave to
solidify as before. Remove the coverslips. Place all the slides in cold lysing
soultion at 4° C for 2 hrs.
Materials and Methods
66
2.5.4.7 Electrophoresis of microgel slides for comet assay
After the lysis step, remove slides and rinse in elctrophoresis buffere.
Place the slides in a bath of electrophoresis buffer for 15 mins then transfer to the
rig with fresh electrophoresis buffer for a further 25 minutes under cold
conditions. Electrophoresis at 25 V, 300mA, for 20 minutes.
2.5.4.8 Neutralization and staining
After electrophoresis, neutralise the slides with neutralisation buffer for 5
mins and repeat twice. After neutralization place the slides in staing solution
containg 2.5 µg/ml propidium iodide in distilled wated for 20 mins. Rinse the
slides with distilled water to remove th unbounded dye and place coverslip on
each slide. Score 50 cells per slide using the fluorescent microscope.
2.5.4.9 Toxicogenomic analysis using microarray
Gene expression studies were carried out in HUVECs treated with
10µg/ml of both p-G and f-G. Microarray technique was employed to carry out
these studies. Genespring software was used to analyze the results obtained using
affymatrix exon expression human gene chip. The filter probeset was set at 20
percentile and the initial significance level for choosing the genes was set at a very
stringent p<0.001. All three samples i.e. Control, p-G and f-G samples were
compared for differential gene expression. At the end of this, fold change was set
at 1.4 and the biological functions affected were detected by setting p < 0.1. At the
end of this, the significantly affected pathways were obtained at p < 0.05.
2.6 In vivo toxicological analysis
2.6.1 Housing of animals
The animals were bred and maintained at Central Lab Animal Facility,
Amrita institute of Medical Sciences & Research Centre, Kochi and were housed
in groups of 5 in polypropelene cages under identical environmental conditions
(temperature controlled room (22 ± 2◦C) with a photoperiod of 12hr light and 12hr
dark cycle). They were fed with balanced standard mash feed and filtered water ad
lib. The experiments were designed and conducted in strict accordance with the
ethical norms approved by the institutional Animal Ethics Committee guidelines.
Materials and Methods
67
2.6.2 Injection in mice and sample preparation
Mice were anesthetized by intramuscular injection of Ketamine &
Xylazine in the ratio 4:1. Graphene samples are injected intravenously by lateral
tail vein injection. Controls were given normal saline. The volume of sample was
calculated based on bodyweights of mice so that the final concentration of
graphene injected in each mouse is 20 mg/kg. Undisturbed behavior as well as
response to external stimuli was recorded. Body weight, temperature, food and
water intake were checked periodically. Mice were euthanized by over dose
anesthesia. Blood was collected by cardiac puncture. All the major organs like
brain, heart, lungs, liver, kidney, spleen, intestine, testis and bone marrow were
harvested.
2.6.3 Histopathology
All the tissues are stored in 10 % buffered formalin immediately after
harvesting The tissues are processed in Leica automated tissue processor and wax
blocks are prepare by embedding with paraffin wax (paraffin wax dispenser SLEE
MPS/P1) and paraffin sections of 4 µ thickness are prepared using microtome
(Leica microsystems). The slides containing the paraffin sections are
deparaffinized in xylene for three changes ten minutes each and rehydrated in
descending grades of alcohol i.e. 100%, 95%, 80%, 70% three minutes each and
finally in distilled water for 5 minutes. Then slides are stained with Harris
haematoxylin for 10 minutes followed by rinsing with tap water and dipping in
1% acid alcohol for 2 seconds. Then the slides are placed in 0.2% ammonia water
for bluing. Slides are then stained with eosin for 5 minutes, rinsed in distilled
water and dehydrated in ascending grades of alcohol and cleared in xylene. Cover
slips are placed over slides using DPX mountant and dried overnight in the hood.
Qualitative and quantitative analysis of slides was performed.
2.6.4 RT-PCR studies on mouse blood
2.6 5 RNA isolation Ambion kit
After collection of blood from mice the blood cells are pelleted down by
spinning at 15000 rpm for three minutes. Supernatant is discarded and lysis
solution is added to the pellet and vortexed until the pellet dissolves completely.
Materials and Methods
68
Then 200 µl of 3M sodium acetate solutions and 1.5 ml of acid phenol +
chloroform solution are added to cell lysate and shaken vigorously for thirty
seconds and stored at room temperature for five minutes. After centrifuging this
again for 10 minutes at 2000 g the aqueous phase containing the RNA is separated
from the organic phase . The aqueous phase is transferred to a fresh tube and
100% ethanol is added to precipitate RNA. The precipitate is separated using a
filter cartridge and eluted in to a fresh collection tube and labeled.
2.6 6 Biochemical analysis of mouse blood
Blood was collected from mice after intravenous injection of Pristine and
functionalized graphene and sent for biochemical analysis to clinical chemistry
lab, Amrita institute of Medical sciences and Research centre, Kochi. Analysis
was done for hepatic and renal function apart from plasma proteins.

Materials and Methods
69
References:
1. Patra MK, Manoth M, Singh VK, Siddaramana Gowd G, Choudhry VS,
Vadera SR, et al. Synthesis of stable dispersion of ZnO quantum dots in
aqueous medium showing visible emission from bluish green to yellow.
Journal of Luminescence .2009;129(3):320–4.
2. Feldmann C, Jungk H-O. Polyol-Mediated Preparation of Nanoscale Oxide
Particles We thank Jacqueline Merikhi and Gerd Much for carrying out the
scanning electron microscopy (SEM) and the atomic force microscopy
(AFM) investigations, respectively. Angewandte Chemie (International ed.
in English) . 2001;40(2):359–62.
3. Cheng H-M, Hsu H-C, Chen S-L, Wu W-T, Kao C-C, Lin L-J, et al.
Efficient UV photoluminescence from monodispersed secondary ZnO
colloidal spheres synthesized by sol–gel method. Journal of Crystal Growth
. 2005;277(1-4):192–9.
4. Vigneshwaran N, Kumar S, Kathe AA, Varadarajan PV, Prasad V.
Functional finishing of cotton fabrics using zinc oxide–soluble starch
nanocomposites. Nanotechnology . 2006;17(20):5087–95.
5. STOBER W. Controlled growth of monodisperse silica spheres in the
micron size range*1. Journal of Colloid and Interface Science .
1968;26(1):62–9.
6. Liufu S. Investigation of PEG adsorption on the surface of zinc oxide
nanoparticles. Powder Technology . 2004;145(1):20–4.
7. Wu C, Qiao X, Chen J, Wang H, Tan F, Li S. A novel chemical route to
prepare ZnO nanoparticles. Materials Letters . 2006;60(15):1828–32.
8. Subrahmanyam KS, Panchakarla LS, Govindaraj A, Rao CNR. Simple
Method of Preparing Graphene Flakes by an Arc-Discharge Method. The
Journal of Physical Chemistry C . 2009;113(11):4257–9.
Materials and Methods
70
9. Subrahmanyam K, Vivekchand S, Govindaraj A, Rao C. A study of
graphenes prepared by different methods: characterization, properties and
solubilization. Journal of Materials Chemistry . 2008;18(13):1517–23.
10. Baudin B, Bruneel A, Bosselut N, Vaubourdolle M. A protocol for isolation
and culture of human umbilical vein endothelial cells. Nature Protocols .
2007 Mar 1;2(3):481–5.
11. Mosmann T. Rapid colorimetric assay for cellular growth and survival:
Application to proliferation and cytotoxicity assays. Journal of
Immunological Methods . 1983;65(1-2):55–63.
12. Koh JY, Choi DW. Quantitative determination of glutamate mediated
cortical neuronal injury in cell culture by lactate dehydrogenase efflux
assay. Journal of Neuroscience Methods . 1987;20(1):83–90.
13. Hotulainen P, Llano O, Smirnov S, Tanhuanpää K, Faix J, Rivera C, et al.
Defining mechanisms of actin polymerization and depolymerization during
dendritic spine morphogenesis. The Journal of cell biology .
2009;185(2):323–39.
14. Wang H, Joseph JA. Quantifying cellular oxidative stress by
dichlorofluorescein assay using microplate reader11Mention of a trade
name, proprietary product, or specific equipment does not constitute a
guarantee by the United States Department of Agriculture and does not
imp. Free Radical Biology and Medicine . 1999;27(5-6):612–6.
15. Crow JP. Dichlorodihydrofluorescein and dihydrorhodamine 123 are
sensitive indicators of peroxynitrite in vitro: implications for intracellular
measurement of reactive nitrogen and oxygen species. Nitric oxide biology
and chemistry official journal of the Nitric Oxide Society . 1997;1(2):145–
57.
16. Johnson I, Spence MTZ. Molecular Probes Handbook, A Guide to
Fluorescent Probes and Labeling Technologies . Life Technologies; 2010.
Materials and Methods
71
17. Guthrie HD, Welch GR. Determination of high mitochondrial membrane
potential in spermatozoa loaded with the mitochondrial probe 5,5’,6,6'-
tetrachloro-1,1',3,3'-tetraethylbenzimidazolyl-carbocyanine iodide (JC-1)
by using fluorescence-activated flow cytometry. Methods in molecular
biology (Clifton, N.J.) . 2008;477:89–97.
18. van Engeland M, Nieland LJ, Ramaekers FC, Schutte B, Reutelingsperger
CP. Annexin V-affinity assay: a review on an apoptosis detection system
based on phosphatidylserine exposure. Cytometry . 1998;31(1):1–9.
19. Krishan A. Rapid flow cytofluorometric analysis of mammalian cell cycle
by propidium iodide staining. The Journal of cell biology . 1975;66(1):188–
93.
20. Chandran P, Sasidharan A, Ashokan A, Menon D, Nair S, Koyakutty M.
Highly biocompatible TiO�:Gd3+ nano-contrast agent with enhanced
longitudinal relaxivity for targeted cancer imaging. Nanoscale .
2011;3(10):4150–61.
21. Ashokan A, Chandran P, Sadanandan AR, Koduri CK, Retnakumari AP,
Menon D, et al. Development and haematotoxicological evaluation of
doped hydroxyapatite based multimodal nanocontrast agent for near-
infrared, magnetic resonance and X-ray contrast imaging. Nanotoxicology .
2011.
22. Dhawan A, Bajpayee M, Parmar D, Singh NP, Lai HC, Hartmann A, et al.
Comet Assay in Toxicology . Cambridge: Royal Society of Chemistry;
2009.