chapter 25 what seismic risk do we design for when we
TRANSCRIPT

Chapter 25What Seismic Risk Do We Design for WhenWe Design Buildings?
Iunio Iervolino
Abstract This paper discusses two issues related to the seismic performance ofcode-conforming structures from the probabilistic standpoint: (i) the risk structuresare implicitly exposed to when designed via state-of-the-art codes; (ii) which earth-quake scenarios are expected to erode the portion of safety margins determined byelastic seismic actions for these structures. Both issues are addressed using recentresearch results referring to Italy.
Regarding (i), during the last few years, the Italian earthquake engineeringcommunity is putting effort to assess the seismic risk of structures designedaccording to the code currently enforced in the country, which has extended simi-larities with Eurocode 8. For the scope of the project, five structural typologies weredesigned according to standard practice at five sites, spanning a wide range ofseismic hazard levels. The seismic risk assessment follows the principles ofperformance-based earthquake engineering, integrating probabilistic hazard andvulnerability, to get the annual failure rates. Results, although not fully consolidatedyet, show risk increasing with hazard and uneven seismic reliability acrosstypologies.
With regard to (ii) it is discussed that, in the case of elastic design actions basedon probabilistic hazard analysis (i.e., uniform hazard spectra), exceedance of spectralordinates can be likely-to-very-likely to happen in the epicentral area of earthquakes,which occur relatively frequently over a country such as Italy. Although this can beintuitive, it means that design spectra, by definition, do not necessarily determine(elastic) design actions that are conservative for earthquakes occurring close to theconstruction site. In other words, for these scenarios protection is essentiallywarranted by the rarity with which it is expected they occur close to the structure
This manuscript is largely based on the papers by Iervolino et al. (2017) and Iervolino and Giorgio(2017)
I. Iervolino (*)Dipartimento di Strutture per l’Ingegneria e l’Architettura, Università degli Studi di NapoliFederico II, Naples, Italye-mail: [email protected]
© Springer International Publishing AG, part of Springer Nature 2018K. Pitilakis (ed.), Recent Advances in Earthquake Engineering in Europe,Geotechnical, Geological and Earthquake Engineering 46,https://doi.org/10.1007/978-3-319-75741-4_25
583

and further safety margins implicit to earthquake-resistant design (i.e., thosediscussed in the first part).
25.1 Introduction
In the current state-of-the-art seismic codes (e.g., the Italian building code, CS.LL.PP. 2008, NTC08 hereafter, similar to Eurocode 8 or EC8, CEN 2004) structuralperformance, with respect to violation of given limit states (failure hereafter), mustbe verified for levels of ground motions associated with specific exceedance returnperiod (Tr) at the building site. In case of ordinary structures, for example, safetyverifications for life-safety and collapse-prevention limit states are required againstground motion levels that are exceeded on average once every 475 and 975 years(probabilities of exceedance of 10% and 5% in 50 years), respectively.1 In such adesign practice, if failure were to always occur for intensities larger than thoseconsidered during design, and never did occur for intensities lower than the designone, then the risk of failure (i.e., the seismic risk) would be equal to the exceedancerate of the design intensity, that is the reciprocal of the return period. However,thanks to code requirements, it is generally expected that the seismic risk of failure issmaller than that of exceedance of the design ground motion. On the other hand,these further safety margins are neither explicitly controlled nor quantified, whichmeans that the resulting seismic risk, that is the rate of earthquakes causing failure ofcode-conforming structures, is implicit to structural design.2
When modern codes are concerned, a rational safety goal might be that designingtwo different structures for the seismic intensity with the same exceedance returnperiod brings comparable seismic risk. For example, two structures belonging to thesame structural typology, with the same use, designed in different sites, or differentstructural typologies designed for the same limit state at the same site. However,because there’s no probabilistic control beyond exceedance of elastic design actions,it is not granted neither that the same exceedance probability determines the seismicrisk nor that such a risk is necessarily acceptable.
The research work discussed herein intends to shed some light on what is theseismic risk of (Italian) code-conforming structures designed for seismic actionsbased on probabilistic seismic hazard analysis and, given that failure is allowed bystate-of-the-art codes, in which earthquakes it is more likely. To this aim, the rest ofthe manuscript is divided in two parts. In the first one, the results of a large researchproject attempting to assess the implicit-by-design seismic risk of standard code-conforming buildings, is discussed. For the scope of the project, five structural
1In EC8 the same actions are used for the limit states identified as significant damage and nearcollapse, respectively.2Other quantities such as material design characteristics or design loads originate from probabilisticconsiderations, yet their reflection of the global safety margins of the structure is structure-specificand is not explicitly controlled.
584 I. Iervolino

typologies were designed according to the most recent seismic code and standardpractice at five sites, spanning a wide range of design hazard from low- to high-seismicity. These structures are also finely modeled to capture dynamically theirthree-dimensional non-linear behavior during earthquakes. The assessment of theirrisk follows the principles of performance-based earthquake engineering integratingprobabilistic hazard and vulnerability, to get the annual failure rates.
Once the rate of earthquakes causing violation of the performance levels ofinterest is assessed, it may be interesting to change the perspective and to look,from the seismic hazard side, what are the earthquake scenarios (i.e., magnitude andlocation with respect to the construction site) for which design intensity is exceededwith high probability. To this aim, it is discussed that, in the case of elastic actionsbased on probabilistic hazard analysis (i.e., uniform hazard spectra), exceedance ofspectral ordinates can be likely-to-very-likely to happen in the epicentral area ofearthquakes, which are not necessarily of extreme magnitude. Although this can beintuitive, it means that design spectra do not necessarily determine (elastic) designactions conservative for moderate-to-high magnitude earthquakes (i.e., those occur-ring every few years over Italy) in case they occur close to the construction site. Inother words, for these scenarios protection is basically warranted by the rarity withwhich it is expected they occur close to the structure or, in case of occurrence, byfurther safety margins implicit to earthquake-resistant design (i.e., those not explic-itly controlled that are discussed in the first part).
25.2 The RINTC 2015–2017 Project
To quantitatively address the seismic risk code-conforming design implicitlyexposes structures to, a large research project is ongoing in Italy. This project,named Rischio Implicito di strutture progettate secondo le Norme Tecniche per leCostruzioni (RINTC),3 has been developed by a joint working group formedbetween Rete dei Laboratori Universitari di Ingegneria Sismica (ReLUIS) andCentro Europeo di Ricerca e Formazione in Ingegneria Sismica (EUCENTRE),with the funding of Presidenza del Consiglio dei Ministri – Dipartimento dellaProtezione Civile (see, RINTC Workgroup 2017).
In the RINTC project, structures, belonging to a variety of typologies andconfigurations, were designed according to the current Italian code provisions in anumber of sites at different hazard levels (Milan or MI, Caltanissetta or CL, Rome orRM, Naples or NA, and L’Aquila or AQ) and local site conditions (A and Caccording to EC8 classification). In Fig. 25.1 the considered sites are shown on theofficial Italian map of peak ground acceleration (PGA) with 475 years exceedance
3Project website’s URL: http://www.reluis.it/index.php?option¼com_content&view¼article&id¼549&Itemid¼198&lang¼it
25 What Seismic Risk Do We Design for When We Design Buildings? 585
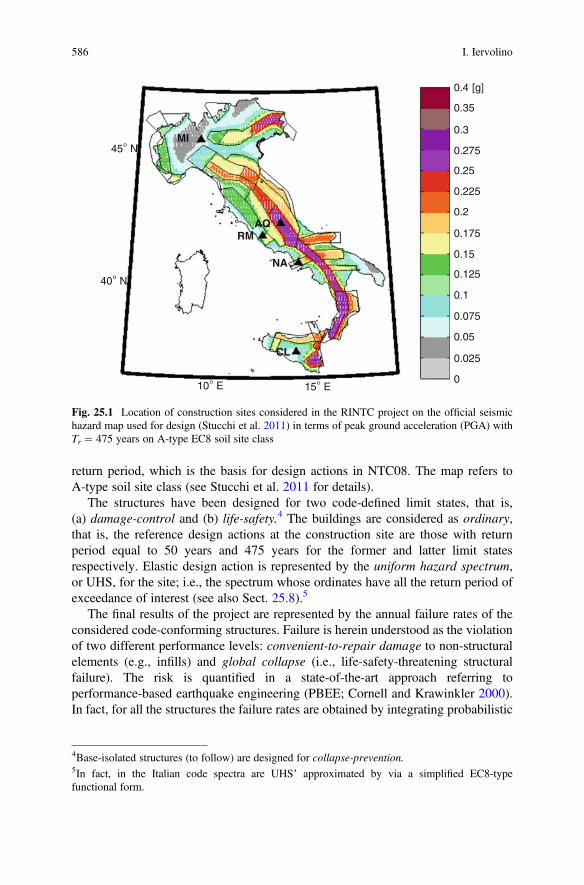
return period, which is the basis for design actions in NTC08. The map refers toA-type soil site class (see Stucchi et al. 2011 for details).
The structures have been designed for two code-defined limit states, that is,(a) damage-control and (b) life-safety.4 The buildings are considered as ordinary,that is, the reference design actions at the construction site are those with returnperiod equal to 50 years and 475 years for the former and latter limit statesrespectively. Elastic design action is represented by the uniform hazard spectrum,or UHS, for the site; i.e., the spectrum whose ordinates have all the return period ofexceedance of interest (see also Sect. 25.8).5
The final results of the project are represented by the annual failure rates of theconsidered code-conforming structures. Failure is herein understood as the violationof two different performance levels: convenient-to-repair damage to non-structuralelements (e.g., infills) and global collapse (i.e., life-safety-threatening structuralfailure). The risk is quantified in a state-of-the-art approach referring toperformance-based earthquake engineering (PBEE; Cornell and Krawinkler 2000).In fact, for all the structures the failure rates are obtained by integrating probabilistic
45° NMI
RMAQ
NA
CL
40° N
10° E 15° E0
0.025
0.05
0.075
0.1
0.125
0.15
0.175
0.2
0.225
0.25
0.275
0.3
0.35
0.4 [g]
Fig. 25.1 Location of construction sites considered in the RINTC project on the official seismichazard map used for design (Stucchi et al. 2011) in terms of peak ground acceleration (PGA) withTr ¼ 475 years on A-type EC8 soil site class
4Base-isolated structures (to follow) are designed for collapse-prevention.5In fact, in the Italian code spectra are UHS’ approximated by via a simplified EC8-typefunctional form.
586 I. Iervolino

seismic structural vulnerability (i.e., fragility) and seismic hazard for the sites wherethe structures are located. To compute the failure rates, Eq. (25.1) is employed.
λf ¼Zþ1
0
P failure IM ¼ imj½ � � dλIM imð Þj j ð25:1Þ
In the equation, IM indicates a ground motion intensity measure, while|dλIM(im)| ¼ � [dλIM(im)/d(im)] � d(im) is the differential of λIM(im), or thehazard curve. It is the function providing the annual rate of earthquakes causingthe exceedance of an IM threshold, indicated as im. The hazard curve isobtained from probabilistic seismic hazard analysis or PSHA (Cornell 1968);to follow. P[failure|IM ¼ im] is the fragility function of the structure underanalysis. It provides the probability of failure for IM ¼ im; i.e., for any arbitraryvalue of the ground motion intensity measure.
25.3 Structures and Modeling
The five structural types of buildings refer to standard modern constructions and arewidely representative of residential or industrial structures in Italy. Design pro-cedures refer as much as possible to common professional engineering practice.The considered cases as of the end of 2017 (the project is still ongoing) are:
1. cast-in-place reinforced concrete (RC) regular 3-, 6-, and 9-story residentialmoment-resisting-frame structures, designed via modal analysis (Camata et al.2017), with the following configurations:
(a) bare-frames (BF);(b) pilotis-frames (PF);(c) infilled-frames (IF);(d) (9-storey) with concrete structural walls (SW);
2. un-reinforced masonry (URM) 2- and 3-story residential buildings, with fourdifferent geometries, designed with the simple building and linear or non-linearstatic analysis approaches (Camilletti et al. 2017), with the followingconfigurations
(a) regular;(b) irregular;
3. pre-cast reinforced concrete (PRC) 1-story industrial buildings with two differentplan geometries and two different heights (Ercolino et al. 2017), with the follow-ing configurations:
(a) without cladding panels;(b) with cladding panels;
25 What Seismic Risk Do We Design for When We Design Buildings? 587

4. steel (S) 1-story industrial buildings (Scozzese et al. 2017) with two different plangeometries and two different heights, in analogy of configurations with respect toPRC:
(a) without cladding panels;(b) with cladding panels;
5. base-isolated (BI) 6-story reinforced concrete residential buildings (Ponzo et al.2017) with base isolation system made of:
(a) rubber bearings (HDRB);(b) double-curvature friction pendulums (DCFP);(c) hybrid (HDRB and sliders).
In the computation of failure rates, record-to-record variability of seismicresponse is the primary source of uncertainty; i.e., structural models are generallydeterministic. However, for selected cases (indicated as ModUnc) of each typology,the uncertainty in structural modeling and in design has been accounted for follow-ing the approach described in Franchin et al. (2017); however, the effect of factors,such as quality of construction or design errors, was always neglected. Moreover,one selected case of 9-story RC with structural walls, includes explicit modeling ofsoil-structure-interaction (SSI).
Table 25.1 summarizes the case studies at the end of 2017. Note that, to reducethe effort, not all structures have been designed for all five sites, although most of
Table 25.1 Designed and analyzed structures at the end of 2017
Type Soil MI NA AQ
RC A – – 9-story (BF/PF/IF)
C 3/6/9-story (BF/PF/IF)
3/6/9-story (BF/PF/IF)
3/6/9-story (BF/PF/IF)
9-story SW ModUnc ModUnc
9-story SW (also w/SSI)
9-story SW
URM A 2/3-story, regular/irregular
2/3-story, regular/irregular
2/3-story, regular
ModUnc
C 2/3-story, regular/irregular
2/3-story, regular/irregular
2/3-story, regular/irregular
PRC A 1-story, 4 geometries 1-story, 4 geometries 1-story, 4 geometries
C 1-story, 4 geometries 1-story, 4 geometries 1-story, 4 geometries
S A 1-story, 4 geometriesw/ and w/o panels
1-story, 4 geometriesw/ and w/o panels
1-story, geometry 1/2/3/4 w/and w/o panels
C 1-story, 4 geometriesw/ and w/o panels
1-story, 4 geometriesw/ and w/o panels
1-story, 4 geometries w/ andw/o panels
BI A – – –
C – 6-story, HDRB/HDRB+slider
6-story, HDRB/HDRB w/slider/DCFP (11 configurations)
ModUnc
588 I. Iervolino
them have been designed for at least three sites reflecting low, moderate and highhazard levels (Milan, Naples, and L’Aquila, respectively)
25.4 Hazard
Equation (25.1) requires hazard curves to compute failure rates. The resultsof the probabilistic hazard study at the basis of NTC08 are available athttp://esse1-gis.mi.ingv.it/. They are given in terms of hazard curves for 5%-damped(pseudo) spectral acceleration on A-type soil site class for eleven oscillation periods(T) ranging from 0 s (PGA) to 2 s, computed for a grid featuring more thanten-thousands locations that covers the entire country. The curves are discretizedat nine return periods, between 30 years and 2475 years. In the RINTC project thespectral (pseudo) acceleration, Sa, at the fundamental period of each structure (T1) ischosen as the ground motion intensity measure. Therefore, due to limitations in thesoil type, oscillation periods for which Sa hazard is available, and return periods atwhich hazard is computed in the official study, the hazard curves at the sites ofinterest had to be re-computed for the scope of the RINTC project.
The hazard curves were calculated according to Eq. (25.2), where νi, i ¼ {1,2, . . ., s}, is the rate of earthquakes above a minimum magnitude for each of thes seismic sources affecting the site of interest. The term fM, R, i(m, r) is the jointprobability density function of magnitude (M) and source-to-site distance (R) for thei-th source, and P[IM > im|M ¼ m,R ¼ r] is the probability of exceeding the IMthreshold conditional to {M,R}, provided by a ground motion prediction equation(GMPE).
λIM imð Þ ¼Xs
i¼1
νi �ZZM,R
P IM > im M ¼ m;R ¼ rj½ � � f M,R, i m; rð Þ � dm � dr ð25:2Þ
If the calculation of Eq. (25.2) is repeated for all possible values of im within aninterval of interest, one obtains the hazard curve providing λIM(im) as a function ofim. As an illustration, Fig. 25.2 shows PGA hazard curves (for soil site class Baccording to EC8) for the five locations of the project. The curves were computedconsidering the branch 921 of the logic tree described in Stucchi et al. (2011), whichfeatures the source characterization described in Meletti et al. (2008) and the GMPEof Ambraseys et al. (1996).6 These models that constitute the core of the hazardmodel developed to produce the official seismic hazard map used for design in Italy,and were also used in the RINTC to determine the seismic risk according toEq. (25.1).
6Note that assessing the performance of some structures required considering spectral accelerationsat vibration periods not contemplated by the GMPE of Ambraseys et al. (1996), for these cases thatof Akkar and Bommer (2010) was employed.
25 What Seismic Risk Do We Design for When We Design Buildings? 589

In addition, disaggregation of seismic hazard (e.g., Bazzurro and Cornell 1999),was carried out. It was required to perform hazard-consistent record selectionrequired to run the non-linear dynamic analyses forming the basis of the riskassessment.
25.5 Fragility
Three-dimensional computer models were developed for all the designed structureswith the aim of evaluating their seismic performance via non-linear dynamic anal-ysis. The structural response measure or EDP (engineering demand parameter)considered was the maximum (in the two horizontal directions of the structure)demand over capacity ratio, expressed in terms of interstory drift angle or roof-driftangle. The main failure criterion for the assessment of global collapse was the driftcorresponding to the 50% drop in base shear from the static push-over analysis (seeRINTC Workgroup 2017). However, for some structural configurations some addi-tional failure criteria were needed, for example, PRC required control of failure ofconnections, while base-isolated buildings required specific criteria for failure of theisolation system. For damage to non-structural elements, multiple failure criteriaconsidering the extent of damage over the building, were considered.
All models are lumped-plasticity, except for the industrial steel building casesthat were modeled using distributed plasticity elements. All structures are analyzedwith OPENSEES (Mazzoni et al. 2006) apart from the masonry structures that areanalyzed using TREMURI (Lagomarsino et al. 2013).
It was mentioned that P[failure|IM ¼ im] as a function of im is the fragilityfunction of the structure. In this study, for each considered structure, the fragilitycurve was computed via non-linear dynamic analysis using Eq. (25.3). To this aim,
Fig. 25.2 Example ofhazard curves for theconsidered sites in terms ofPGA on siite class B (EC8classification)
590 I. Iervolino

the domain of IM, that is Sa(T1), has been discretized to ten values, corresponding tothe following return periods from the hazard curve of interest:Tr ¼ {10, 50, 100, 250, 500, 1000, 2500, 5000, 10000, 100000} years.
P failure IM ¼ imij½ �¼ 1�Φ
log edpf� �� μlog EDP IM¼imijð Þ
σlog EDP IM¼imijð Þ
" #( )� 1� Ncol, IM¼imi
Ntot, IM¼imi
� �þ Ncol, IM¼imi
Ntot, IM¼imi
ð25:3ÞIn the equation, edpf indicates structural seismic capacity for the performance
level of interest; μlog EDP IM¼imijð Þ; σlog EDP IM¼imijð Þn o
are the mean and standard
deviation of the logs of EDP when IM ¼ imi, i ¼ {1, . . ., 10}; Φ(�) is the cumu-lative Gaussian distribution function;Ncol, IM¼imi is the number of collapse cases (i.e.,those reaching global instability according to the terminology in Shome and Cornell2000); and Ntot, IM¼imi is the number of ground motion records with IM ¼ imi.
The method to probabilistically evaluate structural response, and then fragility,was the multi-stripe nonlinear dynamic analysis (e.g., Jalayer 2003). To select theground motion records to be used as input for dynamic analysis, the hazard-consistent conditional spectrum (CS) approach (e.g., Lin et al. 2013), has beenconsidered. Ground motion record sets selected for each CS are consistent withthe earthquake scenarios (expressed in terms of magnitude and source-to-site dis-tance) that contributed the most to Sa(T1) ¼ imi according to disaggregation of sitehazard. Because the scenarios controlling the hazard, in general, change with thespecific value of Sa(T1) considered, different sets of records were selected for eachhazard level (see Iervolino et al. 2017, for some details). All the analyses neglected,so far, the vertical components of ground motion as specific analyses show no needto take them into account.
25.6 Trend of Failure Rates
Equation (25.1) can be used for the computation of failure rates only for the values ofλIM(im) provided by hazard analysis. The latter, has a limit at 1/Tr ¼ 10�5 [event/year]; in fact, no Sa(T1) values for return periods longer than Tr ¼ 105 years werecalculated, to avoid large hazard extrapolations. Therefore, it has been conserva-tively assumed that ground motions with an IM larger than that corresponding toTr ¼ 105 years, cause failure with certainty. This means that the failure rate has beenapproximated in excess by Eq. (25.4).
25 What Seismic Risk Do We Design for When We Design Buildings? 591

λf ¼ZimTr¼105
0
P failure IM ¼ imj½ � � dλIM imð Þj j þ 10�5 ð25:4Þ
In the equation, imTr¼105 indicates the last available im-value for which a returnperiod of exceedance has been calculated. Consequently, in those cases when thefirst part of the integral is negligible with respect to10�5, then Eq. (25.4) only allowsto state that the annual failure rate is lower than 10�5.
Figures 25.3 reports the global collapse failure rates, as of the end of 2016, for soilsite class C at three of the considered sites. These results, although not final, indicatethe following:
1. as a general trend, the collapse failure rates generally tend to increase with the sitehazard, independent of the structural type considered (likely due to over-strengthimposed at moderate-to-low hazard sites by, for example, minimum designrequirements; see also Suzuki et al. 2017);
2. the failure rates tend not to be uniform among different structural types designedfor the same site hazard;
3. in some cases, the collapse failure rates are so low that only an upper bound to theactual failure rate can be provided; i.e., λf � 10�5; however, in other cases it iscomparable to (or larger than) the annual rate of exceedance of the design seismicintensity; e.g., 1/475 ¼ 0.0021.
Although these general trends clearly emerge from the last three years of theRINTC project, it is emphasized that it is still ongoing and several of these results(and other not shown here) are undergoing verification and investigation towards
Fig. 25.3 Failure rates for global collapse (soil site class C) at three of the considered sites inascending order of hazard. (Figure adapted from Iervolino et al. 2017)
592 I. Iervolino

consolidation. Caution should be applied in using all results presented. For example,the critically-high risk exhibited by some PRC structures are likely due to somedesign and modeling options of beam-to-column connections and, therefore, are notdefinitive. Similarly, the comparatively high collapse failure rates of base-isolatedstrctures seem due to their more controlled behavior during design and the lowermargin of safety with respect to collapse beyond the maximum design displacement;conversely, base-isolated structures show comparatively lower rates of onset ofdamage to non-structural elements (not shown here).
25.7 The Nature of Uniform-Hazard Design Spectra
It has been discussed with what frequency (annual rate) failure is expected for code-conforming structures; in this part of the paper it is analyzed which earthquakeserode the safety margins that depend on the elastic design seismic actions (Iervolinoand Giorgio 2017).
The latest version of the Italian earthquake catalogue (CPTI15;http://emidius.mi.ingv.it/CPTI15-DBMI15/), assigns moment magnitude largerthan six to thirteen earthquakes in the 1915–2014 period, which translates to anaverage of one event every eight years in the past century. During the lastdecade, among the main (i.e., severely damaging) seismic sequences for thecountry, one counts that of L’Aquila (2009), that of Emilia (2012) and that ofcentral Italy 2016–2017 (the latter not included in CPTI15), whose largest(moment) magnitude earthquakes were 6.3, 6.1 and 6.5, respectively. In thesame period of these events, NTC08 went into effect, which, as mentioned,prescribe seismic design actions determined on a probabilistic basis by meansof the uniform hazard spectra or UHS’ that were also used for design in theRINTC project.
The recent seismic events provided an unprecedented level of instrumentalrecordings, for the country (see for example Luzi et al. 2017). These data allow acomparison of actually-observed seismic actions with their code-prescribed coun-terparts used for designing new structures. Said comparison has repeatedly shownregistered seismic actions, in the epicentral areas, systematically exceeding designspectra, which, in turn, vamped a debate on whether the design actions wereincorrectly evaluated. The objective herein is to demonstrate that such exceedanceis well expected based on the nature of UHS’. Observed exceedances cannot beconsidered sufficient to claim that the code-mandated seismic actions underestimatethe seismic hazard. On the contrary, they are a foreseeable consequence of thephilosophy that underlies definition of seismic actions in the code, when it isbased on probabilistic seismic hazard. Consequently, it is also shown that UHSrepresent design action likely exceeded in the epicentral areas of earthquakesoccurring relatively frequently in Italy. Thus, in these events, safety is mostlyentrusted to the safety margins beyond the elastic design spectrum.
To prove the proposition, the starting point is discussing the seismic actionsobserved during the 2009 L’Aquila earthquake (e.g., Chioccarelli et al. 2009).
25 What Seismic Risk Do We Design for When We Design Buildings? 593

Figure 25.4 shows the spectra of the horizontal components of seismicground motion recorded in L’Aquila (AQV monitoring station of the ReteAccelerometrica Nazionale managed by the Italian Dipartimento della ProtezioneCivile; http://ran.protezionecivile.it) during the considered earthquake. The samefigure also shows the NTC08 spectrum to be used for life-safety limit-state design ofordinary construction at the AQV site (i.e., the UHS with 475 years return period ofexceedance), this is the same as the one used in RINTC except for soil site class,which matches the one of the recording station, for comparison purposes. Onenotices that the design actions have been greatly exceeded over a relatively wideinterval of natural vibration periods, including the Sa(T¼ 1s) ordinate, which will beanalyzed in the following. It will be shown forthwith that this is neither strange noran indicator of deficiency of the code spectra themselves, but it is instead apredictable consequence of the nature of code spectra.
25.8 Scenario Contributions to Design Hazard
As already mentioned, the elastic design spectra of the Italian code are uniformhazard spectra. Such spectra are computed, for a given construction site, by means ofprobabilistic seismic hazard analysis described by Eq. (25.2) above.
It is now useful, for the purposes of this study, to rewrite the hazard integral as inEq. (25.5), considering, for example, the Sa(T ¼ 1s) as the IM.
λSa T¼1sð Þ sað Þ ¼ZZM,R
P Sa T ¼ 1sð Þ > sa M ¼ m;R ¼ rj½ � � νM¼m,R¼r � dm � dr
ð25:5Þ
Fig. 25.4 Response spectraof horizontal ground motionrecorded at L’Aquila (AQVstation) during the 6.3moment-magnitudeearthquake of 2009 and codespectrum for Tr ¼ 475 years(soil site class is B accordingto the EC8 classification, asreported for AQV theITalian AccelerometricArchive; http://itaca.mi.ingv.it/)
594 I. Iervolino
In the equation, νM¼m,R¼r � dm � dr ¼X s
i¼1νi � f M,R, i m; rð Þ � dm � dr represents
the rate of earthquakes of magnitude (m,m + dm) that originate at a distance equal (r,r + dr) (accounting for all considered seismic sources).
The hazard integral can be further compacted as in Eq. (25.6), where λSa(T ¼ 1s) > sa,
M ¼ m, R ¼ r � dm � dr¼ P[Sa(T¼ 1s) > sa|M¼ m,R¼ r] � νM ¼ m, R ¼ r � dm � dr is therate of earthquakes of magnitude (m,m + dm) that originate at a distance (r, r + dr),and cause exceedance of the intensity threshold, sa.
λSa T¼1sð Þ sað Þ ¼ZZM,R
λSa T¼1sð Þ>sa,M¼m,R¼r � dm � dr ð25:6Þ
λSa(T ¼ 1s) > sa, M ¼ m, R ¼ r � dm � dr is the contribution to hazard of the earthquakescenario with magnitude (m,m + dm) at distance (r, r + dr) from the site. (In thefollowing, for computation/representation purposes, dm and dr are replaced bysmall, yet finite, magnitude and distance bins, Δm and Δr, respectively.)
Focusing, for example, attention on Sa(T ¼ 1s) with λSa(T ¼ 1s) ¼ 0.0021 (i.e., theSa(T ¼ 1s) value with Tr ¼ 475 years at the site), let us call this value saTr¼475, it isevident from Eq. (25.6) that none of the aforementioned single contributions mayexceed this value; i.e., λSa(T ¼ 1s) > sa, M ¼ m, R ¼ r �Δm �Δr � 0.0021, 8 {m, r}.Because the lowest magnitude earthquakes are, typically, more frequent than highermagnitudes, this limitation is met in a way that when the former events occur, theyhave a low probability of exceeding the acceleration threshold that corresponds tothat rate. Conversely, the latter events, having low recurrence rate can have highexceedance probability; i.e., P[Sa(T ¼ 1s) > sa|M ¼ m,R ¼ r] can approach one.
To better illustrate the point, Fig. 25.5 provides a discretized representation, interms of magnitude-distance bins, of the individual contributions of magnitude anddistance pairs to saTr¼475 at L’Aquila. Such a representation is obtained using thesame hazard component models described in Sect. 25.4 and used for the RINTCproject, which yielded saTr¼475 ¼ 0:27g on EC8 soil site class B.
Figure 25.5 (bottom) provides the rates λSa(T ¼ 1s) > sa, M ¼ m, R ¼ r � Δm � Δr[1/year], that is, for each {M,R} bin (i.e., a scenario), the average number ofearthquakes per year causing exceedance of saTr¼475 ¼ 0:27g (by definition, thesum of these rates over all the bins is equal to 0.0021).7 Fig. 25.5 (top-left) gives therates of occurrenceof earthquakes corresponding to eachbin; i.e., νM¼m, R¼ r �Δm �Δr[1/year]. Finally, Fig. 25.5 (top-right) provides the probability that earthquakescorresponding to each magnitude-distance scenario cause exceedance of 0.27 g;i.e., P Sa T ¼ 1sð Þ > saTr¼475 M ¼ m;R ¼ rj½ �. The product of values in Fig. 25.5(top-left) and Fig. 25.5 (top-right), corresponding to the same {M,R} bin, providesthe value in Fig. 25.5 (bottom) for that bin; see Eq. (25.5).
The rates of occurrence in Fig. 25.5 (top), rapidly decrease with increasingmagnitude, independently of distance, as expected. Looking at the dependence ofνM ¼ m, R ¼ r � Δm � Δr on source-to-site distance, it appears that the rates tend to
7Note that the table factually represents the distribution of magnitude and distance one obtains fromhazard disaggregation multiplied by 0.0021.
25 What Seismic Risk Do We Design for When We Design Buildings? 595

decrease with distance approaching to zero, because relatively smaller portions ofthe source zones fall in a circle/ring with center in the site of interest and smallerradius. Consequently, there is a large number of bins with small-to-very-smalloccurrence rate (i.e., white areas in the figure), they correspond to large magnitudesat all distances, or moderate-to-large magnitudes at small distance.
Figure 25.5 (center) provides the effect of the magnitude-distance scenarios interms of probability of exceeding saTr¼475. Because such a probability increases withincreasing magnitude and decreasing distance as indicated by GMPEs, it can be seen
Fig. 25.5 Scenario representation of the hazard at L’Aquila in terms of Sa(T¼ 1s) with exceedancereturn period equal to 475 years. The top-left panel reports the rates of occurrence [1/year] ofmagnitude-distance bins; the top-right panel provides the probability of exceedance, of saTr¼475, foreach bin; the bottom is panel the product of the previous two bin-by-bin. Summing-up bars in thebottom panel provides 0.0021 ¼ 1/475 and corresponds to the integral of Eq. (25.6).
596 I. Iervolino

that several bins with low rate in the top panel can have very large exceedanceprobability, if they actually occur, that approaches one in some cases. In particular,the exceedance probability, conditional to {M,R}, starts to be significant forM� 6,R � 5km, but it is large up to R � 60km for magnitudes larger than seven.
As mentioned, Fig. 25.5 (bottom) reports the hazard contributions of magnitude-distance scenarios, weighing the exceedance probability of each scenario by its occur-rence rate: λSa(T¼ 1s) > sa,M¼ m, R¼ r¼ P[Sa(T¼ 1s) > sa|M¼m,R¼ r] � νM¼ m, R¼ r. Itappears from the figure that the {M,R} pairs giving the largest contributions are, in general,close earthquakes, because of their large P[Sa(T¼ 1s) > sa|M¼ m,R¼ r]. However, thelargest values of λSa(T ¼ 1s) > sa, M ¼ m, R ¼ r � Δm � Δr do not correspond to the largestmagnitude occurring at the smallest distance, because these are very rare events; i.e., withcomparatively small νM ¼ m, R ¼ r � Δm � Δr.
In fact, among the close-by earthquakes the most significant exceedance rates aregiven by smaller magnitudes. These events are more frequently occurring close tothe site than extreme magnitudes, yet the probability of exceeding the threshold forsome of them is not small at all, as demonstrated in the next section.
25.9 Close Earthquakes
As expected, close-by earthquakes give the largest contribution to hazard. In fact,summing up the values of the bars from {M,R} bins up to R � 50km in Fig. 25.5(bottom) one obtains 0.019, which means that the earthquakes occurring within thisdistance account for 90% of the contributions to Sa(T ¼ 1s) hazard with exceedancereturn period Tr¼ 475 years in L’Aquila. This is a common situation when the site iswithin a seismic source zone that dominates the hazard (see Iervolino et al. 2011).
Focusing exclusively on the contributions of the earthquakes occurring within50 km, it can be seen that there are different magnitudes with similar contributions.For example, an earthquake of magnitude M 2 (5.05, 5.35) at a distance between0km � R < 5km has λSa(T ¼ 1s) > sa, M ¼ m, R ¼ r � Δm � Δr equal to about 1.2E-5[1/year], which is about the same of an earthquake of magnitude M 2 (6.85, 7.15) atdistance 0km � R < 5km. However, this equivalent contribution to hazard arisesfrom very different occurrence rates and conditional exceedance probabilities, as itcan be seen in Table 25.2, where the values from the three panels Fig. 25.5 are givenfor the two scenarios.
Analyzing Table 25.2 is crucial in demonstrating the initial proposition of thispart of the paper. Despite the same threshold exceedance rate, the two scenarios arevery different in rarity, as expected. With the lower magnitude being about fifteentimes more frequent than the larger. Conversely, when an earthquakeM� 5.2 occursclose to the site, it has 6% probability of exceeding the Sa(T ¼ 1s) ordinate of theTr ¼ 475 years UHS for L’Aquila; i.e., in case of occurrence there is 0.94% chancethat the UHS is not exceeded at the T ¼ 1s ordinate. Conversely, if L’Aquila wereclose to an M � 7 event, then the probability of exceeding the threshold would belarger than 90%. It immediately follows from this reasoning that the UHS is hard to
25 What Seismic Risk Do We Design for When We Design Buildings? 597

be exceeded only by distant earthquakes or by the relatively more frequent amongclose earthquakes. On the other hand, it is very likely to almost certain, depending onthe magnitude (see Fig. 25.5, center), that it is going to be exceeded by the more rareamong close-by earthquakes. Therefore, the UHS may not represent a high thresholdin the case of occurrence of this kind of earthquakes.
It must be underlined that this reasoning does not question that the ordinates ofthe UHS for the site are exceeded, as intended, on average once every 475 years.However, this exceedance return period, for the rarest earthquakes, is warranted bythe fact that their occurrence close to the site is unlikely. On the other hand, whensuch earthquakes do occur near a given site, the exceedance of design actions can beprobable-to-very-probable, depending on the considered scenario.
Similar reasoning can be applied to any other spectral ordinate and/or returnperiod, although the range of scenarios to which it applies is expected to change inthe very same way disaggregation depends on the spectral ordinate or return periodunder consideration.
25.10 What to Expect for a Magnitude 6.3 Event
In the light of all that was shown above, one may now return to examine whathappened at AQV during the mainshock of the L’Aquila 2009 earthquake.
AQV was at close distance to the epicenter (zero in terms of Joyner and Boore1981, distance, which is the distance from the surface projection of the earthquakerupture), then it was somewhat likely to observe exceedance of the Tr ¼ 475 yearsUHS at that site. In fact, according to the GMPE of Ambraseys et al. (1996), for anearthquake of magnitude 6.3 at 0 km, P[Sa(T¼ 1s) > 0.27g|M¼ 6.3,R¼ 0] > 0.6 onsoil site class B (see Fig. 25.5, center). Therefore, first, exceedance of the Tr ¼ 475years Sa(T ¼ 1s), observed in Fig. 25.4, is in accord with the models underlyinghazard analysis. Second, the earthquakes exceeding the UHS with very high prob-ability are not necessarily of especially high magnitude (see Fig. 25.5 center).
As a matter of fact, this discussion could be extended for the entire epicentral areaof the earthquake. In order to understand which are the locations where exceedanceof design actions ought to have been avoided, one should examine Fig. 25.6. Firstthing shown on that figure is the surface projection of the rupture that caused
Table 25.2 Two scenarios with comparable contributions to hazard, but very different frequencyof occurrence and probability of exceeding the design Sa(T ¼ 1s) in L’Aquila in case of occurrence
5.05 � M < 5.35,0 � R < 5
6.85 � M < 5.15,0 � R < 5
νR ¼ r, M ¼ m � Δm � Δr[1/year] 2.0E-4 1.3E-5
P Sa T ¼ 1sð Þ > saTr¼475jM ¼ m;R ¼ r½ � 6E-2 9E-1
λSa T¼1sð Þ>saTr¼475,M¼m,R¼r � Δm � Δr[1/year]
1.2E-5 1.2E-5
598 I. Iervolino

the earthquake (dash-dot line) and the administrative limits of the area’s municipal-ities (thin black lines). On the same figure, the saTr ¼ 475 values for the area, fromthe analysis described in Stucchi et al. 2011,8 are shown as colored contours.The black iso-probability delimit areas exhibiting various probabilities,P Sa T ¼ 1sð Þ > saTr¼475jM ¼ m;R ¼ r½ �, of observing the exceedance of thecode-mandated design actions depicted in the underlying colored contours. Theprobabilities were calculated using the GMPE of Ambraseys et al. (1996), thesame employed when determining the code design actions of the underlying coloredmap, so that the calculations are consistent.
One notes that, in a relatively wide area on/around the source, the exceedance ofdesign Sa(T ¼ 1s) was likely (e.g., larger than 50%) for an earthquake of themagnitude and location as those occurred on April 6th 2009. As argued for theindividual case of AQV, this is by no means contradicting the hazard map but it israther an intrinsic characteristic thereof. On the other hand, the probability ofexceeding the seismic actions rapidly decreases as one moves farther away fromthe rupture.
Fig. 25.6 Design Sa(T ¼ 1s) (i.e., those fromFig. 25.1 with 475 yearsexceedance return period)for the area hit by the April6th 2009 (momentmagnitude 6.3) L’Aquilaearthquake and equalprobability contours fortheir exceedance due to anearthquake with the samemagnitude and localizationas the one that actuallyoccurred
8Consistent with Figure 25.1, the design Sa(T ¼ 1s) map refers to type A EC8 site class.
25 What Seismic Risk Do We Design for When We Design Buildings? 599
25.11 Conclusions
This article presented some arguments about when and where damages are expectedfor code-conforming structures. The developed studies refer to Italy, however theymight have an international appeal as Italy is at the state of the art of seismic codesinternationally and its design norms have extensive similarities with Eurocode 8.
From the description of the RINTC project, a large research effort towards theassessment of seismic risk for different structural typologies, it seems to mainlyemerge that the seismic risk for structures designed with nominally equivalentdesign actions is increasing with the hazard at the site; thus, more risky structuresare designed for the most hazardous sites, although design actions at the differentsites refer to the same return periods. Thus, design based on the same hazard does notlead to the same risk for the designed structures.
From a closer look to the nature of uniform hazard spectra (on the basis of whichdesign actions are determined in the Italian code) it emerges that design elasticactions are likely-to-very-likely going to be exceeded in the case of moderate-to-high magnitude earthquakes, were they to occur close to the site. In other words, theUHS’, generally, represent intensity thresholds hard to surpass by far-away earth-quakes or by those of lower magnitude among those close-by. Conversely, they donot represent conservative thresholds for earthquakes relatively rare in occurrenceand near the site. This is well expected, and does not represent a reason to blame theway that probabilistic spectra are determined. However, the conclusion for code-conforming constructions is that safety against violation of the design limit states inthe epicentral area of earthquakes, which are observed relatively frequently all-over acountry such as Italy, is entrusted to safety margins beyond the elastic designspectrum.
Acknowledgments The study was developed between 2015 and 2017 in the framework the Retedei Laboratori Universitari di Ingegneria Sismica activities funded by Presidenza del Consiglio deiMinistri – Dipartimento della Protezione Civile (2014–2018 program). The help from AndreaSpillatura (IUSS, Pavia, Italy) and Pasquale Cito (University of Naples Federico II, Italy) is alsogratefully acknowledged.
References
Akkar S, Bommer JJ (2010) Empirical equations for the prediction of PGA, PGV, and spectralaccelerations in Europe, the Mediterranean region, and the Middle East. Seismol Res Lett81:195–206
Ambraseys NN, Simpson KU, Bommer JJ (1996) Prediction of horizontal response spectra inEurope. Earthq Eng Struct Dyn 25:371–400
Bazzurro P, Cornell CA (1999) Disaggregation of seismic hazard. Bull Seismol Soc Am89:501–520
Camata G, Celano F, De Risi MT et al (2017) RINTC project: nonlinear dynamic analyses of Italiancode-conforming reinforced concrete buildings for risk of collapse assessment. InPapadrakakis M, Fragiadakis M (eds) Proceedings of COMPDYN 2017 – 6th ECCOMAS
600 I. Iervolino

thematic conference on computational methods in structural dynamics and earth-quake engi-neering, Rhodes (GR) 2017
Camilletti D, Cattari S, Lagomarsino S et al (2017) RINTC project: Nonlinear dynamic analyses ofItalian code-conforming URM buildings for collapse risk assessment. In Papadrakakis M,Fragiadakis M (eds) Proceedings of COMPDYN 2017 – 6th ECCOMAS thematic conferenceon computational methods in structural dynamics and earth-quake engineering, Rhodes(GR) 2017
CEN, European Committee for Standardisation (2004) Eurocode 8: design provisions for earth-quake resistance of structures, Part 1.1: general rules, seismic actions and rules for buildings, EN1998-1
Chioccarelli E, De Luca F, Iervolino I (2009) Preliminary study on L’Aquila earthquake groundmotion records V5.2. Available at http://www.reluis.it/. Last accessed December 2017
Cornell CA (1968) Engineering seismic risk analysis. Bull Seismol Soc Am 58:1583–1606Cornell CA, Krawinkler H (2000) Progress and challenges in seismic performance assessment.
PEER Center News 3:1–3CS.LL.PP (2008) DM 14 gennaio, Norme tecniche per le costruzioni Gazzetta Ufficiale della
Repubblica Italiana 29 (in Italian)Ercolino M, CimminoM, Magliulo G et al (2017) RINTC project: nonlinear analyses of Italian code
conforming precast R/C industrial buildings for risk of collapse assessment. In Papadrakakis M,Fragiadakis M (eds) Proceedings of COMPDYN 2017 – 6th ECCOMAS thematic conferenceon computational methods in structural dynamics and earth-quake engineering, Rhodes(GR) 2017
Franchin P, Mollaioli F, Noto F (2017) RINTC project: influence of structure-related uncertaintieson the risk of collapse of Italian code-conforming reinforced concrete buildings. InPapadrakakis M, Fragiadakis M (eds) Proceedings of COMPDYN 2017 – 6th ECCOMASthematic conference on computational methods in structural dynamics and earth-quake engi-neering, Rhodes (GR) 2017
Iervolino I, Giorgio M (2017) Regional exceedance frequency of uniform hazard spectra (Whichearthquakes do design spectra protect against?) (In review)
Iervolino I, Chioccarelli E, Convertito V (2011) Engineering design earthquakes from multimodalhazard disaggregation. Soil Dyn Earthq Eng 31:1212–1231
Iervolino I, Spillatura A, Bazzurro P (2017) RINTC project: assessing the (implicit) seismic risk ofcode-conforming structures in Italy. In Papadrakakis M, Fragiadakis M (eds) Proceedings ofCOMPDYN 2017 – 6th ECCOMAS thematic conference on computational methods in struc-tural dynamics and earth-quake engineering, Rhodes (GR) 2017
Jalayer F (2003) Direct probabilistic seismic analysis: implementing non-linear dynamic assess-ments. Thesis, Stanford University
Joyner WB, Boore DM (1981) Peak horizontal acceleration and velocity from strongmotion recordsincluding records from the 1979 Imperial Valley, California, Earthquake. Bull Seismol Soc Am71:2011–2038
Lagomarsino S, Penna A, Galasco A et al (2013) TREMURI program: an equivalent frame modelfor the nonlinear seismic analysis of masonry buildings. Eng Struct 56:1787–1799
Lin TG, Haselton CB, Baker JW (2013) Conditional spectrum-based ground motion selection. PartI: hazard consistency for risk-based assessments. Earthq Eng Struct Dyn 42:1847–1865
Luzi L, Pacor F, Puglia R et al (2017) The Central Italy seismic sequence between august andDecember 2016: analysis of strong-motion observations. Seismol Res Lett 88:1219–1231
Mazzoni S, McKenna F, Scott MH et al (2006) OpenSees command language manual. Available athttp://opensees.berkeley.edu/. Last accessed December 2017
Meletti C, Galadini F, Valensise G et al (2008) A seismic source zone model for the seismic hazardassessment of the Italian territory. Tectonophysics 450:85–108
Ponzo FC, Cardone D, Dall’Asta A et al (2017) RINTC project: nonlinear analyses of Italian code-conforming base-isolated buildings for risk of collapse assessment. In Papadrakakis M,Fragiadakis M (eds) Proceedings of COMPDYN 2017 – 6th ECCOMAS thematic conference
25 What Seismic Risk Do We Design for When We Design Buildings? 601

on computational methods in structural dynamics and earth-quake engineering, Rhodes(GR) 2017
RINTC Workgroup (2017) Results of the 2015–2016 RINTC project. Available at http://www.reluis.it/. Last accessed December 2017
Scozzese F, Terracciano G, Zona A et al (2017) RINTC project: nonlinear dynamic analyses ofItalian code-conforming steel single-story buildings for collapse risk assessment. InPapadrakakis M, Fragiadakis M (eds) Proceedings of COMPDYN 2017 – 6th ECCOMASthematic conference on computational methods in structural dynamics and earth-quake engi-neering, Rhodes (GR) 2017
Shome N, Cornell CA (2000) Structural seismic demand analysis: consideration of “collapse”. InPMC2000 – 8th ASCE Specialty Conference on Probabilistic Mechanics and Structural Reli-ability. University of Notre Dame, South Bend, Indiana, 24–26 July 2000
Stucchi M, Meletti C, Montaldo V et al (2011) Seismic hazard assessment (2003–2009) for theItalian building code. Bull Seismol Soc Am 101:1885–1911
Suzuki A, Baltzopoulos G, Iervolino I et al (2017) A look at the seismic risk of Italian code-conforming RC buildings. In: Proceedings of 16th Europeassn conference on earthquakeengineering, Thessaloniki (GR), 18–21 June 2018
602 I. Iervolino