chapter 2cws.cengage.co.uk/megginson/students/sample_chs/ch2.pdf · cash flow analysis opening...
TRANSCRIPT

30
Chapter 2Financial Statement and Cash Flow Analysis
OPENING FOCUS
Accounting is the language of business, but, as weknow, the elements of language can be changed andrearranged to make different stories. So too withaccounting information. Studies by professors fromDuke University in the USA have shown that execu-tives are adept at making changes to accountinginformation, perfectly legally, which can have adramatic impact on the ‘bottom line’.
John Graham and Campbell Harvey, with theircolleague Shivaram Rajgopal from WashingtonUniversity, surveyed over 400 finance executives inlarge companies. What they discovered was thatcompanies focus very heavily on ‘bottom line’earnings, particularly earnings per share. The vastmajority of companies would defer a good, profitableproject if by taking it on in this accounting period they
would impact on the earnings per share number in amanner that would surprise the stock market.Managers would trade off good value projects infavour of smoother earnings. None of these practicesare in any way fraudulent or illegal. Rather theyshow how closely the managers watch the analystswho watch the earnings of the companies that themanagers manage.
By contrast, other research, such as that byRebecca Rosner, shows that companies that later gointo bankruptcy engage pre bankruptcy inaccounting manipulation of a more substantivenature.
This chapter provides you with the basic skills toanalyse and interpret, from a finance perspective,the accounts of modern corporations.
So
urc
es:
Ca
mp
be
ll H
arv
ey,
Jo
hn
Gra
ha
m a
nd
Sh
iva
ram
Ra
jgo
pa
l (2
00
6)
‘Th
e E
co
no
mic
Im
pli
ca
tio
ns o
f C
orp
ora
te F
ina
ncia
l R
ep
ort
ing
’, J
ou
rna
l o
f A
cco
un
tin
g a
nd
Eco
no
mic
s, 4
0;
Re
be
cca
Ro
sn
er
(20
03
) ‘E
arn
ing
s M
an
ipu
lati
on
in
Fa
ilin
g F
irm
s’,
Co
nte
mp
ora
ry A
cco
un
tin
g R
ese
arc
h,
20
(2):
36
1–
40
8.
Accounting for the numbers
LEARNING OBJECTIVES
After studying this chapter you should be able to:
� List and define the key financial statementsthat firms are required to provide to theirshareholders.
� Evaluate a firm’s cash flows using its financialstatements, including the statement of cashflows.
� Calculate and interpret liquidity, activity anddebt ratios.
� Review the popular profitability ratios and therole of the DuPont system in analysing thefirm’s returns.
SMART FINANCEUse the learning tools at www.cengage.co.uk/megginson
Part 1 The basic tools of finance
1 The scope of corporate finance
2 Financial statement and cash flow analysis
2.1 Financial statements
2.2 Cash flow analysis
2.3 Analysing financial performance using ratio
analysis
2.4 Summary and conclusions
3 Present value
Part 2 Valuation, risk and return
4 Valuing bonds
5 Valuing shares
6 The trade-off between risk and return
7 Risk, return and the capital asset pricing model
Part 3 Capital budgeting
8 Capital budgeting process and techniques
9 Cash flow and capital budgeting
10 Capital cost and capital budgeting
Part 4 Capital structure and dividend policy
11 Raising long-term equity financing
12 Capital structure
13 Dividend policy
Part 5 Additional topics in corporate finance
14 Entrepreneurial finance and venture capital
15 International financial management
16 Risk management
17 Mergers, acquisitions and corporate control

32 Part 1 The Basic Tools of Finance
A major challenge for the financial manager is measuring therelevant benefits and costs associated with both existing andproposed operations. The accounting profession provides avariety of ‘standardized’ company data, particularly financialstatements, that frequently serve as a starting point for measuringrelevant benefits and costs.
It is often said that accounting is the language of business.Corporate finance relies heavily on accounting concepts and language, but the primaryfocus of finance professionals and accountants differs significantly. Accountants applygenerally accepted accounting principles (GAAP) to construct financial statementsthat attempt to portray fairly how a company has performed in the past. Accountantsgenerally construct these statements using an accrual-based approach, which meansthat accountants record revenues at the point of sale and costs as they are incurred,not necessarily when a firm receives or pays out cash. These widely acceptedaccounting principles and practices allow corporate financial managers and others,barring fraud, to feel confident with the financial representation contained in auditedfinancial statements.
In contrast to accountants, financial professionals use a cash flow approach thatfocuses more attention on current and prospective inflows (benefits) and outflows(costs) of cash. The financial manager must convert relevant accounting and taxinformation into cash outflows and cash inflows, which after adjustment for timingdifferences and risk factors, represent the relevant marginal costs and marginalbenefits needed for decision making. This divergence is sometimes also characterizedas an economic (cash flow and finance professional) perspective versus an accountingperspective.
This chapter describes how financial professionals use accounting information andterminology to analyse the firm’s cash flows and financial performance. If accountingis the language of business, this chapter can be considered as a primer on how to usethe language to say what is relevant to finance. We begin with a brief review of themajor financial statements, then use them to demonstrate some of the key conceptsinvolved in cash flow analysis. We give special emphasis to the firm’s cash flows, freecash flows, the classification of inflows and outflows of cash, and the development andinterpretation of statements of cash flows. Then, we discuss some popular financialratios used to analyse the firm’s financial performance.
2.1 FINANCIAL STATEMENTS
As noted in Chapter 1, financial managers focus primarily on cash flows rather than onaccrual-based accounting data. In spite of this focus, it is important for financial managersto understand financial statements, which serve as a window through which outsiders –investors, lenders and others – view the firm’s financial performance and position.
National governments require public companies to generate financial statementsbased on widely accepted accounting rules. In the United States, the Securities andExchange Commission (SEC) is responsible for regulating publicly traded US compa-nies, as well as the nation’s stock and bond markets. Every other industrialized countryhas an agency similar to the SEC, and most developed countries mandate that com-panies generate financial statements that follow international accounting standards(IAS). An important force in the internationalization of accounting standards has beenthat the SEC has historically insisted that all non-US companies report results basedon US rules if they wish to sell their securities directly to US investors. However, thecorporate accounting scandals of 2001 and 2002 tarnished the reputation of theserules and enhanced that of IAS. More recently there has been an increased effort to
SMART PRACTICES VIDEOJon Olson, Vice President of Finance, Intel Corporation‘At Intel, accounting is a fundamentalrequirement of a financial analyst.’
See the entire interview at www.cengage.co.uk/megginson
accrual-basedapproachRevenues are recordedat the point of sale andcosts when they areincurred, not necessarilywhen a firm receives orpays out cash.
cash flow approachUsed by financialprofessionals to focusattention on currentand prospective inflowsand outflows of cash.
SMARTPRACTICES VIDEOHoward Millar,RyanairTheproblems ofdifferentaccountingsystems.
See the entire interview atwww.cengage.co.uk/megginson
harmonize internationally the rules underlying the presentation of accountingstatements. Again, thinking of accounting as a language, the existence of differentgrammars – ways in which the language can be meaningfully put together – can causeconfusion. Thus, in recent years the International Accounting Standards Board (IASB)has come to the forefront of the debate. In February 2006 the SEC reaffirmed itscommitment to convergence and its wish to work with the IASB on the requiredconvergence issues. Thus, the emergence of a world standard for accounting information,a world grammar, appears possible.
In this chapter we use data taken from the Thomson ONE database. Worldscopeis a trade name of Thomson Financial, the providers of Banker One Business SchoolEdition, a subscription to which is bundled with this text. In that package are accountsand statements from a large number of companies. However, the material in the pack-age is a small sample of what is generally available from Worldscope, as the entiredataset covers 96 per cent by market value of world equity markets. Worldscope dataare harmonized, based on analysis of original statements from companies. Thisharmonization is undertaken by the analysts at Thomson, and the resulting data aredesigned to be internationally comparable. Worldscope data are used worldwide bythousands of academics, analysts, bankers and investors. However, despite this de factoworld standard, you should realize that the Worldscope data and accounts have no legalbasis. A further issue is that the analysts at Worldscope on occasion use slightly differentformulae for ratios from those that appear here. On the Thomson ONE site, right click-ing on a number, ratio or element of a statement will show you how it is made up.
The key financial statements of any company are (1) the balance sheet, (2) theincome statement and (3) the statement of cash flows. Companies may well, in theirannual or quarterly reports, use different names. However, the information presentedis the same. (In the USA an important further requirement is to provide a statementof retained earnings.) Our concern in this section is to review the informationpresented in these statements. Throughout, we present the financial statements fromthe 2006 annual report of LVMH, the French-based luxury goods producer, as anexample of the use of standards and methods.
Balance sheet
A firm’s balance sheet presents a ‘snapshot’ view of the company’s financial position ata specific point in time – the financial year-end. By definition, a firm’s assets must equalthe combined value of its liabilities and shareholders’ equity. Phrased differently, eithercreditors (lenders) or equity investors (owners) finance all of a firm’s assets.
A balance sheet shows assets on the left-hand side and the claims of creditors andshareholders on the right-hand side. Both assets and liabilities by convention appear indescending order of liquidity, or the length of time it takes for accounts to be convertedinto cash in the normal course of business. The most liquid asset, cash, appears first, andthe least liquid, fixed assets, comes last. Similarly, accounts payable represents the obli-gations the firm must pay with cash within the next year, whereas the last entry on theright-hand side of the balance sheet, shareholders’ equity, quite literally never matures.This ‘double entry’ system is not new. Fra Luca Bartolomeo de Pacioli published theSumma, a coherent account of double entry bookkeeping and accounting, in 1494, butbalance sheets in recognizably modern form are available from the early 14th century.
Table 2.1 presents LVMH’s balance sheet as at 31 December 2006. As is standardpractice in annual reports, the table also shows previous year accounts for comparison.Cash and cash equivalents are assets such as current account balances at commercialbanks that can be used directly as a means of payment. ‘Other current assets’ representvery liquid, short-term investments, which financial analysts view as a form of ‘nearcash’. Such securities would include short, fixed-term deposit accounts. Accounts
Chapter 2 Financial Statement and Cash Flow Analysis 33
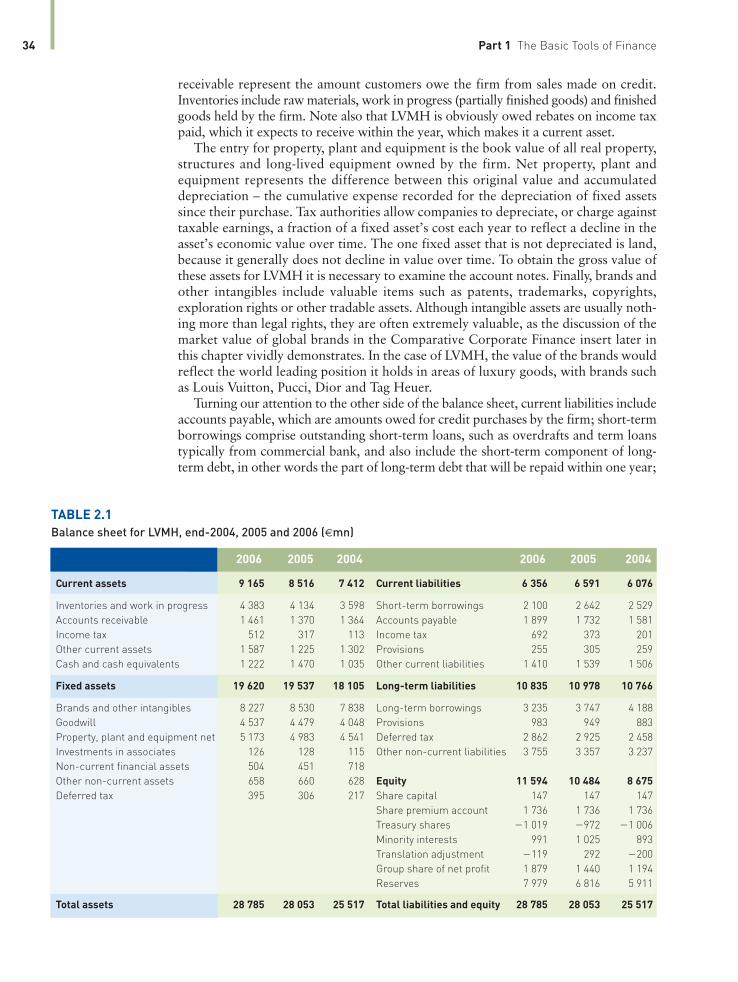
receivable represent the amount customers owe the firm from sales made on credit.Inventories include raw materials, work in progress (partially finished goods) and finishedgoods held by the firm. Note also that LVMH is obviously owed rebates on income taxpaid, which it expects to receive within the year, which makes it a current asset.
The entry for property, plant and equipment is the book value of all real property,structures and long-lived equipment owned by the firm. Net property, plant andequipment represents the difference between this original value and accumulateddepreciation – the cumulative expense recorded for the depreciation of fixed assetssince their purchase. Tax authorities allow companies to depreciate, or charge againsttaxable earnings, a fraction of a fixed asset’s cost each year to reflect a decline in theasset’s economic value over time. The one fixed asset that is not depreciated is land,because it generally does not decline in value over time. To obtain the gross value ofthese assets for LVMH it is necessary to examine the account notes. Finally, brands andother intangibles include valuable items such as patents, trademarks, copyrights,exploration rights or other tradable assets. Although intangible assets are usually noth-ing more than legal rights, they are often extremely valuable, as the discussion of themarket value of global brands in the Comparative Corporate Finance insert later inthis chapter vividly demonstrates. In the case of LVMH, the value of the brands wouldreflect the world leading position it holds in areas of luxury goods, with brands suchas Louis Vuitton, Pucci, Dior and Tag Heuer.
Turning our attention to the other side of the balance sheet, current liabilities includeaccounts payable, which are amounts owed for credit purchases by the firm; short-termborrowings comprise outstanding short-term loans, such as overdrafts and term loanstypically from commercial bank, and also include the short-term component of long-term debt, in other words the part of long-term debt that will be repaid within one year;
34 Part 1 The Basic Tools of Finance
TABLE 2.1
Balance sheet for LVMH, end-2004, 2005 and 2006 (€mn)
2006 2005 2004 2006 2005 2004
Current assets 9 165 8 516 7 412 Current liabilities 6 356 6 591 6 076
Inventories and work in progress 4 383 4 134 3 598 Short-term borrowings 2 100 2 642 2 529
Accounts receivable 1 461 1 370 1 364 Accounts payable 1 899 1 732 1 581
Income tax 512 317 113 Income tax 692 373 201
Other current assets 1 587 1 225 1 302 Provisions 255 305 259
Cash and cash equivalents 1 222 1 470 1 035 Other current liabilities 1 410 1 539 1 506
Fixed assets 19 620 19 537 18 105 Long-term liabilities 10 835 10 978 10 766
Brands and other intangibles 8 227 8 530 7 838 Long-term borrowings 3 235 3 747 4 188
Goodwill 4 537 4 479 4 048 Provisions 983 949 883
Property, plant and equipment net 5 173 4 983 4 541 Deferred tax 2 862 2 925 2 458
Investments in associates 126 128 115 Other non-current liabilities 3 755 3 357 3 237
Non-current financial assets 504 451 718
Other non-current assets 658 660 628 Equity 11 594 10 484 8 675
Deferred tax 395 306 217 Share capital 147 147 147
Share premium account 1 736 1 736 1 736
Treasury shares �1 019 �972 �1 006
Minority interests 991 1 025 893
Translation adjustment �119 292 �200
Group share of net profit 1 879 1 440 1 194
Reserves 7 979 6 816 5 911
Total assets 28 785 28 053 25 517 Total liabilities and equity 28 785 28 053 25 517

and ‘other current liabilities’, which are usually accrued expenses (costs incurred by thefirm that have not yet been paid). Examples of accruals include taxes owed to thegovernment and wages due to employees. Accounts payable and accruals are often called‘spontaneous liabilities’ because they tend to change directly with changes in sales.
In many countries, laws permit firms to construct two sets of financial statements,one for tax purposes and one for reporting to the public. For example, when a firmpurchases a long-lived asset, it can choose to depreciate this asset rapidly for tax pur-poses, resulting in large, immediate tax write-offs and smaller tax deductions later.When the firm constructs financial statements for release to the public, however, itmay choose a different depreciation method, perhaps one that results in higherreported earnings in the early years of the asset’s life and lower earnings later. Thedeferred taxes entry on the balance sheet is a long-term liability that reflects thediscrepancy between the taxes that firms actually pay and the tax liabilities they reporton their public financial statements. Long-term debt represents debt that matures morethan one year in the future. Note also that LVMH has entries for provisions, whichare monies due for liabilities such as pension fund reserve rebalancing and medicalcare of retirees. Some of these are due within the year, making them current, whileothers are longer term in nature.
The shareholders ‘equity section provides information about the claims of investorswho own preference and ordinary shares. LVMH has no preference shares, but if ithad they would appear first in the shareholders’ equity section, as they take prece-dence over ordinary shares Next, the amount paid in by the original purchasers ofordinary shares, the most basic form of corporate ownership, is shown by two entries –share capital and share premium account. The share capital entry equals the numberof outstanding ordinary shares multiplied by the par value per share. The par valueof a share is an arbitrary value with little or no economic significance. The share
premium account equals the number of shares outstanding multiplied by the originalselling price of the shares, net of the par value. Therefore, the combined value ofordinary shares and paid-in capital equals the proceeds the firm received when itoriginally sold shares to investors. Reserves (retained earnings) are the cumulativetotal of the earnings that the firm has reinvested since its inception. It is important torecognize that these retained earnings do not represent a reservoir of unspent cash.They represent shareholders’ funds that they have decided to keep in the companyrather than pay in dividends or spend on other investments.
In the case of LVMH there is another element of shareholders’ equity, the minority
interest, representing the value of shares that the company holds in subsidiaries of thecompany. The treasury shares entry records the value of ordinary shares that the firmcurrently holds in reserve. Usually, treasury shares appear on the balance sheet becausethe firm has reacquired previously issued shares through a share repurchaseprogramme. We also see an item, ‘Translation adjustment’, which in the case of LVMHrepresents losses or gains on foreign exchange transactions, or incurred whentranslating foreign exchange. Equity consists of the total of all equity invested in thecompany.
Income statement
Table 2.2 presents LVMH’s income statement for the year ended 31 December 2006. Aswith the balance sheet, LVMH’s income statement also includes data from 2004 and2005 for comparison.1 In the vocabulary of accounting, income (also called profit,
Chapter 2 Financial Statement and Cash Flow Analysis 35
deferred taxesReflect the discrepancybetween the taxes thatfirms actually pay andthe tax liabilities theyreport on their publicfinancial statements.
long-term debtDebt that maturesmore than one year inthe future.
preference sharesA form of ownershipthat has preferenceover ordinary shareswith regard to incomeand assets.
ordinary sharesThe most basic form ofcorporate ownership.
par value (ordinary shares) Anarbitrary valueassigned to ordinaryshares on a firm’sbalance sheet.
share premiumaccountThe number of ordinary shares outstanding times theoriginal selling price ofthe shares, net of thepar value.
reserves (retainedearnings)The cumulative total ofthe earnings that a firmhas reinvested since itsinception.
treasury sharesShares that were issuedand later reacquired bythe firm through share repurchase programmesand are therefore beingheld in reserve by the firm.
1 When reporting to shareholders, firms typically also include a common-size income statement thatexpresses all income statement entries as a percentage of sales.
minority interestThe value of shares thata company holds insubsidiaries of thecompany.

earnings or margin) equals revenue minus expenses. LVMH’s income statement,however, has several measures of ‘income’ appearing at different points. The first incomemeasure is gross profit, which is the amount by which sales revenue exceeds the cost ofgoods sold (the direct cost of producing or purchasing the goods sold). Next, variousoperating expenses, including selling expense, general and administrative expense, arededucted from gross profits. The resulting operating profit of €3172 million representsthe profits earned from the sale of products, although this amount does not includefinancial and tax costs. Other income, earned on transactions not directly related to pro-ducing and/or selling the firm’s products, is added to operating income to yield earningsbefore interest and taxes (EBIT) of €3052 million. When a firm has no ‘other income’,its operating profit and EBIT are equal. Next, €53 million of interest expense –representing the cost of debt financing – is subtracted from EBIT to arrive at pre-taxincome, in this case €2099 million. The final step is to subtract taxes from pre-tax incometo arrive at net income, or net profit after taxes, of €2160 million. Net income is theproverbial ‘bottom line’ and the single most important accounting number for bothcorporate managers and external financial analysts. As we have seen earlier, LVMHhas minority interests, and the share of income attributable to those outside interestsis deducted in the last stage.
36 Part 1 The Basic Tools of Finance
TABLE 2.2
LVMH income
statements for
the years ended
31 December
2004–2006 (€mn)
2006 2005 2004
Revenue 15 306 13 910 12 481
Cost of goods sold 5 481 5 001 4 373
Gross profit 9 825 8 909 8 108
Marketing and sales expenses 5 364 4 892 4 512
General and administrative expenses 1 289 1 274 1 224
Operating profit 3 172 2 743 2 372
Other income and expenditure 120 221 199
Earnings before interest and taxes (EBIT) 3 052 2 522 2 173
Net finance charges 53 143 220
Income tax 839 711 551
Net profit or income after taxes 2 160 1 668 1 402
Minority interest 281 228 208
Income to shareholders 1 879 1 440 1 194
ow much is a global brand name worth?
Interbrand Corporation, a New York-based
consulting firm, has been trying to answer this
question for several years, and Business Week has
been publishing the rankings annually since 2001. The
accompanying table details what this firm considers
the 25 most valuable brands of 2006. The total brand
values are large and are dominated by brands of
US-based companies. Additionally, the rankings are
remarkably stable from year to year; the 2003 rankings
listed the same top five, in order, and only one new
brand entered the top 25 during 2004.
Although American companies are not required to
disclose estimated brand values in their financial
statements, large publicly traded British and Aus-
tralian firms must do so. Brand values do, however,
COMPARATIVE CORPORATE FINANCE
Assessing the market values of global brands
H

Chapter 2 Financial Statement and Cash Flow Analysis 37
have a significant effect on US accounting rules in one
important area – accounting for the ‘goodwill’ created
when a firm is acquired by another company for more
than the acquired firm’s book value. This premium
over book value represents the higher market (versus
book) value of intangible assets such as patents,
copyrights and trademarks, as well as brand names
and business relationships that are not accounted for
at all. Charges arising from goodwill impairment can
have a dramatic effect on reported earnings.
RANK BRAND COUNTRY SECTOR VALUE ($mn) CHANGE OVER YEAR
1 Coca-Cola US Beverages 67 000 �1%
2 Microsoft US Computer 56 926 �5%
3 IBM US Computer 56 201 5%
4 GE US Diversified 48 907 4%
5 Intel US Computer 32 319 �9%
6 Nokia Finland Telecom 30 131 14%
7 Toyota Japan Automotive 27 941 12%
8 Disney US Media/Entertainment 27 848 5%
9 McDonald’s US Restaurants 27 501 6%
10 Mercedes Germany Automotive 21 795 9%
11 Citi US Financial 21 458 7%
12 Marlboro US Tobacco 21 350 1%
13 Hewlett-Packard US Computer 20 458 8%
14 American Express US Financial 19 641 6%
15 BMW Germany Automotive 19 617 15%
16 Gillette US Personal Care 19 579 12%
17 LVMH France Luxury 17 606 10%
18 Cisco US Computer 17 532 6%
19 Honda Japan Automotive 17 049 8%
20 Samsung South Korea Electronics 16 169 8%
21 Merrill Lynch US Financial 13 001 8%
22 Pepsi US Beverages 12 690 2%
23 Nescafé Switzerland Beverages 12 507 2%
24 Google US Internet 12 376 46%
25 Dell US Computer 12 256 �7%
Source: Interbrand Corporation.
Statement of cash flows
The statement of cash flows provides a summary of a firm’s cash flows over the year.This is accomplished by isolating the firm’s operating, investment and financing cashflows and reconciling them with changes in its cash and marketable securities duringthe year. LVMH’s statement of cash flows for the year ended 31 December 2006, ispresented in Table 2.4. We should also stress that other information presented infinancial statements can be very useful to financial managers and analysts. This isespecially true about the ‘notes’ to financial statements.
Notes to financial statements
A public company’s financial statements include detailed explanatory notes keyed tothe relevant accounts in the statements. These notes provide detailed information on

the accounting policies, calculations and transactions underlying entries in the financialstatements. Consider for example CRH, a cement, aggregates and building companywith operations worldwide. In the firm’s 2006 annual report the notes to the accountsconsist of 42 pages in total. These contain a wealth of information on the geographicalorigin of sales, the operation of the company share option schemes, directors’ remu-neration, details on hedging and so forth.
Notes typically provide additional information about a firm’s revenue recognitionpractices, income taxes, fixed assets, leases and employee remuneration plans. Thisinformation is particularly useful to professional security analysts who look for cluesthat shed more light on the firm’s past and future performance.
38 Part 1 The Basic Tools of Finance
1 What role do the IASB and SEC play in determining the content and structure of
financial statements?
2 Are balance sheets and income statements prepared with the same purpose in
mind? How are these two statements different, and how are they related?
3 Which statements are of greatest interest to creditors, and which would be of
greatest interest to shareholders?
4 Why does the balance sheet have to balance?
CONCEPTREVIEWQUESTIONS
operating flowsCash inflows and outflows directly related to the production and sale ofa firm’s products orservices.
investment flowsCash flows associatedwith the purchase orsale of both fixed assets and businessequity.
financing flowsResult from debt andequity financing transactions.
2.2 CASH FLOW ANALYSIS
Although financial managers are interested in the information contained in the firm’saccrual-based financial statements, their primary focus is on cash flows. Remember, cashis king! Without adequate cash to pay obligations on time, to fund operations and growth,and to compensate owners, the firm will fail. The financial manager and other interestedparties can gain insight into the firm’s cash flows over a given period of time by usingsome popular measures of cash flow and by analysing the firm’s statement of cash flows.
The firm’s cash flows
Figure 2.1 illustrates the firm’s cash flows. Note that the figure treats cash andmarketable securities as perfect substitutes. Both cash and marketable securities repre-sent a reservoir of liquidity that increases with cash inflows and decreases with cashoutflows. Also note that the figure divides the firm’s cash flows into (1) operating flows,(2) investment flows and (3) financing flows. The operating flows are cash inflows andoutflows directly related to the production and sale of the firm’s products or services.Investment flows are cash flows associated with the purchase or sale of both fixedassets and business equity. Clearly, purchases result in cash outflows, whereas salesgenerate cash inflows. The financing flows result from debt and equity financingtransactions. Taking on new debt (short term or long term) results in a cash inflow,whereas repaying existing debt represents a cash outflow. Similarly, the sale of shares resultsin a cash inflow, whereas the repurchase of shares or payment of cash dividends generatesa cash outflow. In combination, the firm’s operating, investment and financing cashflows during a given period will affect the firm’s cash and marketable securities balances.
Monitoring cash flow is important for financial managers employed by the firm andfor outside analysts trying to estimate how much the firm is worth.
Inflows and outflows of cash Table 2.3 classifies the basic inflows and outflows ofcash for corporations (assuming other things are held constant). For example, if a firm’saccounts payable increases by €1000 during the year, this change would be an inflow ofcash. If the firm’s inventory increases by €2500, the change would be an outflow of cash.

A few additional points can be made about the classification scheme in Table 2.3.
1 A decrease in an asset, such as the firm’s inventory balance, is an inflow ofcash because cash that has been tied up in the asset is released. Managers canuse it for some other purpose, such as repaying a loan. In contrast, an increasein the firm’s inventory balance (or any other asset) is an outflow of cashbecause additional inventory ties up more of the firm’s cash. Similar logicexplains why an increase in any liability is an inflow of cash, and a decrease inany liability is an outflow of cash.
2 Our earlier discussion noted why depreciation and other non-cash charges areconsidered cash inflows. Logic suggests that if net income is a cash inflow, thena net loss (negative net profits after taxes) is an outflow of cash. The firm mustbalance its losses with an inflow of cash, such as selling off some of its fixedassets (reducing an asset) or increasing external borrowing (increasing a liability).Note (from Equation 2.1, page 41) that a firm can have a net loss (EBIT – taxes)and still have positive cash flow when depreciation and other non-cash charges
Chapter 2 Financial Statement and Cash Flow Analysis 39
TABLE 2.3
The inflows and
outflows of
corporate cash
INFLOWS OUTFLOWS
Decrease in any asset Increase in any asset
Increase in any liability Decrease in any liability
Net income (profit after tax) Net loss
Depreciation and other non-cash charges Dividends paid
Sale of shares Repurchase or retirement of shares
(1) Operating flows
LabourAccruedwages
Accountspayable
Materials
Depreciation
Production
Products orservices
Operating (incl.depreciation) andinterest expense
Sales revenue
Payment
Refund
Cash sales
CollectionAccountsreceivable
Overhead
Payment
Payment Purchase
Sale Fixed assets
Purchase
Borrowing
Cashand
marketablesecurities
Businessequity
Debt(short-term and
long-term)
Repayment
(3) Financing flows
Sale of shares
Payment of cash dividendsEquity
Repurchase of shares
Sale
(2) Investment flows
Taxes
FIGURE 2.1
The pattern of cash
flows through a firm
The firm’s reservoir ofliquidity, containing bothcash and marketablesecurities, is impacted bychanges in (1) operatingflows, (2) investment flowsand (3) financing flows.

Developing and interpreting the statement of cash flows
The statement of cash flows summarizes the inflows and outflows of cash during agiven period. Accountants construct the statement of cash flows by using the incomestatement for the year, along with the beginning- and end-of-year balance sheets. Theprocedure involves classifying balance sheet changes as inflows or outflows of cash;obtaining income statement data; classifying the relevant values into operating,investment and financing cash flows; and presenting them in the proper format.2 Thestatement of cash flows for LVMH for the year ended 31 December 2006 appears inTable 2.4. Note that the statement assigns positive values to all cash inflows and neg-ative values to all cash outflows. Notice under the investment activities section thatthe statement records the increase in gross fixed assets, rather than net fixed assets,as a cash outflow. Depreciation accounts for the difference between changes in grossand net fixed assets, but depreciation expense appears in the operating activities sec-tion of the statement. Thus, the focus on changes in gross fixed assets avoids doublecounting depreciation in the statement. For a similar reason, the statement does notshow a specific entry for the change in retained earnings as an inflow (or outflow) ofcash. Instead, the factors that determine the change in retained earnings – profits orlosses and dividends – appear as separate individual entries in the statement.
40 Part 1 The Basic Tools of Finance
2 For a description and demonstration of the detailed procedures for developing the statement of cashflows, see any recently published financial accounting text.
Applying the Model
Below we see the current assets and liabilities of Juventus Football Club for thefinancial years ending June 2004 and 2005 (in millions of euros).
ELEMENT 2005 2004
Cash 6.54 53.14
Short-term investments 2.04 2.04
Accounts receivable 71.08 61.04
Inventory 0 0
Accounts payable 17.01 12.57
Short-term debt 24.97 0
In terms of current assets, accounts receivable increased during the year,representing an outflow of cash for Juventus. Cash decreased, representing a cashinflow. It may seem strange to think of a decrease in cash balances as a source ofcash, but that simply means that Juventus used some of its cash flow to ‘disinvestin liquidity’ rather than use the cash for another purpose. Not surprisingly, theclub has no inventories (although some might consider the stock of players that arenot gaining first team places as equivalent). On the liabilities side, accounts payableincreased, representing a cash inflow for Juventus, while short-term debtincreased, representing an inflow of cash for the club.
during the period are greater than the net loss. Therefore, the statement of cashflows treats net income (or net losses) and non-cash charges as separate entries.

By adding up the items in each category – operating, investment and financingactivities – we obtain the net increase (decrease) in cash and marketable securities forthe year. As a check, this value should reconcile with the actual yearly change in cashand marketable securities, obtained from the beginning- and end-of-year balancesheets. By applying this procedure to LVMH’s income statement and balance sheets,we obtain the firm’s statement of cash flows (see Table 2.4).
The statement of cash flows allows the financial manager and other interested partiesto analyse the firm’s cash flow over a period of time. Unusual changes in either themajor categories of cash flow or in specific items offer clues to problems that a firmmay be experiencing. For example, an unusually large increase in accounts receivable orinventories resulting in major cash outflows may signal credit or inventory problems,respectively. Financial managers and analysts can also prepare a statement of cash flowsdeveloped from projected, or pro forma, financial statements. They use this approachto determine whether the firm will require additional external financing or will gener-ate excess cash that can be reinvested or distributed to shareholders. After you learn theconcepts, principles and practices of corporate finance presented in the text, you willbe able to glean a good amount of useful information from the statement of cash flows.
Free cash flow Free cash flow (FCF) is the amount of cash flow available toinvestors – the providers of debt and equity capital. It represents the net amount ofcash flow remaining after the firm has met all operating needs and paid for investments –both long term (fixed) and short term (current). Free cash flow for a given period canbe calculated in two steps.
First we find the firm’s operating cash flow (OCF), which is the amount of cash flowgenerated by the firm from its operations. It can be calculated using the following equation:
OCF � EBIT � Taxes � Depreciation
Chapter 2 Financial Statement and Cash Flow Analysis 41
TABLE 2.4
Statement of cash
flows for LVMH for
the years ended
31 December
2004–2006 (€mn)
2006 2005 2004
Operating activities
Operating profit 3 052 2 522 2 173
Increase in depreciation and amortization 474 639 529
Other �22 �72 6
Cash flow from operations before working capital changes 3 504 3 089 2 708
Interest and taxes paid �174 �222 �215
Taxes �784 �616 �389
Net cash from operations before working capital 2 546 2 251 2 104
Change in inventories �351 �281 �252
Change in accounts receivable �146 �67 29
Change in accounts payable 208 27 �88
Other 31 64 92
Net cash from operations 2 288 1 994 1 885
Investing activities
Investing activities �712 �818 �951
Operating investments �749 �679 �588
Financial investments 37 �139 �363
Financing activities
Financing activities �1 153 �407 �76
Borrowings 785 1 192 1 599
Repayments �1 757 �1 559 �1 686
Current investments �181 �40 11
free cash flow (FCF)The net amount of cashflow remaining afterthe firm has met all operating needs andpaid for investments,both long term (fixed)and short term (current).Represents the cashamount that a firmcould distribute to investors after meetingall its other obligations.
operating cash flow(OCF)The amount of cashflow generated by afirm from its operations.Mathematically,earnings beforeinterest and taxes(EBIT) minus taxes plusdepreciation.
EQUATION 2.1
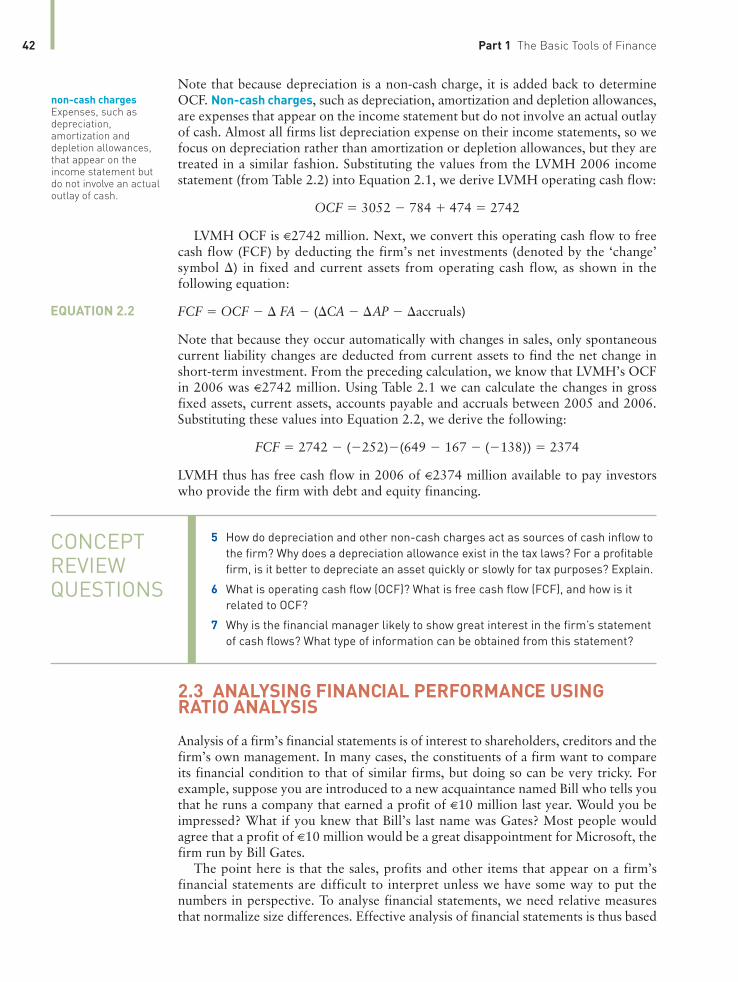
Note that because depreciation is a non-cash charge, it is added back to determineOCF. Non-cash charges, such as depreciation, amortization and depletion allowances,are expenses that appear on the income statement but do not involve an actual outlayof cash. Almost all firms list depreciation expense on their income statements, so wefocus on depreciation rather than amortization or depletion allowances, but they aretreated in a similar fashion. Substituting the values from the LVMH 2006 incomestatement (from Table 2.2) into Equation 2.1, we derive LVMH operating cash flow:
OCF � 3052 � 784 � 474 � 2742
LVMH OCF is €2742 million. Next, we convert this operating cash flow to freecash flow (FCF) by deducting the firm’s net investments (denoted by the ‘change’symbol �) in fixed and current assets from operating cash flow, as shown in thefollowing equation:
FCF � OCF � � FA � (�CA � �AP � �accruals)
Note that because they occur automatically with changes in sales, only spontaneouscurrent liability changes are deducted from current assets to find the net change inshort-term investment. From the preceding calculation, we know that LVMH’s OCFin 2006 was €2742 million. Using Table 2.1 we can calculate the changes in grossfixed assets, current assets, accounts payable and accruals between 2005 and 2006.Substituting these values into Equation 2.2, we derive the following:
FCF � 2742 � (�252)�(649 � 167 � (�138)) � 2374
LVMH thus has free cash flow in 2006 of €2374 million available to pay investorswho provide the firm with debt and equity financing.
42 Part 1 The Basic Tools of Finance
non-cash chargesExpenses, such as depreciation, amortization and depletion allowances,that appear on the income statement butdo not involve an actualoutlay of cash.
5 How do depreciation and other non-cash charges act as sources of cash inflow to
the firm? Why does a depreciation allowance exist in the tax laws? For a profitable
firm, is it better to depreciate an asset quickly or slowly for tax purposes? Explain.
6 What is operating cash flow (OCF)? What is free cash flow (FCF), and how is it
related to OCF?
7 Why is the financial manager likely to show great interest in the firm’s statement
of cash flows? What type of information can be obtained from this statement?
CONCEPTREVIEWQUESTIONS
2.3 ANALYSING FINANCIAL PERFORMANCE USINGRATIO ANALYSIS
Analysis of a firm’s financial statements is of interest to shareholders, creditors and thefirm’s own management. In many cases, the constituents of a firm want to compareits financial condition to that of similar firms, but doing so can be very tricky. Forexample, suppose you are introduced to a new acquaintance named Bill who tells youthat he runs a company that earned a profit of €10 million last year. Would you beimpressed? What if you knew that Bill’s last name was Gates? Most people wouldagree that a profit of €10 million would be a great disappointment for Microsoft, thefirm run by Bill Gates.
The point here is that the sales, profits and other items that appear on a firm’sfinancial statements are difficult to interpret unless we have some way to put thenumbers in perspective. To analyse financial statements, we need relative measuresthat normalize size differences. Effective analysis of financial statements is thus based
EQUATION 2.2

on the knowledge and use of ratios or relative values. Ratio analysis involvescalculating and interpreting financial ratios to assess a firm’s performance and status.
Using financial ratios
Different constituents will focus on different types of financial ratios. The firm’screditors are primarily interested in ratios that measure the short-term liquidity ofthe company and its ability to make interest and principal payments. A secondaryconcern of creditors is the firm’s profitability; they want assurance that the businessis healthy and will continue to be successful. Both current and prospective shareholdersare interested in ratios that measure the firm’s current and future levels of risk andreturn, because these two dimensions directly affect the firm’s share price. The firm’smanagers must be concerned with all aspects of the firm’s financial situation, so theyuse ratios to generate an overall picture of the company’s financial health and to monitorthe firm’s performance from period to period. The managers carefully examineunexpected changes to isolate developing problems.
An additional complication of ratio analysis is that, for any given ratio, what isnormal in one industry may be highly unusual in another. For example, by dividing afirm’s earnings available for shareholders by its sales, we obtain the net profit marginratio. Net profit margins vary dramatically across industries. An outstanding net profitmargin in the retail grocery industry could look paltry in the software business. Therefore,when making subjective judgements about the health of a given company, analystsusually compare the firm’s ratios to two benchmarks. First, analysts compare thefinancial ratios in the current year with previous years’ ratios, hoping to identify trendsthat help them evaluate the firm’s prospects. Secondly, analysts compare the ratios ofone company with those of other ‘benchmark’ firms in the same industry (or to an in-dustry average obtained from a trade association or third party provider).
We discuss the use of ratios by examining those for LVMH: note that the emphasisis on interpretation as opposed to detailed calculation. We focus on this companymerely as an example, and you should note that the ratios presented in the remainderof this chapter can be applied to nearly any company. Of course, many companies indifferent industries use ratios that focus on aspects peculiar to their industry. Forexample, airlines pay close attention to the ratio of revenues to passenger miles flown.Retailers diligently track the growth in same-store sales from one year to the next. Wecover the most common financial ratios and group them into five categories: liquidity,activity, debt, profitability and market ratios.
Liquidity ratios
Liquidity ratios measure a firm’s ability to satisfy its short-term obligations as theycome due. Because a common precursor to financial distress and bankruptcy is low ordeclining liquidity, liquidity ratios are good leading indicators of cash flow problems.The two basic measures of liquidity are the current ratio and the quick (acid-test) ratio.
The current ratio, one of the most commonly cited financial ratios, measures thefirm’s ability to meet its short-term obligations. It is defined as current assets dividedby current liabilities, and thus presents in ratio form what net working capital measuresby subtracting current liabilities from current assets. The end-2006 current ratio forLVMH is computed as follows:
How high should the current ratio be? The answer depends on the type of businessunder consideration and on the costs and benefits of having too much versus too
CR �CACL
�91656356
� 1.44
Chapter 2 Financial Statement and Cash Flow Analysis 43
ratio analysisCalculating and interpreting financialratios to assess a firm’s performance and status.
liquidity ratiosMeasure a firm’s abilityto satisfy its short-termobligations as theycome due.
current ratioA measure of a firm’sability to meet itsshort-term obligations,defined as currentassets divided bycurrent liabilities.
net working capitalProfitability thatrepresents thepercentage of eachsales euro remainingafter all costs andexpenses, includinginterest, taxes andpreference sharedividends, have beendeducted.
little liquidity. For example, a current ratio of 1.0 is considered acceptable fora utility but may be unacceptable for a manufacturing firm. The more predictable afirm’s cash flows, the lower the acceptable current ratio. Because LVMH is in theluxury goods business with highly cyclical annual cash flows, its current ratio of 1.44indicates that the company takes a fairly aggressive approach to managing its liquidity.
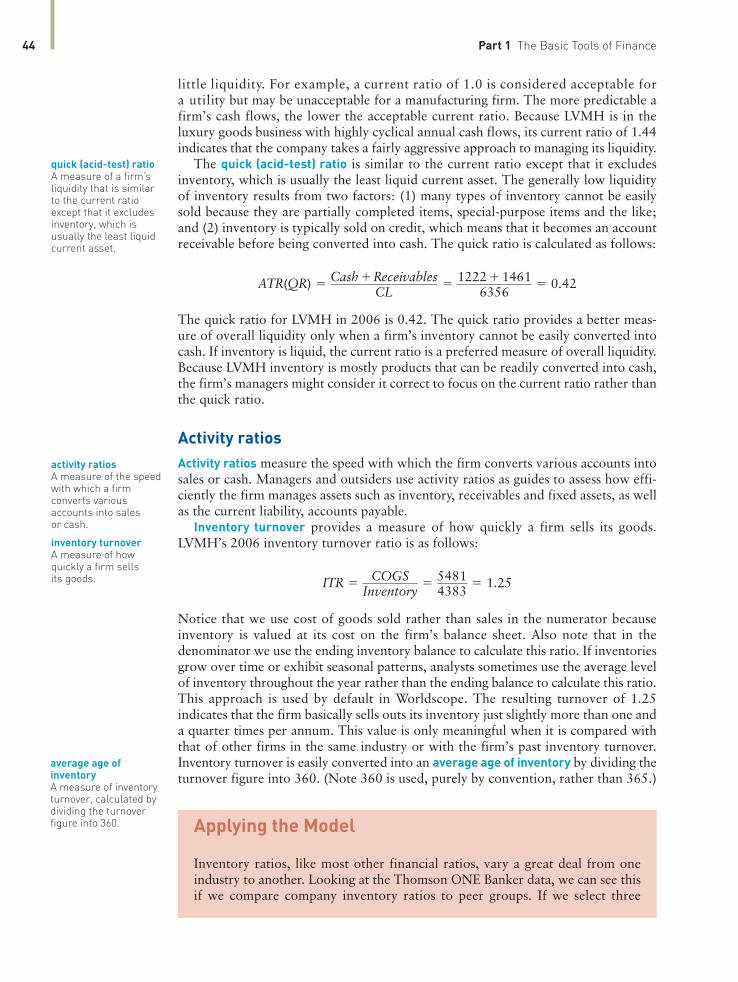
The quick (acid-test) ratio is similar to the current ratio except that it excludesinventory, which is usually the least liquid current asset. The generally low liquidityof inventory results from two factors: (1) many types of inventory cannot be easilysold because they are partially completed items, special-purpose items and the like;and (2) inventory is typically sold on credit, which means that it becomes an accountreceivable before being converted into cash. The quick ratio is calculated as follows:
The quick ratio for LVMH in 2006 is 0.42. The quick ratio provides a better meas-ure of overall liquidity only when a firm’s inventory cannot be easily converted intocash. If inventory is liquid, the current ratio is a preferred measure of overall liquidity.Because LVMH inventory is mostly products that can be readily converted into cash,the firm’s managers might consider it correct to focus on the current ratio rather thanthe quick ratio.
Activity ratios
Activity ratios measure the speed with which the firm converts various accounts intosales or cash. Managers and outsiders use activity ratios as guides to assess how effi-ciently the firm manages assets such as inventory, receivables and fixed assets, as wellas the current liability, accounts payable.
Inventory turnover provides a measure of how quickly a firm sells its goods.LVMH’s 2006 inventory turnover ratio is as follows:
Notice that we use cost of goods sold rather than sales in the numerator becauseinventory is valued at its cost on the firm’s balance sheet. Also note that in thedenominator we use the ending inventory balance to calculate this ratio. If inventoriesgrow over time or exhibit seasonal patterns, analysts sometimes use the average levelof inventory throughout the year rather than the ending balance to calculate this ratio.This approach is used by default in Worldscope. The resulting turnover of 1.25indicates that the firm basically sells outs its inventory just slightly more than one anda quarter times per annum. This value is only meaningful when it is compared withthat of other firms in the same industry or with the firm’s past inventory turnover.Inventory turnover is easily converted into an average age of inventory by dividing theturnover figure into 360. (Note 360 is used, purely by convention, rather than 365.)
ITR �COGS
Inventory�
54814383
� 1.25
ATR(QR) �Cash � Receivables
CL�
1222 � 14616356
� 0.42
44 Part 1 The Basic Tools of Finance
quick (acid-test) ratioA measure of a firm’sliquidity that is similarto the current ratio except that it excludesinventory, which is usually the least liquidcurrent asset.
activity ratiosA measure of the speedwith which a firm converts various accounts into sales or cash.
inventory turnoverA measure of howquickly a firm sells its goods.
average age of inventoryA measure of inventoryturnover, calculated bydividing the turnoverfigure into 360. Applying the Model
Inventory ratios, like most other financial ratios, vary a great deal from oneindustry to another. Looking at the Thomson ONE Banker data, we can see thisif we compare company inventory ratios to peer groups. If we select three

The average collection period, or average age of accounts receivable, is useful inevaluating credit and collection policies.3 It measures the average amount of time thatelapses from a sale on credit until the payment becomes usable funds for a firm. It iscomputed by dividing the firm’s average sales per day into the accounts receivablebalance. On average, in 2006 it took LVMH 34 days to receive payment from acredit sale.
The average collection period is meaningful only in relation to the firm’s creditterms. If LVMH extends 30-day credit terms to customers, an average collectionperiod of 34.37 days may indicate a poorly managed credit or collection department,or both. The lengthened collection period could also be the result of an intentionalrelaxation of credit term enforcement in response to competitive pressures.
Firms use the average payment period to evaluate their performance in payingsuppliers. It measures the average length of time it takes the firm to pay its suppliers.It equals the firm’s average daily purchases divided into the accounts payable balance.To calculate average daily purchases, an analyst may have to estimate the firm’sannual purchases, often by taking a specified percentage of cost of goods sold. Thisestimate is necessary because annual purchases are not reported on a firm’s publishedfinancial statements. Instead they are embodied in its cost of goods sold. In a fashionsimilar to the average collection period, the average payment period is meaningfulonly when viewed in light of the actual credit terms extended to the firm by itssuppliers.
The fixed asset turnover measures the efficiency with which a firm uses its fixedassets. The ratio tells analysts how many euros of sales the firm generates per euro offixed asset investment. The ratio equals sales divided by net fixed assets (fixed assetsless intangibles):
FAT �SalesNFA
�15306
(19620 � 8227)� 1.34
ACP �Accounts Receivable
ASPd�
146142.51
� 34.37
ASPd �Sales Revenue
360�
15306360
� 42.51
Chapter 2 Financial Statement and Cash Flow Analysis 45
fixed asset turnoverA measure of the efficiency with which afirm uses its fixed assets, calculated bydividing sales by netfixed asset investment.
average collection periodThe average amount oftime that elapses froma sale on credit untilthe payment becomesusable funds for a firm.Calculated by dividingaccounts receivable byaverage sales per day.Also called the averageage of accountsreceivable.
companies in three different industries, this becomes evident. In all cases we selectas a peer group only those companies that are in the Europe/Africa region.
INDUSTRY COMPANY INVENTORY PEER
TURNOVER AVERAGE
RATIO
Commercial printing Wyndeham Press plc 19.22 19.03Packaged foods and meats Cadbury Schweppes 4.18 17.60Gas distribution Gaz de France 13.03 63.29
3 The average collection period is sometimes called the days’ sales outstanding (DSO). As with the inventoryturnover ratio, the average collection period can be calculated using end-of-year accounts receivable or theaverage receivables balance for the year.
average payment periodA measure of the average length of timeit takes a firm to pay itssuppliers.

The fixed asset turnover for LVMH in 2006 is 1.34. This means that the companyturns over its net fixed assets 1.34 times a year. Put another way, LVMH generates justover €1.34 in sales for every €1.00 of fixed assets. As with other ratios, the ‘normal’level of fixed asset turnover varies widely from one industry to another.
An analyst must be aware that (when using this ratio and the total asset turnoverratio described next) the calculations use the historical costs of fixed assets. Becausesome firms have significantly newer or older assets than others, comparing fixed assetturnovers of those firms can be misleading. Firms with newer assets tend to have lowerturnovers than those with older assets, which have lower book (accounting) values. Anaïve comparison of fixed asset turnover ratios for different firms may lead an analystto conclude that one firm operates more efficiently than another, when, in fact, thefirm that appears to be more efficient simply has older (i.e. more fully depreciated)assets on its books. Also, for a company with large values of brands and other intan-gibles, it is not clear that excluding these from the analysis is in fact correct.
The total asset turnover ratio indicates the efficiency with which a firm uses all itsassets to generate sales. Like the fixed asset turnover ratio, total asset turnover indi-cates how many euros of sales a firm generates per euro of asset investment. All otherfactors being equal, analysts favour a high turnover ratio because it indicates that afirm generates more sales (and ideally more cash flow for investors) from a giveninvestment in assets. LVMH’s total asset turnover in 2006 equals 0.53, calculatedas follows:
Debt ratios
Firms finance their assets from two broad sources – equity and debt. Equity comesfrom shareholders, whereas debt comes in many forms and from many differentlenders. Firms borrow from suppliers, from banks and from widely scattered investorswho buy publicly traded bonds. Debt ratios measure the extent to which a firm usesmoney from creditors rather than shareholders to finance its operations. Becausecreditors’ claims must be satisfied before firms can distribute earnings to shareholders,current and prospective investors pay close attention to the debts on a firm’s bal-ance sheet. Lenders share these concerns because the more indebted the firm,the higher the probability that the firm will be unable to satisfy the claims of all itscreditors.
In general, the more debt a firm uses in relation to its total assets, the greater itsfinancial leverage. Fixed-cost sources of financing, such as debt and preference shares,create financial leverage that magnifies both the risk and the expected return on thefirm’s securities.4 The more a firm borrows, the riskier its outstanding shares andbonds, and the higher the return that investors require on those securities. A detaileddiscussion of the effect of debt on the firm’s risk, return and value is included inChapter 12. Here we emphasize the use of debt ratios to assess a firm’s indebtednessand its ability to meet the fixed payments associated with debt.
Broadly speaking, there are two types of debt ratios. One type focuses on balancesheet measures of outstanding debt relative to other sources of financing. The other
FAT �SalesTA
�1530628785
� 0.53
46 Part 1 The Basic Tools of Finance
financial leverageUsing fixed-costsources of financing,such as debt and preference shares, tomagnify both the riskand expected return ona firm’s investments.
total asset turnoverA measure of the efficiency with which afirm uses all its assetsto generate sales; calculated by dividingthe value of sales afirm generates by thevalue of assets used.
4 By fixed cost we mean that the cost of this financing source does not vary over time in response to changesin the firm’s revenue and cash flow. For example, when a firm borrows money at a variable rate, the interestcost of that loan is not fixed through time, but the firm’s obligation to make interest payments is ‘fixed’regardless of the level of the firm’s revenue and cash flow.

type, known as the coverage ratio, focuses more on income statement measures of thefirm’s ability to generate sufficient cash flow to make scheduled interest and principalpayments. Investors and credit rating agencies use both types of ratios to assess a firm’screditworthiness.
The debt ratio measures the proportion of total assets financed by the firm’screditors. The higher this ratio, the greater the firm’s reliance on borrowed money tofinance its activities. The ratio equals total liabilities divided by total assets, andLVMH’s debt ratio is 0.59. or 59 per cent. This figure indicates that the company hasfinanced more than half of its assets with debt.
A close cousin of the debt ratio is the assets-to-equity (A/E) ratio, sometimes calledthe equity multiplier:
The resulting value indicates that LVMH’s assets in 2006 are two-and-a-half timesgreater than its equity.
An alternative measure of the firm’s leverage that focuses solely on the firm’slong-term debt is the debt-to-equity ratio, calculated by dividing long-term debt byshareholders’ equity. The 2006 value of this ratio for LVMH is calculated as follows:
LVMH’s long-term debts are therefore only around 30 per cent as large as itsshareholders’ equity. Note, however, that both the debt ratio and the debt-to-equityratio use book values of debt, equity and assets. Analysts should be aware that themarket values of these variables may differ substantially from book values. Inaddition, depending on which aspects of the company the analyst is focused on,certain elements of debt (such as convertible bonds) may be omitted from the debtfigures.
The times interest earned ratio, which equals earnings before interest and taxesdivided by interest expense, measures the firm’s ability to make contractual interestpayments. A higher ratio indicates a greater capacity to meet scheduled payments.The times interest earned ratio for LVMH in 2006 equals 57.58, indicating that thefirm could experience a substantial decline in earnings and still meet its interestobligations:
Profitability ratios
Several measures of profitability relate a firm’s earnings to its sales, assets or equity.Profitability ratios are among the most closely watched and widely quoted financialratios. Many firms link employee bonuses to profitability ratios, and share prices reactsharply to unexpected changes in these measures.
The gross profit margin measures the percentage of each sales euro remaining afterthe firm has paid for its goods. The higher the gross profit margin, the better. Note
TIE �EBIT
Interest�
305253
� 57.58
DER �LTD
Equity�
323511594
� 0.28
EM �TA
Equity�
2878511594
� 2.49
DR �TLTA
�1719128785
� 0.59
Chapter 2 Financial Statement and Cash Flow Analysis 47
coverage ratioA debt ratio that focuses more on income statementmeasures of a firm’sability to generate sufficient cash flow tomake scheduled interest and principalpayments.
debt ratioA measure of the proportion of total assets financed by afirm’s creditors.
assets-to-equity (A/E)ratioA measure of the proportion of total assets financed by afirm’s equity. Alsocalled the equity multiplier.
equity multiplierA measure of the proportion of total assets financed by afirm’s equity. Alsocalled the assets-to-equity (A/E) ratio.
debt-to-equity ratioA measure of the firm’sfinancial leverage, calculated by dividing long-term debt byshareholders’equity.
times interest earnedratioA measure of the firm’sability to make contractual interestpayments, calculatedby dividing earnings before interest andtaxes by interest expense.
gross profit marginA measure of profitabilitythat represents thepercentage of eachsales euro remainingafter a firm has paid forits goods.
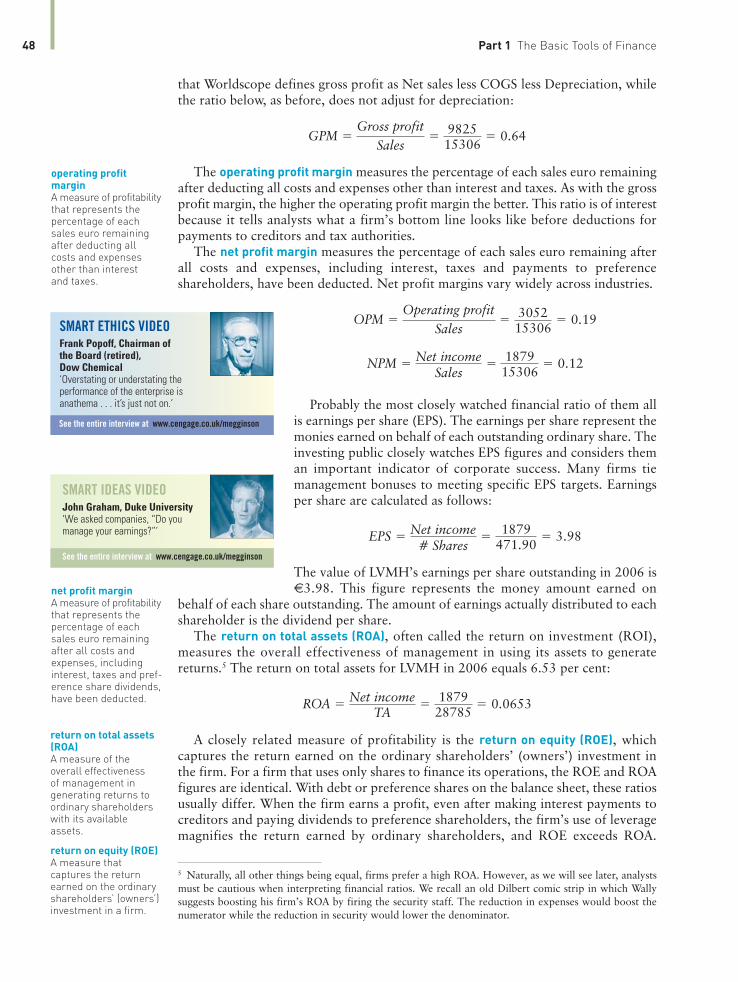
that Worldscope defines gross profit as Net sales less COGS less Depreciation, whilethe ratio below, as before, does not adjust for depreciation:
The operating profit margin measures the percentage of each sales euro remainingafter deducting all costs and expenses other than interest and taxes. As with the grossprofit margin, the higher the operating profit margin the better. This ratio is of interestbecause it tells analysts what a firm’s bottom line looks like before deductions forpayments to creditors and tax authorities.
The net profit margin measures the percentage of each sales euro remaining afterall costs and expenses, including interest, taxes and payments to preferenceshareholders, have been deducted. Net profit margins vary widely across industries.
Probably the most closely watched financial ratio of them allis earnings per share (EPS). The earnings per share represent themonies earned on behalf of each outstanding ordinary share. Theinvesting public closely watches EPS figures and considers theman important indicator of corporate success. Many firms tiemanagement bonuses to meeting specific EPS targets. Earningsper share are calculated as follows:
The value of LVMH’s earnings per share outstanding in 2006 is€3.98. This figure represents the money amount earned on
behalf of each share outstanding. The amount of earnings actually distributed to eachshareholder is the dividend per share.
The return on total assets (ROA), often called the return on investment (ROI),measures the overall effectiveness of management in using its assets to generatereturns.5 The return on total assets for LVMH in 2006 equals 6.53 per cent:
A closely related measure of profitability is the return on equity (ROE), whichcaptures the return earned on the ordinary shareholders’ (owners’) investment inthe firm. For a firm that uses only shares to finance its operations, the ROE and ROAfigures are identical. With debt or preference shares on the balance sheet, these ratiosusually differ. When the firm earns a profit, even after making interest payments tocreditors and paying dividends to preference shareholders, the firm’s use of leveragemagnifies the return earned by ordinary shareholders, and ROE exceeds ROA.
ROA �Net income
TA�
187928785
� 0.0653
EPS �Net income
# Shares�
1879471.90
� 3.98
NPM �Net income
Sales�
187915306
� 0.12
OPM �Operating profit
Sales�
305215306
� 0.19
GPM �Gross profit
Sales�
982515306
� 0.64
48 Part 1 The Basic Tools of Finance
operating profit marginA measure of profitabilitythat represents thepercentage of eachsales euro remainingafter deducting allcosts and expensesother than interest and taxes.
net profit marginA measure of profitabilitythat represents thepercentage of eachsales euro remainingafter all costs and expenses, includinginterest, taxes and pref-erence share dividends,have been deducted.
return on total assets(ROA)A measure of theoverall effectiveness of management ingenerating returns toordinary shareholderswith its availableassets.
return on equity (ROE)A measure that captures the returnearned on the ordinaryshareholders’ (owners’)investment in a firm.
See the entire interview at www.cengage.co.uk/megginson
SMART ETHICS VIDEOFrank Popoff, Chairman of the Board (retired), Dow Chemical‘Overstating or understating the performance of the enterprise is anathema . . . it’s just not on.’
SMART IDEAS VIDEOJohn Graham, Duke University‘We asked companies, “Do you manage your earnings?”’
See the entire interview at www.cengage.co.uk/megginson
5 Naturally, all other things being equal, firms prefer a high ROA. However, as we will see later, analystsmust be cautious when interpreting financial ratios. We recall an old Dilbert comic strip in which Wallysuggests boosting his firm’s ROA by firing the security staff. The reduction in expenses would boost thenumerator while the reduction in security would lower the denominator.

Conversely, if the firm’s earnings fall short of the amount it must pay to lenders andpreference shareholders, leverage causes ROE to be less than ROA. For LVMH, thereturn on equity for 2006 is 16.2 per cent, substantially above its return on total assets:
DuPont system of analysis Financial analysts sometimes conduct a deeper analysisof the ROA and ROE ratios using the DuPont system, which uses both income andbalance sheet information to analyse the ROA and ROE ratios into component parts.This approach highlights the influence of the net profit margin, total asset turnoverand financial leverage on a firm’s profitability. In the DuPont system, the return on totalassets equals the product of the net profit margin times total asset turnover. By defini-tion, the net profit margin equals earnings available for ordinary shareholders dividedby sales, and total asset turnover equals sales divided by total assets. When we multiplythese two ratios together, the sales figure cancels, resulting in the ROA measure:
Naturally, the ROA value for LVMH using the DuPont system is the same value wecalculated before, but now we can think of the ROA as a product of how much profitthe firm earns on each euro of sales and of the efficiency with which the firm uses itsassets to generate sales. Holding the net profit margin constant, an increase in totalasset turnover increases the firm’s ROA. Similarly, holding total asset turnover con-stant, an increase in the net profit margin increases ROA.
We can push the DuPont system one step further by multiplying the ROA by theratio of assets-to-equity (A/E), or the equity multiplier. The product of these two ratiosequals the return on equity. Notice that for a firm that uses no debt and has nopreference shares, the ratio of assets-to-equity equals 1.0, so the ROA equals the ROE.For all other firms, the ratio of assets-to-equity exceeds 1. It is in this sense that theratio of assets-to-equity represents a leverage multiplier.
ROE � ROA � EM
We can apply this version of the DuPont system to LVMH in 2006 to recalculate itsreturn on common equity:
ROE � 0.062 � 2.48 � 0.162
Note that for LVMH the ratio of assets-to-equity is 2.49, which means thatLVMH’s return on equity is over twice as large as its return on total assets. Of course,using financial leverage has its risks. Notice what would happen if LVMH’s return ontotal assets were a negative number rather than a positive one. The financial leveragemultiplier would cause LVMH’s return on equity to be even more negative than its ROA.
The advantage of the DuPont system is that it allows the firm to break down itsreturn on equity into a profit-on-sales component (net profit margin) that ties directlyto the income statement, an efficiency-of-asset-use component (total asset turnover)that ties directly to the balance sheet and a financial-leverage-use component (assets-to-equity ratio) that also ties directly to the balance sheet.
Market ratios
Market ratios relate the firm’s market value, as measured by its current share price,to certain accounting values. These ratios provide analysts with insight into how
SalesTA
� Net incomeSales
�Net income
TA
ROE �Net income
SE�
187911594
� 0.162
Chapter 2 Financial Statement and Cash Flow Analysis 49
duPont systemAn analysis that usesboth income andbalance sheetinformation to breakdown the ROA and ROEratios into theircomponent pieces.

investors think the firm is performing. Because the ratios include market values, theytend to reflect on a relative basis the shareholders’ assessment of all aspects of thefirm’s past and expected future performance. Here we consider two popular marketratios, one that focuses on earnings and an other that considers book value.
The most widely quoted market ratio, the price/earnings (P/E) ratio, is often usedas a barometer of a firm’s long-term growth prospects. The P/E ratio measuresthe amount investors are willing to pay for each euro of the firm’s earnings. Theprice/earnings ratio may indicate the degree of confidence that investors have in thefirm’s future performance. A high P/E ratio is believed to indicate that investors believea firm will achieve rapid earnings growth in the future; hence, companies with highP/E ratios are referred to as ‘growth stocks’. Simply stated, investors who believe thatfuture earnings are going to be higher than current earnings are willing to pay a lotfor today’s earnings, and vice versa. The price of LVMH shares on the Euronextexchange at end-2006 was €79.95, which given the EPS of €3.98 reported earlier,gives a PE ratio of 20.1. This figure indicates that investors were paying €20.01 foreach €1.00 of LVMH’s earnings.
The market/book (M/B) ratio provides another assessment of how investors viewthe firm’s past and, particularly, its expected future performance. It relates the marketvalue of the firm’s shares to their book value. The shares of firms that are expectedto perform well – improving profits, growing market share, launching successfulproducts and so forth – typically sell at higher M/B ratios than those firms with lessattractive prospects. Simply stated, firms that investors expect to earn high returnsrelative to their risk typically sell at higher M/B multiples than those expected to earnlow returns relative to risk.
50 Part 1 The Basic Tools of Finance
price/earnings (P/E)ratioA measure of a firm’slong-term growthprospects thatrepresents the amountinvestors are willing topay for each euro of afirm’s earnings.
market/book (M/B)ratioA measure used toassess a firm’s futureperformance by relatingits market value pershare to its book valueper share.
8 Which of the categories and individual ratios described in this chapter would be
of greatest interest to each of the following parties?
a Existing and prospective creditors (lenders)
b Existing and prospective shareholders
c The firm’s management.
9 How could the availability of cash inflow and cash outflow data be used to improve
on the accuracy of the liquidity and debt coverage ratios presented previously?
What specific ratio measures would you calculate to assess the firm’s liquidity and
debt coverage, using cash flow rather than financial statement data?
10 Assume that a firm’s total assets and sales remain constant. Would an increase
in each of the ratios below be associated with a cash inflow or a cash outflow?
a Current ratio d Average payment period
b Inventory turnover e Debt ratio
c Average collection period f Net profit margin
11 Use the DuPont system to explain why a slower-than-average inventory turnover
could cause a firm with an above-average net profit margin and an average
degree of financial leverage to have a below-average return on equity.
12 How can you reconcile investor expectations for a firm with an above-average
M/B ratio and a below-average P/E ratio? Could the age of the firm have any
effect on this ratio comparison?
CONCEPTREVIEWQUESTIONS

Chapter 2 Financial Statement and Cash Flow Analysis 51
INTERNET RESOURCES
Note: This textbook includes numerous internet links, both within the discussions and at the end ofeach chapter. Because some links are likely to change or be eliminated during the life of this edition,please go to the book’s website (www.cengage.co.uk/megginson) to obtain updated links.
http://www.carol.co.uk/
Free annual reports for many international companies.
http://www.iasb.org.uk/
The International Accounting Standards Board website.
http://www.quicken.com
A fairly extensive ratio analysis of a given company can be retrieved by typing in a ticker symbol.
http://www.rmahq.org/Ann_Studies/asstudies.html
Provides a sample of a Risk Management Association industry analysis and the material that explainsthe ratios, quartile, and other information that is available from RMA.
http://www.yahoo.com
Contains a link to Yahoo! Finance for retrieval of recent financial statements and a wide variety ofother financial information for many firms.
2.4 SUMMARY AND CONCLUSIONS
� The three key financial statements are (1) thebalance sheet, (2) the income statement and(3) the statement of cash flows. Notes describingthe technical aspects of the financial statementsare normally included with them.
� Depreciation is the most common non-cashcharge on income statements; others are amort-ization and depletion allowances. Depreciationis added back to EBIT after taxes to find a firm’soperating cash flow. A measure of cash flow thatis important to financial analysts is free cashflow, the cash flow available to investors. Freecash flow equals operating cash flow less thefirm’s net investment in fixed and current assets.
� The statement of cash flows, in effect, sum-marizes the firm’s cash flows over a specifiedperiod of time, typically one year. It presentscash flows divided into operating, investmentand financing flows. When interpreting thestatement, an analyst typically looks forunusual changes in either the major categories
of cash flow or in specific items to find clues toproblems that the firm may be experiencing.
� Financial ratios are a convenient tool foranalysing a firm’s financial statements to assessits performance over a given period. A varietyof financial ratios are available for assessingvarious aspects of a firm’s liquidity, activity,debt, profitability and market value. TheDuPont system is often used to assess variousaspects of a firm’s profitability, particularly thereturns earned on both the total asset invest-ment and the owners’ equity in the firm.
� Financial decision makers must be conversantwith basic corporate tax concepts, becausetaxes are a major measurement challenge thataffect both benefits and costs. Taxes are amajor outflow of cash to the profitable firm;they are levied on both ordinary income andcapital gains. The marginal tax rate is morerelevant than the average tax rate in financialdecision making.

52 Part 1 The Basic Tools of Finance
KEY TERMS
accrual-based approach
activity ratios
assets-to-equity (A/E) ratio
average age of inventory
average collection period
average payment period
cash flow approach
coverage ratio
current ratio
debt ratio
debt-to-equity ratio
deferred taxes
DuPont system
equity multiplier
financial leverage
financing flows
fixed asset turnover
free cash flow (FCF)
gross profit margin
inventory turnover
investment flows
liquidity ratios
long-term debt
market/book (M/B) ratio
minority interest
net profit margin
net working capital
non-cash charges
operating cash flow (OCF)
operating flows
operating profit margin
ordinary shares
par value (of share)
preference shares
price/earnings (P/E) ratio
quick (acid-test) ratio
ratio analysis
reserves (retained earnings)
return on equity (ROE)
return on total assets (ROA)
share premium account
times interest earned ratio
total asset turnover
treasury shares
S&M ManufacturingBalance sheet at 31 December 2006 (€000)
Assets Liabilities and equity
Current assets Current liabilities
Cash € 140 000 Accounts payable € 480 000
Marketable securities 260 000 Notes payable 500 000
Accounts receivable 650 000 Accruals 80 000
Inventories 800 000 Total current €1 060 000
Total current assets €1 850 000 liabilities
Fixed assets Long-term debt
Gross fixed assets €3 780 000 Bonds outstanding €1 300 000
Less: Accumulated 1 220 000 Bank debt (long-term) 260 000
depreciation Total long-term debt €1 560 000
Net fixed assets €2 560,000 Shareholders’ equity
Total assets €4 410 000 Preference shares €180 000
Par value of shares 200 000
Paid-in capital 810 000
in excess of par
Retained earnings 600 000
Total shareholders’ €1 790 000
equity
Total liabilities €4 410 000
and equity
SELF-TEST PROBLEMS
ST2-1 Use the financial statements below toanswer the questions about S&M Manufacturing’s
financial position at the end of the calendaryear 2006.
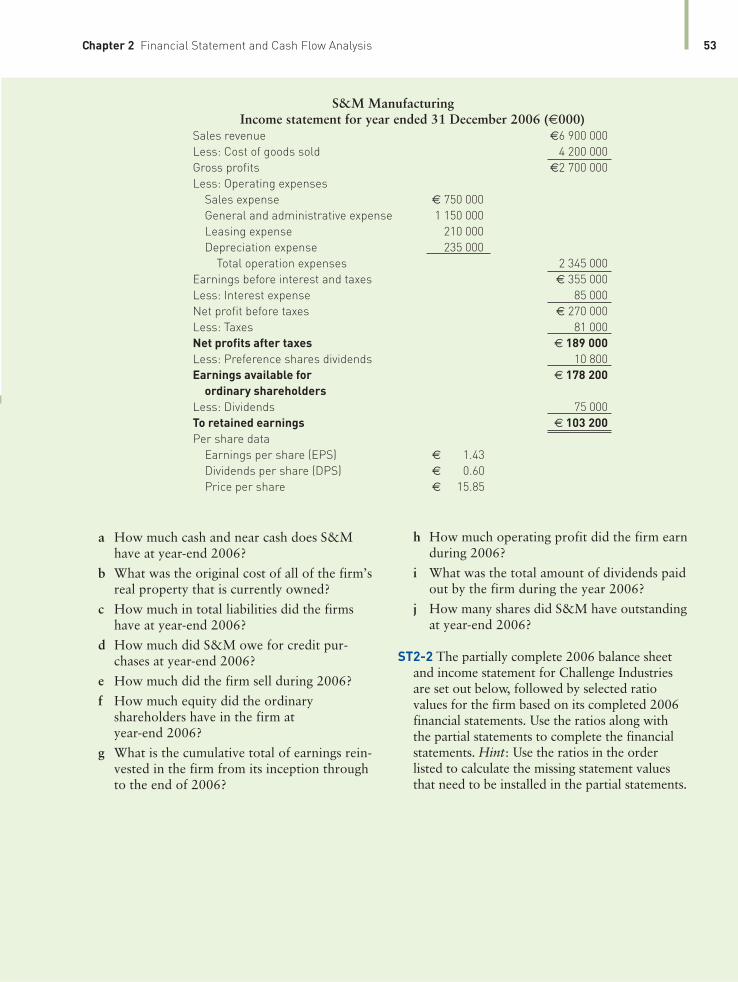
Chapter 2 Financial Statement and Cash Flow Analysis 53
S&M ManufacturingIncome statement for year ended 31 December 2006 (€000)
Sales revenue €6 900 000
Less: Cost of goods sold 4 200 000
Gross profits €2 700 000
Less: Operating expenses
Sales expense € 750 000
General and administrative expense 1 150 000
Leasing expense 210 000
Depreciation expense 235 000
Total operation expenses 2 345 000
Earnings before interest and taxes € 355 000
Less: Interest expense 85 000
Net profit before taxes € 270 000
Less: Taxes 81 000
Net profits after taxes € 189 000
Less: Preference shares dividends 10 800
Earnings available for € 178 200
ordinary shareholders
Less: Dividends 75 000
To retained earnings € 103 200
Per share data
Earnings per share (EPS) € 1.43
Dividends per share (DPS) € 0.60
Price per share € 15.85
a How much cash and near cash does S&Mhave at year-end 2006?
b What was the original cost of all of the firm’sreal property that is currently owned?
c How much in total liabilities did the firmshave at year-end 2006?
d How much did S&M owe for credit pur-chases at year-end 2006?
e How much did the firm sell during 2006?f How much equity did the ordinary
shareholders have in the firm at year-end 2006?
g What is the cumulative total of earnings rein-vested in the firm from its inception throughto the end of 2006?
h How much operating profit did the firm earnduring 2006?
i What was the total amount of dividends paidout by the firm during the year 2006?
j How many shares did S&M have outstandingat year-end 2006?
ST2-2 The partially complete 2006 balance sheetand income statement for Challenge Industriesare set out below, followed by selected ratiovalues for the firm based on its completed 2006financial statements. Use the ratios along withthe partial statements to complete the financialstatements. Hint: Use the ratios in the orderlisted to calculate the missing statement valuesthat need to be installed in the partial statements.
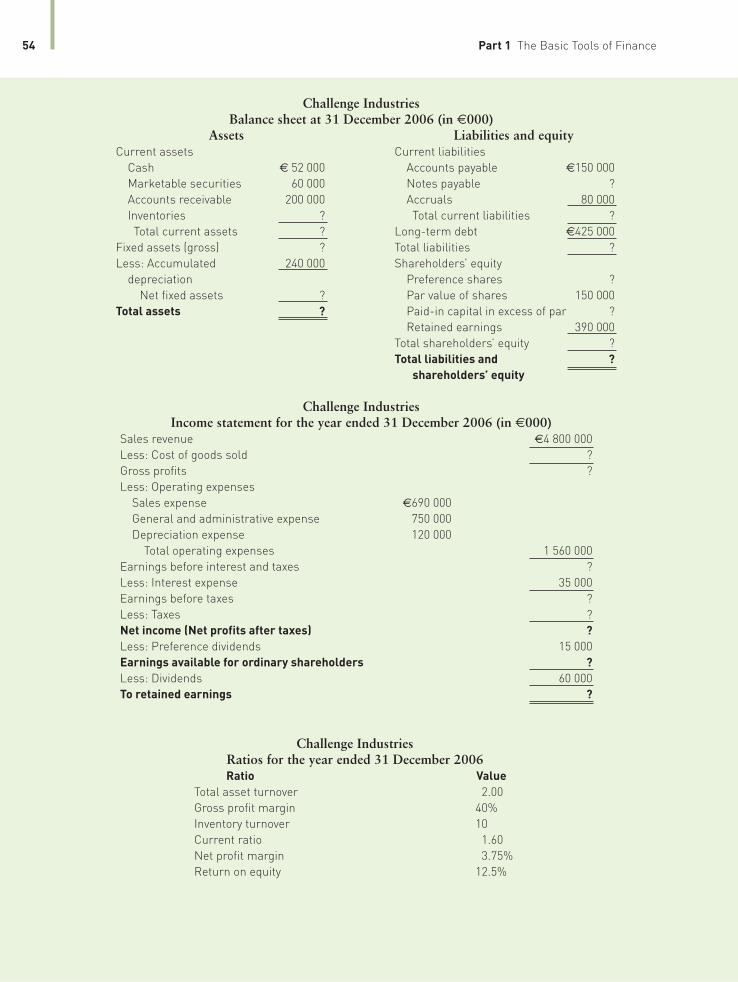
54 Part 1 The Basic Tools of Finance
Challenge IndustriesBalance sheet at 31 December 2006 (in €000)
Assets Liabilities and equityCurrent assets Current liabilities
Cash € 52 000 Accounts payable €150 000
Marketable securities 60 000 Notes payable ?
Accounts receivable 200 000 Accruals 80 000
Inventories ? Total current liabilities ?
Total current assets ? Long-term debt €425 000
Fixed assets (gross) ? Total liabilities ?
Less: Accumulated 240 000 Shareholders’ equity
depreciation Preference shares ?
Net fixed assets ? Par value of shares 150 000
Total assets ? Paid-in capital in excess of par ?
Retained earnings 390 000
Total shareholders’ equity ?
Total liabilities and ?
shareholders’ equity
Challenge IndustriesIncome statement for the year ended 31 December 2006 (in €000)
Sales revenue €4 800 000
Less: Cost of goods sold ?
Gross profits ?
Less: Operating expenses
Sales expense €690 000
General and administrative expense 750 000
Depreciation expense 120 000
Total operating expenses 1 560 000
Earnings before interest and taxes ?
Less: Interest expense 35 000
Earnings before taxes ?
Less: Taxes ?
Net income (Net profits after taxes) ?
Less: Preference dividends 15 000
Earnings available for ordinary shareholders ?
Less: Dividends 60 000
To retained earnings ?
Challenge IndustriesRatios for the year ended 31 December 2006Ratio Value
Total asset turnover 2.00
Gross profit margin 40%
Inventory turnover 10
Current ratio 1.60
Net profit margin 3.75%
Return on equity 12.5%

Chapter 2 Financial Statement and Cash Flow Analysis 55
QUESTIONS
Q2-1 What information (explicit and implicit) canbe derived from financial statement analysis?Does the standardization required by IFRS addgreater validity to comparisons of financial databetween companies and industries? Are therepossible shortcomings to relying solely on financial statement analysis to value companies?
Q2-2 Distinguish between the types of financial information contained in the various financialstatements. Which statements provide informationon a company’s performance over a reporting period, and which present data on acompany’s current position? What sorts of valuable information may be found in the notesto financial statements? Describe a situation inwhich the information in the notes would be essential to making an informed decision aboutthe value of a company.
Q2-3 If you were a commercial credit analystcharged with the responsibility of making an accept/reject decision on a company’s loan request, with which financial statement wouldyou be most concerned? Which financial statement is most likely to provide pertinent information about a company’s ability to repayits debt?
Q2-4 What is operating cash flow (OCF)? How isit calculated? What is free cash flow (FCF)?How is it calculated from OCF? Why do financial managers focus attention on the value of FCF?
Q2-5 Describe the common definitions of ‘inflowsof cash’ and ‘outflows of cash’ used by analyststo classify certain balance sheet changes and income statement values. What three categoriesof cash flow are used in the statement of cashflows? To what value should the net value in the statement of cash flows reconcile?
Q2-6 What precautions must one take when usingratio analysis to make financial decisions?Which ratios would be most useful for a financialmanager’s internal financial analysis? Which foran analyst trying to decide which stocks aremost attractive within an industry?
Q2-7 How do analysts use ratios to analyse a firm’sfinancial leverage? Which ratios convey moreimportant information to a credit analyst – thoserevolving around the levels of indebtedness orthose measuring the ability to meet the contractualpayments associated with debt? What is the relationship between a firm’s levels of indebtedness and risk? What must happen for anincrease in financial leverage to be successful?
Q2-8 How is the DuPont system useful inanalysing a firm’s ROA and ROE? What information can be inferred from the decomposition of ROE into contributing ratios? What is the mathematical relationshipbetween each of the individual components (net profit margin, total asset turnover and assets-to-equity ratio) and ROE? Can ROE beraised without affecting ROA? How?
PROBLEMS
Financial statements
P2-1 Obtain financial statements for Microsoft for the last five years either from its website(http://www.microsoft.com) or from the SEC’sonline EDGAR site (http://www.sec.gov/edgar/searchedgar/webusers.htm). First, look atthe statements without reading the notes. Then,read the notes carefully, concentrating on thoseabout executive stock options. Do you have adifferent perspective after analysing these notes?
Cash flow analysis
P2–2 Given the balance sheets and selected datafrom the income statement of SMG Industriesthat follow, answer parts (a)–(c).
a Calculate the firm’s operating cash flow(OCF) for the year ended 31 December2004, using Equation 2.1.
b Calculate the firm’s free cash flow (FCF) forthe year ended 31 December 2004, using Equation 2.2.
c Interpret, compares and contrast your cashflow estimates in parts (a) and (b).
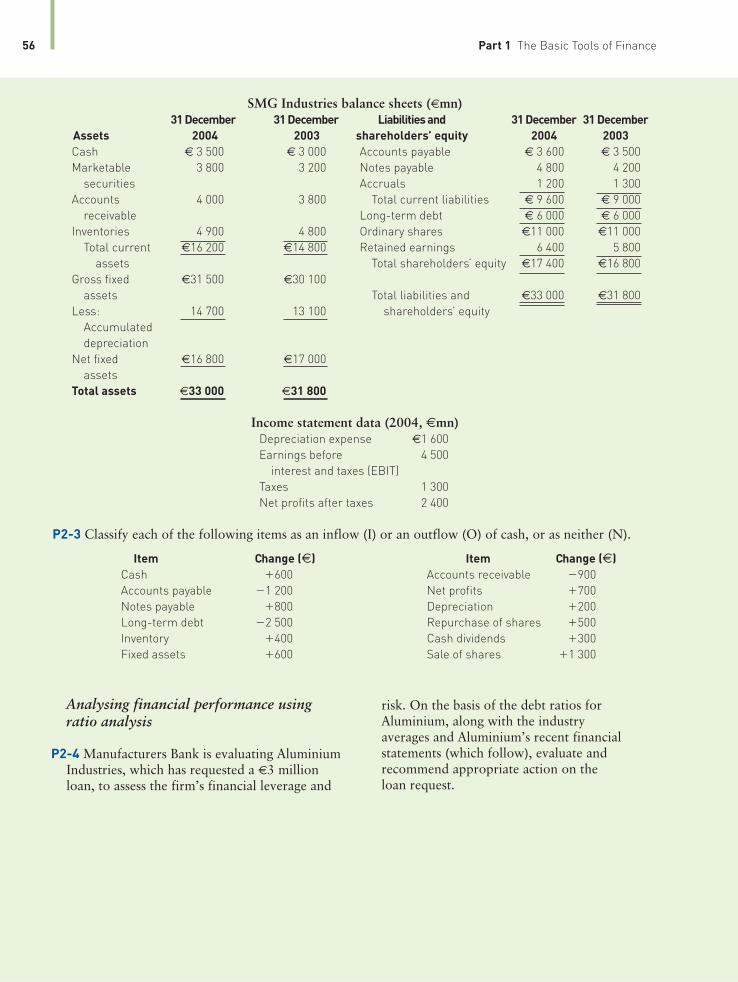
56 Part 1 The Basic Tools of Finance
SMG Industries balance sheets (€mn)31 December 31 December Liabilities and 31 December 31 December
Assets 2004 2003 shareholders’ equity 2004 2003
Cash € 3 500 € 3 000 Accounts payable € 3 600 € 3 500
Marketable 3 800 3 200 Notes payable 4 800 4 200
securities Accruals 1 200 1 300
Accounts 4 000 3 800 Total current liabilities € 9 600 € 9 000
receivable Long-term debt € 6 000 € 6 000
Inventories 4 900 4 800 Ordinary shares €11 000 €11 000
Total current €16 200 €14 800 Retained earnings 6 400 5 800
assets Total shareholders’ equity €17 400 €16 800
Gross fixed €31 500 €30 100
assets Total liabilities and €33 000 €31 800
Less: 14 700 13 100 shareholders’ equity
Accumulated
depreciation
Net fixed €16 800 €17 000
assets
Total assets €33 000 €31 800
Income statement data (2004, €mn)Depreciation expense €1 600
Earnings before 4 500
interest and taxes (EBIT)
Taxes 1 300
Net profits after taxes 2 400
P2-3 Classify each of the following items as an inflow (I) or an outflow (O) of cash, or as neither (N).
Item Change (€) Item Change (€)
Cash �600 Accounts receivable �900
Accounts payable �1 200 Net profits �700
Notes payable �800 Depreciation �200
Long-term debt �2 500 Repurchase of shares �500
Inventory �400 Cash dividends �300
Fixed assets �600 Sale of shares �1 300
risk. On the basis of the debt ratios for Aluminium, along with the industry averages and Aluminium’s recent financial statements (which follow), evaluate and recommend appropriate action on the loan request.
Analysing financial performance using ratio analysis
P2-4 Manufacturers Bank is evaluating AluminiumIndustries, which has requested a €3 millionloan, to assess the firm’s financial leverage and
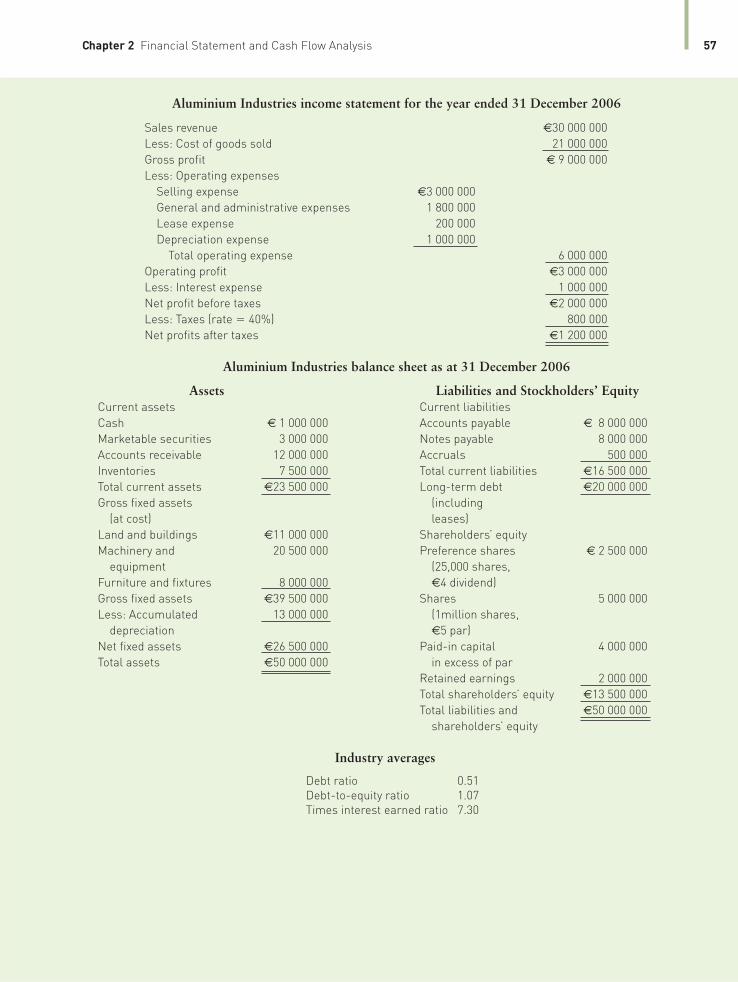
Chapter 2 Financial Statement and Cash Flow Analysis 57
Aluminium Industries income statement for the year ended 31 December 2006
Sales revenue €30 000 000
Less: Cost of goods sold 21 000 000
Gross profit € 9 000 000
Less: Operating expenses
Selling expense €3 000 000
General and administrative expenses 1 800 000
Lease expense 200 000
Depreciation expense 1 000 000
Total operating expense 6 000 000
Operating profit €3 000 000
Less: Interest expense 1 000 000
Net profit before taxes €2 000 000
Less: Taxes (rate � 40%) 800 000
Net profits after taxes €1 200 000
Aluminium Industries balance sheet as at 31 December 2006
Assets Liabilities and Stockholders’ EquityCurrent assets Current liabilities
Cash € 1 000 000 Accounts payable € 8 000 000
Marketable securities 3 000 000 Notes payable 8 000 000
Accounts receivable 12 000 000 Accruals 500 000
Inventories 7 500 000 Total current liabilities €16 500 000
Total current assets €23 500 000 Long-term debt €20 000 000
Gross fixed assets (including
(at cost) leases)
Land and buildings €11 000 000 Shareholders’ equity
Machinery and 20 500 000 Preference shares € 2 500 000
equipment (25,000 shares,
Furniture and fixtures 8 000 000 €4 dividend)
Gross fixed assets €39 500 000 Shares 5 000 000
Less: Accumulated 13 000 000 (1million shares,
depreciation €5 par)
Net fixed assets €26 500 000 Paid-in capital 4 000 000
Total assets €50 000 000 in excess of par
Retained earnings 2 000 000
Total shareholders’ equity €13 500 000
Total liabilities and €50 000 000
shareholders’ equity
Industry averages
Debt ratio 0.51
Debt-to-equity ratio 1.07
Times interest earned ratio 7.30

58 Part 1 The Basic Tools of Finance
P2-5 Use the information below to answer the questions that follow.
Income statements for the year ended 31 December 2006Heavy Metal Metallic Stamping High-Tech
Manufacturing (MS) Software Co.(HMM) (HTS)
Sales €75 000 000 €50 000 000 €100 000 000
�Operating expenses 65 000 000 40 000 000 60 000 000
Operating profit €10 000 000 €10 000 000 € 40 000 000
�Interest expenses 3 000 000 3 000 000 0
Earnings before taxes € 7 000 000 € 7 000 000 € 40 000 000
�Taxes 2 800 000 2 800 000 16 000 000
Net income € 4 200 000 € 4 200 000 € 24 000 000
Balance sheets as of 31 December 2006Heavy Metal Metallic Stamping High-Tech
Manufacturing (MS) Software Co.(HMM) (HTS)
Current assets € 10 000 000 € 5 000 000 € 20 000 000
Net fixed assets 90 000 000 75 000 000 80 000 000
Total assets €100 000 000 €80 000 000 €100 000 000
Current liabilities € 20 000 000 €10 000 000 € 10 000 000
Long-term debt 40 000 000 40 000 000 0
Total liabilities € 60 000 000 €50 000 000 € 10 000 000
Shares € 15 000 000 €10 000 000 € 25 000 000
Retained earnings 25 000 000 20 000 000 65 000 000
Total equity € 40 000 000 €30 000 000 € 90 000 000
Total liabilities and €100 000 000 €80 000 000 €100 000 000
equity
a Use the DuPont system to compare the twoheavy metal companies shown above (HMMand MS) during 2006. Which of the two hasa higher return on equity? What is the causeof the difference between the two?
b Calculate the return on equity of the software company, HTS. Why is this value so different from those of the heavy metal companies calculated in part (a)?
c Compare the leverage levels between the industries. Which industry receives a greater contribution from return on total assets? Which industry receives a greatercontribution from the financial leverage as measured by the assets-to-equity (A/E) ratio?
d Can you make a meaningful DuPont comparison across industries? Why or why not?
P2-6 Refer to Problem 2-5, and perform the same analysis with real data. Download last year’s financial data from Air Liquide(http://www.airliquide.fr), ENI (www.eni.it) and BASF (www.basf.com) Which ratiosdemonstrate the greatest difference between Air Liquide and BASF? Which of the two is more profitable? Which ratios drive the greater profitability?
P2-7 A common-size income statement for Aluminium Industries’ 2005 operations follows. Using the firm’s 2006 income statement presented in Problem 2-4, developthe 2006 common-size income statement (seefootnote 1) and compare it with the 2005 statement. Which areas require further analysis and investigation?

Chapter 2 Financial Statement and Cash Flow Analysis 59
Aluminum Industries common-size income statement for the year ended 31 December 2005
Sales revenue (€35 000 000) 100%
Less: Cost of goods sold 65.9
Gross profit 34.1%
Less: Operating expenses
Selling expense 12.7%
General and administrative expenses 6.3
Lease expense 0.6
Depreciation expense 3.6
Total operating expense 23.2
Operating profit 10.9%
Less: Interest expense 1.5
Net profit before taxes 9.4%
Less: Taxes (rate � 40%) 3.8
Net profits after taxes 5.6%
P2-8 Use the following financial data for Greta’s
Gadgets to determine the effect of using additional
debt financing to purchase additional assets.
a Calculate the current (2006) net profit margin, total asset turnover, assets-to-equityratio, return on total assets and return on equity for Greta’s.
b Now, assuming no other changes, determinethe effect of purchasing the €1 million in assets using 100 per cent debt financing witha 10 per cent annual interest rate. Further,assume that the newly purchased assets generate an additional €2 million in sales
Assume that an additional €1 million of assets is
purchased with 100 per cent debt financing with a
10 per cent annual interest rate.
and that the costs and expenses remain at 90 per cent of sales. For the purposes of thisproblem, further assume a tax rate of 40 per cent. What is the effect on the ratios calculated in part (a)? Is the purchase ofthese assets justified on the basis of the return on equity?
c Assume that the newly purchased assets inpart (b) generate only an extra €500 000 insales. Is the purchase justified in this case?
Greta’s GadgetsIncome statement for the year ended 31 December 2006
Sales €4 000 000
�Costs and expenses @ 90% 3 600 000
Earnings before interest & taxes € 400 000
�Interest (0.10 � €1 000 000) 100 000
Earnings before taxes € 300 000
�Taxes @ 40% 120 000
Net income € 180 000
Greta’s GadgetsBalance sheet as at 31 December 2006
Assets Liabilities and shareholders’ equityCurrent assets € 0 Current liabilities € 0
Fixed assets 2 000 000 Long-term debt @ 10% €1 000 000
Total assets €2 000 000 Total liabilities €1 000 000
Shares equity €1 000 000
Total liabilities and €2 000 000
shareholders’ equity

60 Part 1 The Basic Tools of Finance
Buzz Coffee Shops 2006 financial statementsBalance sheet Income statement
Current assets € 250 000 Sales €500 000
Fixed assets 750 000 �Costs and expenses 200 000
Total assets €1 000 000 @ 40%
Earnings before €300 000
Current liabilities € 300 000 interest and taxes (EBIT)
Long-term debt 0 �Interest expense 0
Total liabilities € 300 000 Net profit before taxes €300 000
Equity € 700 000 �Taxes @ 40% 120 000
Total liabilities and €1 000 000 Net income €180 000
shareholders’ equity
P2-10 The financial statements of Access Corporation for the year ended 31 December 2006 follow.
Access Corporation income statement for the year ended 31 December 2006
Sales revenue €160 000
Less: Cost of goods solda 106 000
Gross profit € 54 000
Less: Operating expenses
Sales expense €16 000
General and administrative expense 10 000
Lease expense 1 000
Depreciation expense 10 000
Total operating expense 37 000
Operating profit € 17 000
Less: Interest expense 6 100
Net profit before taxes € 10 900
Less: Taxes @ 40% 4 360
Net profits after taxes € 6 540
a Access Corporation’s annual purchases are estimated to equal 75 per cent of cost of goods sold.
d Which component ratio(s) of the DuPont system is (are) not affected by the change insales? What does this imply about the use offinancial leverage?
P2-9 Tracey White, owner of the Buzz CoffeeShop chain, has decided to expand her operations.Her 2006 financial statements follow. Traceycan buy two additional coffeehouses for €3 million, and she has the choice of completely
financing these new coffeehouses with either a 10 per cent (annual interest) loan or the issuance of new shares. She also expects these new shops to generate an additional €1 million in sales. Assuming a 40 per cent tax rate and no other changes, should Tracey buy the two coffeehouses? Why or why not? Which financing option results in the better ROE?

Chapter 2 Financial Statement and Cash Flow Analysis 61
Access Corporation balance sheet as at 31 December 2006Assets Liabilities and shareholders’ equity
Cash € 500 Accounts payable € 22 000
Marketable 1 000 Notes payable 47 000
securities Total current liabilities € 69 000
Accounts 25 000 Long-term debt € 22 950
receivable Total liabilities € 91 950
Inventories 45 500 Sharesa € 31 500
Total current € 72 000 Retained earnings 26 550
assets Total liabilities €150 000
Land € 26 000 and shareholders’ equity
Buildings 90 000
and equipment
Less: 38 000
Accumulated
depreciation
Net fixed assets € 78 000
Total assets €150 000
a The firm’s 3000 outstanding shares closed 2006 at a price of €25 per share.
a Use the preceding financial statements to complete the following table. Assume that the industry averages given in the table are applicable for both 2005 and 2006.
P2-11 Given the following financial statements,historical ratios and industry averages, calculateUG Company’s financial ratios for 2006.Analyse its overall financial situation both in
b Analyse Access Corporation’s financial condition as it relates to (1) liquidity, (2) activity, (3) debt, (4) profitability and (5)market value. Summarize the company’soverall financial condition.
comparison with industry averages and over theperiod 2004–2006. Break down your analysisinto an evaluation of the firm’s liquidity, activity, debt, profitability and market value.
Access Corporation’s financial ratiosIndustry average Actual ratio 2005 Actual ratio 2006
Current ratio 1.80 1.84 ________
Quick (acid-test) ratio 0.70 0.78 ________
Inventory turnover 2.50 2.59 ________
Average collection perioda 37 days 36 days ________
Average payment perioda 72 days 78 days ________
Debt-to-equity ratio 50% 51% ________
Times interest earned ratio 3.8 4.0 ________
Gross profit margin 38% 40% ________
Net profit margin 3.5% 3.6% ________
Return on total assets (ROA) 4.0% 4.0% ________
Return on equity (ROE) 9.5% 8.0% ________
Market/book (M/B) ratio 1.1 1.2 ________
a Based on a 365-day year and on end-of-year figures.
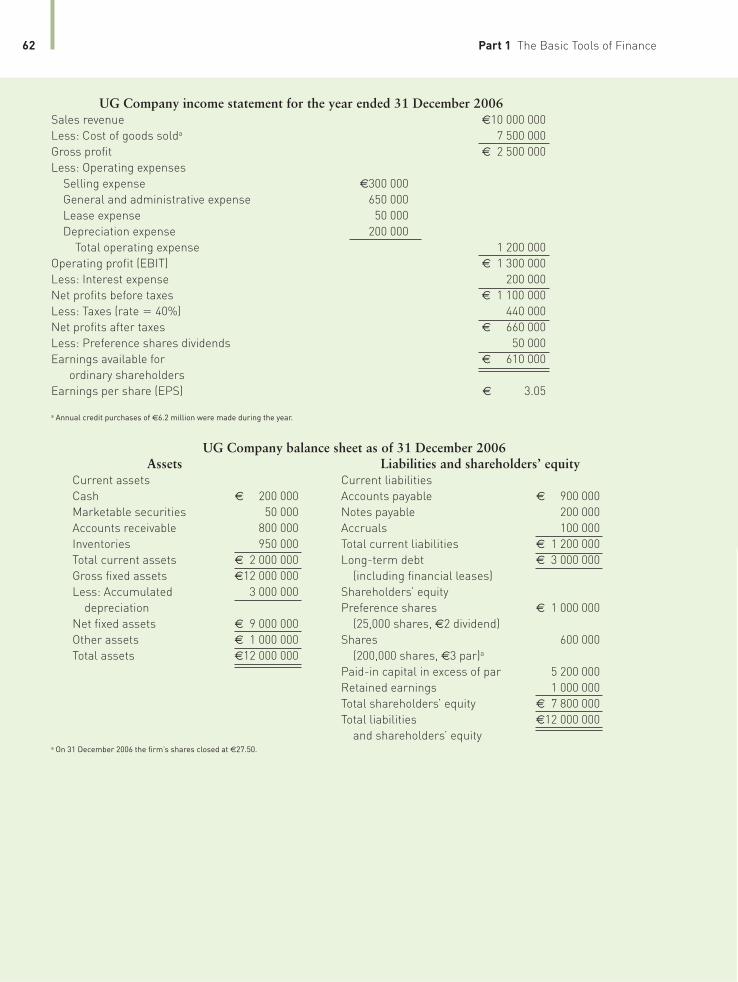
62 Part 1 The Basic Tools of Finance
UG Company income statement for the year ended 31 December 2006Sales revenue €10 000 000
Less: Cost of goods solda 7 500 000
Gross profit € 2 500 000
Less: Operating expenses
Selling expense €300 000
General and administrative expense 650 000
Lease expense 50 000
Depreciation expense 200 000
Total operating expense 1 200 000
Operating profit (EBIT) € 1 300 000
Less: Interest expense 200 000
Net profits before taxes € 1 100 000
Less: Taxes (rate � 40%) 440 000
Net profits after taxes € 660 000
Less: Preference shares dividends 50 000
Earnings available for € 610 000
ordinary shareholders
Earnings per share (EPS) € 3.05
a Annual credit purchases of €6.2 million were made during the year.
UG Company balance sheet as of 31 December 2006Assets Liabilities and shareholders’ equity
Current assets Current liabilities
Cash € 200 000 Accounts payable € 900 000
Marketable securities 50 000 Notes payable 200 000
Accounts receivable 800 000 Accruals 100 000
Inventories 950 000 Total current liabilities € 1 200 000
Total current assets € 2 000 000 Long-term debt € 3 000 000
Gross fixed assets €12 000 000 (including financial leases)
Less: Accumulated 3 000 000 Shareholders’ equity
depreciation Preference shares € 1 000 000
Net fixed assets € 9 000 000 (25,000 shares, €2 dividend)
Other assets € 1 000 000 Shares 600 000
Total assets €12 000 000 (200,000 shares, €3 par)a
Paid-in capital in excess of par 5 200 000
Retained earnings 1 000 000
Total shareholders’ equity € 7 800 000
Total liabilities €12 000 000
and shareholders’ equitya On 31 December 2006 the firm’s shares closed at €27.50.
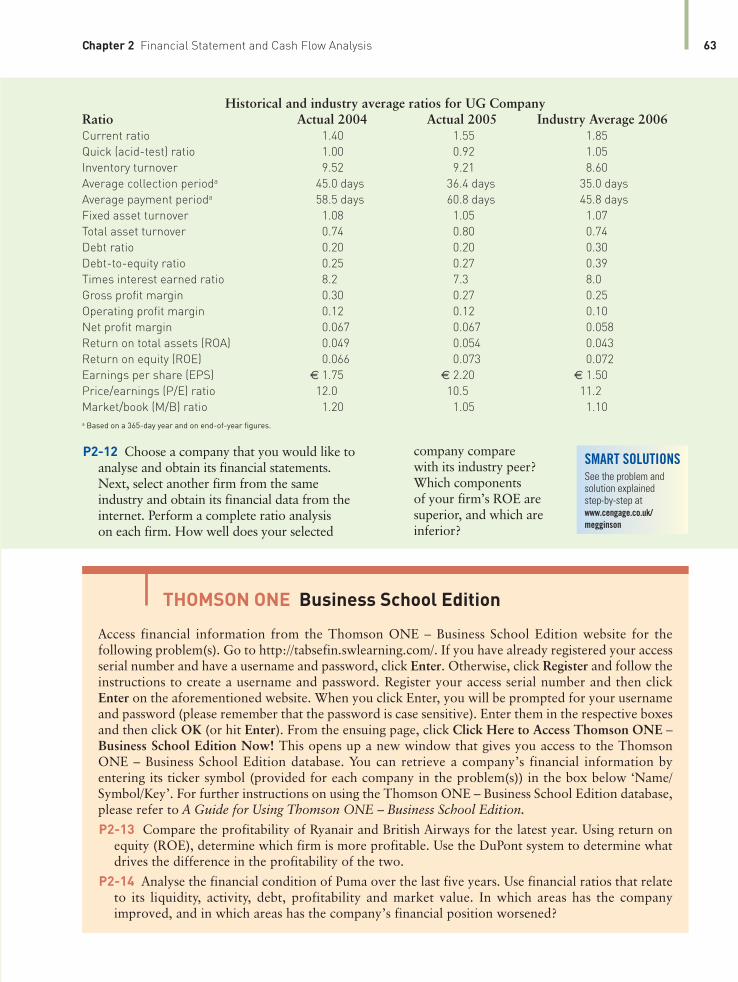
Chapter 2 Financial Statement and Cash Flow Analysis 63
THOMSON ONE Business School Edition
Access financial information from the Thomson ONE – Business School Edition website for thefollowing problem(s). Go to http://tabsefin.swlearning.com/. If you have already registered your accessserial number and have a username and password, click Enter. Otherwise, click Register and follow theinstructions to create a username and password. Register your access serial number and then clickEnter on the aforementioned website. When you click Enter, you will be prompted for your usernameand password (please remember that the password is case sensitive). Enter them in the respective boxesand then click OK (or hit Enter). From the ensuing page, click Click Here to Access Thomson ONE –Business School Edition Now! This opens up a new window that gives you access to the ThomsonONE – Business School Edition database. You can retrieve a company’s financial information byentering its ticker symbol (provided for each company in the problem(s)) in the box below ‘Name/Symbol/Key’. For further instructions on using the Thomson ONE – Business School Edition database,please refer to A Guide for Using Thomson ONE – Business School Edition.P2-13 Compare the profitability of Ryanair and British Airways for the latest year. Using return on
equity (ROE), determine which firm is more profitable. Use the DuPont system to determine whatdrives the difference in the profitability of the two.
P2-14 Analyse the financial condition of Puma over the last five years. Use financial ratios that relateto its liquidity, activity, debt, profitability and market value. In which areas has the companyimproved, and in which areas has the company’s financial position worsened?
Historical and industry average ratios for UG CompanyRatio Actual 2004 Actual 2005 Industry Average 2006Current ratio 1.40 1.55 1.85
Quick (acid-test) ratio 1.00 0.92 1.05
Inventory turnover 9.52 9.21 8.60
Average collection perioda 45.0 days 36.4 days 35.0 days
Average payment perioda 58.5 days 60.8 days 45.8 days
Fixed asset turnover 1.08 1.05 1.07
Total asset turnover 0.74 0.80 0.74
Debt ratio 0.20 0.20 0.30
Debt-to-equity ratio 0.25 0.27 0.39
Times interest earned ratio 8.2 7.3 8.0
Gross profit margin 0.30 0.27 0.25
Operating profit margin 0.12 0.12 0.10
Net profit margin 0.067 0.067 0.058
Return on total assets (ROA) 0.049 0.054 0.043
Return on equity (ROE) 0.066 0.073 0.072
Earnings per share (EPS) € 1.75 € 2.20 € 1.50
Price/earnings (P/E) ratio 12.0 10.5 11.2
Market/book (M/B) ratio 1.20 1.05 1.10
a Based on a 365-day year and on end-of-year figures.
P2-12 Choose a company that you would like toanalyse and obtain its financial statements. Next, select another firm from the same industry and obtain its financial data from the internet. Perform a complete ratio analysis on each firm. How well does your selected
company compare with its industry peer?Which components of your firm’s ROE are superior, and which are inferior?
SMART SOLUTIONSSee the problem and solution explained step-by-step at www.cengage.co.uk/megginson
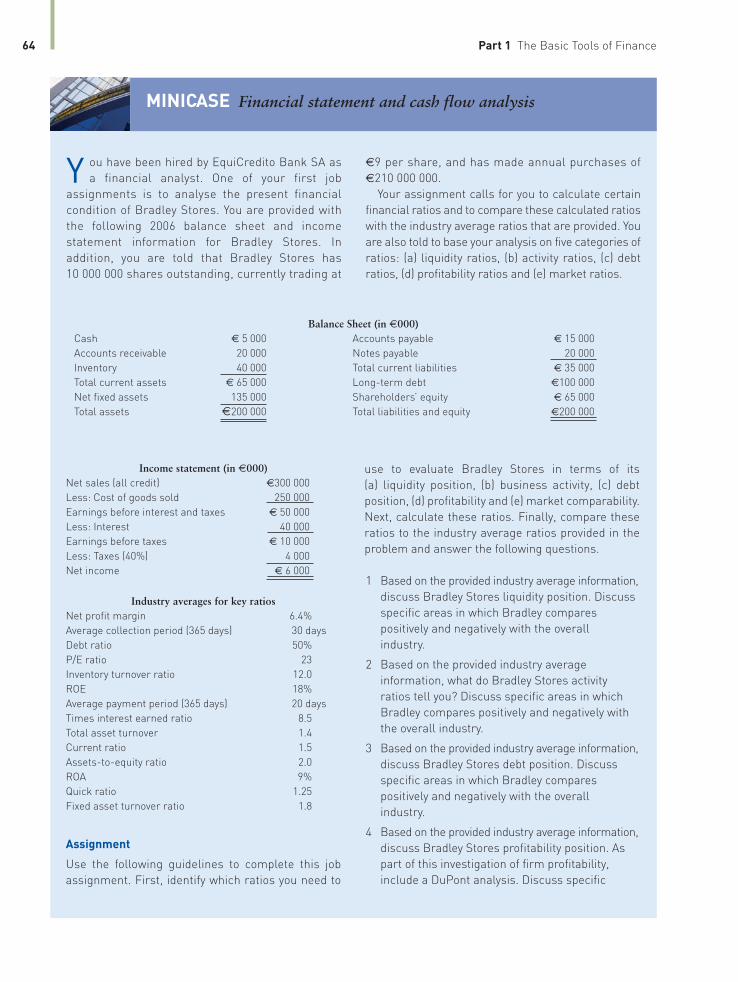
64 Part 1 The Basic Tools of Finance
ou have been hired by EquiCredito Bank SA as
a financial analyst. One of your first job
assignments is to analyse the present financial
condition of Bradley Stores. You are provided with
the following 2006 balance sheet and income
statement information for Bradley Stores. In
addition, you are told that Bradley Stores has
10 000 000 shares outstanding, currently trading at
€9 per share, and has made annual purchases of
€210 000 000.
Your assignment calls for you to calculate certain
financial ratios and to compare these calculated ratios
with the industry average ratios that are provided. You
are also told to base your analysis on five categories of
ratios: (a) liquidity ratios, (b) activity ratios, (c) debt
ratios, (d) profitability ratios and (e) market ratios.
MINICASE Financial statement and cash flow analysis
Y
Balance Sheet (in €000)Cash € 5 000 Accounts payable € 15 000
Accounts receivable 20 000 Notes payable 20 000
Inventory 40 000 Total current liabilities € 35 000
Total current assets € 65 000 Long-term debt €100 000
Net fixed assets 135 000 Shareholders’ equity € 65 000
Total assets €200 000 Total liabilities and equity €200 000
use to evaluate Bradley Stores in terms of its
(a) liquidity position, (b) business activity, (c) debt
position, (d) profitability and (e) market comparability.
Next, calculate these ratios. Finally, compare these
ratios to the industry average ratios provided in the
problem and answer the following questions.
1 Based on the provided industry average information,
discuss Bradley Stores liquidity position. Discuss
specific areas in which Bradley compares
positively and negatively with the overall
industry.
2 Based on the provided industry average
information, what do Bradley Stores activity
ratios tell you? Discuss specific areas in which
Bradley compares positively and negatively with
the overall industry.
3 Based on the provided industry average information,
discuss Bradley Stores debt position. Discuss
specific areas in which Bradley compares
positively and negatively with the overall
industry.
4 Based on the provided industry average information,
discuss Bradley Stores profitability position. As
part of this investigation of firm profitability,
include a DuPont analysis. Discuss specific
Income statement (in €000)Net sales (all credit) €300 000
Less: Cost of goods sold 250 000
Earnings before interest and taxes € 50 000
Less: Interest 40 000
Earnings before taxes € 10 000
Less: Taxes (40%) 4 000
Net income € 6 000
Industry averages for key ratiosNet profit margin 6.4%
Average collection period (365 days) 30 days
Debt ratio 50%
P/E ratio 23
Inventory turnover ratio 12.0
ROE 18%
Average payment period (365 days) 20 days
Times interest earned ratio 8.5
Total asset turnover 1.4
Current ratio 1.5
Assets-to-equity ratio 2.0
ROA 9%
Quick ratio 1.25
Fixed asset turnover ratio 1.8
Assignment
Use the following guidelines to complete this job
assignment. First, identify which ratios you need to
Chapter 2 Financial Statement and Cash Flow Analysis 65
areas in which Bradley compares positively and
negatively with the overall industry.
5 Based on the provided industry average information,
how is Bradley Stores viewed in the market-place?
Discuss specific areas in which Bradley compares
positively and negatively with the overall industry.
6 Overall, what are Bradley’s strong and
weak points? Knowing that your boss will
approve new loans only to companies in a
better-than-average financial position, what is
your final recommendation (approval or
denial of loan)?