chapter 3: eddy covariance fluxes of nitrogen oxides at harvard … · 2018-10-18 · chapter 3:...
TRANSCRIPT

Chapter 3 Eddy Covariance Fluxes of Nitrogen Oxides at Harvard Forest Abstract
NOx deposition is important to both the biosphere and the atmosphere the form of
nitrogen entering plants affects nutrient loading acid stress and toxicity the form of
nitrogen leaving the atmosphere affects O3 production HOx chemistry and long-range
transport of anthropogenic pollutants Tropospheric NO and NO2 rapidly interconvert in
a fast photochemical cycle but entirely different processes govern their removal rates at
the surface and their interactions with ecosystems Concentrations and vertical fluxes of
both must be measured in order to interpret the behavior of either species near the surface
and to quantify the net removal of NOx by deposition
We present eddy covariance flux measurements of NO and NO2 above a mixed
deciduous canopy at Harvard Forest in central Massachusetts April-November 2000 At
night NO2 is deposited at a rate that depends nonlinearly on NO2 concentration Eddy
flux observations of coupled downward NO and upward NO2 fluxes above the forest
during the day conform to the predicted behavior based on gradients of light and eddy
diffusivity through the canopy NO2 flux can be parameterized as a simple function of
light concentration and stomatal conductance The light-dependent term reflects
photochemical cycling of NO-NO2 and does not contribute to net NOx flux Net
deposition velocity of NOx was approximately 02 cm s-1 and showed little variation with
time of day or season
41
31 Introduction
Current estimates indicate that fossil fuel combustion and soil microbial emissions
are the largest sources of NOx to the global troposphere each accounting for
approximately 20 Tg N yr-1 followed by smaller contributions from biomass burning
lightning ammonia oxidation the ocean and the stratosphere [Aneja et al 2001] NO is
rapidly converted to NO2 via reaction with O3 (Reaction 31) with typical lifetimes
between 30 seconds and several hundred seconds NO2 can be photolyzed back to NO
(R32) regenerating O3 by the reaction of O(3P) with molecular oxygen (R33)
NO + O3 NO2 + O2 (R31)
NO2 + hν NO + O(3P) (R32)
O(3P) + O2 O3 (R33)
This cycle has no net effect on the concentration of O3
Oxidation of natural and anthropogenic hydrocarbon emissions produces
intermediate products such as the hydro-peroxy radical HO2 and higher molecular
weight organic peroxy radicals RO2 which provide alternative oxidants for NO (R34)
NO + RO2 NO2 + RO (R34)
In the presence of peroxy radicals a single NOx radical may cycle between NO and NO2
to produce multiple O3 molecules before oxidation to HNO3 occurs This process leads
to net O3 production via (R32) and (R33) and concentrations of NOx and hydrocarbons
together have a major effect on atmospheric levels of O3 Recent modeling work
suggests that for typical tropospheric conditions (R34) can influence the concentration
and flux gradients of NO NO2 and O3 as much as or more than (R31) - (R33) [eg Heal
et al 2001]
42
Removal of NOx from the atmosphere is believed to occur mostly after NOx has
been oxidized to nitric acid HNO3 via reaction with OH (R35)
NO2 + OH + M HNO3 + M (R35)
HNO3 + hν NO2 + OH (R36)
Also NO2 can react with NO3 to form N2O5 which can then hydrolyze to form HNO3 in
the absence of OH [Galmarini et al 1997] HNO3 is a highly soluble and surface-
reactive molecule with large wet and dry deposition rates but with a very long lifetime
against photolysis to regenerate NO2 (R36) Hence deposition is the dominant loss
pathway for HNO3 [Jacob 2000]
Deposition of NO2 directly to a surface can short-circuit O3 production bypassing
the slower mechanism of oxidation to HNO3 and limiting O3 production rates [Wesley
and Hicks 2000 Lerdau et al 2000 Hosker and Lindberg 1982] Deposition of NO2
may thus be very important even though it may be a small fraction of total NOy flux [see
Chapter 4 Lefer et al 1999 Munger et al 1996] Because measurements of nitrogen
oxide radicals NOx = NO + NO2 are prone to chemical interferences and artifacts there
have been few in-situ few studies of their interaction with natural plant canopies and
results to date have been inconclusive in both direction and size of fluxes [Hanson and
Lindberg 1991] Most of the non-urban troposphere sees low NOx concentrations often
less than 1 ppb much lower than used in typical chamber studies In fact leaf chamber
and other plant-level measurements of NO2 deposition made at higher concentrations
extrapolate linearly to predict NO2 emission at low ambient concentrations [eg Sparks et
al 2001] NO2 release by vegetation under such conditions would have the opposite
43
effect on troposphere O3 potentially elevating production rates in NOx-limited regions
over much of the globe
NO2 flux measurements over short (lt 1m) crops and grasses vary greatly in
direction and diurnal pattern Past studies have reported nearly constant deposition [Coe
and Gallagher 1992] variable deposition [Wesely et al 1982] morning deposition
followed by afternoon emission [Delaney et al 1986] and daytime emission with
nighttime deposition [Stocker et al 1993 Padro et al 1998] NO2 deposition to soil
litter bark and other non-foliar surfaces may be as large as through leaf stomata [Eugster
and Hesterberg 1996 Hanson and Lindberg 1991] There have been very few
measurements of NO NO2 and O3 fluxes above tall deciduous coniferous or mixed
canopies most have employed enclosed chamber measurements on selected branches
leaves or other forest components [Rondon et al 1993 Sparks et al 2001] These
measurements are consistent with the hypothesis that daytime NO2 deposition to foliar
surfaces is controlled by stomatal conductance and that deposition to the forest floor and
soils may be as important as deposition to leaves They also suggest the presence of a
compensation point for NO2 such that below ambient concentrations of 1 ppb NO2
leaves may cease to take up or begin to emit NO2
We present measurements here of eddy covariance fluxes of NO2 NO and O3 at
the Harvard Forest Environmental Measurement Site during the spring summer and fall
of 2000 The triad of fluxes has not previously been simultaneously observed above a tall
forest canopy with reliable eddy covariance techniques The observations reveal NOx
deposition behavior that is distinctly different from the conventional parameterizations
currently used in many tropospheric chemistry and transport models
44
32 Methods
321 Site Description
The Harvard Forest site in central Massachusetts (4254N 7218W elevation 340
m) is a 50- to 70-year old mixed deciduous forest consisting primarily of red oak and red
maple with scattered hemlock red pine and white pine stands The terrain is roughly
95 forested and moderately hilly closest paved roads are more than 1 km away small
towns greater than 10 km distant Dominant winds are from the northwest and southwest
comprising two distinctly different chemical and meteorological regimes Northwesterly
flows correspond to cooler drier and less polluted air masses whereas the southwesterly
regime transports warmer more humid and significantly more polluted air masses
[Moody et al 1998] Further descriptions of the atmospheric chemistry at the site can be
found in Munger et al [1996]
322 Instruments
Our goal was to measure simultaneously the fluxes of NO NO2 NOy and O3 by
eddy covariance In order to measure eddy covariance fluxes of NO2 a technique with
consistent linear response high sensitivity and lack of interferences is required
Methods used in past studies that do not meet these criteria may show spurious fluxes due
to correlations between efficiency interferences and vertical wind speed or may require
extrapolation from unrealistically high concentrations For example systems which
photolyze NO2 to NO and subsequently detect NO via chemiluminescence suffer from
fluctuating conversion efficiencies [eg Rondon et al 1993 Munger et al 1996] the
45
chemiluminescent reaction of NO2 with Luminol has an interference which depends on
ambient O3 concentrations which in turn co-vary with vertical wind [Coe et al 1992
Walton et al 1997] and hot molybdenum or gold surfaces convert not only NO2 but
other NOy species as well to NO [eg Wesely et al 1982] NO measurements are more
straightforward as no conversion step is necessary before chemilumenscent detection O3
measurements are also more routine Flux measurements of NOy require special
instrumentation but have been routine at Harvard Forest since 1990 [Munger et al
1996]
From late August to mid-October 2000 a chemiluminescence detector (29 m
sampling height) was configured to measure NO concentrations at 8 Hz At other times
the chemiluminescence detector measured profiles and concentrations of NO and NO2
which was converted to NO in a photolysis cell prior to detection We installed a new
tunable diode laser absorption spectrometer (TDLAS) on a nearby tower to measure NO2
(22 m sampling height) at 1 Hz For complete TDLAS details refer to Chapter 2
Measurements of O3 concentration and flux employ C2H4-chemiluminescence (29 m
sampling height) and UV absorbance instruments respectively Three-axis sonic
anemometers facing into the prevailing wind direction (west) at the sampling heights on
both towers provided the vertical and horizontal wind velocities and virtual temperatures
(8 Hz) needed to compute eddy covariance fluxes of heat momentum NO NO2 and O3
(Munger et al 1996 1998) The layout of the site instruments and towers is depicted
schematically in Figure 31
46
EMSTower
TDLASTower100 m
SonicChemilumNO amp NO2NOy O3T PPFD
h=29 m
h=22 mSonic TDLASHNO3 amp NO2
Figure 31 Layout of Harvard Forest field site The EMS tower supports a sonic
anemometer at a height of 29 m along with inlets for chemiluminescence NO and NO2
NOy O3 and other trace gas instruments Temperature water vapor photosynthetic
photon flux density (PPFD) and other quantities are also measured on the EMS tower
some at multiple heights through the canopy The TDLAS tower a scaffolding structure
approximately 100 m distant supported a sonic anemometer and the TDLAS inlet at the
22 m height The TDLAS instrument was housed in two weatherproof enclosures (optics
and electronics) on the tower itself in order to minimize the inlet length Buildings near
the bases of both towers house instrumentation pumps gas cylinders and provide
electrical and internet connections
47
Photosynthetic photon flux density (PPFD) consisting of wavelengths between
400 nm and 700 nm was measured continuously at 29 m on the EMS tower using a LI-
COR quantum sensor Although the UV wavelengths associated with NO2 photolysis are
outside of the photosynthetic wavelength band we have used the more routine PPFD
measurements as a proxy for overall light level including the UV bands associated with
NOx photochemistry The midday UV (295 to 385 nm wavelengths) profile between 0
and 30 m was measured on one occasion at Harvard Forest using an Eppley total UV
radiometer placed facing upwards to capture direct plus diffuse downwelling radiation
and then facing downwards to capture diffuse upwelling radiation at each height
323 Eddy covariance fluxes
We computed 30-minute fluxes from the covariance of detrended vertical wind
velocity (wprime) with fluctuations of detrended temperature (Tprime) or detrended trace gas
concentration (Cprime) Details of the analysis process and software can be found in
Chapter 2
Because the photochemical reactions (R31)-(R34) occur on timescale
comparable to and in some cases faster than the turbulent diffusion timescale in the
surface layer we must consider the system of concentrations and fluxes for NO NO2
and O3 together [Fitzjarrald and Lenschow 1983] Deposition or exchange velocities
cannot be inferred from the fluxes and concentrations of any one species Our daytime
results were complicated by the fact that the NO2 concentration and flux were measured
at a different height than the NO and O3 concentrations and fluxes Physical and
experimental limitations to the height of the TDLAS tower and placement of the
48
instrument prevented co-location of the inlets We have therefore placed the daytime
deposition rates within the context of a simple model of turbulent diffusion and chemical
reaction in the surface layer described below
33 Results
331 NO2 Concentration Analysis and Comparison
Concurrent photolysis-chemiluminescence (hereafter P-C) and TDLAS
measurements allowed us to compare concentration data for NO2 over a wide range of
conditions throughout the spring summer and fall of 2000 The P-C system is routinely
calibrated with standard additions of a small flow of NO2 in N2 (calibration tank NO2
concentration of 5 micromol mol-1) to the air to determine the photolysis efficiency plus
addition of NO in N2 to determine the chemiluminescence detector response The NO2
tanks have been periodically calibrated against the NO standard but their long-term
stability remains a potential source of uncertainty Towards the end of the TDLAS
measurement period the concentrations of the standard tanks were checked by titration of
NO standards and by comparison with a larger cohort of NO2 standards The standard
tanks were found to be very close to their original concentrations See Munger et al
[1996] for complete details of the P-C NOx calibration procedure including corrections
for the effect (R31) in the sampling tubing
The TDLAS relies on accurate knowledge of the following spectroscopic
parameters to determine concentration absorption cross sections light path length laser
mode purity frequency tuning rate function pressure and temperature and laser line
49
width Absorption cross sections come from the HITRAN database and typically have
uncertainties of less than 10 [Rothman et al 1998] The light path length is confirmed
in the lab using standard additions into the multi-pass cell of an inert gas such as N2O
with absorption features in the frequency region of the measurement This calibration
can be done in the laboratory because the multi-pass cell body and mirrors are locked into
position and do not move relative to one another during field deployment The laserrsquos
frequency is first established using a built-in monochromator and a sealed reference cell
with a large concentration of NO2 This same cell provides a signal for locking the
frequency during instrument operation The laserrsquos frequency tuning rate function is
independently determined using a calibrated etalon The tuning rate can change as the
diode ages or after having warmed from liquid nitrogen to room temperature but can be
readjusted in the field by matching to the known spectral features Pressure and
temperature are measured in the multi-pass cell in order to compensate for the pressure
broadening and temperature dependence of the absorption lines
Typical TDLAS laser linewidths (due to all contributions to spectroscopic
instrument distortion) are well-approximated by a Gaussian function and are usually
small compared to the pressure broadened width for molecular spectral lines at 01 to
025 Pa We checked the laser linewidth by taking measurements at lower pressures with
all of the above factors already determined The particular diode used to measure NO2 in
this field deployment had an unusually large linewidth (approximately 0004 cm-1) and
non-Gaussian line shape The cause could not be determined before the diode reached
the end of its useable lifetime
50
In order to correct for the excess linewidth we simultaneously measured the
concentration of ambient water vapor in the absorption cell using our NO2 diode
(assuming Gaussian distortion) and a second diode with a more typical laser linewidth of
lt 0001 cm-1 We repeated this two-diode measurement with tank NO2 in N2 These
checks were performed before during and after field deployment The concentration
correction factor for the excess non-Gaussian distortion of the NO2 diode varied between
160 and 165 with a mean of 163 Field data were fit in real-time and in post analysis
using the standard Gaussian broadening function and later corrected by this factor
NO2 concentration measurements by the P-C and TDLAS instruments overlapped
between 4 April and 29 August 2000 The time series in Figure 32 shows the hourly
average NO2 concentrations from the two instruments during a four-day period In
Figure 33 all hourly TDLAS and P-C NO2 concentration measurements are compared
An orthogonal distance fit to the data with errors at the 95th confidence interval yields a
slope of 11 plusmn 02 a y-intercept of ndash02 plusmn 10 nmol mol-1 and an R2 of 091 The
agreement between the measurement methods is very good given the spatial separation of
the inlets both horizontally and vertically the precision of each instrument and the
calibration uncertainties for both instruments (~10)
332 Eddy Covariance Flux Validation
Lagged correlations ltwprimeNO2primegt and copsectra for vertical wind speed (w) and NO2
exhibit the expected offset and smearing due to instrument lag time and response function
(Figure 34) as compared for example to w and virtual temperature ltwprimeTsprimegt The peak in
51
14
12
10
8
6
4
2
0
[NO
2] (n
mol
mol
-1)
214213212211
Day of Year 2000
TDLAS [NO2] P-C [NO2]
Figure 32 Time series of hourly NO2 concentration measurements by the TDLAS and
P-C instruments at Harvard Forest
52
0 10 20 30
010
2030
11
TDLA
S [N
O2]
(nm
ol m
ol-1
)
Photolysis-Chemiluminescence [NO2] (nmol mol-1)
Hourly NO2 Comparison days 95-232 2000
0 10 20 30
010
2030
11
TDLA
S [N
O2]
(nm
ol m
ol-1
)
Photolysis-Chemiluminescence [NO2] (nmol mol-1)
Hourly NO2 Comparison days 95-232 2000
Figure 33 Hourly NO2 concentrations obtained by the TDLAS and the photolysis-
chemiluminescence detector at Harvard Forest The two instruments operated from
separate towers roughly 200 m apart at 22 m (TDLAS) and 29 m (P-C) sampling heights
Orthogonal distance fit with errors at the 95th confidence interval (y=a+bx)
a = -02 plusmn 10 b = 11 plusmn 02 R2 = 091
53
r(wt)
00
01
02
03
04
05
00
01
02
03
04
05 Raw W
Smeared W
Daytime Lagged Correlations Sept-Oct 2000
Delay Time (s)
r(wn
o2)
-60 -40 -20 0 20 40 60
-00
10
010
03-0
01
001
003
Nor
mal
ized
Cos
pect
ra
-02
00
02
04
06
08
10
-02
00
02
04
06
08
10 wT
wu
Daytime Cospectra Sept-Oct 2000
Freq (Hz)
0005 0050 0500
-02
00
02
04
06
08
10
-02
00
02
04
06
08
10 wNO2
wT smear 1wT smear 2wT smear 3
Figure 34 Average daytime lagged correlations and cospectra for (wT) and (wNO2)
r(wNO2) is lagged compared to r(wT) due to transit time in the inlet and the peak is
rounded due to an exponential instrument response function with time constant 1 second
The cospectrum of w with NO2 confirms that the response function is as expected when
compared with cospectra of w with T smeared by 1 s 2 s and 3 s exponentials
54
the lagged correlation r(wprime NO2prime) is shifted several seconds due to transit time through
the inlet to the TDLAS measurement cell The peak of r(wprimeNO2prime) is also rounded
compared to the sharp peak of r(wprimeTprime) because the instrument has a 1-second exponential
time response curve for NO2 (see Chapter 2) In order to correct for the instrument
response function the 8 Hz virtual temperature and w data were smeared with a 1-second
exponential and used to compute a heat flux for each 30-minute flux interval The ratio
of smeared heat flux to unaltered heat flux provided an estimate of the missing high-
frequency flux removed by the instrument response function [Goulden et al 1996
Munger et al 1996 1998] The corrections were typically 20 or smaller The
normalized cospectra in Figure 34 show that the NO2 flux begins to decline at
frequencies above 01 Hz unlike the heat flux which retains spectral information beyond
05 Hz The heat flux cospectrum computed with the 1-second smeared temperature data
has a shape similar to that of the NO2 cospectrum
333 Hourly Data
Hourly concentrations and fluxes of NO NO2 O3 and supporting trace gas and
meteorological measurements were recorded on a 24-hour basis at Harvard Forest during
the spring summer and fall of 2000 Eddy covariance NO2 fluxes span April through
November and eddy covariance NO fluxes were measured from late August to early
October All instruments experienced data dropouts ranging in length from hours to days
55
in length at various times during the measurement period due to equipment and computer
failures power outages software problems and routine maintenance
A typical Harvard Forest NOx and O3 time series is shown in Figure 35
Photochemical production of NO is apparent during the day as is conversion to NO2 at
night O3 concentrations and fluxes at the site plotted on the right-hand axes are
typically an order of magnitude greater than those of NOx Coupled fluxes of NO2
(upward) and NO (downward) arise during the day from photochemical cycling and
turbulent transport in the presence of the light gradient imposed by the forest canopy
Higher irradiance above the canopy favors production of NO (NO2+hν NO+O) lower
light below favors conversion back to NO2 (NO+ O3 NO2+ O2) Although the daytime
fluxes of NO2 appear to be greater in magnitude than the corresponding NO fluxes the
imbalance is mostly due to the difference in measurement height of NO (29 m) and NO2
(22 m) as we examine further in the next section Median diel cycles for NO NO2 and
O3 for the entire measurement period April-November 2000 segregated by wind sector
are shown in Figure 36
56
4
3
2
1
0
[NO
] [N
O2]
(nm
ol m
ol-1
)
287286285284283282281Day of Year 2000
8
4
0
-4
FNO
FN
O2 (
micromol
m-2
hr-1
)
-100-50050100
FO3 (microm
ol m-2 hr -1)
50403020100
[O3 ] (nm
ol mol -1)
O3 NO2 NO
Figure 35 Time series of hourly NO (solid lines left axes) NO2 (dashed lines left axes)
and O3 (solid lines right axes) concentrations (upper panels) and fluxes (lower panels)
Oct 7-12 2000 NO2 measurements were taken at a sampling height of 22 m NO and O3
at 29 m on a nearby tower
57
02
46
80
24
68
NW
Hour
0 6 12 18
-4-2
02
4
02
46
80
24
68
SW
Hour
0 6 12 18
-4-2
02
4
[NO][NO2][O3]10
FNOFNO2FO310
Flux
(microm
ol m
-2hr
-1)
Con
cent
ratio
n (n
mol
mol
-1)
Figure 36 Diel cycles of median concentrations (upper panels) and fluxes (lower
panels) for the Northwest (2700-450 left panels) and Southwest (1800-2700 right panels)
wind sectors at Harvard Forest April-November 2000 for NO NO2 and O310 NO and
O3 were sampled at a height of 29 m and NO2 at 22 m Vertical bars indicate 25th and
27th quartiles for NO and NO2 measurements NO2 concentration and nighttime
deposition are enhanced under southwesterly conditions as are O3 and the morning NO
maximum
58
34 Discussion
In the following sections we examine relationships of fluxes and concentrations
for various conditions and species The generalized exchange velocity for a species
(fluxconcentration) allows fluxes to be compared in a normalized form In order to
remain consistent with the flux sign convention used herein we define positive exchange
velocity at the sampling height as upward (in the direction of emission) and negative
exchange velocity as downward (in the direction of deposition) regardless of whether the
process represents net emission or deposition to the surface To facilitate the calculation
of exchange velocity in units of cm s-1 we express flux in units of concentration times
velocity (nmol mol-1 cm s-1) which is also the actual quantity measured by the
instrumentation The conversion to SI flux units is 1 nmol mol-1 cm s-1 = 1606 micromol m-2
hr-1 (STP) Temperature and pressure corrections to this conversion have been taken into
account in the following analyses
341 Nighttime Deposition of NO2
At night NO concentration and flux fall to near zero photochemical cycling
ceases and the NO2 flux should capture total NOx exchange The observed nighttime
NO2 flux was generally small Figure 37 shows that nighttime NO2 flux depends
quadratically on [NO2] A polynomial regression of the form FNO2 = F0 + V0 [NO2] + a
[NO2]2 gives the results in Table 31
The quadratic dependence in the regression is largely driven by the two nights
during the sampling period when the median concentration of NO2 was above 10 nmol
mol-1 excluding these nights the parameter a is not statistically significant
59
0 5 10 15 20 25 30
-20
-15
-10
-50
5 Hourly Data (fitted)Nightly Medians +
[NO2] (nmol mol-1)
NO
2Fl
ux (n
mol
mol
-1cm
s-1
)FNO2(night) = F0 + V0 [NO2] + a [NO2]2
F0 = 0V0 = -008 plusmn 003 (cm s-1)a = -0013 plusmn 0001 (nmol-1 mol cm s-1)
R2 = 063
Figure 37 Nighttime hourly (dots) and median nightly (pluses) NO2 flux vs
concentration with results of least-squares fit on the hourly data (curve) The flux is
expressed in units of concentration times velocity (nmol mol-1 cm s-1) in order to simplify
the interpretation of the coefficients in the least-squares fit Pressure and temperature
corrections have been taken into account in the conversion from density to mixing ratio
60
Table 31 Polynomial regression results for nighttime FNO2 = F0 + V0 [NO2] + a [NO2]2
F0 plusmn std error (nmol mol-1 cm s-1)
V0 plusmn std error (cm s-1)
a plusmn std error (nmol-1 mol cm s-1) R2
-02 plusmn 01 (p-value=007)
-001 plusmn 005 (p-value=08)
-0015 plusmn 0002 (p-valuelt1E-4) 060
All Hourly Data
Constrained to 0 -008 plusmn 003
(p-value=001)
-0013 plusmn 0001 (p-valueltlt1E-4) 060
-02 plusmn 01 (p-value=01)
-002 plusmn 01
(p-value=09)
-0014 plusmn 0002 (p-value=03) 003
[NO2]le10 nmol mol-1
Constrained to 0 -016 plusmn 006
(p-value=0005)
-0002 plusmn 001 (p-value=09) 003
-02 plusmn 02 (p-value=03)
-002 plusmn 006
(p-value=07)
-0015 plusmn 0002 (p-valuelt1E-4) 063
[NO2] ge1 nmol mol-1
Constrained to 0 -007 plusmn 003 (p-value=0003)
-0013 plusmn 0002 (p-valuelt1E-4) 052
61
A statistically significant non-zero F0 term cannot be interpreted as a physically
meaningful result NO2 cannot deposit if its concentration is zero The polynomial
regression does not take into account potential uncertainty in [NO2] which could
introduce a bias at low values where the uncertainty in the measurement is larger than the
absolute value By excluding [NO2] lt 1 nmol mol-1 from the regression we obtain an F0
which is not significantly different from zero It is therefore useful to constrain F0 to
zero V0 is frequently indistinguishable from zero If the quadratic dependence is in fact
valid over the full range of NO2 concentrations this result implies that the nighttime
deposition velocity of NO2 increases from approximately 02 cm s-1 at [NO2]=1 nmol
mol-1 to 05 cm s-1 at [NO2]=30 nmol mol-1 The data do not support the existence of a
compensation point for NO2 at night on average NO2 continues to deposit to not emit
from the forest even at low concentrations Note that soil emission fluxes of NO are
very low at Harvard Forest less than 09 micromol m-2 hr-1 [Munger et al 1996] so the
effects of freshly emitted NO conversion to NO2 are insignificant
The downward NO2 flux measured above the forest canopy at night may arise
from direct NO2 deposition to leaves litter bark and soil but not via leaf stomata
because they are largely closed in the absence of sunlight Eugster and Hesterberg [1996]
found that NO2 deposition to a litter meadow at night encountered less resistance than O3
deposition to the same surfaces Other studies have also found significant deposition
velocities for NO2 to soil litter and bark [Hanson et al 1991 and references therein]
Non-stomatal NO2 deposition could proceed via formation and heterogeneous
hydrolysis of N2O5 on forest surfaces below the sensor height as in (R37) ndash (R39) with
formation of NO3 (R37) the rate limiting step [Jacob 2000]
62
NO2 + O3 NO3 + O2 (R37)
NO3 + NO2 + M N2O5 + M (R38)
N2O5 + H2O 2HNO3 (R39)
Since HNO3 deposits rapidly it is unlikely that much (if any) of the HNO3 produced
heterogeneously from N2O5 hydrolysis would escape from the forest in the gas phase
Recent field observations of N2O5 and NO3 at night have shown that concentrations of
N2O5 build up over the course of the night that the NO3 to N2O5 ratio closely follows the
theoretical temperature-dependent equilibrium and that accumulated N2O5 is photolyzed
at dawn to recycle NO2 [Brown et al 2001 a and b] Thus only a portion of any NO2
flux due to (R37) ndash (R39) corresponds to net loss of NOx from the atmosphere
We can estimate the maximum downward NO2 flux due to N2O5 hydrolysis by
assuming a negligible vertical NO2 concentration gradient below the sensor 100
conversion of NO3 to N2O5 and 100 hydrolysis of N2O5 below the sensor height
H=22 m These upper limits are compared to the measured fluxes in Figure 38 for
nightly median NO2 concentrations less than 10 nmol mol-1 (Eq 31)
Max FNO2 (N2O5 hydrolysis) = 2middotHmiddotP(NO3) = 2 Hmiddotk7[NO2][O3] (Eq 31)
The maximum NO2 deposition attributable to N2O5 hydrolysis depends linearly on
[NO2] a linear regression of the computed flux against concentration yields a deposition
velocity of 0048plusmn0008 cm s-1 (p-value lt 1E-4) R2 = 05 a factor of 4-10 lower than the
observed deposition velocities Noisy data prevent definitive identification of the shape
of the observed dependence at concentrations below 10 nmol mol-1 but we infer that the
N2O5 hydrolysis estimate underpredicts the observed NO2 deposition flux At higher
NO2 concentrations the N2O5 hydrolysis estimate vastly underpredicts observed NO2
63
[NO2] (nmol mol-1)
NO
2Fl
ux (n
mol
mol
-1cm
s-1
)
Max N2O5 hydrolysisNightly Medians +
0 2 4 6 8 10
-2-1
01
Figure 38 Nightly median NO2 flux vs concentration for concentrations below 10 nmol
mol-1 (pluses) The maximum contribution to NO2 deposition by N2O5 hydrolysis on
forest surfaces (boxes) was estimated by calculating the production rate of NO3 from NO
+ O3 (the vertical NO2 concentration gradient is negligible) 100 conversion of NO3 to
N2O5 and 100 N2O5 hydrolysis on forest surfaces below 22 m The linear regression of
maximum NO2 deposition due to N2O5 hydrolysis vs [NO2] indicates an upper limit
deposition velocity of 0048plusmn0008 cm s-1 due to this process (R2 = 05 p-valuelt1E-4)
64
deposition (not shown) Although N2O5 hydrolysis very likely occurs on forest surfaces
it appears to account for a small fraction (lt30) of the observed nighttime NO2
deposition
The quadratic dependence of nighttime NO2 flux on concentration could also arise
from heterogeneous hydrolysis of NO2 and production of HONO below sensor height
Observations at urban and rural sites have shown that NOx can be converted to HONO on
aerosols [Notholt et al 1992 Andreacutes-Hernaacutendez et al 1996] Although NO2 is known
to react on hydrated surfaces the mechanism and kinetics of the process are not fully
understood It appears that the most likely heterogeneous NO2 hydrolysis reaction is
(R310) [Goodman et al 1999]
2NO2(g)+ H2O(a) HONO(g) + HNO3(a) (R310)
Laboratory studies have shown first-order kinetics in NO2 for (R310) at parts-per-million
(micromol mol-1) concentrations with NO2 adsorption as the rate-limiting step but the low-
concentration kinetics are unknown The atmospheric mechanism may involve N2O4 as a
key intermediate on the surface [Barney and Finlayson-Pitts 2000] As in the N2O5
hydrolysis mechanism the aqueous-phase HNO3 produced in (R310) is not likely to be
released to the gas phase Harrison et al [1994 1996] observed upward HONO fluxes
over vegetated surfaces at NO2 concentrations above 10 ppb along with a quadratic
dependence of [HONO] on [NO2] If the observed NO2 flux at Harvard Forest is the
result of (R310) then approximately half might be released as gas-phase HONO and
would not contribute to net loss of NOx from the atmosphere The amount of
heterogeneous nighttime HONO formation at the surface is important to daytime HOx
65
chemistry because at sunrise HONO is photolyzed to deliver a burst of OH and NO to
the surface layer
The evidence for direct NO2 deposition to soil litter and bark rests on only a few
studies under ambient conditions where surfaces were likely to be hydrated and none of
which had simultaneous gas-phase HONO measurements [Eugster and Hesterberg 1996
Hanson et al 1991] Thus it is possible that a portion of reported NO2 deposition to
various surfaces proceeds via NO2 hydrolysis in which case half of the deposited NO2
would remain on the surface as HNO3 and half might re-emerge as gas-phase HONO
Nighttime N2O5 hydrolysis leads to aqueous-phase HNO3 production so that this process
is also likely to contribute to some net atmospheric NOx loss Clearly individual
measurements of HONO N2O5 and NO3 concentrations and fluxes are crucial to
unraveling the nighttime NOx budget and its impact on tropospheric HOx and O3
chemistry At Harvard Forest it appears likely that heterogeneous N2O5 and NO2
hydrolysis both contribute to the observed nighttime NO2 flux though we cannot rule
out additional processes
Nighttime concentrations and fluxes of NO2 and NOy (Figure 39) show that the
measured NO2 flux accounts for between zero and 24 of total NOy deposition with a
notable dependence on wind direction The NOy sensor detects NOx HNO3 HONO
PANs and additional species If a portion of the downward NO2 flux is balanced by an
upward HONO flux then additional NOy flux is unattributed For the northwest wind
sector where the flux budget appears to be closed within the noise of the measurements
the fractional impact on the flux budget would be larger than for southwesterly conditions
where unmeasured species account for much of the NOy deposition
66
02
46
810
12
SW
Hour
19 20 21 22 23 0 1 2 3 4
-15
-10
-50
NOyNO2+HNO3NO2
FNO2FNO2+FHNO3FNOy
Flux
(microm
ol m
-2hr
-1)
Con
cent
ratio
n (n
mol
mol
-1)
02
46
810
12
NW
Hour
19 20 21 22 23 0 1 2 3 4
-15
-10
-50
Figure 39 Nighttime medians for the northwest (left) and southwest (right) wind
sectors April-November 2000 Upper panels Concentrations of NO2 NO2+HNO3 and
NOy (with vertical bars spanning 25th and 75th quartiles) Lower panels Fluxes of NO2
NO2+HNO3 and NOy (with 25th and 75th quartiles) For northwesterly conditions NO2
accounts for 48 to 65 of nighttime NOy concentration and 0 to 24 of NOy flux For
southwesterly conditions NO2 accounts for 35 to 58 of nighttime NOy concentration
and 0 to 13 of nighttime NOy flux
67
Most atmospheric models base their NO2 deposition parameterizations on the
modified Wesely [1989] scheme in which the surface resistance for NO2 prohibits
transfer except to lush vegetation exposed to sunlight where leaf stomata are open [eg
Bey et al 2001] Thus NO2 deposition velocity in these models falls to near zero at night
over vegetation regardless of the concentration of NO2 We observed nighttime NO2
deposition to the forest dependent on concentration and we infer that the behavior of
models departs significantly from the observed processes
Figure 310 compares observed nighttime NO2 deposition velocity to 24-hour
NO2 deposition from the Harvard GEOS-CHEM model on a monthly basis for Harvard
Forest [A Fiore personal communication] The nighttime NO2 deposition velocity of the
data is approximately half the modelrsquos 24-hour mean during the months when the canopy
is fully developed Since we believe that NO2 also deposits during the day (see below)
the modelrsquos 24-hour average deposition flux in summer may be approximately correct
although the day-night variation and dependence on NO2 concentration are incorrect
The model has no deposition when trees are bare but our data clearly indicate that
deposition continues at these times This discrepancy suggests a potentially large
underestimate of NOx deposition to forested landscapes during dormant months
342 Daytime Fluxes of NO NO2 O3 and NOy
During the day (R31) ndash (R34) establish a dynamic balance between NO NO2
and O3 while deposition of NO2 and O3 onto the forest canopy and sub-canopy
68
05
04
03
02
01
00
NO
2 Dep
ositi
on V
eloc
ity (c
m s
-1)
1110987654321
Month
GEOS-CHEM Harvard Forest Inland Box24-Hour Monthly Means 1995 1997 OBSERVED Harvard Forest TDLASNighttime Monthly Median 2000
Figure 310 Comparison of 24-hour monthly mean NO2 deposition in the GEOS-CHEM
model Harvard Forest box 1995 and 1997 to the observed nighttime monthly median
NO2 deposition measured at Harvard Forest in 2000 Unlike the observations the modelrsquos
nighttime deposition velocity of NO2 drops to near zero and contributes insignificantly to
total NOx deposition
69
surfaces continues The light gradient through the canopy (see Figure 311) drives (R32)
at a faster rate above than below shifting the balance of NOx toward NO above and NO2
below the canopy height (~20 m at this site) Theoretical studies have predicted that this
photochemical effect should produce coupled upward fluxes of NO2 and downward
fluxes of NO above the forest canopy [eg Gao et al 1993] These studies have
employed large suites of chemical reactions soil NO emissions canopy isoprene
emissions and leaf-level resistance models for NO2 HNO3 O3 and H2O2 deposition
We show below that a simpler approach captures much of the observed behavior of NOx
fluxes at Harvard Forest
Dominant features of the observed daytime NO and NO2 fluxes shown in Figures
35 and 36 are their opposite signs dependence on light and apparent imbalance
Upward NO2 flux at midday is reproducibly several times larger than downward NO flux
A simple model of canopy photochemical NOx cycling reveals that this apparent
imbalance is expected based on the difference in the height of the sampling inlets for the
two gases above the canopy For a trace gas species X continuity requires that a change
in concentration d[X]dt be due to the sum of chemical production PX chemical loss ndashLX
and flux - Φ
d[X]dt = Px ndash Lx ndash Φ (Eq 32)
For NOx photochemical cycling (R31)-(R33) we simplify Eq 32 by assuming steady
state d[X]dt = 0 ignoring horizontal transport and approximating the vertical flux as Φz
= ndashKc(z) d[X(z)]dz where Kc is a vertical exchange coefficient (ldquoeddy diffusivityrdquo) We
write the production and loss terms as
131
][]][[2 τ
NONOOkLP NONO === (Eq 33)
70
25
20
15
10
5
0
heig
ht (m
)
302520151050
295-385 nm Total UV (W m-2)
Harvard Forest 04 Oct 2001Local Noon Clear Sky
EMS Profile UV TDLAS Point UV
Figure 311 Midday profile of total UV radiation at Harvard Forest At each height the
Eppley total UV radiometer was placed horizontally facing upward to measure total
(direct plus diffuse) downwelling radiation and then facing downward to measure total
upwelling radiation The points indicate the sum of total downwelling and total
upwelling UV radiation Horizontal bars show observed variability in total downwelling
+ upwelling UV irradiance at each height within approximately one meter of the
measurement tower
71
2
2222
][][
τNO
NOjPL NONO === (Eq 34)
We scaled Kc(z) from Gao et al [1993] to the height of the Harvard Forest
canopy 20 m and approximated the effect of the light gradient from Figure 311 on the
lifetime of NO2 τ2(z) as shown in Figure 312 based on measurements made manually
with an Eppley UV photometer We estimated τ1asymp70s based on median k1(T) and [O3]
for the site the vertical gradient for O3 is small between 20 and 30 m making the
constant lifetime a reasonable approximation We then solved Eq 32 for NO and NO2 to
derive a simple model of vertical transport and photochemical cycling of NOx shown in
Figure 313
This calculation clarifies the cause of the imbalance between daytime NO and
NO2 fluxes observed in the time series and diel cycles in Figures 34 and 35 Because
the concentrations and fluxes of the two species were measured at separate heights 22 m
for NO2 and 29 m for NO they sampled different points along the concentration and flux
gradients induced by reduced light conditions below the canopy The larger observed
upward NO2 flux is expected based solely on photochemical cycling at a sampling point
closer to the canopy than that of NO
In addition to NO and NO2 fluxes corresponding to photochemical cycling
between the two NO2 is likely to interact with the vegetation via stomata during daylight
hours Canopy surface conductance gc is readily calculated using the Penman-Monteith
equation [Shuttleworth et al 1984] and the measured water vapor flux at Harvard Forest
Deposition velocities for species known to deposit through stomata (ie O3) correlate
strongly with gc [Munger et al 1996] As shown in Figure 314 daytime gc and the O3
72
01 05 50 500
020
4060
8010
0
0 1000 2000 30000 1000 2000 3000
020
4060
8010
0
Eddy Diffusivity K (m2 s-1) τ2 (s)
heig
ht (m
)
01 05 50 500
020
4060
8010
0
0 1000 2000 30000 1000 2000 3000
020
4060
8010
0
Eddy Diffusivity K (m2 s-1) τ2 (s)
heig
ht (m
)
Figure 312 Simple NOx photochemical canopy model inputs Eddy diffusivities are
scaled from Gao et al [1993] to the Harvard Forest canopy height of 20 m τ2 the
lifetime of NO2 against photolysis (reaction 2 NO2 + hν NO + O) scales inversely
with UV radiation τ2 was estimated for typical conditions of [O3] [NO][NO2] and
daytime UV profile under full-canopy conditions at the site The simple canopy model
also accepts an estimate of τ1 the lifetime of NO against reaction with O3 (reaction 31)
73
Concentration (nmol mol-1)
heig
ht (m
)
00 02 04 06 08 10
020
4060
8010
0
NO NO2
Normalized NOx = NO+NO2 = 1 nmol mol-1
Flux (nmol mol-1 cm s-1)
-2 -1 0 1 2-2 -1 0 1 2
020
4060
8010
0
NO NO2
Figure 313 Simple NOx photochemical canopy model outputs Left panel
concentrations of NO (dashed) and NO2 (solid) right fluxes of NO (dashed) and NO2
(solid) Symbols indicate measurement heights for NO (29 m) and NO2 (22 m) at
Harvard Forest The model solves the continuity equation for NO concentration at 200
levels ddz(-Kc(dNOdz)) = PNO ndash LNO where PNO = [NO]τ1 LNO = [NO]τ2 and zero
net deposition or emission of NOx is allowed NOx = NO + NO2 is normalized to 1 ppb
τ1 = 70s in this example Due to the measurement height difference observed upward
NO2 flux due to photochemical cycling alone should be substantially larger than observed
downward NO flux attributable to the same process
74
V(O
3) (c
m s
-1)
g c(c
m s
-1)
PPFD (mmol m-2 s-1)
00 05 10 15
-05
00
05
10
15
20
00 05 10 15
-3-2
-10
12
Figure 314 Daytime (including dawn and dusk) canopy surface conductance gc and O3
exchange velocity V(O3) vs above-canopy photosynthetic photon flux density (PPFD)
during the summer of 2000 at Harvard Forest Dots are hourly values Filled squares
represent quantile-binned means (quantiles of PPFD were used to define bins and all gc
or V(O3) for data hours falling within the bins were averaged) Both quantities are
indicators of stomatal conductance and increase in absolute value with PPFD up to a
maximum level
75
exchange velocity are both related to photosynthetic photon flux density (PPFD) The
dependence is nonlinear absolute values of gc and V(O3) increase with PPFD up to
approximately 1 mmol m-2 s-1 and level off at higher PPFD values Note that PPFD is the
only continuously-monitored measure of light intensity at Harvard Forest (as with many
ecological and trace-gas monitoring stations) and is therefore used in the discussion
below as a proxy of photochemically-active UV wavelengths at the site despite the fact
that PPFD measures only the photosynthetically-active wavelength band (400-700 nm)
For the time period when eddy covariance fluxes of both NO and NO2 were
measured (29 August-8 October 2000) Figure 315 shows that the daytime (as defined by
light level PPFD gt 001 mmol m-2 s-1) upward NO2 flux was strongly correlated with the
downward NO flux We can account for more of the variance in daytime FNO2 by using
in addition to a photochemical NOx cycling term βmiddotFNO additional terms representing a
constant deposition velocity V0middot [NO2] and a stomatal flux γmiddotgc (Table 32)
FNO2 = F0 + βmiddotFNO + V0middot [NO2] + γmiddotgc (Eq 35)
The relationship between FNO2 and FNO is significant in all of the fits as shown by the
low p-values and consistent values of β Note that an upward NO2 flux contribution
could be included as either a constant (zero order) flux term F0 or as a function of
stomatal conductance γ when F0 is constrained to zero For the F0=0 cases R2 has been
calculated as follows in order to omit the origin
)var()var(1
2
2
FNOresidualR minus= (Eq 36)
The constant deposition velocity term V0 is significant when the stomatal term is also
included in the fit A flux term dependent on the square of the NO2 concentration
a[NO2]2 (not shown in Table 32) is only marginally significant regardless of which other
terms are included in the regression
76
NO
2Fl
ux (micro
mol
m-2
hr-1
)
- NO Flux (micromol m-2 hr-1)
0 2 4 6 8 10 12
-10
010
2030
40
Figure 315 Relationship between daytime hourly FNO2 and ndashFNO 29 August to 8
October 2000 FNO2 = (05plusmn01) - (35plusmn01)middotFNO R2 = 079
77
Table 32 Regressions of daytime FNO2 (as defined by light level see above covered
hours 500 to 2000 EST) in terms of linear combinations of βmiddotFNO V0middot[NO2] and γmiddotgc
F0 is the intercept for each fit representing flux at [NO2] = FNO = gc = 0 Flux units of
(nmol mol-1 cm s-1) are used Note that FNO is largely negative (downward) so that a
negative value of β represents a positive flux term
F0 plusmn std error
(nmol mol-1 cm s-1) β plusmn std error
(dimensionless) V0 plusmn std error
(cm s-1) γ plusmn std error (nmol mol-1) R2
05plusmn01 (p-valuelt1E-4)
-35plusmn01 (p-valuelt1E-4) NA NA 079
constrained to 0 -37plusmn01 (p-valuelt1E-4) NA NA 079
07plusmn02 (p-valuelt1E-4)
-38plusmn02 (p-valuelt1E-4)
-016plusmn008 (p-value=004) NA 084
constrained to 0 -37plusmn02 (p-valuelt1E-4)
003plusmn007 (p-value=07) NA 083
01plusmn03 (p-value=06 )
-35plusmn01 (p-valuelt1E-4) NA 10plusmn04
(p-value=002) 083
constrained to 0 -35plusmn01 (p-valuelt1E-4) NA 12plusmn02
(p-valuelt1E-4) 083
04plusmn03 (p-value=02)
-38plusmn02 (p-valuelt1E-4)
-018plusmn009 (p-value=005)
09plusmn05 (p-value=008) 087
constrained to 0 -38plusmn02 (p-valuelt1E-4)
-012plusmn008 (p-value=01)
13plusmn03 (p-valuelt1E-4) 087
78
The stable statistically significant relationship between the daytime fluxes of NO
and NO2 appears to indicate that although the species were measured on nearby towers at
different heights their photochemical cycling is coherent on an hourly basis This
process clearly dominates the behavior of NOx fluxes near the forest canopy but
represents neither net deposition nor net emission The next largest term appears to be a
constant deposition velocity downward flux of NO2 Finally there is a small positive
NO2 flux component which is equally well-fit as a constant flux or a stomatal
conductance-dependent term We performed additional regressions (not shown) using a
stomatal term of the form γprimemiddotgcmiddot([NO2]-[NO2]c) where [NO2]c is the compensation point
concentration below which vegetation emits NO2 While marginally significant values of
γprime could be obtained for [NO2]c values fixed between 1 and 10 nmol mol-1 the data did
not contain enough information to determine the compensation point independently In
2000 median summerfall daytime [NO2] was 11 nmol mol-1 (75th percentile=23 nmol
mol-1) Thus the vegetation at Harvard Forest usually experiences NO2 concentrations at
or below the 05 to 15 nmol mol-1 range of previously observed compensation points for
coniferous and tropical trees in chamber studies [eg Sparks et al 2001 Rondoacuten et al
1993] It is not possible to definitively attribute the small positive flux (γmiddotgc) to a
stomatal process the term could also indicate a chemical or other process which reduces
the deposition velocity under daytime conditions
To investigate the behavior of the NO2 flux beyond the limited period of NO flux
measurements we use above-canopy PPFD as a proxy for photochemical activity for our
data when NO fluxes were not measured Figure 316 shows daytime exchange
velocities of NO and NO2 plotted against PPFD For clarity hourly points are omitted
79
00 05 10 15
-10
12
34
NO2 (h=22m) leaves onNO2 (h=22m) leaves offNO (h=29m) leaves on
Exch
ange
Vel
ocity
(cm
s-1
)
PPFD (mmol m-2 s-1)
Figure 316 Daytime emission velocities of NO2 (leaves on solid triangles
leaves off open triangles) and NO (leaves on solid circles no data for leaves off
periods) plotted against photosynthetic photon flux density (PPFD) Symbols are
medians binned by percentiles of above-canopy PPFD For clarity hourly points are not
shown V(NO2) data span spring through fall 2000 while V(NO) data were collected late
August to early October 2000 only Linear fits to binned median points (exchange
velocities in units of cm s-1 PPFD in units of mmol m-2 s-1) reported in Table 33
80
and only the PPFD quantile-binned medians are plotted For each species we determine
quantiles of PPFD for daytime hours with data These quantiles define for each trace gas
species the measurement hours whose median values are shown The coupling of the bi-
directional NOx fluxes becomes more intense as the difference in light intensity from
above- to below-canopy increases during periods of high above-canopy illumination
cycling ceases as light intensity and therefore light gradient declines NO2 flux data are
segregated into full-canopy (leaves on) conditions from early June to mid-October and
leafless periods in April-May and October-November Linear regressions to the
percentile-binned medians of PPFD (V = VPPFD=0 + bmiddotPPFD) yield the following
relationships for the daytime data shown in Table 33
Before leaf-out and after leaf-fall the coefficient of PPFD in the NO2 regression
is smaller than for full-canopy conditions This expected since the leaf area index at
Harvard Forest at mid-summer is approximately 34 [Munger et al 1996] whereas the
area index for bare stems and twigs is only 09 [Barford et al 2001] The light gradient
for leaves-off conditions is smaller resulting in smaller concentration gradients and
reduced coupled NOx fluxes It is also likely that NO2 emission by the leaves contributes
to the increased slope of VNO2 vs PPFD when the canopy is developed
NO is not expected to deposit to surfaces in large amounts though there is very
little experimental evidence [Hanson et al 1991 Wesely and Hicks 2000] Soil NO
emission at Harvard Forest is small less than 09 micromol m-2 hr-1 [Munger et al 1996]
making NO unlikely to escape from the canopy before conversion to NO2 Thus the NO
flux at Harvard Forest is dominated by photochemical cycling and can be parameterized
as a function of PPFD and [NO] Coefficients for least squares fits to hourly daytime
FNO data (measurement height = 29m 29 Aug-8 Oct 2000) are shown in Table 34
81
Table 33 Linear regression of daytime percentile-binned median VNO2 and VNO
against of PPFD
VPPFD=0 plusmn std error
cm s-1 b plusmn std error
cm s-1 (mmol m-2 s-1)-1 R2
VNO2 leaves on -04 plusmn 01 (p-value=002)
27 plusmn 02 (p-valuelt1E-4) 097
VNO2 leaves off -01 plusmn 01 (p-value=03)
15 plusmn 02 (p-valuelt1E-4) 090
VNO leaves on -042 plusmn 007 (p-value=4E-4)
-05plusmn01 (p-value=7E-4) 078
82
Table 34 Regressions results for daytime FNO = F0_NO + V0_NO [NO] + bprime PPFD [NO]
F0_NO plusmn std error
(nmol mol-1 cm s-1)
bprime plusmn std error cm s-1 (mmol m-2 s-1)-1
V0_NO plusmn std error (cm s-1) R2
-008plusmn001 (p-valuelt1E-4)
-110plusmn002 (p-valuelt1E-4) NA 091
Constrained to 0
-114plusmn002 (p-valuelt1E-4)
NA 091
-006plusmn001
(p-valuelt1E-4)
-092plusmn004
(p-valuelt1E-4)
-018plusmn004
(p-valuelt1E-4) 091
Constrained to 0
-087plusmn004 (p-valuelt1E-4)
-025plusmn003
(p-valuelt1E-4) 091
83
To treat the larger daytime NO2 flux dataset we combine a terms representing the
light dependence shown in Figure 316 constant deposition velocity and stomatal
conductance Because gc was calculated assuming the presence of leaves we use the
measured deposition velocity of O3 Vd(O3) = -V(O3) as a proxy for the stomatal opening
from early spring through late fall Table 35 shows the results for the regressions using
these terms
A quadratic term amiddot[NO2]2 is not statistically significant when included because
we have few measurements with sufficiently high NO2 concentrations We interpret the
term (b+f)middotPPFDmiddot[NO2] as approximately accounting for the NO2 flux that arises from
photochemical cycling with NO (b+f) agrees well with the coefficients found in Table
33 As in the limited dataset regressions using FNO instead of PPFD (Table 32) V0
indicates an exchange velocity for NO2 on the order of -03 cm s-1 (downward) Given
the robust appearance of this term with different fit parameters for both limited and full
datasets we find it likely that V0 represents a roughly constant deposition velocity
process independent of NOx photochemical cycling during the day Though statistical
significance is low an upward flux term associated with stomatal conductance or related
variables also appears in Table 35
343 Parameterization of NOx Fluxes
Both nighttime and daytime NOx fluxes can be combined into a single
parameterization based on the above discussion This framework adopts the hypothesis
that photochemical NO-NO2 cycling can be largely accounted for by a simple light-
dependent term and that net deposition may then be estimated from additional terms
representing constant exchange velocity concentration-dependent exchange velocity and
84
Table 35 Multi-factor regression using all hourly daytime FNO2 data following the
functional form FNO2 = (b+f)middotPPFDmiddot[NO2] + V0 [NO2] + ΓmiddotVd(O3) The intercepts for all
fits have been constrained to zero The parameter f is a canopy flag set to zero for full-
canopy conditions so may be considered a correction to the PPFD term for leaves-off
periods in early spring and late fall
b plusmn std error cm s-1 (mmol m-2 s-1)-1
f plusmn std error cm s-1 (mmol m-2 s-1)-1
= 0 for leaves on V0 plusmn std error
(cm s-1) Γ plusmn std error (nmol mol-1) R2
196plusmn007 (p-valuelt1E-4)
-13plusmn01 (p-valuelt1E-4) NA NA 055
240plusmn009
(p-valueltlt1E-4)
-132plusmn009 (p-valuelt1E-4)
-035plusmn005 (p-valuelt1E-4) NA 060
196plusmn008 (p-valuelt1E-4)
-11plusmn01 (p-valuelt1E-4) NA 01plusmn01
(p-value=04) 062
229plusmn009 (p-valuelt1E-4)
-11plusmn01 (p-valuelt1E-4)
-030plusmn005 (p-valuelt1E-4)
03plusmn01 (p-value=003) 065
85
stomatal conductance-related exchange processes Thus for the height of 22 m relative to
the 20 m canopy the flux of NO2 day and night is given by the simple function of NO2
concentration PPFD and O3 deposition velocity
FNO2 = V0 middot [NO2] + amiddot[NO2]2 + (b+f)middotPPFDmiddot[NO2] + ΓmiddotVd(O3) (Eq 37)
where f is added to the coefficient of PPFD to account for the observed difference
between full-canopy and leaves-off conditions
NO is not present in significant quantities at night and FNO appears to be driven
by a simple dependence on PPFD during the day We include a constant deposition
velocity term as well since evidence of NO deposition to surfaces is weak and
inconclusive At a measurement height of 29 m the flux of NO is given by
FNO = V0_NO middot [NO] + bprime middot PPFD middot [NO] (Eq 38)
The net fluxes of NO and NO2 may be determined by omitting the photochemical terms
from Eq 37 and 38 Since we expect the deposition velocity of NO to be small
FNOx(net)asympFNO2(net)
FNOx(net) asymp V0 middot [NO2] + amiddot[NO2]2 + ΓmiddotVd(O3) (Eq 39)
Multi-factor regressions for Eq 37 and Eq 38 were performed to determine the
coefficients V0 a b f V0_NO and brsquo using all available hourly observations of [NO2]
[NO] PPFD Vd(O3) FNO2 and FNO at Harvard Forest April-November 2000 The
results are presented in Table 36 along with the range of results from the separate
daytime and nighttime analyses discussed earlier
86
Table 36 Multi-factor regressions using all available hourly observations of [NO2]
[NO] PPFD Vd(O3) FNO2 and FNO at Harvard Forest April-November 2000 Note
that Vd(O3)=deposition velocity positive values indicate downward O3 exchange
velocity
z = 22m FNO2 = V0 middot [NO2] + a middot [NO2]2 + (b+f)middotPPFDmiddot[NO2] + Γ middot Vd(O3)
coeff plusmn std err p-value
April ndash November 2000 (R2 = 060)
Range of results from separate day and night analyses
V0 (cm s-1) -021plusmn004 lt1E-4 -03 to -001
a (nmol-1 mol cm s-1) -0002plusmn0004dagger 06 -0013 to ndash0002
b (cm s-1 (mmol m-2 s-1)-1) 221plusmn007 lt1E-4 19 to 24
f (cm s-1 (mmol m-2 s-1)-1) =0 for leaves-on -110plusmn009 lt1E-4 -13 to -10
Γ (nmol mol-1) 021plusmn009 002 01 to 03
z = 29m FNO = V0_NO middot [NO] + bprime middot PPFD middot [NO]
29 August ndash 8 Oct 2000 (R2 = 092)
V0_NO (cm s-1) -025plusmn002 lt1E-4 -087 to -042
bprime (cm s-1 (mmol m-2 s-1)-1) -087plusmn003 lt1E-4 -114 to -05
daggerThe more statistically robust nighttime a =-0013 plusmn 0001 (Table 31) is recommended
87
Nearly all of the coefficients fall within the ranges determined previously except
V0 and V0_NO which differ only slightly from the earlier values As illustrated in Figures
317 and 318 Eq 37 and Eq 38 with the multi-factor regression coefficients in Table
36 are good predictors of the measured fluxes over their entire dynamic ranges and for
all sampled conditions
The diel variations of fluxes and residuals from this parameterization (Figure
319) reveal several interesting features The parameterization captures the overall diel
behavior of both NO and NO2 fluxes It also tends to underestimate the upward flux of
[NO2] during the day for northwesterly flow conditions and to slightly overestimate
during daytime southwesterly flows The disagreement rarely exceeds the 25th and 75th
quantiles of the measured fluxes The dominant flow regimes at Harvard Forest differ in
a number of key respects that may affect this result Northwesterly conditions tend to
bring lower concentrations of reactive nitrogen species cooler temperatures drier
weather and clearer skies than southwest winds [Moody et al 1998] It is possible that
one or more of these factors is contributing to the wind-sector difference in the residuals
One might expect that the residuals would depend on additional factors not taken
into consideration For example mixing and therefore deposition depends on the friction
velocity u (m s-1) As shown in figure 320 the residual NO2 flux tends upward only at
the highest u quantiles during the day and has no significant trend at night Similarly
the temperature-dependent rate for (R31) k1(T)[O3] has not been included yet we find
that the NO2 flux residuals exhibit no statistically significant trend with k1(T)[O3] (Figure
321) Although included as terms in the paratmeterization similar residual analyses are
shown for V(O3) during the day (Figure 321) and for [NO2] during the day and night
(Figure 322) The distinctly different daytime and nighttime behavior of the total NO2
flux is apparent again in Figure 322 as are the small residuals overall
88
Res
idua
l (M
es ndash
Para
m)
FN
O2
(nm
ol m
ol-1
cm s
-1)
Parameterized FNO2 (nmol mol-1 cm s-1)
Mea
sure
d FN
O2
(nm
ol m
ol-1
cm s
-1)
FNO2 = V0middot[NO2] + amiddot[NO2]2 + (b+f)middotPPFDmiddot[NO2] + ΓmiddotVd(O3)
Daytime +Nighttime
11
-20 -10 0 10 20 30
-20
-10
010
2030
Quantiles of Standard Normal
-2 0 2
-10
-50
510
Figure 317 Upper Measured vs parameterized NO2 flux shown with 11 line daytime
(+) and nighttime () The functional form the parameterization is shown at the top
Lower Residuals of FNO2 vs quantiles of the standard normal The residuals are
normally-distributed with extended upper and lower wings
89
-10 -8 -6 -4 -2 0 2
-10
-8-6
-4-2
02
Quantiles of Standard Normal
-2 0 2
-10
-05
00
05
10
15
Mea
sure
d FN
O (n
mol
mol
-1cm
s-1
)
Res
idua
l (M
es ndash
Para
m)
FN
O (n
mol
mol
-1cm
s-1)
Parameterized FNO (nmol mol-1 cm s-1)
FNO = V0_NOmiddot[NO] + b middotPPFDmiddot[NO]
11
Figure 318 Same as Figure 317 for FNO
90
Fl
ux (n
mol
mol
-1cm
s-1
)R
esid
ual (
nmol
mol
-1cm
s-1
)Measured FNO (h=22m)Measured FNO2 (h=22m)Parameterized FNOParameterized FNO2
Meas-Param FNOMeas-Param FNO2
-20
24
-20
24
NW
0 5 10 15 20
-2-1
01
2-2
-10
12
-20
24
-20
24
SW
0 5 10 15 20
-2-1
01
2-2
-10
12
Hour
Figure 319 Top panels Median diel measured (closed symbols solid lines) and
parameterized (open symbols dashed lines) fluxes of NO2 and NO Vertical bars show
the 25th and 75th quantiles for the measurements Lower panels Median diel residual
(measured-parameterized) FNO2 and FNO Northwest wind conditions are shown on the
left southwest on the right The parameterizations capture the daytime behavior of NO
flux due to the photochemical gradient and eddy diffusivity effects For NO2 under
northwesterly conditions the daytime residual is positive indicating that the
parameterization underestimates upward flux of NO2 For southwesterly conditions
daytime NO2 flux residuals are more variable and tend in the opposite direction
91
DAY NIGHT
FNO
2(n
mol
mol
-1cm
s-1
)R
esid
ual F
NO
2(n
mol
mol
-1cm
s-1
)
FNO
2(n
mol
mol
-1cm
s-1
)R
esid
ual F
NO
2(n
mol
mol
-1cm
s-1
)
Res
idua
l FN
O2
(nm
ol m
ol-1
cm s
-1)
Measured FNO2
Parameterized FNO2
Res
idua
l FN
O2
(nm
ol m
ol-1
cm s
-1)
u (m s-1) u (m s-1)
u (m s-1) u (m s-1)
-10
-50
510
00 05 10 15
-10
-50
510
-10
-50
510
00 05 10 15
-10
-50
510
00 02 04 06 08 10 12 14
-20
2
00 02 04 06 08 10 12 14
-20
2
Figure 320 From top to bottom measured and parameterized NO2 fluxes residuals
(measured-parameterized) and expanded-axes quantile-binned mean residuals (plusmn
standard deviation) vs u shown for daytime on the left and nighttime on the right
92
DAY k1(T)[O3] Day V(O3)
FNO
2(n
mol
mol
-1cm
s-1
)R
esid
ual F
NO
2(n
mol
mol
-1cm
s-1
)
FNO
2(n
mol
mol
-1cm
s-1
)R
esid
ual F
NO
2(n
mol
mol
-1cm
s-1
)
Res
idua
l FN
O2
(nm
ol m
ol-1
cm s
-1)
Measured FNO2
Parameterized FNO2
Res
idua
l FN
O2
(nm
ol m
ol-1
cm s
-1)
k1(T)[O3] (s-1) V(O3) (cm s-1)
k1(T)[O3] (s-1) V(O3) (cm s-1)
-10
010
2030
001 002 003 004
-10
-50
510
-10
010
2030
-003 -002 -001 00 001
-10
-50
510
0005 0010 0015 0020 0025 0030
-3-2
-10
12
-0015 -0010 -0005 00
-3-2
-10
12
Figure 321 Same as Figure 321 for daytime k1(T)[O3] (left) and daytime V(O3) (right)
93
DAY NIGHT
FNO
2(n
mol
mol
-1cm
s-1
)R
esid
ual F
NO
2(n
mol
mol
-1cm
s-1
)
FNO
2(n
mol
mol
-1cm
s-1
)R
esid
ual F
NO
2(n
mol
mol
-1cm
s-1
)
Res
idua
l FN
O2
(nm
ol m
ol-1
cm s
-1)
Measured FNO2
Parameterized FNO2
Res
idua
l FN
O2
(nm
ol m
ol-1
cm s
-1)
[NO2] (nmol mol-1) [NO2] (nmol mol-1)
[NO2] (nmol mol-1) [NO2] (nmol mol-1)
-10
010
2030
0 5 10 15 20
-10
-50
510
-20
-15
-10
-50
510
0 5 10 15 20
-10
-50
510
0 2 4 6 8
-3-2
-10
12
0 2 4 6 8 10 12
-20
24
Figure 322 Same as Figure 321 for [NO2] during the daytime (left) and nighttime
(right)
94
The lack of robust trends in the NO2 flux residuals indicates that within the
limitations of the dataset Eq 37 captures the crucial aspects of observed NO2 flux
behavior within and above the tall forest canopy under a wide range of conditions
Similarly Eq 38 accounts for 92 of the observed variance in the measured NO fluxes
under a somewhat narrower set of conditions (the sampling period for NO eddy
covariance flux measurements was relatively short) Figure 323 shows the resulting net
NOx flux (Eq 39 Table 36) and exchange velocity VNOx(net)=FNOx(net)[NO2] on a
diel basis for the sampling period April-November 2000 For the rural low-NOx
conditions at Harvard Forest we find that the flux of NOx is downward at all hours with
a deposition velocity of approximately 02 cm s-1
35 Conclusions
We installed a Tunable Diode Laser Absorption Spectrometer (TDLAS) to
measure continuous NO2 concentrations and eddy covariance fluxes above the canopy at
Harvard Forest during the spring summer and fall of 2000 An existing
chemiluminescence NO detector was configured to measure above-canopy eddy
covariance fluxes for a shorter period in the late summer and early fall A photolysis-
chemiluminescence (P-C) NO2 instrument also measured concentrations for a portion of
the sampling period Hourly average TDLAS and P-C NO2 concentrations agreed very
well under all conditions The agreement between the two instruments in the field and
the independent spectroscopic calibration of the TDLAS validated the long-term
measurements of the tank-calibrated P-C system
95
0 6 12 18
-10
-08
-06
-04
-02
00
-14
-12
-10
-08
-06
-04
-02
00
Net
FN
Ox
(nm
ol m
ol-1
cm s
-1)
(microm
ol m
-2hr
-1)
Net
VN
Ox
(cm
s-1
)
Hour
median| 25th amp 75th percentiles
0 6 12 18
-024
-022
-020
-018
Figure 323 Diel cycle of parameterized net NOx exchange velocity (upper panel) and
flux (lower panel) April-November 2000 FNOx(net) asymp FNO2(net) = V0middot[NO2] +
amiddot[NO2]2 + ΓmiddotVd(O3) VNOx(net) = FNO2(net)[NO2]
96
At night in the absence of significant quantities of NO we observed a consistent
downward flux of NO2 which depended quadratically on the concentration of NO2
although the dependence was apparent mainly on two nights when [NO2] was above 10
nmol mol-1 The nighttime NO2 deposition velocity varied between 02 cm s-1 at [NO2]=1
nmol mol-1 and 05 cm s-1 at [NO2]=30 nmol mol-1 These fluxes could come from direct
NO2 deposition to non-stomatal surfaces in the forest such as soil litter bark and the
outer surfaces of leaves area-normalized deposition velocities to such surfaces in
chamber measurements have varied from less than 01 to 05 cm s-1 for NO2
concentrations between 40 and 80 nmol mol-1 [Hanson and Lindberg 1991] The rate of
heterogeneous N2O5 hydrolysis resulting in aqueous-phase HNO3 (unlikely to re-enter the
gas phase) is insufficient to explain the observed nighttime NO2 deposition rates The
quadratic flux dependence and similarity to the behavior of HONO observed at other sites
suggests that heterogeneous NO2 hydrolysis may also play a significant role in NO2
deposition [Harrison and Kitto 1994 Harrison et al 1996 Barney and Finlayson-Pitts
2000] Half of any NO2 flux due to heterogeneous NO2 hydrolysis would likely escape
from the surfaces as gas-phase HONO potentially impacting the daytime HOx and NOx
budgets when photolyzed at sunrise
During the day we observed coupled fluxes of NO2 (upward) and NO
(downward) due to photochemical cycling driven by canopy-induced light and eddy
diffusivity gradients The imbalance in the observed fluxes corresponded to the
difference in height of the sampling levels relative to the canopy The exchange
velocities of the two species in their respective directions increased with higher above-
canopy light levels as measured by photosynthetic photon flux density (PPFD) due to the
97
stronger light gradient through the canopy under brighter conditions Upward NO2
velocity was smaller in early spring and late fall when there were no leaves on the trees
corresponding to a weaker light gradient condition (NO fluxes were only measured
during full-canopy conditions) and possibly to the absence of stomata-dependent
emission of NO2 We believe that these coupled fluxes are the first to be reported from a
mature tall-canopy site using reliable eddy-covariance appropriate sampling techniques
All of the NO and NO2 flux data day and night were well explained by a simple
parameterization consisting of two equations FNO2 = V0 middot [NO2] + amiddot[NO2]2 +
(b+f)middotPPFDmiddot[NO2] + ΓmiddotVd(O3) and FNO = V0_NO middot [NO] + bprime middot PPFD middot [NO] The net flux
of NOx is approximately equal to the flux of NO2 omitting the PPFD-dependent term
FNOxasympV0 middot [NO2] + amiddot[NO2]2 + ΓmiddotVd(O3) V0 and V0_NO are small constant deposition
velocity terms b and bprime are coefficients of light-dependent coupled fluxes for full-canopy
conditions and f adjusts the NO2 light-dependent term for no-leaves conditions The
deposition velocity of O3 was used as a proxy for stomatal exchange the coefficient Γ
was consistently positive Stomatal conductance correlates with a number of different
variables (light temperature humidity) complicating the interpretation of the final term
It may indicate a stomatal emission of NO2 under low-NOx conditions typical at Harvard
Forest but could also correspond to a chemical or other process which slows NO2
deposition during the day The quadratic term amiddot[NO2]2 was particularly significant at
night during a few high-[NO2] events Multi-factor regressions fitting the hourly data
with these equations yield R2 of 061 for FNO2 and 092 for FNO the coefficients
summarized in Table 36 agree with analyses of segregated daytime and nighttime data
We note that the coefficients are relevant to the specific measurement heights of NO (29
98
m) and NO2 (22 m) at Harvard Forest relative to the forest canopy height (20 m)
However the mechanism should be adaptable for more general application
During the measurement period net NO2 deposition velocity (omitting the PPFD-
dependent term associated with photochemical cycling of NOx) -(V0 + amiddot[NO2] +
ΓmiddotVd(O3)[NO2]) was between 015 and 03 cm s-1 The mean 02 cm s-1 varied by less
than 002 cm s-1 between day and night and between full-canopy and leafless conditions
NO2 deposition velocity measurements to deciduous forest canopies are scarce this result
falls just outside of the range of reported values for coniferous forests 01 to 15 cm s-1
[Hanson and Lindberg 1991 Rondoacuten et al 1993 Joss and Graber 1996] and short
crops such as alfalfa soy and oats 007 to 125 cm s-1 [Hanson and Lindberg 1991]
The only estimates of NO deposition velocity are over grass ~01 to 02 cm s-1 [Hanson
and Lindberg 1991] other observations indicate NO emission from various species
though soil emissions could confound these results [Wildt et al 1997] This is quite
close to the ~025 cm s-1 NO deposition velocity at Harvard Forest (-V0_NO) but we
cannot resolve the debate as to whether NO deposits at all [Wesely and Hicks 2000]
Concentration and flux measurements of HONO N2O5 and NO3 (along with NO
and NO2) are required to better understand the nighttime chemistry and deposition of
NOx Recently-developed continuous analyzers for HONO [Harrison et al 1996] and N-
2O5 and NO3 [Brown et al 2001] may make these measurements possible in the coming
years In addition the use of flux chambers with a TDLAS or other instrument (sub-
nmol mol-1 sensitivity and species-specific detection method) on leaf litter and soil
samples in the lab and field may facilitate direct detection of NO2 compensation points
for various species and quantify the importance of different natural surfaces
99
NOx deposition matters to both the ecosystem and the atmosphere the form of
nitrogen entering plants affects nutrient loading acid stress and toxicity and the form of
nitrogen leaving the atmosphere affects O3 production HOx chemistry and long-range
transport of anthropogenic pollutants We are hopeful that future research endeavors will
approach the problem from the perspective of both ecosystem and atmosphere at scales
ranging from the individual leaf to the vegetated landscape using reliable species-
specific and sensitive measurement techniques
References
Andreacutes-Hernaacutendez J Notholt J Hjorth and O Schrems A DOAS study on the origin of initrous acid at urban and non-urban sites Atmos Environ 30 175-180 1996
Aneja V P P A Roelle G C Murray J Southerland J W Erisman D Fowler W A H Asman and N Patni Atmospheric nitrogen compounds II emissions transport transformation deposition and assessment Atmos Environ 35 1903-1911 2001
Barford C E Hammond Pyle L Hutyra S Wofsy Ecological Measurements to compliment eddy-flux measurements at Harvard Forest [Online data archive] httpwww-asharvardedudatanigec-datahtml 2001
Barnet W S and B J Finlayson-Pitts Enhancement of N2O4 on porous glass at room temperature A key intermediate in the heterogeneous hydrolysis of NO2 J Phys Chem A 104 171-175 2000
Barney W S and B J Finlayson-Pitts Enhancement of N2O4 on Porous Glass at Room Temperature A Key Intermediate in the Heterogeneous Hydrolysis of NO2 J Phys Chem A 104 171-175 2000
Bey I D J Jacob R Yantosca J logan B Field A Fiore Q Li H Liu L Mickley M Schultz Global modeling of tropospheric chemistry with assimilated meteorology Model description and evaluation in press J Geophys Res 2001
Brown S H Stark S J Ciciora and A R Ravishankara In-situ measurement of atmospheric NO3 and N2O5 via cavity ring-down spectroscopy Geophys Res Lett 28 3237-3230 2001 (a)
100
Brown S H Stark S J Ciciora and A R Ravishankara In-situ Detection of Atmospheric NO3 and N2O5 via Cavity Ring-Down Spectroscopy EOS Trans AGU 82 Fall Meeting Suppl A41B-0045 2001 (b)
Coe H and M W Gallagher Measurements of dry deposition of NO2 to a Dutch heathland using the eddy-correlation technique Q J R Meteorol Soc118 767-786 1992
Delaney A C D R Fitzjarrald D H Lenschow R Pearson Jr G J Wendel B Woodruff Direct Measurements of Nitrogen Oxides and Ozone Fluxes over Grassland J Atmos Chem 4 429-444 1986
Eugster W and R Hesterberg Transfer resistances of NO2 determined from eddy correlation flux measurements over a litter meadow at a rural site on the Swiss plateau Atmos Environ 30 1247-1254 1996
Fitzjarrald D R and D H Lenschow Mean concentration and flux profiles for chemically reactive species in the atmospheric surface layer Atmos Environ 17 2505-2512 1983
Galmarini S P G Duynkerke J Vila-Guerau De Arellano Evolution of Nitrogen Oxide Chemistry in the Nocturnal Boundary Layer J Appl Meteorology 36 943-957 1997
Gao W M L Wesely P V Doskey Numerical Modeling of the Turbulent Diffusion and Chemistry of NOx O3 Isoprene and Other Reactive Trace Gases in and Above a Forest Canopy J Geophys Res 98 18339-18353 1993
Gao W and M L Wesely Numerical Modeling of the Turbulent Fluxes of Chemically Reactive Trace Gases in the Atmospheric Boundary Layer J Appl Meteorology 33 835-847 1994
Goodman A L G M Underwood and V H Grassian Heterogeneous Reaction of NO2 Characterization of Gas-Phase and Adsorbed Products from the Reaction 2NO2(g) + H2O(a) HONO(g) + HNO3(a) on Hydrated Silica Particles J Phys Chem A 103 7217-7223 1999
Goulden ML JW Munger S-M Fan B C Daube and S C Wofsy Measurements of carbon sequestration by long-term eddy covariance Methods and a critical evaluation of accuracy Global Change Biology 2 169-182 1996
Harrison R M A-M N Kitto Evidence for a surface source of atmospheric nitrous acid Atmos Environ 28 1089-1094 1994
Harrison R M J D Peak G M Collins Tropospheric cycle of nitrous acid J Geophys Res 101 14429-14439 1996
101
Heal M R B B B Booth J N Cape K J Hargreaves The influence of simplified peroxy radical chemistry on the interpretation of NO2-NO-O3 surface exchange Atmos Environ 35 1687-1696 2001
Horii C V M S Zahniser D D Nelson J B McManus S C Wofsy Nitric Acid and Nitrogen Dioxide Flux Measurements a New Application of Tunable Diode Laser Absorption Spectroscopy Proc of SPIE 3758 152-161 1999
Hosker R P Jr and S E Lindberg Review Atmospheric deposition and plant assimilation of gases and particles Atmos Environ 16 889-910 1982
Hanson P and S E Lindberg Dry deposition of reactive nitrogen compounds a review of leaf canopy and non-foliar measurements Atmos Environ 25A 1615-1634 1991
Jacob D J Heterogeneous chemistry and tropospheric ozone Atmos Environ 34 2131-2159 2000
Joss U and W K Graber Profiles and Simulated Exchange of H2O O3 NO2 Between the Atmosphere and the HartX Scots Pine Plantation Theor Appl Climatol 53 157-172 1996
Lefer B L and R W Talbot Nitric acid and ammonia at a rural northeaster US site J Geophys Res 104 1645-1661 1999
Lerdau M T J W Munger D J Jacob The NO2 Flux Conumdrum Science289 2291-2293 2000
Moody J L J W Munger A H Goldstein D J Jacob and S C Wofsy Harvard Forest regional-scale air mass composition by Patterns in Atmospheric Transport History (PATH) J Geophys Res 103 13181-13194 1998
Munger J W S C Wofsy P S Bakwin S-M Fan M L Goulden B C Daube and A H Goldstein Atmospheric deposition of reactive nitrogen oxides and ozone in a temperate deciduous forest and a subarctic woodland 1 Measurements and mechanisms J Geophys Res 101 12639-12657 1996
Munger J W S-M Fan P S Bakwin M L Goulden A H Goldstein A S Colman and S C Wofsy Regional budgets for nitrogen oxides from continental sources Variations of rates for oxidation and deposition with season and distance from source regions J Geophys Res 103 8355-8368 1998
Notholt J J Hjorth and F Raes Formation of HNO2 on aerosol surfaces during foggy periods in the presence of NO and NO2 Atmos Environ 26A 211-217 1992
Padro J Zhang L and W J Massman An analysis of measurements and modlling of air-surface exchange of NO-NO2-O3 over grass Atmos Environ 32 1365-1375 1998
102
103
Rondon A C Johansson L Granat Dry Deposition of Nitrogen Dioxide and Ozone to Coniferous Forests J Geophys Res 98 5159-5172 1993
Rothman LS et al The HITRAN molecular spectroscopic database and HAWKS (HITRAN Atmospheric Workstation) 1996 Edition J Quant Spectrosc Radiat Transfer 60 665-710 1998
Sparks J P R K Monson K L Sparks M Lerdau Leaf uptake of nitrogen dioxide (NO2) in a tropical wet forest implications for tropospheric chemistry Oecologia 127 214-221 2001
Stocker D W D H Stedman K F Zeller W J Massman D G Fox Fluxes of Nitrogen Oxides and Ozone Measured by Eddy Correlation Over a Shortgrass Prairie J Geophys Res 98 12619-12630 1993
Walton S M W Gallagher T W Choularton J Duyzer Ozone and NO2 Exchange to Fruit Orchards Atmos Environ 31 2767-2776 1997
Wesely M L J A Eastman D H Stedman E D Yalvac An eddy-correlation measurement of NO2 flux to vegetation and comparison to O3 flux Atmos Environ 16 815-820 1982
Wesely M L Parameterization of surface resistances to gaseous dry deposition in regional-scale numerical models Atmos Environ 23 1293-1304 1989
Wesley M L and B B Hicks A review of the current status of knowledge on dry deposition Atmos Environ 34 2261-2282 2000
Wildt J D Kley A Rockel P Rockel H J Schneider Emission of NO from several higher plant species J Geophys Res 102 5919-5927 1997
- April ndash November 2000
- G (nmol mol-1)
- 29 August ndash 8 Oct 2000
- References
- Chapter3_NOx_Part2pdf
-
- 34 Discussion
-
- Chapter3_NOx_Part1pdf
-
- 32 Methods
- 33 Results
-
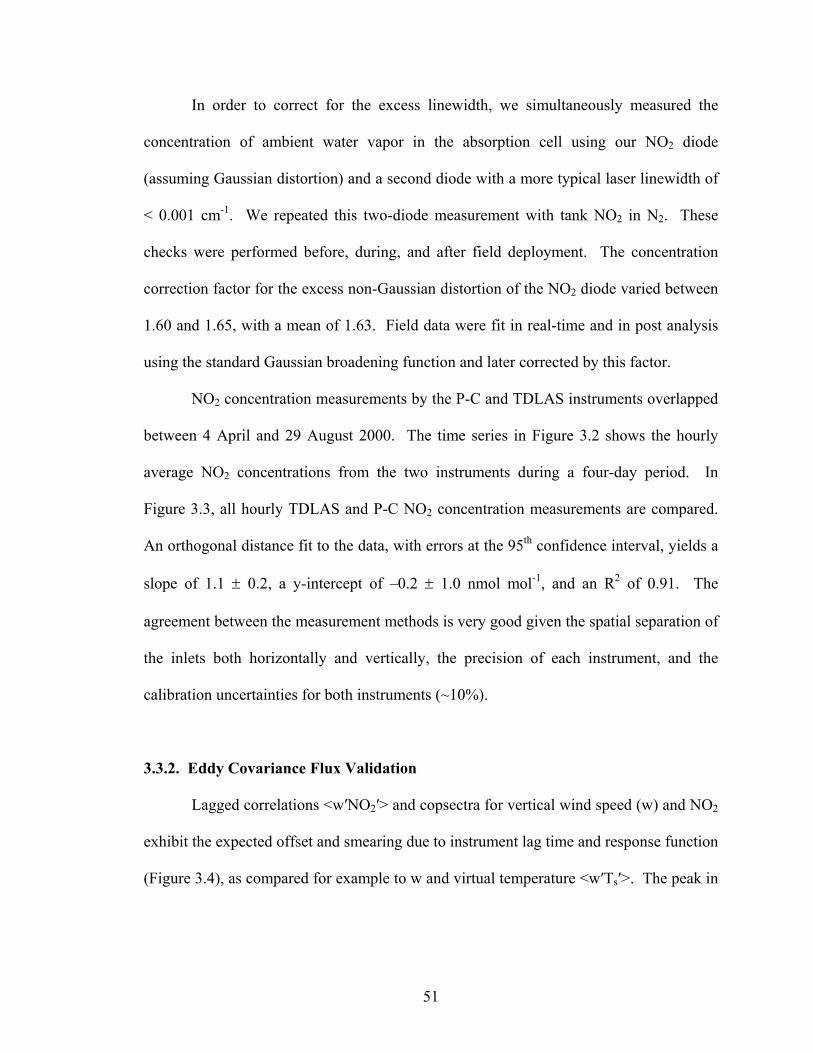

0 10 20 30
010
2030
11
TDLA
S [N
O2]
(nm
ol m
ol-1
)
Photolysis-Chemiluminescence [NO2] (nmol mol-1)
Hourly NO2 Comparison days 95-232 2000
0 10 20 30
010
2030
11
TDLA
S [N
O2]
(nm
ol m
ol-1
)
Photolysis-Chemiluminescence [NO2] (nmol mol-1)
Hourly NO2 Comparison days 95-232 2000
Figure 33 Hourly NO2 concentrations obtained by the TDLAS and the photolysis-
chemiluminescence detector at Harvard Forest The two instruments operated from
separate towers roughly 200 m apart at 22 m (TDLAS) and 29 m (P-C) sampling heights
Orthogonal distance fit with errors at the 95th confidence interval (y=a+bx)
a = -02 plusmn 10 b = 11 plusmn 02 R2 = 091
53
r(wt)
00
01
02
03
04
05
00
01
02
03
04
05 Raw W
Smeared W
Daytime Lagged Correlations Sept-Oct 2000
Delay Time (s)
r(wn
o2)
-60 -40 -20 0 20 40 60
-00
10
010
03-0
01
001
003
Nor
mal
ized
Cos
pect
ra
-02
00
02
04
06
08
10
-02
00
02
04
06
08
10 wT
wu
Daytime Cospectra Sept-Oct 2000
Freq (Hz)
0005 0050 0500
-02
00
02
04
06
08
10
-02
00
02
04
06
08
10 wNO2
wT smear 1wT smear 2wT smear 3
Figure 34 Average daytime lagged correlations and cospectra for (wT) and (wNO2)
r(wNO2) is lagged compared to r(wT) due to transit time in the inlet and the peak is
rounded due to an exponential instrument response function with time constant 1 second
The cospectrum of w with NO2 confirms that the response function is as expected when
compared with cospectra of w with T smeared by 1 s 2 s and 3 s exponentials
54
the lagged correlation r(wprime NO2prime) is shifted several seconds due to transit time through
the inlet to the TDLAS measurement cell The peak of r(wprimeNO2prime) is also rounded
compared to the sharp peak of r(wprimeTprime) because the instrument has a 1-second exponential
time response curve for NO2 (see Chapter 2) In order to correct for the instrument
response function the 8 Hz virtual temperature and w data were smeared with a 1-second
exponential and used to compute a heat flux for each 30-minute flux interval The ratio
of smeared heat flux to unaltered heat flux provided an estimate of the missing high-
frequency flux removed by the instrument response function [Goulden et al 1996
Munger et al 1996 1998] The corrections were typically 20 or smaller The
normalized cospectra in Figure 34 show that the NO2 flux begins to decline at
frequencies above 01 Hz unlike the heat flux which retains spectral information beyond
05 Hz The heat flux cospectrum computed with the 1-second smeared temperature data
has a shape similar to that of the NO2 cospectrum
333 Hourly Data
Hourly concentrations and fluxes of NO NO2 O3 and supporting trace gas and
meteorological measurements were recorded on a 24-hour basis at Harvard Forest during
the spring summer and fall of 2000 Eddy covariance NO2 fluxes span April through
November and eddy covariance NO fluxes were measured from late August to early
October All instruments experienced data dropouts ranging in length from hours to days
55
in length at various times during the measurement period due to equipment and computer
failures power outages software problems and routine maintenance
A typical Harvard Forest NOx and O3 time series is shown in Figure 35
Photochemical production of NO is apparent during the day as is conversion to NO2 at
night O3 concentrations and fluxes at the site plotted on the right-hand axes are
typically an order of magnitude greater than those of NOx Coupled fluxes of NO2
(upward) and NO (downward) arise during the day from photochemical cycling and
turbulent transport in the presence of the light gradient imposed by the forest canopy
Higher irradiance above the canopy favors production of NO (NO2+hν NO+O) lower
light below favors conversion back to NO2 (NO+ O3 NO2+ O2) Although the daytime
fluxes of NO2 appear to be greater in magnitude than the corresponding NO fluxes the
imbalance is mostly due to the difference in measurement height of NO (29 m) and NO2
(22 m) as we examine further in the next section Median diel cycles for NO NO2 and
O3 for the entire measurement period April-November 2000 segregated by wind sector
are shown in Figure 36
56
4
3
2
1
0
[NO
] [N
O2]
(nm
ol m
ol-1
)
287286285284283282281Day of Year 2000
8
4
0
-4
FNO
FN
O2 (
micromol
m-2
hr-1
)
-100-50050100
FO3 (microm
ol m-2 hr -1)
50403020100
[O3 ] (nm
ol mol -1)
O3 NO2 NO
Figure 35 Time series of hourly NO (solid lines left axes) NO2 (dashed lines left axes)
and O3 (solid lines right axes) concentrations (upper panels) and fluxes (lower panels)
Oct 7-12 2000 NO2 measurements were taken at a sampling height of 22 m NO and O3
at 29 m on a nearby tower
57
02
46
80
24
68
NW
Hour
0 6 12 18
-4-2
02
4
02
46
80
24
68
SW
Hour
0 6 12 18
-4-2
02
4
[NO][NO2][O3]10
FNOFNO2FO310
Flux
(microm
ol m
-2hr
-1)
Con
cent
ratio
n (n
mol
mol
-1)
Figure 36 Diel cycles of median concentrations (upper panels) and fluxes (lower
panels) for the Northwest (2700-450 left panels) and Southwest (1800-2700 right panels)
wind sectors at Harvard Forest April-November 2000 for NO NO2 and O310 NO and
O3 were sampled at a height of 29 m and NO2 at 22 m Vertical bars indicate 25th and
27th quartiles for NO and NO2 measurements NO2 concentration and nighttime
deposition are enhanced under southwesterly conditions as are O3 and the morning NO
maximum
58
34 Discussion
In the following sections we examine relationships of fluxes and concentrations
for various conditions and species The generalized exchange velocity for a species
(fluxconcentration) allows fluxes to be compared in a normalized form In order to
remain consistent with the flux sign convention used herein we define positive exchange
velocity at the sampling height as upward (in the direction of emission) and negative
exchange velocity as downward (in the direction of deposition) regardless of whether the
process represents net emission or deposition to the surface To facilitate the calculation
of exchange velocity in units of cm s-1 we express flux in units of concentration times
velocity (nmol mol-1 cm s-1) which is also the actual quantity measured by the
instrumentation The conversion to SI flux units is 1 nmol mol-1 cm s-1 = 1606 micromol m-2
hr-1 (STP) Temperature and pressure corrections to this conversion have been taken into
account in the following analyses
341 Nighttime Deposition of NO2
At night NO concentration and flux fall to near zero photochemical cycling
ceases and the NO2 flux should capture total NOx exchange The observed nighttime
NO2 flux was generally small Figure 37 shows that nighttime NO2 flux depends
quadratically on [NO2] A polynomial regression of the form FNO2 = F0 + V0 [NO2] + a
[NO2]2 gives the results in Table 31
The quadratic dependence in the regression is largely driven by the two nights
during the sampling period when the median concentration of NO2 was above 10 nmol
mol-1 excluding these nights the parameter a is not statistically significant
59
0 5 10 15 20 25 30
-20
-15
-10
-50
5 Hourly Data (fitted)Nightly Medians +
[NO2] (nmol mol-1)
NO
2Fl
ux (n
mol
mol
-1cm
s-1
)FNO2(night) = F0 + V0 [NO2] + a [NO2]2
F0 = 0V0 = -008 plusmn 003 (cm s-1)a = -0013 plusmn 0001 (nmol-1 mol cm s-1)
R2 = 063
Figure 37 Nighttime hourly (dots) and median nightly (pluses) NO2 flux vs
concentration with results of least-squares fit on the hourly data (curve) The flux is
expressed in units of concentration times velocity (nmol mol-1 cm s-1) in order to simplify
the interpretation of the coefficients in the least-squares fit Pressure and temperature
corrections have been taken into account in the conversion from density to mixing ratio
60
Table 31 Polynomial regression results for nighttime FNO2 = F0 + V0 [NO2] + a [NO2]2
F0 plusmn std error (nmol mol-1 cm s-1)
V0 plusmn std error (cm s-1)
a plusmn std error (nmol-1 mol cm s-1) R2
-02 plusmn 01 (p-value=007)
-001 plusmn 005 (p-value=08)
-0015 plusmn 0002 (p-valuelt1E-4) 060
All Hourly Data
Constrained to 0 -008 plusmn 003
(p-value=001)
-0013 plusmn 0001 (p-valueltlt1E-4) 060
-02 plusmn 01 (p-value=01)
-002 plusmn 01
(p-value=09)
-0014 plusmn 0002 (p-value=03) 003
[NO2]le10 nmol mol-1
Constrained to 0 -016 plusmn 006
(p-value=0005)
-0002 plusmn 001 (p-value=09) 003
-02 plusmn 02 (p-value=03)
-002 plusmn 006
(p-value=07)
-0015 plusmn 0002 (p-valuelt1E-4) 063
[NO2] ge1 nmol mol-1
Constrained to 0 -007 plusmn 003 (p-value=0003)
-0013 plusmn 0002 (p-valuelt1E-4) 052
61
A statistically significant non-zero F0 term cannot be interpreted as a physically
meaningful result NO2 cannot deposit if its concentration is zero The polynomial
regression does not take into account potential uncertainty in [NO2] which could
introduce a bias at low values where the uncertainty in the measurement is larger than the
absolute value By excluding [NO2] lt 1 nmol mol-1 from the regression we obtain an F0
which is not significantly different from zero It is therefore useful to constrain F0 to
zero V0 is frequently indistinguishable from zero If the quadratic dependence is in fact
valid over the full range of NO2 concentrations this result implies that the nighttime
deposition velocity of NO2 increases from approximately 02 cm s-1 at [NO2]=1 nmol
mol-1 to 05 cm s-1 at [NO2]=30 nmol mol-1 The data do not support the existence of a
compensation point for NO2 at night on average NO2 continues to deposit to not emit
from the forest even at low concentrations Note that soil emission fluxes of NO are
very low at Harvard Forest less than 09 micromol m-2 hr-1 [Munger et al 1996] so the
effects of freshly emitted NO conversion to NO2 are insignificant
The downward NO2 flux measured above the forest canopy at night may arise
from direct NO2 deposition to leaves litter bark and soil but not via leaf stomata
because they are largely closed in the absence of sunlight Eugster and Hesterberg [1996]
found that NO2 deposition to a litter meadow at night encountered less resistance than O3
deposition to the same surfaces Other studies have also found significant deposition
velocities for NO2 to soil litter and bark [Hanson et al 1991 and references therein]
Non-stomatal NO2 deposition could proceed via formation and heterogeneous
hydrolysis of N2O5 on forest surfaces below the sensor height as in (R37) ndash (R39) with
formation of NO3 (R37) the rate limiting step [Jacob 2000]
62
NO2 + O3 NO3 + O2 (R37)
NO3 + NO2 + M N2O5 + M (R38)
N2O5 + H2O 2HNO3 (R39)
Since HNO3 deposits rapidly it is unlikely that much (if any) of the HNO3 produced
heterogeneously from N2O5 hydrolysis would escape from the forest in the gas phase
Recent field observations of N2O5 and NO3 at night have shown that concentrations of
N2O5 build up over the course of the night that the NO3 to N2O5 ratio closely follows the
theoretical temperature-dependent equilibrium and that accumulated N2O5 is photolyzed
at dawn to recycle NO2 [Brown et al 2001 a and b] Thus only a portion of any NO2
flux due to (R37) ndash (R39) corresponds to net loss of NOx from the atmosphere
We can estimate the maximum downward NO2 flux due to N2O5 hydrolysis by
assuming a negligible vertical NO2 concentration gradient below the sensor 100
conversion of NO3 to N2O5 and 100 hydrolysis of N2O5 below the sensor height
H=22 m These upper limits are compared to the measured fluxes in Figure 38 for
nightly median NO2 concentrations less than 10 nmol mol-1 (Eq 31)
Max FNO2 (N2O5 hydrolysis) = 2middotHmiddotP(NO3) = 2 Hmiddotk7[NO2][O3] (Eq 31)
The maximum NO2 deposition attributable to N2O5 hydrolysis depends linearly on
[NO2] a linear regression of the computed flux against concentration yields a deposition
velocity of 0048plusmn0008 cm s-1 (p-value lt 1E-4) R2 = 05 a factor of 4-10 lower than the
observed deposition velocities Noisy data prevent definitive identification of the shape
of the observed dependence at concentrations below 10 nmol mol-1 but we infer that the
N2O5 hydrolysis estimate underpredicts the observed NO2 deposition flux At higher
NO2 concentrations the N2O5 hydrolysis estimate vastly underpredicts observed NO2
63
[NO2] (nmol mol-1)
NO
2Fl
ux (n
mol
mol
-1cm
s-1
)
Max N2O5 hydrolysisNightly Medians +
0 2 4 6 8 10
-2-1
01
Figure 38 Nightly median NO2 flux vs concentration for concentrations below 10 nmol
mol-1 (pluses) The maximum contribution to NO2 deposition by N2O5 hydrolysis on
forest surfaces (boxes) was estimated by calculating the production rate of NO3 from NO
+ O3 (the vertical NO2 concentration gradient is negligible) 100 conversion of NO3 to
N2O5 and 100 N2O5 hydrolysis on forest surfaces below 22 m The linear regression of
maximum NO2 deposition due to N2O5 hydrolysis vs [NO2] indicates an upper limit
deposition velocity of 0048plusmn0008 cm s-1 due to this process (R2 = 05 p-valuelt1E-4)
64
deposition (not shown) Although N2O5 hydrolysis very likely occurs on forest surfaces
it appears to account for a small fraction (lt30) of the observed nighttime NO2
deposition
The quadratic dependence of nighttime NO2 flux on concentration could also arise
from heterogeneous hydrolysis of NO2 and production of HONO below sensor height
Observations at urban and rural sites have shown that NOx can be converted to HONO on
aerosols [Notholt et al 1992 Andreacutes-Hernaacutendez et al 1996] Although NO2 is known
to react on hydrated surfaces the mechanism and kinetics of the process are not fully
understood It appears that the most likely heterogeneous NO2 hydrolysis reaction is
(R310) [Goodman et al 1999]
2NO2(g)+ H2O(a) HONO(g) + HNO3(a) (R310)
Laboratory studies have shown first-order kinetics in NO2 for (R310) at parts-per-million
(micromol mol-1) concentrations with NO2 adsorption as the rate-limiting step but the low-
concentration kinetics are unknown The atmospheric mechanism may involve N2O4 as a
key intermediate on the surface [Barney and Finlayson-Pitts 2000] As in the N2O5
hydrolysis mechanism the aqueous-phase HNO3 produced in (R310) is not likely to be
released to the gas phase Harrison et al [1994 1996] observed upward HONO fluxes
over vegetated surfaces at NO2 concentrations above 10 ppb along with a quadratic
dependence of [HONO] on [NO2] If the observed NO2 flux at Harvard Forest is the
result of (R310) then approximately half might be released as gas-phase HONO and
would not contribute to net loss of NOx from the atmosphere The amount of
heterogeneous nighttime HONO formation at the surface is important to daytime HOx
65
chemistry because at sunrise HONO is photolyzed to deliver a burst of OH and NO to
the surface layer
The evidence for direct NO2 deposition to soil litter and bark rests on only a few
studies under ambient conditions where surfaces were likely to be hydrated and none of
which had simultaneous gas-phase HONO measurements [Eugster and Hesterberg 1996
Hanson et al 1991] Thus it is possible that a portion of reported NO2 deposition to
various surfaces proceeds via NO2 hydrolysis in which case half of the deposited NO2
would remain on the surface as HNO3 and half might re-emerge as gas-phase HONO
Nighttime N2O5 hydrolysis leads to aqueous-phase HNO3 production so that this process
is also likely to contribute to some net atmospheric NOx loss Clearly individual
measurements of HONO N2O5 and NO3 concentrations and fluxes are crucial to
unraveling the nighttime NOx budget and its impact on tropospheric HOx and O3
chemistry At Harvard Forest it appears likely that heterogeneous N2O5 and NO2
hydrolysis both contribute to the observed nighttime NO2 flux though we cannot rule
out additional processes
Nighttime concentrations and fluxes of NO2 and NOy (Figure 39) show that the
measured NO2 flux accounts for between zero and 24 of total NOy deposition with a
notable dependence on wind direction The NOy sensor detects NOx HNO3 HONO
PANs and additional species If a portion of the downward NO2 flux is balanced by an
upward HONO flux then additional NOy flux is unattributed For the northwest wind
sector where the flux budget appears to be closed within the noise of the measurements
the fractional impact on the flux budget would be larger than for southwesterly conditions
where unmeasured species account for much of the NOy deposition
66
02
46
810
12
SW
Hour
19 20 21 22 23 0 1 2 3 4
-15
-10
-50
NOyNO2+HNO3NO2
FNO2FNO2+FHNO3FNOy
Flux
(microm
ol m
-2hr
-1)
Con
cent
ratio
n (n
mol
mol
-1)
02
46
810
12
NW
Hour
19 20 21 22 23 0 1 2 3 4
-15
-10
-50
Figure 39 Nighttime medians for the northwest (left) and southwest (right) wind
sectors April-November 2000 Upper panels Concentrations of NO2 NO2+HNO3 and
NOy (with vertical bars spanning 25th and 75th quartiles) Lower panels Fluxes of NO2
NO2+HNO3 and NOy (with 25th and 75th quartiles) For northwesterly conditions NO2
accounts for 48 to 65 of nighttime NOy concentration and 0 to 24 of NOy flux For
southwesterly conditions NO2 accounts for 35 to 58 of nighttime NOy concentration
and 0 to 13 of nighttime NOy flux
67
Most atmospheric models base their NO2 deposition parameterizations on the
modified Wesely [1989] scheme in which the surface resistance for NO2 prohibits
transfer except to lush vegetation exposed to sunlight where leaf stomata are open [eg
Bey et al 2001] Thus NO2 deposition velocity in these models falls to near zero at night
over vegetation regardless of the concentration of NO2 We observed nighttime NO2
deposition to the forest dependent on concentration and we infer that the behavior of
models departs significantly from the observed processes
Figure 310 compares observed nighttime NO2 deposition velocity to 24-hour
NO2 deposition from the Harvard GEOS-CHEM model on a monthly basis for Harvard
Forest [A Fiore personal communication] The nighttime NO2 deposition velocity of the
data is approximately half the modelrsquos 24-hour mean during the months when the canopy
is fully developed Since we believe that NO2 also deposits during the day (see below)
the modelrsquos 24-hour average deposition flux in summer may be approximately correct
although the day-night variation and dependence on NO2 concentration are incorrect
The model has no deposition when trees are bare but our data clearly indicate that
deposition continues at these times This discrepancy suggests a potentially large
underestimate of NOx deposition to forested landscapes during dormant months
342 Daytime Fluxes of NO NO2 O3 and NOy
During the day (R31) ndash (R34) establish a dynamic balance between NO NO2
and O3 while deposition of NO2 and O3 onto the forest canopy and sub-canopy
68
05
04
03
02
01
00
NO
2 Dep
ositi
on V
eloc
ity (c
m s
-1)
1110987654321
Month
GEOS-CHEM Harvard Forest Inland Box24-Hour Monthly Means 1995 1997 OBSERVED Harvard Forest TDLASNighttime Monthly Median 2000
Figure 310 Comparison of 24-hour monthly mean NO2 deposition in the GEOS-CHEM
model Harvard Forest box 1995 and 1997 to the observed nighttime monthly median
NO2 deposition measured at Harvard Forest in 2000 Unlike the observations the modelrsquos
nighttime deposition velocity of NO2 drops to near zero and contributes insignificantly to
total NOx deposition
69
surfaces continues The light gradient through the canopy (see Figure 311) drives (R32)
at a faster rate above than below shifting the balance of NOx toward NO above and NO2
below the canopy height (~20 m at this site) Theoretical studies have predicted that this
photochemical effect should produce coupled upward fluxes of NO2 and downward
fluxes of NO above the forest canopy [eg Gao et al 1993] These studies have
employed large suites of chemical reactions soil NO emissions canopy isoprene
emissions and leaf-level resistance models for NO2 HNO3 O3 and H2O2 deposition
We show below that a simpler approach captures much of the observed behavior of NOx
fluxes at Harvard Forest
Dominant features of the observed daytime NO and NO2 fluxes shown in Figures
35 and 36 are their opposite signs dependence on light and apparent imbalance
Upward NO2 flux at midday is reproducibly several times larger than downward NO flux
A simple model of canopy photochemical NOx cycling reveals that this apparent
imbalance is expected based on the difference in the height of the sampling inlets for the
two gases above the canopy For a trace gas species X continuity requires that a change
in concentration d[X]dt be due to the sum of chemical production PX chemical loss ndashLX
and flux - Φ
d[X]dt = Px ndash Lx ndash Φ (Eq 32)
For NOx photochemical cycling (R31)-(R33) we simplify Eq 32 by assuming steady
state d[X]dt = 0 ignoring horizontal transport and approximating the vertical flux as Φz
= ndashKc(z) d[X(z)]dz where Kc is a vertical exchange coefficient (ldquoeddy diffusivityrdquo) We
write the production and loss terms as
131
][]][[2 τ
NONOOkLP NONO === (Eq 33)
70
25
20
15
10
5
0
heig
ht (m
)
302520151050
295-385 nm Total UV (W m-2)
Harvard Forest 04 Oct 2001Local Noon Clear Sky
EMS Profile UV TDLAS Point UV
Figure 311 Midday profile of total UV radiation at Harvard Forest At each height the
Eppley total UV radiometer was placed horizontally facing upward to measure total
(direct plus diffuse) downwelling radiation and then facing downward to measure total
upwelling radiation The points indicate the sum of total downwelling and total
upwelling UV radiation Horizontal bars show observed variability in total downwelling
+ upwelling UV irradiance at each height within approximately one meter of the
measurement tower
71
2
2222
][][
τNO
NOjPL NONO === (Eq 34)
We scaled Kc(z) from Gao et al [1993] to the height of the Harvard Forest
canopy 20 m and approximated the effect of the light gradient from Figure 311 on the
lifetime of NO2 τ2(z) as shown in Figure 312 based on measurements made manually
with an Eppley UV photometer We estimated τ1asymp70s based on median k1(T) and [O3]
for the site the vertical gradient for O3 is small between 20 and 30 m making the
constant lifetime a reasonable approximation We then solved Eq 32 for NO and NO2 to
derive a simple model of vertical transport and photochemical cycling of NOx shown in
Figure 313
This calculation clarifies the cause of the imbalance between daytime NO and
NO2 fluxes observed in the time series and diel cycles in Figures 34 and 35 Because
the concentrations and fluxes of the two species were measured at separate heights 22 m
for NO2 and 29 m for NO they sampled different points along the concentration and flux
gradients induced by reduced light conditions below the canopy The larger observed
upward NO2 flux is expected based solely on photochemical cycling at a sampling point
closer to the canopy than that of NO
In addition to NO and NO2 fluxes corresponding to photochemical cycling
between the two NO2 is likely to interact with the vegetation via stomata during daylight
hours Canopy surface conductance gc is readily calculated using the Penman-Monteith
equation [Shuttleworth et al 1984] and the measured water vapor flux at Harvard Forest
Deposition velocities for species known to deposit through stomata (ie O3) correlate
strongly with gc [Munger et al 1996] As shown in Figure 314 daytime gc and the O3
72
01 05 50 500
020
4060
8010
0
0 1000 2000 30000 1000 2000 3000
020
4060
8010
0
Eddy Diffusivity K (m2 s-1) τ2 (s)
heig
ht (m
)
01 05 50 500
020
4060
8010
0
0 1000 2000 30000 1000 2000 3000
020
4060
8010
0
Eddy Diffusivity K (m2 s-1) τ2 (s)
heig
ht (m
)
Figure 312 Simple NOx photochemical canopy model inputs Eddy diffusivities are
scaled from Gao et al [1993] to the Harvard Forest canopy height of 20 m τ2 the
lifetime of NO2 against photolysis (reaction 2 NO2 + hν NO + O) scales inversely
with UV radiation τ2 was estimated for typical conditions of [O3] [NO][NO2] and
daytime UV profile under full-canopy conditions at the site The simple canopy model
also accepts an estimate of τ1 the lifetime of NO against reaction with O3 (reaction 31)
73
Concentration (nmol mol-1)
heig
ht (m
)
00 02 04 06 08 10
020
4060
8010
0
NO NO2
Normalized NOx = NO+NO2 = 1 nmol mol-1
Flux (nmol mol-1 cm s-1)
-2 -1 0 1 2-2 -1 0 1 2
020
4060
8010
0
NO NO2
Figure 313 Simple NOx photochemical canopy model outputs Left panel
concentrations of NO (dashed) and NO2 (solid) right fluxes of NO (dashed) and NO2
(solid) Symbols indicate measurement heights for NO (29 m) and NO2 (22 m) at
Harvard Forest The model solves the continuity equation for NO concentration at 200
levels ddz(-Kc(dNOdz)) = PNO ndash LNO where PNO = [NO]τ1 LNO = [NO]τ2 and zero
net deposition or emission of NOx is allowed NOx = NO + NO2 is normalized to 1 ppb
τ1 = 70s in this example Due to the measurement height difference observed upward
NO2 flux due to photochemical cycling alone should be substantially larger than observed
downward NO flux attributable to the same process
74
V(O
3) (c
m s
-1)
g c(c
m s
-1)
PPFD (mmol m-2 s-1)
00 05 10 15
-05
00
05
10
15
20
00 05 10 15
-3-2
-10
12
Figure 314 Daytime (including dawn and dusk) canopy surface conductance gc and O3
exchange velocity V(O3) vs above-canopy photosynthetic photon flux density (PPFD)
during the summer of 2000 at Harvard Forest Dots are hourly values Filled squares
represent quantile-binned means (quantiles of PPFD were used to define bins and all gc
or V(O3) for data hours falling within the bins were averaged) Both quantities are
indicators of stomatal conductance and increase in absolute value with PPFD up to a
maximum level
75
exchange velocity are both related to photosynthetic photon flux density (PPFD) The
dependence is nonlinear absolute values of gc and V(O3) increase with PPFD up to
approximately 1 mmol m-2 s-1 and level off at higher PPFD values Note that PPFD is the
only continuously-monitored measure of light intensity at Harvard Forest (as with many
ecological and trace-gas monitoring stations) and is therefore used in the discussion
below as a proxy of photochemically-active UV wavelengths at the site despite the fact
that PPFD measures only the photosynthetically-active wavelength band (400-700 nm)
For the time period when eddy covariance fluxes of both NO and NO2 were
measured (29 August-8 October 2000) Figure 315 shows that the daytime (as defined by
light level PPFD gt 001 mmol m-2 s-1) upward NO2 flux was strongly correlated with the
downward NO flux We can account for more of the variance in daytime FNO2 by using
in addition to a photochemical NOx cycling term βmiddotFNO additional terms representing a
constant deposition velocity V0middot [NO2] and a stomatal flux γmiddotgc (Table 32)
FNO2 = F0 + βmiddotFNO + V0middot [NO2] + γmiddotgc (Eq 35)
The relationship between FNO2 and FNO is significant in all of the fits as shown by the
low p-values and consistent values of β Note that an upward NO2 flux contribution
could be included as either a constant (zero order) flux term F0 or as a function of
stomatal conductance γ when F0 is constrained to zero For the F0=0 cases R2 has been
calculated as follows in order to omit the origin
)var()var(1
2
2
FNOresidualR minus= (Eq 36)
The constant deposition velocity term V0 is significant when the stomatal term is also
included in the fit A flux term dependent on the square of the NO2 concentration
a[NO2]2 (not shown in Table 32) is only marginally significant regardless of which other
terms are included in the regression
76
NO
2Fl
ux (micro
mol
m-2
hr-1
)
- NO Flux (micromol m-2 hr-1)
0 2 4 6 8 10 12
-10
010
2030
40
Figure 315 Relationship between daytime hourly FNO2 and ndashFNO 29 August to 8
October 2000 FNO2 = (05plusmn01) - (35plusmn01)middotFNO R2 = 079
77
Table 32 Regressions of daytime FNO2 (as defined by light level see above covered
hours 500 to 2000 EST) in terms of linear combinations of βmiddotFNO V0middot[NO2] and γmiddotgc
F0 is the intercept for each fit representing flux at [NO2] = FNO = gc = 0 Flux units of
(nmol mol-1 cm s-1) are used Note that FNO is largely negative (downward) so that a
negative value of β represents a positive flux term
F0 plusmn std error
(nmol mol-1 cm s-1) β plusmn std error
(dimensionless) V0 plusmn std error
(cm s-1) γ plusmn std error (nmol mol-1) R2
05plusmn01 (p-valuelt1E-4)
-35plusmn01 (p-valuelt1E-4) NA NA 079
constrained to 0 -37plusmn01 (p-valuelt1E-4) NA NA 079
07plusmn02 (p-valuelt1E-4)
-38plusmn02 (p-valuelt1E-4)
-016plusmn008 (p-value=004) NA 084
constrained to 0 -37plusmn02 (p-valuelt1E-4)
003plusmn007 (p-value=07) NA 083
01plusmn03 (p-value=06 )
-35plusmn01 (p-valuelt1E-4) NA 10plusmn04
(p-value=002) 083
constrained to 0 -35plusmn01 (p-valuelt1E-4) NA 12plusmn02
(p-valuelt1E-4) 083
04plusmn03 (p-value=02)
-38plusmn02 (p-valuelt1E-4)
-018plusmn009 (p-value=005)
09plusmn05 (p-value=008) 087
constrained to 0 -38plusmn02 (p-valuelt1E-4)
-012plusmn008 (p-value=01)
13plusmn03 (p-valuelt1E-4) 087
78
The stable statistically significant relationship between the daytime fluxes of NO
and NO2 appears to indicate that although the species were measured on nearby towers at
different heights their photochemical cycling is coherent on an hourly basis This
process clearly dominates the behavior of NOx fluxes near the forest canopy but
represents neither net deposition nor net emission The next largest term appears to be a
constant deposition velocity downward flux of NO2 Finally there is a small positive
NO2 flux component which is equally well-fit as a constant flux or a stomatal
conductance-dependent term We performed additional regressions (not shown) using a
stomatal term of the form γprimemiddotgcmiddot([NO2]-[NO2]c) where [NO2]c is the compensation point
concentration below which vegetation emits NO2 While marginally significant values of
γprime could be obtained for [NO2]c values fixed between 1 and 10 nmol mol-1 the data did
not contain enough information to determine the compensation point independently In
2000 median summerfall daytime [NO2] was 11 nmol mol-1 (75th percentile=23 nmol
mol-1) Thus the vegetation at Harvard Forest usually experiences NO2 concentrations at
or below the 05 to 15 nmol mol-1 range of previously observed compensation points for
coniferous and tropical trees in chamber studies [eg Sparks et al 2001 Rondoacuten et al
1993] It is not possible to definitively attribute the small positive flux (γmiddotgc) to a
stomatal process the term could also indicate a chemical or other process which reduces
the deposition velocity under daytime conditions
To investigate the behavior of the NO2 flux beyond the limited period of NO flux
measurements we use above-canopy PPFD as a proxy for photochemical activity for our
data when NO fluxes were not measured Figure 316 shows daytime exchange
velocities of NO and NO2 plotted against PPFD For clarity hourly points are omitted
79
00 05 10 15
-10
12
34
NO2 (h=22m) leaves onNO2 (h=22m) leaves offNO (h=29m) leaves on
Exch
ange
Vel
ocity
(cm
s-1
)
PPFD (mmol m-2 s-1)
Figure 316 Daytime emission velocities of NO2 (leaves on solid triangles
leaves off open triangles) and NO (leaves on solid circles no data for leaves off
periods) plotted against photosynthetic photon flux density (PPFD) Symbols are
medians binned by percentiles of above-canopy PPFD For clarity hourly points are not
shown V(NO2) data span spring through fall 2000 while V(NO) data were collected late
August to early October 2000 only Linear fits to binned median points (exchange
velocities in units of cm s-1 PPFD in units of mmol m-2 s-1) reported in Table 33
80
and only the PPFD quantile-binned medians are plotted For each species we determine
quantiles of PPFD for daytime hours with data These quantiles define for each trace gas
species the measurement hours whose median values are shown The coupling of the bi-
directional NOx fluxes becomes more intense as the difference in light intensity from
above- to below-canopy increases during periods of high above-canopy illumination
cycling ceases as light intensity and therefore light gradient declines NO2 flux data are
segregated into full-canopy (leaves on) conditions from early June to mid-October and
leafless periods in April-May and October-November Linear regressions to the
percentile-binned medians of PPFD (V = VPPFD=0 + bmiddotPPFD) yield the following
relationships for the daytime data shown in Table 33
Before leaf-out and after leaf-fall the coefficient of PPFD in the NO2 regression
is smaller than for full-canopy conditions This expected since the leaf area index at
Harvard Forest at mid-summer is approximately 34 [Munger et al 1996] whereas the
area index for bare stems and twigs is only 09 [Barford et al 2001] The light gradient
for leaves-off conditions is smaller resulting in smaller concentration gradients and
reduced coupled NOx fluxes It is also likely that NO2 emission by the leaves contributes
to the increased slope of VNO2 vs PPFD when the canopy is developed
NO is not expected to deposit to surfaces in large amounts though there is very
little experimental evidence [Hanson et al 1991 Wesely and Hicks 2000] Soil NO
emission at Harvard Forest is small less than 09 micromol m-2 hr-1 [Munger et al 1996]
making NO unlikely to escape from the canopy before conversion to NO2 Thus the NO
flux at Harvard Forest is dominated by photochemical cycling and can be parameterized
as a function of PPFD and [NO] Coefficients for least squares fits to hourly daytime
FNO data (measurement height = 29m 29 Aug-8 Oct 2000) are shown in Table 34
81
Table 33 Linear regression of daytime percentile-binned median VNO2 and VNO
against of PPFD
VPPFD=0 plusmn std error
cm s-1 b plusmn std error
cm s-1 (mmol m-2 s-1)-1 R2
VNO2 leaves on -04 plusmn 01 (p-value=002)
27 plusmn 02 (p-valuelt1E-4) 097
VNO2 leaves off -01 plusmn 01 (p-value=03)
15 plusmn 02 (p-valuelt1E-4) 090
VNO leaves on -042 plusmn 007 (p-value=4E-4)
-05plusmn01 (p-value=7E-4) 078
82
Table 34 Regressions results for daytime FNO = F0_NO + V0_NO [NO] + bprime PPFD [NO]
F0_NO plusmn std error
(nmol mol-1 cm s-1)
bprime plusmn std error cm s-1 (mmol m-2 s-1)-1
V0_NO plusmn std error (cm s-1) R2
-008plusmn001 (p-valuelt1E-4)
-110plusmn002 (p-valuelt1E-4) NA 091
Constrained to 0
-114plusmn002 (p-valuelt1E-4)
NA 091
-006plusmn001
(p-valuelt1E-4)
-092plusmn004
(p-valuelt1E-4)
-018plusmn004
(p-valuelt1E-4) 091
Constrained to 0
-087plusmn004 (p-valuelt1E-4)
-025plusmn003
(p-valuelt1E-4) 091
83
To treat the larger daytime NO2 flux dataset we combine a terms representing the
light dependence shown in Figure 316 constant deposition velocity and stomatal
conductance Because gc was calculated assuming the presence of leaves we use the
measured deposition velocity of O3 Vd(O3) = -V(O3) as a proxy for the stomatal opening
from early spring through late fall Table 35 shows the results for the regressions using
these terms
A quadratic term amiddot[NO2]2 is not statistically significant when included because
we have few measurements with sufficiently high NO2 concentrations We interpret the
term (b+f)middotPPFDmiddot[NO2] as approximately accounting for the NO2 flux that arises from
photochemical cycling with NO (b+f) agrees well with the coefficients found in Table
33 As in the limited dataset regressions using FNO instead of PPFD (Table 32) V0
indicates an exchange velocity for NO2 on the order of -03 cm s-1 (downward) Given
the robust appearance of this term with different fit parameters for both limited and full
datasets we find it likely that V0 represents a roughly constant deposition velocity
process independent of NOx photochemical cycling during the day Though statistical
significance is low an upward flux term associated with stomatal conductance or related
variables also appears in Table 35
343 Parameterization of NOx Fluxes
Both nighttime and daytime NOx fluxes can be combined into a single
parameterization based on the above discussion This framework adopts the hypothesis
that photochemical NO-NO2 cycling can be largely accounted for by a simple light-
dependent term and that net deposition may then be estimated from additional terms
representing constant exchange velocity concentration-dependent exchange velocity and
84
Table 35 Multi-factor regression using all hourly daytime FNO2 data following the
functional form FNO2 = (b+f)middotPPFDmiddot[NO2] + V0 [NO2] + ΓmiddotVd(O3) The intercepts for all
fits have been constrained to zero The parameter f is a canopy flag set to zero for full-
canopy conditions so may be considered a correction to the PPFD term for leaves-off
periods in early spring and late fall
b plusmn std error cm s-1 (mmol m-2 s-1)-1
f plusmn std error cm s-1 (mmol m-2 s-1)-1
= 0 for leaves on V0 plusmn std error
(cm s-1) Γ plusmn std error (nmol mol-1) R2
196plusmn007 (p-valuelt1E-4)
-13plusmn01 (p-valuelt1E-4) NA NA 055
240plusmn009
(p-valueltlt1E-4)
-132plusmn009 (p-valuelt1E-4)
-035plusmn005 (p-valuelt1E-4) NA 060
196plusmn008 (p-valuelt1E-4)
-11plusmn01 (p-valuelt1E-4) NA 01plusmn01
(p-value=04) 062
229plusmn009 (p-valuelt1E-4)
-11plusmn01 (p-valuelt1E-4)
-030plusmn005 (p-valuelt1E-4)
03plusmn01 (p-value=003) 065
85
stomatal conductance-related exchange processes Thus for the height of 22 m relative to
the 20 m canopy the flux of NO2 day and night is given by the simple function of NO2
concentration PPFD and O3 deposition velocity
FNO2 = V0 middot [NO2] + amiddot[NO2]2 + (b+f)middotPPFDmiddot[NO2] + ΓmiddotVd(O3) (Eq 37)
where f is added to the coefficient of PPFD to account for the observed difference
between full-canopy and leaves-off conditions
NO is not present in significant quantities at night and FNO appears to be driven
by a simple dependence on PPFD during the day We include a constant deposition
velocity term as well since evidence of NO deposition to surfaces is weak and
inconclusive At a measurement height of 29 m the flux of NO is given by
FNO = V0_NO middot [NO] + bprime middot PPFD middot [NO] (Eq 38)
The net fluxes of NO and NO2 may be determined by omitting the photochemical terms
from Eq 37 and 38 Since we expect the deposition velocity of NO to be small
FNOx(net)asympFNO2(net)
FNOx(net) asymp V0 middot [NO2] + amiddot[NO2]2 + ΓmiddotVd(O3) (Eq 39)
Multi-factor regressions for Eq 37 and Eq 38 were performed to determine the
coefficients V0 a b f V0_NO and brsquo using all available hourly observations of [NO2]
[NO] PPFD Vd(O3) FNO2 and FNO at Harvard Forest April-November 2000 The
results are presented in Table 36 along with the range of results from the separate
daytime and nighttime analyses discussed earlier
86
Table 36 Multi-factor regressions using all available hourly observations of [NO2]
[NO] PPFD Vd(O3) FNO2 and FNO at Harvard Forest April-November 2000 Note
that Vd(O3)=deposition velocity positive values indicate downward O3 exchange
velocity
z = 22m FNO2 = V0 middot [NO2] + a middot [NO2]2 + (b+f)middotPPFDmiddot[NO2] + Γ middot Vd(O3)
coeff plusmn std err p-value
April ndash November 2000 (R2 = 060)
Range of results from separate day and night analyses
V0 (cm s-1) -021plusmn004 lt1E-4 -03 to -001
a (nmol-1 mol cm s-1) -0002plusmn0004dagger 06 -0013 to ndash0002
b (cm s-1 (mmol m-2 s-1)-1) 221plusmn007 lt1E-4 19 to 24
f (cm s-1 (mmol m-2 s-1)-1) =0 for leaves-on -110plusmn009 lt1E-4 -13 to -10
Γ (nmol mol-1) 021plusmn009 002 01 to 03
z = 29m FNO = V0_NO middot [NO] + bprime middot PPFD middot [NO]
29 August ndash 8 Oct 2000 (R2 = 092)
V0_NO (cm s-1) -025plusmn002 lt1E-4 -087 to -042
bprime (cm s-1 (mmol m-2 s-1)-1) -087plusmn003 lt1E-4 -114 to -05
daggerThe more statistically robust nighttime a =-0013 plusmn 0001 (Table 31) is recommended
87
Nearly all of the coefficients fall within the ranges determined previously except
V0 and V0_NO which differ only slightly from the earlier values As illustrated in Figures
317 and 318 Eq 37 and Eq 38 with the multi-factor regression coefficients in Table
36 are good predictors of the measured fluxes over their entire dynamic ranges and for
all sampled conditions
The diel variations of fluxes and residuals from this parameterization (Figure
319) reveal several interesting features The parameterization captures the overall diel
behavior of both NO and NO2 fluxes It also tends to underestimate the upward flux of
[NO2] during the day for northwesterly flow conditions and to slightly overestimate
during daytime southwesterly flows The disagreement rarely exceeds the 25th and 75th
quantiles of the measured fluxes The dominant flow regimes at Harvard Forest differ in
a number of key respects that may affect this result Northwesterly conditions tend to
bring lower concentrations of reactive nitrogen species cooler temperatures drier
weather and clearer skies than southwest winds [Moody et al 1998] It is possible that
one or more of these factors is contributing to the wind-sector difference in the residuals
One might expect that the residuals would depend on additional factors not taken
into consideration For example mixing and therefore deposition depends on the friction
velocity u (m s-1) As shown in figure 320 the residual NO2 flux tends upward only at
the highest u quantiles during the day and has no significant trend at night Similarly
the temperature-dependent rate for (R31) k1(T)[O3] has not been included yet we find
that the NO2 flux residuals exhibit no statistically significant trend with k1(T)[O3] (Figure
321) Although included as terms in the paratmeterization similar residual analyses are
shown for V(O3) during the day (Figure 321) and for [NO2] during the day and night
(Figure 322) The distinctly different daytime and nighttime behavior of the total NO2
flux is apparent again in Figure 322 as are the small residuals overall
88
Res
idua
l (M
es ndash
Para
m)
FN
O2
(nm
ol m
ol-1
cm s
-1)
Parameterized FNO2 (nmol mol-1 cm s-1)
Mea
sure
d FN
O2
(nm
ol m
ol-1
cm s
-1)
FNO2 = V0middot[NO2] + amiddot[NO2]2 + (b+f)middotPPFDmiddot[NO2] + ΓmiddotVd(O3)
Daytime +Nighttime
11
-20 -10 0 10 20 30
-20
-10
010
2030
Quantiles of Standard Normal
-2 0 2
-10
-50
510
Figure 317 Upper Measured vs parameterized NO2 flux shown with 11 line daytime
(+) and nighttime () The functional form the parameterization is shown at the top
Lower Residuals of FNO2 vs quantiles of the standard normal The residuals are
normally-distributed with extended upper and lower wings
89
-10 -8 -6 -4 -2 0 2
-10
-8-6
-4-2
02
Quantiles of Standard Normal
-2 0 2
-10
-05
00
05
10
15
Mea
sure
d FN
O (n
mol
mol
-1cm
s-1
)
Res
idua
l (M
es ndash
Para
m)
FN
O (n
mol
mol
-1cm
s-1)
Parameterized FNO (nmol mol-1 cm s-1)
FNO = V0_NOmiddot[NO] + b middotPPFDmiddot[NO]
11
Figure 318 Same as Figure 317 for FNO
90
Fl
ux (n
mol
mol
-1cm
s-1
)R
esid
ual (
nmol
mol
-1cm
s-1
)Measured FNO (h=22m)Measured FNO2 (h=22m)Parameterized FNOParameterized FNO2
Meas-Param FNOMeas-Param FNO2
-20
24
-20
24
NW
0 5 10 15 20
-2-1
01
2-2
-10
12
-20
24
-20
24
SW
0 5 10 15 20
-2-1
01
2-2
-10
12
Hour
Figure 319 Top panels Median diel measured (closed symbols solid lines) and
parameterized (open symbols dashed lines) fluxes of NO2 and NO Vertical bars show
the 25th and 75th quantiles for the measurements Lower panels Median diel residual
(measured-parameterized) FNO2 and FNO Northwest wind conditions are shown on the
left southwest on the right The parameterizations capture the daytime behavior of NO
flux due to the photochemical gradient and eddy diffusivity effects For NO2 under
northwesterly conditions the daytime residual is positive indicating that the
parameterization underestimates upward flux of NO2 For southwesterly conditions
daytime NO2 flux residuals are more variable and tend in the opposite direction
91
DAY NIGHT
FNO
2(n
mol
mol
-1cm
s-1
)R
esid
ual F
NO
2(n
mol
mol
-1cm
s-1
)
FNO
2(n
mol
mol
-1cm
s-1
)R
esid
ual F
NO
2(n
mol
mol
-1cm
s-1
)
Res
idua
l FN
O2
(nm
ol m
ol-1
cm s
-1)
Measured FNO2
Parameterized FNO2
Res
idua
l FN
O2
(nm
ol m
ol-1
cm s
-1)
u (m s-1) u (m s-1)
u (m s-1) u (m s-1)
-10
-50
510
00 05 10 15
-10
-50
510
-10
-50
510
00 05 10 15
-10
-50
510
00 02 04 06 08 10 12 14
-20
2
00 02 04 06 08 10 12 14
-20
2
Figure 320 From top to bottom measured and parameterized NO2 fluxes residuals
(measured-parameterized) and expanded-axes quantile-binned mean residuals (plusmn
standard deviation) vs u shown for daytime on the left and nighttime on the right
92
DAY k1(T)[O3] Day V(O3)
FNO
2(n
mol
mol
-1cm
s-1
)R
esid
ual F
NO
2(n
mol
mol
-1cm
s-1
)
FNO
2(n
mol
mol
-1cm
s-1
)R
esid
ual F
NO
2(n
mol
mol
-1cm
s-1
)
Res
idua
l FN
O2
(nm
ol m
ol-1
cm s
-1)
Measured FNO2
Parameterized FNO2
Res
idua
l FN
O2
(nm
ol m
ol-1
cm s
-1)
k1(T)[O3] (s-1) V(O3) (cm s-1)
k1(T)[O3] (s-1) V(O3) (cm s-1)
-10
010
2030
001 002 003 004
-10
-50
510
-10
010
2030
-003 -002 -001 00 001
-10
-50
510
0005 0010 0015 0020 0025 0030
-3-2
-10
12
-0015 -0010 -0005 00
-3-2
-10
12
Figure 321 Same as Figure 321 for daytime k1(T)[O3] (left) and daytime V(O3) (right)
93
DAY NIGHT
FNO
2(n
mol
mol
-1cm
s-1
)R
esid
ual F
NO
2(n
mol
mol
-1cm
s-1
)
FNO
2(n
mol
mol
-1cm
s-1
)R
esid
ual F
NO
2(n
mol
mol
-1cm
s-1
)
Res
idua
l FN
O2
(nm
ol m
ol-1
cm s
-1)
Measured FNO2
Parameterized FNO2
Res
idua
l FN
O2
(nm
ol m
ol-1
cm s
-1)
[NO2] (nmol mol-1) [NO2] (nmol mol-1)
[NO2] (nmol mol-1) [NO2] (nmol mol-1)
-10
010
2030
0 5 10 15 20
-10
-50
510
-20
-15
-10
-50
510
0 5 10 15 20
-10
-50
510
0 2 4 6 8
-3-2
-10
12
0 2 4 6 8 10 12
-20
24
Figure 322 Same as Figure 321 for [NO2] during the daytime (left) and nighttime
(right)
94
The lack of robust trends in the NO2 flux residuals indicates that within the
limitations of the dataset Eq 37 captures the crucial aspects of observed NO2 flux
behavior within and above the tall forest canopy under a wide range of conditions
Similarly Eq 38 accounts for 92 of the observed variance in the measured NO fluxes
under a somewhat narrower set of conditions (the sampling period for NO eddy
covariance flux measurements was relatively short) Figure 323 shows the resulting net
NOx flux (Eq 39 Table 36) and exchange velocity VNOx(net)=FNOx(net)[NO2] on a
diel basis for the sampling period April-November 2000 For the rural low-NOx
conditions at Harvard Forest we find that the flux of NOx is downward at all hours with
a deposition velocity of approximately 02 cm s-1
35 Conclusions
We installed a Tunable Diode Laser Absorption Spectrometer (TDLAS) to
measure continuous NO2 concentrations and eddy covariance fluxes above the canopy at
Harvard Forest during the spring summer and fall of 2000 An existing
chemiluminescence NO detector was configured to measure above-canopy eddy
covariance fluxes for a shorter period in the late summer and early fall A photolysis-
chemiluminescence (P-C) NO2 instrument also measured concentrations for a portion of
the sampling period Hourly average TDLAS and P-C NO2 concentrations agreed very
well under all conditions The agreement between the two instruments in the field and
the independent spectroscopic calibration of the TDLAS validated the long-term
measurements of the tank-calibrated P-C system
95
0 6 12 18
-10
-08
-06
-04
-02
00
-14
-12
-10
-08
-06
-04
-02
00
Net
FN
Ox
(nm
ol m
ol-1
cm s
-1)
(microm
ol m
-2hr
-1)
Net
VN
Ox
(cm
s-1
)
Hour
median| 25th amp 75th percentiles
0 6 12 18
-024
-022
-020
-018
Figure 323 Diel cycle of parameterized net NOx exchange velocity (upper panel) and
flux (lower panel) April-November 2000 FNOx(net) asymp FNO2(net) = V0middot[NO2] +
amiddot[NO2]2 + ΓmiddotVd(O3) VNOx(net) = FNO2(net)[NO2]
96
At night in the absence of significant quantities of NO we observed a consistent
downward flux of NO2 which depended quadratically on the concentration of NO2
although the dependence was apparent mainly on two nights when [NO2] was above 10
nmol mol-1 The nighttime NO2 deposition velocity varied between 02 cm s-1 at [NO2]=1
nmol mol-1 and 05 cm s-1 at [NO2]=30 nmol mol-1 These fluxes could come from direct
NO2 deposition to non-stomatal surfaces in the forest such as soil litter bark and the
outer surfaces of leaves area-normalized deposition velocities to such surfaces in
chamber measurements have varied from less than 01 to 05 cm s-1 for NO2
concentrations between 40 and 80 nmol mol-1 [Hanson and Lindberg 1991] The rate of
heterogeneous N2O5 hydrolysis resulting in aqueous-phase HNO3 (unlikely to re-enter the
gas phase) is insufficient to explain the observed nighttime NO2 deposition rates The
quadratic flux dependence and similarity to the behavior of HONO observed at other sites
suggests that heterogeneous NO2 hydrolysis may also play a significant role in NO2
deposition [Harrison and Kitto 1994 Harrison et al 1996 Barney and Finlayson-Pitts
2000] Half of any NO2 flux due to heterogeneous NO2 hydrolysis would likely escape
from the surfaces as gas-phase HONO potentially impacting the daytime HOx and NOx
budgets when photolyzed at sunrise
During the day we observed coupled fluxes of NO2 (upward) and NO
(downward) due to photochemical cycling driven by canopy-induced light and eddy
diffusivity gradients The imbalance in the observed fluxes corresponded to the
difference in height of the sampling levels relative to the canopy The exchange
velocities of the two species in their respective directions increased with higher above-
canopy light levels as measured by photosynthetic photon flux density (PPFD) due to the
97
stronger light gradient through the canopy under brighter conditions Upward NO2
velocity was smaller in early spring and late fall when there were no leaves on the trees
corresponding to a weaker light gradient condition (NO fluxes were only measured
during full-canopy conditions) and possibly to the absence of stomata-dependent
emission of NO2 We believe that these coupled fluxes are the first to be reported from a
mature tall-canopy site using reliable eddy-covariance appropriate sampling techniques
All of the NO and NO2 flux data day and night were well explained by a simple
parameterization consisting of two equations FNO2 = V0 middot [NO2] + amiddot[NO2]2 +
(b+f)middotPPFDmiddot[NO2] + ΓmiddotVd(O3) and FNO = V0_NO middot [NO] + bprime middot PPFD middot [NO] The net flux
of NOx is approximately equal to the flux of NO2 omitting the PPFD-dependent term
FNOxasympV0 middot [NO2] + amiddot[NO2]2 + ΓmiddotVd(O3) V0 and V0_NO are small constant deposition
velocity terms b and bprime are coefficients of light-dependent coupled fluxes for full-canopy
conditions and f adjusts the NO2 light-dependent term for no-leaves conditions The
deposition velocity of O3 was used as a proxy for stomatal exchange the coefficient Γ
was consistently positive Stomatal conductance correlates with a number of different
variables (light temperature humidity) complicating the interpretation of the final term
It may indicate a stomatal emission of NO2 under low-NOx conditions typical at Harvard
Forest but could also correspond to a chemical or other process which slows NO2
deposition during the day The quadratic term amiddot[NO2]2 was particularly significant at
night during a few high-[NO2] events Multi-factor regressions fitting the hourly data
with these equations yield R2 of 061 for FNO2 and 092 for FNO the coefficients
summarized in Table 36 agree with analyses of segregated daytime and nighttime data
We note that the coefficients are relevant to the specific measurement heights of NO (29
98
m) and NO2 (22 m) at Harvard Forest relative to the forest canopy height (20 m)
However the mechanism should be adaptable for more general application
During the measurement period net NO2 deposition velocity (omitting the PPFD-
dependent term associated with photochemical cycling of NOx) -(V0 + amiddot[NO2] +
ΓmiddotVd(O3)[NO2]) was between 015 and 03 cm s-1 The mean 02 cm s-1 varied by less
than 002 cm s-1 between day and night and between full-canopy and leafless conditions
NO2 deposition velocity measurements to deciduous forest canopies are scarce this result
falls just outside of the range of reported values for coniferous forests 01 to 15 cm s-1
[Hanson and Lindberg 1991 Rondoacuten et al 1993 Joss and Graber 1996] and short
crops such as alfalfa soy and oats 007 to 125 cm s-1 [Hanson and Lindberg 1991]
The only estimates of NO deposition velocity are over grass ~01 to 02 cm s-1 [Hanson
and Lindberg 1991] other observations indicate NO emission from various species
though soil emissions could confound these results [Wildt et al 1997] This is quite
close to the ~025 cm s-1 NO deposition velocity at Harvard Forest (-V0_NO) but we
cannot resolve the debate as to whether NO deposits at all [Wesely and Hicks 2000]
Concentration and flux measurements of HONO N2O5 and NO3 (along with NO
and NO2) are required to better understand the nighttime chemistry and deposition of
NOx Recently-developed continuous analyzers for HONO [Harrison et al 1996] and N-
2O5 and NO3 [Brown et al 2001] may make these measurements possible in the coming
years In addition the use of flux chambers with a TDLAS or other instrument (sub-
nmol mol-1 sensitivity and species-specific detection method) on leaf litter and soil
samples in the lab and field may facilitate direct detection of NO2 compensation points
for various species and quantify the importance of different natural surfaces
99
NOx deposition matters to both the ecosystem and the atmosphere the form of
nitrogen entering plants affects nutrient loading acid stress and toxicity and the form of
nitrogen leaving the atmosphere affects O3 production HOx chemistry and long-range
transport of anthropogenic pollutants We are hopeful that future research endeavors will
approach the problem from the perspective of both ecosystem and atmosphere at scales
ranging from the individual leaf to the vegetated landscape using reliable species-
specific and sensitive measurement techniques
References
Andreacutes-Hernaacutendez J Notholt J Hjorth and O Schrems A DOAS study on the origin of initrous acid at urban and non-urban sites Atmos Environ 30 175-180 1996
Aneja V P P A Roelle G C Murray J Southerland J W Erisman D Fowler W A H Asman and N Patni Atmospheric nitrogen compounds II emissions transport transformation deposition and assessment Atmos Environ 35 1903-1911 2001
Barford C E Hammond Pyle L Hutyra S Wofsy Ecological Measurements to compliment eddy-flux measurements at Harvard Forest [Online data archive] httpwww-asharvardedudatanigec-datahtml 2001
Barnet W S and B J Finlayson-Pitts Enhancement of N2O4 on porous glass at room temperature A key intermediate in the heterogeneous hydrolysis of NO2 J Phys Chem A 104 171-175 2000
Barney W S and B J Finlayson-Pitts Enhancement of N2O4 on Porous Glass at Room Temperature A Key Intermediate in the Heterogeneous Hydrolysis of NO2 J Phys Chem A 104 171-175 2000
Bey I D J Jacob R Yantosca J logan B Field A Fiore Q Li H Liu L Mickley M Schultz Global modeling of tropospheric chemistry with assimilated meteorology Model description and evaluation in press J Geophys Res 2001
Brown S H Stark S J Ciciora and A R Ravishankara In-situ measurement of atmospheric NO3 and N2O5 via cavity ring-down spectroscopy Geophys Res Lett 28 3237-3230 2001 (a)
100
Brown S H Stark S J Ciciora and A R Ravishankara In-situ Detection of Atmospheric NO3 and N2O5 via Cavity Ring-Down Spectroscopy EOS Trans AGU 82 Fall Meeting Suppl A41B-0045 2001 (b)
Coe H and M W Gallagher Measurements of dry deposition of NO2 to a Dutch heathland using the eddy-correlation technique Q J R Meteorol Soc118 767-786 1992
Delaney A C D R Fitzjarrald D H Lenschow R Pearson Jr G J Wendel B Woodruff Direct Measurements of Nitrogen Oxides and Ozone Fluxes over Grassland J Atmos Chem 4 429-444 1986
Eugster W and R Hesterberg Transfer resistances of NO2 determined from eddy correlation flux measurements over a litter meadow at a rural site on the Swiss plateau Atmos Environ 30 1247-1254 1996
Fitzjarrald D R and D H Lenschow Mean concentration and flux profiles for chemically reactive species in the atmospheric surface layer Atmos Environ 17 2505-2512 1983
Galmarini S P G Duynkerke J Vila-Guerau De Arellano Evolution of Nitrogen Oxide Chemistry in the Nocturnal Boundary Layer J Appl Meteorology 36 943-957 1997
Gao W M L Wesely P V Doskey Numerical Modeling of the Turbulent Diffusion and Chemistry of NOx O3 Isoprene and Other Reactive Trace Gases in and Above a Forest Canopy J Geophys Res 98 18339-18353 1993
Gao W and M L Wesely Numerical Modeling of the Turbulent Fluxes of Chemically Reactive Trace Gases in the Atmospheric Boundary Layer J Appl Meteorology 33 835-847 1994
Goodman A L G M Underwood and V H Grassian Heterogeneous Reaction of NO2 Characterization of Gas-Phase and Adsorbed Products from the Reaction 2NO2(g) + H2O(a) HONO(g) + HNO3(a) on Hydrated Silica Particles J Phys Chem A 103 7217-7223 1999
Goulden ML JW Munger S-M Fan B C Daube and S C Wofsy Measurements of carbon sequestration by long-term eddy covariance Methods and a critical evaluation of accuracy Global Change Biology 2 169-182 1996
Harrison R M A-M N Kitto Evidence for a surface source of atmospheric nitrous acid Atmos Environ 28 1089-1094 1994
Harrison R M J D Peak G M Collins Tropospheric cycle of nitrous acid J Geophys Res 101 14429-14439 1996
101
Heal M R B B B Booth J N Cape K J Hargreaves The influence of simplified peroxy radical chemistry on the interpretation of NO2-NO-O3 surface exchange Atmos Environ 35 1687-1696 2001
Horii C V M S Zahniser D D Nelson J B McManus S C Wofsy Nitric Acid and Nitrogen Dioxide Flux Measurements a New Application of Tunable Diode Laser Absorption Spectroscopy Proc of SPIE 3758 152-161 1999
Hosker R P Jr and S E Lindberg Review Atmospheric deposition and plant assimilation of gases and particles Atmos Environ 16 889-910 1982
Hanson P and S E Lindberg Dry deposition of reactive nitrogen compounds a review of leaf canopy and non-foliar measurements Atmos Environ 25A 1615-1634 1991
Jacob D J Heterogeneous chemistry and tropospheric ozone Atmos Environ 34 2131-2159 2000
Joss U and W K Graber Profiles and Simulated Exchange of H2O O3 NO2 Between the Atmosphere and the HartX Scots Pine Plantation Theor Appl Climatol 53 157-172 1996
Lefer B L and R W Talbot Nitric acid and ammonia at a rural northeaster US site J Geophys Res 104 1645-1661 1999
Lerdau M T J W Munger D J Jacob The NO2 Flux Conumdrum Science289 2291-2293 2000
Moody J L J W Munger A H Goldstein D J Jacob and S C Wofsy Harvard Forest regional-scale air mass composition by Patterns in Atmospheric Transport History (PATH) J Geophys Res 103 13181-13194 1998
Munger J W S C Wofsy P S Bakwin S-M Fan M L Goulden B C Daube and A H Goldstein Atmospheric deposition of reactive nitrogen oxides and ozone in a temperate deciduous forest and a subarctic woodland 1 Measurements and mechanisms J Geophys Res 101 12639-12657 1996
Munger J W S-M Fan P S Bakwin M L Goulden A H Goldstein A S Colman and S C Wofsy Regional budgets for nitrogen oxides from continental sources Variations of rates for oxidation and deposition with season and distance from source regions J Geophys Res 103 8355-8368 1998
Notholt J J Hjorth and F Raes Formation of HNO2 on aerosol surfaces during foggy periods in the presence of NO and NO2 Atmos Environ 26A 211-217 1992
Padro J Zhang L and W J Massman An analysis of measurements and modlling of air-surface exchange of NO-NO2-O3 over grass Atmos Environ 32 1365-1375 1998
102
103
Rondon A C Johansson L Granat Dry Deposition of Nitrogen Dioxide and Ozone to Coniferous Forests J Geophys Res 98 5159-5172 1993
Rothman LS et al The HITRAN molecular spectroscopic database and HAWKS (HITRAN Atmospheric Workstation) 1996 Edition J Quant Spectrosc Radiat Transfer 60 665-710 1998
Sparks J P R K Monson K L Sparks M Lerdau Leaf uptake of nitrogen dioxide (NO2) in a tropical wet forest implications for tropospheric chemistry Oecologia 127 214-221 2001
Stocker D W D H Stedman K F Zeller W J Massman D G Fox Fluxes of Nitrogen Oxides and Ozone Measured by Eddy Correlation Over a Shortgrass Prairie J Geophys Res 98 12619-12630 1993
Walton S M W Gallagher T W Choularton J Duyzer Ozone and NO2 Exchange to Fruit Orchards Atmos Environ 31 2767-2776 1997
Wesely M L J A Eastman D H Stedman E D Yalvac An eddy-correlation measurement of NO2 flux to vegetation and comparison to O3 flux Atmos Environ 16 815-820 1982
Wesely M L Parameterization of surface resistances to gaseous dry deposition in regional-scale numerical models Atmos Environ 23 1293-1304 1989
Wesley M L and B B Hicks A review of the current status of knowledge on dry deposition Atmos Environ 34 2261-2282 2000
Wildt J D Kley A Rockel P Rockel H J Schneider Emission of NO from several higher plant species J Geophys Res 102 5919-5927 1997
- April ndash November 2000
- G (nmol mol-1)
- 29 August ndash 8 Oct 2000
- References
- Chapter3_NOx_Part2pdf
-
- 34 Discussion
-
- Chapter3_NOx_Part1pdf
-
- 32 Methods
- 33 Results
-

4
3
2
1
0
[NO
] [N
O2]
(nm
ol m
ol-1
)
287286285284283282281Day of Year 2000
8
4
0
-4
FNO
FN
O2 (
micromol
m-2
hr-1
)
-100-50050100
FO3 (microm
ol m-2 hr -1)
50403020100
[O3 ] (nm
ol mol -1)
O3 NO2 NO
Figure 35 Time series of hourly NO (solid lines left axes) NO2 (dashed lines left axes)
and O3 (solid lines right axes) concentrations (upper panels) and fluxes (lower panels)
Oct 7-12 2000 NO2 measurements were taken at a sampling height of 22 m NO and O3
at 29 m on a nearby tower
57
02
46
80
24
68
NW
Hour
0 6 12 18
-4-2
02
4
02
46
80
24
68
SW
Hour
0 6 12 18
-4-2
02
4
[NO][NO2][O3]10
FNOFNO2FO310
Flux
(microm
ol m
-2hr
-1)
Con
cent
ratio
n (n
mol
mol
-1)
Figure 36 Diel cycles of median concentrations (upper panels) and fluxes (lower
panels) for the Northwest (2700-450 left panels) and Southwest (1800-2700 right panels)
wind sectors at Harvard Forest April-November 2000 for NO NO2 and O310 NO and
O3 were sampled at a height of 29 m and NO2 at 22 m Vertical bars indicate 25th and
27th quartiles for NO and NO2 measurements NO2 concentration and nighttime
deposition are enhanced under southwesterly conditions as are O3 and the morning NO
maximum
58
34 Discussion
In the following sections we examine relationships of fluxes and concentrations
for various conditions and species The generalized exchange velocity for a species
(fluxconcentration) allows fluxes to be compared in a normalized form In order to
remain consistent with the flux sign convention used herein we define positive exchange
velocity at the sampling height as upward (in the direction of emission) and negative
exchange velocity as downward (in the direction of deposition) regardless of whether the
process represents net emission or deposition to the surface To facilitate the calculation
of exchange velocity in units of cm s-1 we express flux in units of concentration times
velocity (nmol mol-1 cm s-1) which is also the actual quantity measured by the
instrumentation The conversion to SI flux units is 1 nmol mol-1 cm s-1 = 1606 micromol m-2
hr-1 (STP) Temperature and pressure corrections to this conversion have been taken into
account in the following analyses
341 Nighttime Deposition of NO2
At night NO concentration and flux fall to near zero photochemical cycling
ceases and the NO2 flux should capture total NOx exchange The observed nighttime
NO2 flux was generally small Figure 37 shows that nighttime NO2 flux depends
quadratically on [NO2] A polynomial regression of the form FNO2 = F0 + V0 [NO2] + a
[NO2]2 gives the results in Table 31
The quadratic dependence in the regression is largely driven by the two nights
during the sampling period when the median concentration of NO2 was above 10 nmol
mol-1 excluding these nights the parameter a is not statistically significant
59
0 5 10 15 20 25 30
-20
-15
-10
-50
5 Hourly Data (fitted)Nightly Medians +
[NO2] (nmol mol-1)
NO
2Fl
ux (n
mol
mol
-1cm
s-1
)FNO2(night) = F0 + V0 [NO2] + a [NO2]2
F0 = 0V0 = -008 plusmn 003 (cm s-1)a = -0013 plusmn 0001 (nmol-1 mol cm s-1)
R2 = 063
Figure 37 Nighttime hourly (dots) and median nightly (pluses) NO2 flux vs
concentration with results of least-squares fit on the hourly data (curve) The flux is
expressed in units of concentration times velocity (nmol mol-1 cm s-1) in order to simplify
the interpretation of the coefficients in the least-squares fit Pressure and temperature
corrections have been taken into account in the conversion from density to mixing ratio
60
Table 31 Polynomial regression results for nighttime FNO2 = F0 + V0 [NO2] + a [NO2]2
F0 plusmn std error (nmol mol-1 cm s-1)
V0 plusmn std error (cm s-1)
a plusmn std error (nmol-1 mol cm s-1) R2
-02 plusmn 01 (p-value=007)
-001 plusmn 005 (p-value=08)
-0015 plusmn 0002 (p-valuelt1E-4) 060
All Hourly Data
Constrained to 0 -008 plusmn 003
(p-value=001)
-0013 plusmn 0001 (p-valueltlt1E-4) 060
-02 plusmn 01 (p-value=01)
-002 plusmn 01
(p-value=09)
-0014 plusmn 0002 (p-value=03) 003
[NO2]le10 nmol mol-1
Constrained to 0 -016 plusmn 006
(p-value=0005)
-0002 plusmn 001 (p-value=09) 003
-02 plusmn 02 (p-value=03)
-002 plusmn 006
(p-value=07)
-0015 plusmn 0002 (p-valuelt1E-4) 063
[NO2] ge1 nmol mol-1
Constrained to 0 -007 plusmn 003 (p-value=0003)
-0013 plusmn 0002 (p-valuelt1E-4) 052
61
A statistically significant non-zero F0 term cannot be interpreted as a physically
meaningful result NO2 cannot deposit if its concentration is zero The polynomial
regression does not take into account potential uncertainty in [NO2] which could
introduce a bias at low values where the uncertainty in the measurement is larger than the
absolute value By excluding [NO2] lt 1 nmol mol-1 from the regression we obtain an F0
which is not significantly different from zero It is therefore useful to constrain F0 to
zero V0 is frequently indistinguishable from zero If the quadratic dependence is in fact
valid over the full range of NO2 concentrations this result implies that the nighttime
deposition velocity of NO2 increases from approximately 02 cm s-1 at [NO2]=1 nmol
mol-1 to 05 cm s-1 at [NO2]=30 nmol mol-1 The data do not support the existence of a
compensation point for NO2 at night on average NO2 continues to deposit to not emit
from the forest even at low concentrations Note that soil emission fluxes of NO are
very low at Harvard Forest less than 09 micromol m-2 hr-1 [Munger et al 1996] so the
effects of freshly emitted NO conversion to NO2 are insignificant
The downward NO2 flux measured above the forest canopy at night may arise
from direct NO2 deposition to leaves litter bark and soil but not via leaf stomata
because they are largely closed in the absence of sunlight Eugster and Hesterberg [1996]
found that NO2 deposition to a litter meadow at night encountered less resistance than O3
deposition to the same surfaces Other studies have also found significant deposition
velocities for NO2 to soil litter and bark [Hanson et al 1991 and references therein]
Non-stomatal NO2 deposition could proceed via formation and heterogeneous
hydrolysis of N2O5 on forest surfaces below the sensor height as in (R37) ndash (R39) with
formation of NO3 (R37) the rate limiting step [Jacob 2000]
62
NO2 + O3 NO3 + O2 (R37)
NO3 + NO2 + M N2O5 + M (R38)
N2O5 + H2O 2HNO3 (R39)
Since HNO3 deposits rapidly it is unlikely that much (if any) of the HNO3 produced
heterogeneously from N2O5 hydrolysis would escape from the forest in the gas phase
Recent field observations of N2O5 and NO3 at night have shown that concentrations of
N2O5 build up over the course of the night that the NO3 to N2O5 ratio closely follows the
theoretical temperature-dependent equilibrium and that accumulated N2O5 is photolyzed
at dawn to recycle NO2 [Brown et al 2001 a and b] Thus only a portion of any NO2
flux due to (R37) ndash (R39) corresponds to net loss of NOx from the atmosphere
We can estimate the maximum downward NO2 flux due to N2O5 hydrolysis by
assuming a negligible vertical NO2 concentration gradient below the sensor 100
conversion of NO3 to N2O5 and 100 hydrolysis of N2O5 below the sensor height
H=22 m These upper limits are compared to the measured fluxes in Figure 38 for
nightly median NO2 concentrations less than 10 nmol mol-1 (Eq 31)
Max FNO2 (N2O5 hydrolysis) = 2middotHmiddotP(NO3) = 2 Hmiddotk7[NO2][O3] (Eq 31)
The maximum NO2 deposition attributable to N2O5 hydrolysis depends linearly on
[NO2] a linear regression of the computed flux against concentration yields a deposition
velocity of 0048plusmn0008 cm s-1 (p-value lt 1E-4) R2 = 05 a factor of 4-10 lower than the
observed deposition velocities Noisy data prevent definitive identification of the shape
of the observed dependence at concentrations below 10 nmol mol-1 but we infer that the
N2O5 hydrolysis estimate underpredicts the observed NO2 deposition flux At higher
NO2 concentrations the N2O5 hydrolysis estimate vastly underpredicts observed NO2
63
[NO2] (nmol mol-1)
NO
2Fl
ux (n
mol
mol
-1cm
s-1
)
Max N2O5 hydrolysisNightly Medians +
0 2 4 6 8 10
-2-1
01
Figure 38 Nightly median NO2 flux vs concentration for concentrations below 10 nmol
mol-1 (pluses) The maximum contribution to NO2 deposition by N2O5 hydrolysis on
forest surfaces (boxes) was estimated by calculating the production rate of NO3 from NO
+ O3 (the vertical NO2 concentration gradient is negligible) 100 conversion of NO3 to
N2O5 and 100 N2O5 hydrolysis on forest surfaces below 22 m The linear regression of
maximum NO2 deposition due to N2O5 hydrolysis vs [NO2] indicates an upper limit
deposition velocity of 0048plusmn0008 cm s-1 due to this process (R2 = 05 p-valuelt1E-4)
64
deposition (not shown) Although N2O5 hydrolysis very likely occurs on forest surfaces
it appears to account for a small fraction (lt30) of the observed nighttime NO2
deposition
The quadratic dependence of nighttime NO2 flux on concentration could also arise
from heterogeneous hydrolysis of NO2 and production of HONO below sensor height
Observations at urban and rural sites have shown that NOx can be converted to HONO on
aerosols [Notholt et al 1992 Andreacutes-Hernaacutendez et al 1996] Although NO2 is known
to react on hydrated surfaces the mechanism and kinetics of the process are not fully
understood It appears that the most likely heterogeneous NO2 hydrolysis reaction is
(R310) [Goodman et al 1999]
2NO2(g)+ H2O(a) HONO(g) + HNO3(a) (R310)
Laboratory studies have shown first-order kinetics in NO2 for (R310) at parts-per-million
(micromol mol-1) concentrations with NO2 adsorption as the rate-limiting step but the low-
concentration kinetics are unknown The atmospheric mechanism may involve N2O4 as a
key intermediate on the surface [Barney and Finlayson-Pitts 2000] As in the N2O5
hydrolysis mechanism the aqueous-phase HNO3 produced in (R310) is not likely to be
released to the gas phase Harrison et al [1994 1996] observed upward HONO fluxes
over vegetated surfaces at NO2 concentrations above 10 ppb along with a quadratic
dependence of [HONO] on [NO2] If the observed NO2 flux at Harvard Forest is the
result of (R310) then approximately half might be released as gas-phase HONO and
would not contribute to net loss of NOx from the atmosphere The amount of
heterogeneous nighttime HONO formation at the surface is important to daytime HOx
65
chemistry because at sunrise HONO is photolyzed to deliver a burst of OH and NO to
the surface layer
The evidence for direct NO2 deposition to soil litter and bark rests on only a few
studies under ambient conditions where surfaces were likely to be hydrated and none of
which had simultaneous gas-phase HONO measurements [Eugster and Hesterberg 1996
Hanson et al 1991] Thus it is possible that a portion of reported NO2 deposition to
various surfaces proceeds via NO2 hydrolysis in which case half of the deposited NO2
would remain on the surface as HNO3 and half might re-emerge as gas-phase HONO
Nighttime N2O5 hydrolysis leads to aqueous-phase HNO3 production so that this process
is also likely to contribute to some net atmospheric NOx loss Clearly individual
measurements of HONO N2O5 and NO3 concentrations and fluxes are crucial to
unraveling the nighttime NOx budget and its impact on tropospheric HOx and O3
chemistry At Harvard Forest it appears likely that heterogeneous N2O5 and NO2
hydrolysis both contribute to the observed nighttime NO2 flux though we cannot rule
out additional processes
Nighttime concentrations and fluxes of NO2 and NOy (Figure 39) show that the
measured NO2 flux accounts for between zero and 24 of total NOy deposition with a
notable dependence on wind direction The NOy sensor detects NOx HNO3 HONO
PANs and additional species If a portion of the downward NO2 flux is balanced by an
upward HONO flux then additional NOy flux is unattributed For the northwest wind
sector where the flux budget appears to be closed within the noise of the measurements
the fractional impact on the flux budget would be larger than for southwesterly conditions
where unmeasured species account for much of the NOy deposition
66
02
46
810
12
SW
Hour
19 20 21 22 23 0 1 2 3 4
-15
-10
-50
NOyNO2+HNO3NO2
FNO2FNO2+FHNO3FNOy
Flux
(microm
ol m
-2hr
-1)
Con
cent
ratio
n (n
mol
mol
-1)
02
46
810
12
NW
Hour
19 20 21 22 23 0 1 2 3 4
-15
-10
-50
Figure 39 Nighttime medians for the northwest (left) and southwest (right) wind
sectors April-November 2000 Upper panels Concentrations of NO2 NO2+HNO3 and
NOy (with vertical bars spanning 25th and 75th quartiles) Lower panels Fluxes of NO2
NO2+HNO3 and NOy (with 25th and 75th quartiles) For northwesterly conditions NO2
accounts for 48 to 65 of nighttime NOy concentration and 0 to 24 of NOy flux For
southwesterly conditions NO2 accounts for 35 to 58 of nighttime NOy concentration
and 0 to 13 of nighttime NOy flux
67
Most atmospheric models base their NO2 deposition parameterizations on the
modified Wesely [1989] scheme in which the surface resistance for NO2 prohibits
transfer except to lush vegetation exposed to sunlight where leaf stomata are open [eg
Bey et al 2001] Thus NO2 deposition velocity in these models falls to near zero at night
over vegetation regardless of the concentration of NO2 We observed nighttime NO2
deposition to the forest dependent on concentration and we infer that the behavior of
models departs significantly from the observed processes
Figure 310 compares observed nighttime NO2 deposition velocity to 24-hour
NO2 deposition from the Harvard GEOS-CHEM model on a monthly basis for Harvard
Forest [A Fiore personal communication] The nighttime NO2 deposition velocity of the
data is approximately half the modelrsquos 24-hour mean during the months when the canopy
is fully developed Since we believe that NO2 also deposits during the day (see below)
the modelrsquos 24-hour average deposition flux in summer may be approximately correct
although the day-night variation and dependence on NO2 concentration are incorrect
The model has no deposition when trees are bare but our data clearly indicate that
deposition continues at these times This discrepancy suggests a potentially large
underestimate of NOx deposition to forested landscapes during dormant months
342 Daytime Fluxes of NO NO2 O3 and NOy
During the day (R31) ndash (R34) establish a dynamic balance between NO NO2
and O3 while deposition of NO2 and O3 onto the forest canopy and sub-canopy
68
05
04
03
02
01
00
NO
2 Dep
ositi
on V
eloc
ity (c
m s
-1)
1110987654321
Month
GEOS-CHEM Harvard Forest Inland Box24-Hour Monthly Means 1995 1997 OBSERVED Harvard Forest TDLASNighttime Monthly Median 2000
Figure 310 Comparison of 24-hour monthly mean NO2 deposition in the GEOS-CHEM
model Harvard Forest box 1995 and 1997 to the observed nighttime monthly median
NO2 deposition measured at Harvard Forest in 2000 Unlike the observations the modelrsquos
nighttime deposition velocity of NO2 drops to near zero and contributes insignificantly to
total NOx deposition
69
surfaces continues The light gradient through the canopy (see Figure 311) drives (R32)
at a faster rate above than below shifting the balance of NOx toward NO above and NO2
below the canopy height (~20 m at this site) Theoretical studies have predicted that this
photochemical effect should produce coupled upward fluxes of NO2 and downward
fluxes of NO above the forest canopy [eg Gao et al 1993] These studies have
employed large suites of chemical reactions soil NO emissions canopy isoprene
emissions and leaf-level resistance models for NO2 HNO3 O3 and H2O2 deposition
We show below that a simpler approach captures much of the observed behavior of NOx
fluxes at Harvard Forest
Dominant features of the observed daytime NO and NO2 fluxes shown in Figures
35 and 36 are their opposite signs dependence on light and apparent imbalance
Upward NO2 flux at midday is reproducibly several times larger than downward NO flux
A simple model of canopy photochemical NOx cycling reveals that this apparent
imbalance is expected based on the difference in the height of the sampling inlets for the
two gases above the canopy For a trace gas species X continuity requires that a change
in concentration d[X]dt be due to the sum of chemical production PX chemical loss ndashLX
and flux - Φ
d[X]dt = Px ndash Lx ndash Φ (Eq 32)
For NOx photochemical cycling (R31)-(R33) we simplify Eq 32 by assuming steady
state d[X]dt = 0 ignoring horizontal transport and approximating the vertical flux as Φz
= ndashKc(z) d[X(z)]dz where Kc is a vertical exchange coefficient (ldquoeddy diffusivityrdquo) We
write the production and loss terms as
131
][]][[2 τ
NONOOkLP NONO === (Eq 33)
70
25
20
15
10
5
0
heig
ht (m
)
302520151050
295-385 nm Total UV (W m-2)
Harvard Forest 04 Oct 2001Local Noon Clear Sky
EMS Profile UV TDLAS Point UV
Figure 311 Midday profile of total UV radiation at Harvard Forest At each height the
Eppley total UV radiometer was placed horizontally facing upward to measure total
(direct plus diffuse) downwelling radiation and then facing downward to measure total
upwelling radiation The points indicate the sum of total downwelling and total
upwelling UV radiation Horizontal bars show observed variability in total downwelling
+ upwelling UV irradiance at each height within approximately one meter of the
measurement tower
71
2
2222
][][
τNO
NOjPL NONO === (Eq 34)
We scaled Kc(z) from Gao et al [1993] to the height of the Harvard Forest
canopy 20 m and approximated the effect of the light gradient from Figure 311 on the
lifetime of NO2 τ2(z) as shown in Figure 312 based on measurements made manually
with an Eppley UV photometer We estimated τ1asymp70s based on median k1(T) and [O3]
for the site the vertical gradient for O3 is small between 20 and 30 m making the
constant lifetime a reasonable approximation We then solved Eq 32 for NO and NO2 to
derive a simple model of vertical transport and photochemical cycling of NOx shown in
Figure 313
This calculation clarifies the cause of the imbalance between daytime NO and
NO2 fluxes observed in the time series and diel cycles in Figures 34 and 35 Because
the concentrations and fluxes of the two species were measured at separate heights 22 m
for NO2 and 29 m for NO they sampled different points along the concentration and flux
gradients induced by reduced light conditions below the canopy The larger observed
upward NO2 flux is expected based solely on photochemical cycling at a sampling point
closer to the canopy than that of NO
In addition to NO and NO2 fluxes corresponding to photochemical cycling
between the two NO2 is likely to interact with the vegetation via stomata during daylight
hours Canopy surface conductance gc is readily calculated using the Penman-Monteith
equation [Shuttleworth et al 1984] and the measured water vapor flux at Harvard Forest
Deposition velocities for species known to deposit through stomata (ie O3) correlate
strongly with gc [Munger et al 1996] As shown in Figure 314 daytime gc and the O3
72
01 05 50 500
020
4060
8010
0
0 1000 2000 30000 1000 2000 3000
020
4060
8010
0
Eddy Diffusivity K (m2 s-1) τ2 (s)
heig
ht (m
)
01 05 50 500
020
4060
8010
0
0 1000 2000 30000 1000 2000 3000
020
4060
8010
0
Eddy Diffusivity K (m2 s-1) τ2 (s)
heig
ht (m
)
Figure 312 Simple NOx photochemical canopy model inputs Eddy diffusivities are
scaled from Gao et al [1993] to the Harvard Forest canopy height of 20 m τ2 the
lifetime of NO2 against photolysis (reaction 2 NO2 + hν NO + O) scales inversely
with UV radiation τ2 was estimated for typical conditions of [O3] [NO][NO2] and
daytime UV profile under full-canopy conditions at the site The simple canopy model
also accepts an estimate of τ1 the lifetime of NO against reaction with O3 (reaction 31)
73
Concentration (nmol mol-1)
heig
ht (m
)
00 02 04 06 08 10
020
4060
8010
0
NO NO2
Normalized NOx = NO+NO2 = 1 nmol mol-1
Flux (nmol mol-1 cm s-1)
-2 -1 0 1 2-2 -1 0 1 2
020
4060
8010
0
NO NO2
Figure 313 Simple NOx photochemical canopy model outputs Left panel
concentrations of NO (dashed) and NO2 (solid) right fluxes of NO (dashed) and NO2
(solid) Symbols indicate measurement heights for NO (29 m) and NO2 (22 m) at
Harvard Forest The model solves the continuity equation for NO concentration at 200
levels ddz(-Kc(dNOdz)) = PNO ndash LNO where PNO = [NO]τ1 LNO = [NO]τ2 and zero
net deposition or emission of NOx is allowed NOx = NO + NO2 is normalized to 1 ppb
τ1 = 70s in this example Due to the measurement height difference observed upward
NO2 flux due to photochemical cycling alone should be substantially larger than observed
downward NO flux attributable to the same process
74
V(O
3) (c
m s
-1)
g c(c
m s
-1)
PPFD (mmol m-2 s-1)
00 05 10 15
-05
00
05
10
15
20
00 05 10 15
-3-2
-10
12
Figure 314 Daytime (including dawn and dusk) canopy surface conductance gc and O3
exchange velocity V(O3) vs above-canopy photosynthetic photon flux density (PPFD)
during the summer of 2000 at Harvard Forest Dots are hourly values Filled squares
represent quantile-binned means (quantiles of PPFD were used to define bins and all gc
or V(O3) for data hours falling within the bins were averaged) Both quantities are
indicators of stomatal conductance and increase in absolute value with PPFD up to a
maximum level
75
exchange velocity are both related to photosynthetic photon flux density (PPFD) The
dependence is nonlinear absolute values of gc and V(O3) increase with PPFD up to
approximately 1 mmol m-2 s-1 and level off at higher PPFD values Note that PPFD is the
only continuously-monitored measure of light intensity at Harvard Forest (as with many
ecological and trace-gas monitoring stations) and is therefore used in the discussion
below as a proxy of photochemically-active UV wavelengths at the site despite the fact
that PPFD measures only the photosynthetically-active wavelength band (400-700 nm)
For the time period when eddy covariance fluxes of both NO and NO2 were
measured (29 August-8 October 2000) Figure 315 shows that the daytime (as defined by
light level PPFD gt 001 mmol m-2 s-1) upward NO2 flux was strongly correlated with the
downward NO flux We can account for more of the variance in daytime FNO2 by using
in addition to a photochemical NOx cycling term βmiddotFNO additional terms representing a
constant deposition velocity V0middot [NO2] and a stomatal flux γmiddotgc (Table 32)
FNO2 = F0 + βmiddotFNO + V0middot [NO2] + γmiddotgc (Eq 35)
The relationship between FNO2 and FNO is significant in all of the fits as shown by the
low p-values and consistent values of β Note that an upward NO2 flux contribution
could be included as either a constant (zero order) flux term F0 or as a function of
stomatal conductance γ when F0 is constrained to zero For the F0=0 cases R2 has been
calculated as follows in order to omit the origin
)var()var(1
2
2
FNOresidualR minus= (Eq 36)
The constant deposition velocity term V0 is significant when the stomatal term is also
included in the fit A flux term dependent on the square of the NO2 concentration
a[NO2]2 (not shown in Table 32) is only marginally significant regardless of which other
terms are included in the regression
76
NO
2Fl
ux (micro
mol
m-2
hr-1
)
- NO Flux (micromol m-2 hr-1)
0 2 4 6 8 10 12
-10
010
2030
40
Figure 315 Relationship between daytime hourly FNO2 and ndashFNO 29 August to 8
October 2000 FNO2 = (05plusmn01) - (35plusmn01)middotFNO R2 = 079
77
Table 32 Regressions of daytime FNO2 (as defined by light level see above covered
hours 500 to 2000 EST) in terms of linear combinations of βmiddotFNO V0middot[NO2] and γmiddotgc
F0 is the intercept for each fit representing flux at [NO2] = FNO = gc = 0 Flux units of
(nmol mol-1 cm s-1) are used Note that FNO is largely negative (downward) so that a
negative value of β represents a positive flux term
F0 plusmn std error
(nmol mol-1 cm s-1) β plusmn std error
(dimensionless) V0 plusmn std error
(cm s-1) γ plusmn std error (nmol mol-1) R2
05plusmn01 (p-valuelt1E-4)
-35plusmn01 (p-valuelt1E-4) NA NA 079
constrained to 0 -37plusmn01 (p-valuelt1E-4) NA NA 079
07plusmn02 (p-valuelt1E-4)
-38plusmn02 (p-valuelt1E-4)
-016plusmn008 (p-value=004) NA 084
constrained to 0 -37plusmn02 (p-valuelt1E-4)
003plusmn007 (p-value=07) NA 083
01plusmn03 (p-value=06 )
-35plusmn01 (p-valuelt1E-4) NA 10plusmn04
(p-value=002) 083
constrained to 0 -35plusmn01 (p-valuelt1E-4) NA 12plusmn02
(p-valuelt1E-4) 083
04plusmn03 (p-value=02)
-38plusmn02 (p-valuelt1E-4)
-018plusmn009 (p-value=005)
09plusmn05 (p-value=008) 087
constrained to 0 -38plusmn02 (p-valuelt1E-4)
-012plusmn008 (p-value=01)
13plusmn03 (p-valuelt1E-4) 087
78
The stable statistically significant relationship between the daytime fluxes of NO
and NO2 appears to indicate that although the species were measured on nearby towers at
different heights their photochemical cycling is coherent on an hourly basis This
process clearly dominates the behavior of NOx fluxes near the forest canopy but
represents neither net deposition nor net emission The next largest term appears to be a
constant deposition velocity downward flux of NO2 Finally there is a small positive
NO2 flux component which is equally well-fit as a constant flux or a stomatal
conductance-dependent term We performed additional regressions (not shown) using a
stomatal term of the form γprimemiddotgcmiddot([NO2]-[NO2]c) where [NO2]c is the compensation point
concentration below which vegetation emits NO2 While marginally significant values of
γprime could be obtained for [NO2]c values fixed between 1 and 10 nmol mol-1 the data did
not contain enough information to determine the compensation point independently In
2000 median summerfall daytime [NO2] was 11 nmol mol-1 (75th percentile=23 nmol
mol-1) Thus the vegetation at Harvard Forest usually experiences NO2 concentrations at
or below the 05 to 15 nmol mol-1 range of previously observed compensation points for
coniferous and tropical trees in chamber studies [eg Sparks et al 2001 Rondoacuten et al
1993] It is not possible to definitively attribute the small positive flux (γmiddotgc) to a
stomatal process the term could also indicate a chemical or other process which reduces
the deposition velocity under daytime conditions
To investigate the behavior of the NO2 flux beyond the limited period of NO flux
measurements we use above-canopy PPFD as a proxy for photochemical activity for our
data when NO fluxes were not measured Figure 316 shows daytime exchange
velocities of NO and NO2 plotted against PPFD For clarity hourly points are omitted
79
00 05 10 15
-10
12
34
NO2 (h=22m) leaves onNO2 (h=22m) leaves offNO (h=29m) leaves on
Exch
ange
Vel
ocity
(cm
s-1
)
PPFD (mmol m-2 s-1)
Figure 316 Daytime emission velocities of NO2 (leaves on solid triangles
leaves off open triangles) and NO (leaves on solid circles no data for leaves off
periods) plotted against photosynthetic photon flux density (PPFD) Symbols are
medians binned by percentiles of above-canopy PPFD For clarity hourly points are not
shown V(NO2) data span spring through fall 2000 while V(NO) data were collected late
August to early October 2000 only Linear fits to binned median points (exchange
velocities in units of cm s-1 PPFD in units of mmol m-2 s-1) reported in Table 33
80
and only the PPFD quantile-binned medians are plotted For each species we determine
quantiles of PPFD for daytime hours with data These quantiles define for each trace gas
species the measurement hours whose median values are shown The coupling of the bi-
directional NOx fluxes becomes more intense as the difference in light intensity from
above- to below-canopy increases during periods of high above-canopy illumination
cycling ceases as light intensity and therefore light gradient declines NO2 flux data are
segregated into full-canopy (leaves on) conditions from early June to mid-October and
leafless periods in April-May and October-November Linear regressions to the
percentile-binned medians of PPFD (V = VPPFD=0 + bmiddotPPFD) yield the following
relationships for the daytime data shown in Table 33
Before leaf-out and after leaf-fall the coefficient of PPFD in the NO2 regression
is smaller than for full-canopy conditions This expected since the leaf area index at
Harvard Forest at mid-summer is approximately 34 [Munger et al 1996] whereas the
area index for bare stems and twigs is only 09 [Barford et al 2001] The light gradient
for leaves-off conditions is smaller resulting in smaller concentration gradients and
reduced coupled NOx fluxes It is also likely that NO2 emission by the leaves contributes
to the increased slope of VNO2 vs PPFD when the canopy is developed
NO is not expected to deposit to surfaces in large amounts though there is very
little experimental evidence [Hanson et al 1991 Wesely and Hicks 2000] Soil NO
emission at Harvard Forest is small less than 09 micromol m-2 hr-1 [Munger et al 1996]
making NO unlikely to escape from the canopy before conversion to NO2 Thus the NO
flux at Harvard Forest is dominated by photochemical cycling and can be parameterized
as a function of PPFD and [NO] Coefficients for least squares fits to hourly daytime
FNO data (measurement height = 29m 29 Aug-8 Oct 2000) are shown in Table 34
81
Table 33 Linear regression of daytime percentile-binned median VNO2 and VNO
against of PPFD
VPPFD=0 plusmn std error
cm s-1 b plusmn std error
cm s-1 (mmol m-2 s-1)-1 R2
VNO2 leaves on -04 plusmn 01 (p-value=002)
27 plusmn 02 (p-valuelt1E-4) 097
VNO2 leaves off -01 plusmn 01 (p-value=03)
15 plusmn 02 (p-valuelt1E-4) 090
VNO leaves on -042 plusmn 007 (p-value=4E-4)
-05plusmn01 (p-value=7E-4) 078
82
Table 34 Regressions results for daytime FNO = F0_NO + V0_NO [NO] + bprime PPFD [NO]
F0_NO plusmn std error
(nmol mol-1 cm s-1)
bprime plusmn std error cm s-1 (mmol m-2 s-1)-1
V0_NO plusmn std error (cm s-1) R2
-008plusmn001 (p-valuelt1E-4)
-110plusmn002 (p-valuelt1E-4) NA 091
Constrained to 0
-114plusmn002 (p-valuelt1E-4)
NA 091
-006plusmn001
(p-valuelt1E-4)
-092plusmn004
(p-valuelt1E-4)
-018plusmn004
(p-valuelt1E-4) 091
Constrained to 0
-087plusmn004 (p-valuelt1E-4)
-025plusmn003
(p-valuelt1E-4) 091
83
To treat the larger daytime NO2 flux dataset we combine a terms representing the
light dependence shown in Figure 316 constant deposition velocity and stomatal
conductance Because gc was calculated assuming the presence of leaves we use the
measured deposition velocity of O3 Vd(O3) = -V(O3) as a proxy for the stomatal opening
from early spring through late fall Table 35 shows the results for the regressions using
these terms
A quadratic term amiddot[NO2]2 is not statistically significant when included because
we have few measurements with sufficiently high NO2 concentrations We interpret the
term (b+f)middotPPFDmiddot[NO2] as approximately accounting for the NO2 flux that arises from
photochemical cycling with NO (b+f) agrees well with the coefficients found in Table
33 As in the limited dataset regressions using FNO instead of PPFD (Table 32) V0
indicates an exchange velocity for NO2 on the order of -03 cm s-1 (downward) Given
the robust appearance of this term with different fit parameters for both limited and full
datasets we find it likely that V0 represents a roughly constant deposition velocity
process independent of NOx photochemical cycling during the day Though statistical
significance is low an upward flux term associated with stomatal conductance or related
variables also appears in Table 35
343 Parameterization of NOx Fluxes
Both nighttime and daytime NOx fluxes can be combined into a single
parameterization based on the above discussion This framework adopts the hypothesis
that photochemical NO-NO2 cycling can be largely accounted for by a simple light-
dependent term and that net deposition may then be estimated from additional terms
representing constant exchange velocity concentration-dependent exchange velocity and
84
Table 35 Multi-factor regression using all hourly daytime FNO2 data following the
functional form FNO2 = (b+f)middotPPFDmiddot[NO2] + V0 [NO2] + ΓmiddotVd(O3) The intercepts for all
fits have been constrained to zero The parameter f is a canopy flag set to zero for full-
canopy conditions so may be considered a correction to the PPFD term for leaves-off
periods in early spring and late fall
b plusmn std error cm s-1 (mmol m-2 s-1)-1
f plusmn std error cm s-1 (mmol m-2 s-1)-1
= 0 for leaves on V0 plusmn std error
(cm s-1) Γ plusmn std error (nmol mol-1) R2
196plusmn007 (p-valuelt1E-4)
-13plusmn01 (p-valuelt1E-4) NA NA 055
240plusmn009
(p-valueltlt1E-4)
-132plusmn009 (p-valuelt1E-4)
-035plusmn005 (p-valuelt1E-4) NA 060
196plusmn008 (p-valuelt1E-4)
-11plusmn01 (p-valuelt1E-4) NA 01plusmn01
(p-value=04) 062
229plusmn009 (p-valuelt1E-4)
-11plusmn01 (p-valuelt1E-4)
-030plusmn005 (p-valuelt1E-4)
03plusmn01 (p-value=003) 065
85
stomatal conductance-related exchange processes Thus for the height of 22 m relative to
the 20 m canopy the flux of NO2 day and night is given by the simple function of NO2
concentration PPFD and O3 deposition velocity
FNO2 = V0 middot [NO2] + amiddot[NO2]2 + (b+f)middotPPFDmiddot[NO2] + ΓmiddotVd(O3) (Eq 37)
where f is added to the coefficient of PPFD to account for the observed difference
between full-canopy and leaves-off conditions
NO is not present in significant quantities at night and FNO appears to be driven
by a simple dependence on PPFD during the day We include a constant deposition
velocity term as well since evidence of NO deposition to surfaces is weak and
inconclusive At a measurement height of 29 m the flux of NO is given by
FNO = V0_NO middot [NO] + bprime middot PPFD middot [NO] (Eq 38)
The net fluxes of NO and NO2 may be determined by omitting the photochemical terms
from Eq 37 and 38 Since we expect the deposition velocity of NO to be small
FNOx(net)asympFNO2(net)
FNOx(net) asymp V0 middot [NO2] + amiddot[NO2]2 + ΓmiddotVd(O3) (Eq 39)
Multi-factor regressions for Eq 37 and Eq 38 were performed to determine the
coefficients V0 a b f V0_NO and brsquo using all available hourly observations of [NO2]
[NO] PPFD Vd(O3) FNO2 and FNO at Harvard Forest April-November 2000 The
results are presented in Table 36 along with the range of results from the separate
daytime and nighttime analyses discussed earlier
86
Table 36 Multi-factor regressions using all available hourly observations of [NO2]
[NO] PPFD Vd(O3) FNO2 and FNO at Harvard Forest April-November 2000 Note
that Vd(O3)=deposition velocity positive values indicate downward O3 exchange
velocity
z = 22m FNO2 = V0 middot [NO2] + a middot [NO2]2 + (b+f)middotPPFDmiddot[NO2] + Γ middot Vd(O3)
coeff plusmn std err p-value
April ndash November 2000 (R2 = 060)
Range of results from separate day and night analyses
V0 (cm s-1) -021plusmn004 lt1E-4 -03 to -001
a (nmol-1 mol cm s-1) -0002plusmn0004dagger 06 -0013 to ndash0002
b (cm s-1 (mmol m-2 s-1)-1) 221plusmn007 lt1E-4 19 to 24
f (cm s-1 (mmol m-2 s-1)-1) =0 for leaves-on -110plusmn009 lt1E-4 -13 to -10
Γ (nmol mol-1) 021plusmn009 002 01 to 03
z = 29m FNO = V0_NO middot [NO] + bprime middot PPFD middot [NO]
29 August ndash 8 Oct 2000 (R2 = 092)
V0_NO (cm s-1) -025plusmn002 lt1E-4 -087 to -042
bprime (cm s-1 (mmol m-2 s-1)-1) -087plusmn003 lt1E-4 -114 to -05
daggerThe more statistically robust nighttime a =-0013 plusmn 0001 (Table 31) is recommended
87
Nearly all of the coefficients fall within the ranges determined previously except
V0 and V0_NO which differ only slightly from the earlier values As illustrated in Figures
317 and 318 Eq 37 and Eq 38 with the multi-factor regression coefficients in Table
36 are good predictors of the measured fluxes over their entire dynamic ranges and for
all sampled conditions
The diel variations of fluxes and residuals from this parameterization (Figure
319) reveal several interesting features The parameterization captures the overall diel
behavior of both NO and NO2 fluxes It also tends to underestimate the upward flux of
[NO2] during the day for northwesterly flow conditions and to slightly overestimate
during daytime southwesterly flows The disagreement rarely exceeds the 25th and 75th
quantiles of the measured fluxes The dominant flow regimes at Harvard Forest differ in
a number of key respects that may affect this result Northwesterly conditions tend to
bring lower concentrations of reactive nitrogen species cooler temperatures drier
weather and clearer skies than southwest winds [Moody et al 1998] It is possible that
one or more of these factors is contributing to the wind-sector difference in the residuals
One might expect that the residuals would depend on additional factors not taken
into consideration For example mixing and therefore deposition depends on the friction
velocity u (m s-1) As shown in figure 320 the residual NO2 flux tends upward only at
the highest u quantiles during the day and has no significant trend at night Similarly
the temperature-dependent rate for (R31) k1(T)[O3] has not been included yet we find
that the NO2 flux residuals exhibit no statistically significant trend with k1(T)[O3] (Figure
321) Although included as terms in the paratmeterization similar residual analyses are
shown for V(O3) during the day (Figure 321) and for [NO2] during the day and night
(Figure 322) The distinctly different daytime and nighttime behavior of the total NO2
flux is apparent again in Figure 322 as are the small residuals overall
88
Res
idua
l (M
es ndash
Para
m)
FN
O2
(nm
ol m
ol-1
cm s
-1)
Parameterized FNO2 (nmol mol-1 cm s-1)
Mea
sure
d FN
O2
(nm
ol m
ol-1
cm s
-1)
FNO2 = V0middot[NO2] + amiddot[NO2]2 + (b+f)middotPPFDmiddot[NO2] + ΓmiddotVd(O3)
Daytime +Nighttime
11
-20 -10 0 10 20 30
-20
-10
010
2030
Quantiles of Standard Normal
-2 0 2
-10
-50
510
Figure 317 Upper Measured vs parameterized NO2 flux shown with 11 line daytime
(+) and nighttime () The functional form the parameterization is shown at the top
Lower Residuals of FNO2 vs quantiles of the standard normal The residuals are
normally-distributed with extended upper and lower wings
89
-10 -8 -6 -4 -2 0 2
-10
-8-6
-4-2
02
Quantiles of Standard Normal
-2 0 2
-10
-05
00
05
10
15
Mea
sure
d FN
O (n
mol
mol
-1cm
s-1
)
Res
idua
l (M
es ndash
Para
m)
FN
O (n
mol
mol
-1cm
s-1)
Parameterized FNO (nmol mol-1 cm s-1)
FNO = V0_NOmiddot[NO] + b middotPPFDmiddot[NO]
11
Figure 318 Same as Figure 317 for FNO
90
Fl
ux (n
mol
mol
-1cm
s-1
)R
esid
ual (
nmol
mol
-1cm
s-1
)Measured FNO (h=22m)Measured FNO2 (h=22m)Parameterized FNOParameterized FNO2
Meas-Param FNOMeas-Param FNO2
-20
24
-20
24
NW
0 5 10 15 20
-2-1
01
2-2
-10
12
-20
24
-20
24
SW
0 5 10 15 20
-2-1
01
2-2
-10
12
Hour
Figure 319 Top panels Median diel measured (closed symbols solid lines) and
parameterized (open symbols dashed lines) fluxes of NO2 and NO Vertical bars show
the 25th and 75th quantiles for the measurements Lower panels Median diel residual
(measured-parameterized) FNO2 and FNO Northwest wind conditions are shown on the
left southwest on the right The parameterizations capture the daytime behavior of NO
flux due to the photochemical gradient and eddy diffusivity effects For NO2 under
northwesterly conditions the daytime residual is positive indicating that the
parameterization underestimates upward flux of NO2 For southwesterly conditions
daytime NO2 flux residuals are more variable and tend in the opposite direction
91
DAY NIGHT
FNO
2(n
mol
mol
-1cm
s-1
)R
esid
ual F
NO
2(n
mol
mol
-1cm
s-1
)
FNO
2(n
mol
mol
-1cm
s-1
)R
esid
ual F
NO
2(n
mol
mol
-1cm
s-1
)
Res
idua
l FN
O2
(nm
ol m
ol-1
cm s
-1)
Measured FNO2
Parameterized FNO2
Res
idua
l FN
O2
(nm
ol m
ol-1
cm s
-1)
u (m s-1) u (m s-1)
u (m s-1) u (m s-1)
-10
-50
510
00 05 10 15
-10
-50
510
-10
-50
510
00 05 10 15
-10
-50
510
00 02 04 06 08 10 12 14
-20
2
00 02 04 06 08 10 12 14
-20
2
Figure 320 From top to bottom measured and parameterized NO2 fluxes residuals
(measured-parameterized) and expanded-axes quantile-binned mean residuals (plusmn
standard deviation) vs u shown for daytime on the left and nighttime on the right
92
DAY k1(T)[O3] Day V(O3)
FNO
2(n
mol
mol
-1cm
s-1
)R
esid
ual F
NO
2(n
mol
mol
-1cm
s-1
)
FNO
2(n
mol
mol
-1cm
s-1
)R
esid
ual F
NO
2(n
mol
mol
-1cm
s-1
)
Res
idua
l FN
O2
(nm
ol m
ol-1
cm s
-1)
Measured FNO2
Parameterized FNO2
Res
idua
l FN
O2
(nm
ol m
ol-1
cm s
-1)
k1(T)[O3] (s-1) V(O3) (cm s-1)
k1(T)[O3] (s-1) V(O3) (cm s-1)
-10
010
2030
001 002 003 004
-10
-50
510
-10
010
2030
-003 -002 -001 00 001
-10
-50
510
0005 0010 0015 0020 0025 0030
-3-2
-10
12
-0015 -0010 -0005 00
-3-2
-10
12
Figure 321 Same as Figure 321 for daytime k1(T)[O3] (left) and daytime V(O3) (right)
93
DAY NIGHT
FNO
2(n
mol
mol
-1cm
s-1
)R
esid
ual F
NO
2(n
mol
mol
-1cm
s-1
)
FNO
2(n
mol
mol
-1cm
s-1
)R
esid
ual F
NO
2(n
mol
mol
-1cm
s-1
)
Res
idua
l FN
O2
(nm
ol m
ol-1
cm s
-1)
Measured FNO2
Parameterized FNO2
Res
idua
l FN
O2
(nm
ol m
ol-1
cm s
-1)
[NO2] (nmol mol-1) [NO2] (nmol mol-1)
[NO2] (nmol mol-1) [NO2] (nmol mol-1)
-10
010
2030
0 5 10 15 20
-10
-50
510
-20
-15
-10
-50
510
0 5 10 15 20
-10
-50
510
0 2 4 6 8
-3-2
-10
12
0 2 4 6 8 10 12
-20
24
Figure 322 Same as Figure 321 for [NO2] during the daytime (left) and nighttime
(right)
94
The lack of robust trends in the NO2 flux residuals indicates that within the
limitations of the dataset Eq 37 captures the crucial aspects of observed NO2 flux
behavior within and above the tall forest canopy under a wide range of conditions
Similarly Eq 38 accounts for 92 of the observed variance in the measured NO fluxes
under a somewhat narrower set of conditions (the sampling period for NO eddy
covariance flux measurements was relatively short) Figure 323 shows the resulting net
NOx flux (Eq 39 Table 36) and exchange velocity VNOx(net)=FNOx(net)[NO2] on a
diel basis for the sampling period April-November 2000 For the rural low-NOx
conditions at Harvard Forest we find that the flux of NOx is downward at all hours with
a deposition velocity of approximately 02 cm s-1
35 Conclusions
We installed a Tunable Diode Laser Absorption Spectrometer (TDLAS) to
measure continuous NO2 concentrations and eddy covariance fluxes above the canopy at
Harvard Forest during the spring summer and fall of 2000 An existing
chemiluminescence NO detector was configured to measure above-canopy eddy
covariance fluxes for a shorter period in the late summer and early fall A photolysis-
chemiluminescence (P-C) NO2 instrument also measured concentrations for a portion of
the sampling period Hourly average TDLAS and P-C NO2 concentrations agreed very
well under all conditions The agreement between the two instruments in the field and
the independent spectroscopic calibration of the TDLAS validated the long-term
measurements of the tank-calibrated P-C system
95
0 6 12 18
-10
-08
-06
-04
-02
00
-14
-12
-10
-08
-06
-04
-02
00
Net
FN
Ox
(nm
ol m
ol-1
cm s
-1)
(microm
ol m
-2hr
-1)
Net
VN
Ox
(cm
s-1
)
Hour
median| 25th amp 75th percentiles
0 6 12 18
-024
-022
-020
-018
Figure 323 Diel cycle of parameterized net NOx exchange velocity (upper panel) and
flux (lower panel) April-November 2000 FNOx(net) asymp FNO2(net) = V0middot[NO2] +
amiddot[NO2]2 + ΓmiddotVd(O3) VNOx(net) = FNO2(net)[NO2]
96
At night in the absence of significant quantities of NO we observed a consistent
downward flux of NO2 which depended quadratically on the concentration of NO2
although the dependence was apparent mainly on two nights when [NO2] was above 10
nmol mol-1 The nighttime NO2 deposition velocity varied between 02 cm s-1 at [NO2]=1
nmol mol-1 and 05 cm s-1 at [NO2]=30 nmol mol-1 These fluxes could come from direct
NO2 deposition to non-stomatal surfaces in the forest such as soil litter bark and the
outer surfaces of leaves area-normalized deposition velocities to such surfaces in
chamber measurements have varied from less than 01 to 05 cm s-1 for NO2
concentrations between 40 and 80 nmol mol-1 [Hanson and Lindberg 1991] The rate of
heterogeneous N2O5 hydrolysis resulting in aqueous-phase HNO3 (unlikely to re-enter the
gas phase) is insufficient to explain the observed nighttime NO2 deposition rates The
quadratic flux dependence and similarity to the behavior of HONO observed at other sites
suggests that heterogeneous NO2 hydrolysis may also play a significant role in NO2
deposition [Harrison and Kitto 1994 Harrison et al 1996 Barney and Finlayson-Pitts
2000] Half of any NO2 flux due to heterogeneous NO2 hydrolysis would likely escape
from the surfaces as gas-phase HONO potentially impacting the daytime HOx and NOx
budgets when photolyzed at sunrise
During the day we observed coupled fluxes of NO2 (upward) and NO
(downward) due to photochemical cycling driven by canopy-induced light and eddy
diffusivity gradients The imbalance in the observed fluxes corresponded to the
difference in height of the sampling levels relative to the canopy The exchange
velocities of the two species in their respective directions increased with higher above-
canopy light levels as measured by photosynthetic photon flux density (PPFD) due to the
97
stronger light gradient through the canopy under brighter conditions Upward NO2
velocity was smaller in early spring and late fall when there were no leaves on the trees
corresponding to a weaker light gradient condition (NO fluxes were only measured
during full-canopy conditions) and possibly to the absence of stomata-dependent
emission of NO2 We believe that these coupled fluxes are the first to be reported from a
mature tall-canopy site using reliable eddy-covariance appropriate sampling techniques
All of the NO and NO2 flux data day and night were well explained by a simple
parameterization consisting of two equations FNO2 = V0 middot [NO2] + amiddot[NO2]2 +
(b+f)middotPPFDmiddot[NO2] + ΓmiddotVd(O3) and FNO = V0_NO middot [NO] + bprime middot PPFD middot [NO] The net flux
of NOx is approximately equal to the flux of NO2 omitting the PPFD-dependent term
FNOxasympV0 middot [NO2] + amiddot[NO2]2 + ΓmiddotVd(O3) V0 and V0_NO are small constant deposition
velocity terms b and bprime are coefficients of light-dependent coupled fluxes for full-canopy
conditions and f adjusts the NO2 light-dependent term for no-leaves conditions The
deposition velocity of O3 was used as a proxy for stomatal exchange the coefficient Γ
was consistently positive Stomatal conductance correlates with a number of different
variables (light temperature humidity) complicating the interpretation of the final term
It may indicate a stomatal emission of NO2 under low-NOx conditions typical at Harvard
Forest but could also correspond to a chemical or other process which slows NO2
deposition during the day The quadratic term amiddot[NO2]2 was particularly significant at
night during a few high-[NO2] events Multi-factor regressions fitting the hourly data
with these equations yield R2 of 061 for FNO2 and 092 for FNO the coefficients
summarized in Table 36 agree with analyses of segregated daytime and nighttime data
We note that the coefficients are relevant to the specific measurement heights of NO (29
98
m) and NO2 (22 m) at Harvard Forest relative to the forest canopy height (20 m)
However the mechanism should be adaptable for more general application
During the measurement period net NO2 deposition velocity (omitting the PPFD-
dependent term associated with photochemical cycling of NOx) -(V0 + amiddot[NO2] +
ΓmiddotVd(O3)[NO2]) was between 015 and 03 cm s-1 The mean 02 cm s-1 varied by less
than 002 cm s-1 between day and night and between full-canopy and leafless conditions
NO2 deposition velocity measurements to deciduous forest canopies are scarce this result
falls just outside of the range of reported values for coniferous forests 01 to 15 cm s-1
[Hanson and Lindberg 1991 Rondoacuten et al 1993 Joss and Graber 1996] and short
crops such as alfalfa soy and oats 007 to 125 cm s-1 [Hanson and Lindberg 1991]
The only estimates of NO deposition velocity are over grass ~01 to 02 cm s-1 [Hanson
and Lindberg 1991] other observations indicate NO emission from various species
though soil emissions could confound these results [Wildt et al 1997] This is quite
close to the ~025 cm s-1 NO deposition velocity at Harvard Forest (-V0_NO) but we
cannot resolve the debate as to whether NO deposits at all [Wesely and Hicks 2000]
Concentration and flux measurements of HONO N2O5 and NO3 (along with NO
and NO2) are required to better understand the nighttime chemistry and deposition of
NOx Recently-developed continuous analyzers for HONO [Harrison et al 1996] and N-
2O5 and NO3 [Brown et al 2001] may make these measurements possible in the coming
years In addition the use of flux chambers with a TDLAS or other instrument (sub-
nmol mol-1 sensitivity and species-specific detection method) on leaf litter and soil
samples in the lab and field may facilitate direct detection of NO2 compensation points
for various species and quantify the importance of different natural surfaces
99
NOx deposition matters to both the ecosystem and the atmosphere the form of
nitrogen entering plants affects nutrient loading acid stress and toxicity and the form of
nitrogen leaving the atmosphere affects O3 production HOx chemistry and long-range
transport of anthropogenic pollutants We are hopeful that future research endeavors will
approach the problem from the perspective of both ecosystem and atmosphere at scales
ranging from the individual leaf to the vegetated landscape using reliable species-
specific and sensitive measurement techniques
References
Andreacutes-Hernaacutendez J Notholt J Hjorth and O Schrems A DOAS study on the origin of initrous acid at urban and non-urban sites Atmos Environ 30 175-180 1996
Aneja V P P A Roelle G C Murray J Southerland J W Erisman D Fowler W A H Asman and N Patni Atmospheric nitrogen compounds II emissions transport transformation deposition and assessment Atmos Environ 35 1903-1911 2001
Barford C E Hammond Pyle L Hutyra S Wofsy Ecological Measurements to compliment eddy-flux measurements at Harvard Forest [Online data archive] httpwww-asharvardedudatanigec-datahtml 2001
Barnet W S and B J Finlayson-Pitts Enhancement of N2O4 on porous glass at room temperature A key intermediate in the heterogeneous hydrolysis of NO2 J Phys Chem A 104 171-175 2000
Barney W S and B J Finlayson-Pitts Enhancement of N2O4 on Porous Glass at Room Temperature A Key Intermediate in the Heterogeneous Hydrolysis of NO2 J Phys Chem A 104 171-175 2000
Bey I D J Jacob R Yantosca J logan B Field A Fiore Q Li H Liu L Mickley M Schultz Global modeling of tropospheric chemistry with assimilated meteorology Model description and evaluation in press J Geophys Res 2001
Brown S H Stark S J Ciciora and A R Ravishankara In-situ measurement of atmospheric NO3 and N2O5 via cavity ring-down spectroscopy Geophys Res Lett 28 3237-3230 2001 (a)
100
Brown S H Stark S J Ciciora and A R Ravishankara In-situ Detection of Atmospheric NO3 and N2O5 via Cavity Ring-Down Spectroscopy EOS Trans AGU 82 Fall Meeting Suppl A41B-0045 2001 (b)
Coe H and M W Gallagher Measurements of dry deposition of NO2 to a Dutch heathland using the eddy-correlation technique Q J R Meteorol Soc118 767-786 1992
Delaney A C D R Fitzjarrald D H Lenschow R Pearson Jr G J Wendel B Woodruff Direct Measurements of Nitrogen Oxides and Ozone Fluxes over Grassland J Atmos Chem 4 429-444 1986
Eugster W and R Hesterberg Transfer resistances of NO2 determined from eddy correlation flux measurements over a litter meadow at a rural site on the Swiss plateau Atmos Environ 30 1247-1254 1996
Fitzjarrald D R and D H Lenschow Mean concentration and flux profiles for chemically reactive species in the atmospheric surface layer Atmos Environ 17 2505-2512 1983
Galmarini S P G Duynkerke J Vila-Guerau De Arellano Evolution of Nitrogen Oxide Chemistry in the Nocturnal Boundary Layer J Appl Meteorology 36 943-957 1997
Gao W M L Wesely P V Doskey Numerical Modeling of the Turbulent Diffusion and Chemistry of NOx O3 Isoprene and Other Reactive Trace Gases in and Above a Forest Canopy J Geophys Res 98 18339-18353 1993
Gao W and M L Wesely Numerical Modeling of the Turbulent Fluxes of Chemically Reactive Trace Gases in the Atmospheric Boundary Layer J Appl Meteorology 33 835-847 1994
Goodman A L G M Underwood and V H Grassian Heterogeneous Reaction of NO2 Characterization of Gas-Phase and Adsorbed Products from the Reaction 2NO2(g) + H2O(a) HONO(g) + HNO3(a) on Hydrated Silica Particles J Phys Chem A 103 7217-7223 1999
Goulden ML JW Munger S-M Fan B C Daube and S C Wofsy Measurements of carbon sequestration by long-term eddy covariance Methods and a critical evaluation of accuracy Global Change Biology 2 169-182 1996
Harrison R M A-M N Kitto Evidence for a surface source of atmospheric nitrous acid Atmos Environ 28 1089-1094 1994
Harrison R M J D Peak G M Collins Tropospheric cycle of nitrous acid J Geophys Res 101 14429-14439 1996
101
Heal M R B B B Booth J N Cape K J Hargreaves The influence of simplified peroxy radical chemistry on the interpretation of NO2-NO-O3 surface exchange Atmos Environ 35 1687-1696 2001
Horii C V M S Zahniser D D Nelson J B McManus S C Wofsy Nitric Acid and Nitrogen Dioxide Flux Measurements a New Application of Tunable Diode Laser Absorption Spectroscopy Proc of SPIE 3758 152-161 1999
Hosker R P Jr and S E Lindberg Review Atmospheric deposition and plant assimilation of gases and particles Atmos Environ 16 889-910 1982
Hanson P and S E Lindberg Dry deposition of reactive nitrogen compounds a review of leaf canopy and non-foliar measurements Atmos Environ 25A 1615-1634 1991
Jacob D J Heterogeneous chemistry and tropospheric ozone Atmos Environ 34 2131-2159 2000
Joss U and W K Graber Profiles and Simulated Exchange of H2O O3 NO2 Between the Atmosphere and the HartX Scots Pine Plantation Theor Appl Climatol 53 157-172 1996
Lefer B L and R W Talbot Nitric acid and ammonia at a rural northeaster US site J Geophys Res 104 1645-1661 1999
Lerdau M T J W Munger D J Jacob The NO2 Flux Conumdrum Science289 2291-2293 2000
Moody J L J W Munger A H Goldstein D J Jacob and S C Wofsy Harvard Forest regional-scale air mass composition by Patterns in Atmospheric Transport History (PATH) J Geophys Res 103 13181-13194 1998
Munger J W S C Wofsy P S Bakwin S-M Fan M L Goulden B C Daube and A H Goldstein Atmospheric deposition of reactive nitrogen oxides and ozone in a temperate deciduous forest and a subarctic woodland 1 Measurements and mechanisms J Geophys Res 101 12639-12657 1996
Munger J W S-M Fan P S Bakwin M L Goulden A H Goldstein A S Colman and S C Wofsy Regional budgets for nitrogen oxides from continental sources Variations of rates for oxidation and deposition with season and distance from source regions J Geophys Res 103 8355-8368 1998
Notholt J J Hjorth and F Raes Formation of HNO2 on aerosol surfaces during foggy periods in the presence of NO and NO2 Atmos Environ 26A 211-217 1992
Padro J Zhang L and W J Massman An analysis of measurements and modlling of air-surface exchange of NO-NO2-O3 over grass Atmos Environ 32 1365-1375 1998
102
103
Rondon A C Johansson L Granat Dry Deposition of Nitrogen Dioxide and Ozone to Coniferous Forests J Geophys Res 98 5159-5172 1993
Rothman LS et al The HITRAN molecular spectroscopic database and HAWKS (HITRAN Atmospheric Workstation) 1996 Edition J Quant Spectrosc Radiat Transfer 60 665-710 1998
Sparks J P R K Monson K L Sparks M Lerdau Leaf uptake of nitrogen dioxide (NO2) in a tropical wet forest implications for tropospheric chemistry Oecologia 127 214-221 2001
Stocker D W D H Stedman K F Zeller W J Massman D G Fox Fluxes of Nitrogen Oxides and Ozone Measured by Eddy Correlation Over a Shortgrass Prairie J Geophys Res 98 12619-12630 1993
Walton S M W Gallagher T W Choularton J Duyzer Ozone and NO2 Exchange to Fruit Orchards Atmos Environ 31 2767-2776 1997
Wesely M L J A Eastman D H Stedman E D Yalvac An eddy-correlation measurement of NO2 flux to vegetation and comparison to O3 flux Atmos Environ 16 815-820 1982
Wesely M L Parameterization of surface resistances to gaseous dry deposition in regional-scale numerical models Atmos Environ 23 1293-1304 1989
Wesley M L and B B Hicks A review of the current status of knowledge on dry deposition Atmos Environ 34 2261-2282 2000
Wildt J D Kley A Rockel P Rockel H J Schneider Emission of NO from several higher plant species J Geophys Res 102 5919-5927 1997
- April ndash November 2000
- G (nmol mol-1)
- 29 August ndash 8 Oct 2000
- References
- Chapter3_NOx_Part2pdf
-
- 34 Discussion
-
- Chapter3_NOx_Part1pdf
-
- 32 Methods
- 33 Results
-

02
46
80
24
68
NW
Hour
0 6 12 18
-4-2
02
4
02
46
80
24
68
SW
Hour
0 6 12 18
-4-2
02
4
[NO][NO2][O3]10
FNOFNO2FO310
Flux
(microm
ol m
-2hr
-1)
Con
cent
ratio
n (n
mol
mol
-1)
Figure 36 Diel cycles of median concentrations (upper panels) and fluxes (lower
panels) for the Northwest (2700-450 left panels) and Southwest (1800-2700 right panels)
wind sectors at Harvard Forest April-November 2000 for NO NO2 and O310 NO and
O3 were sampled at a height of 29 m and NO2 at 22 m Vertical bars indicate 25th and
27th quartiles for NO and NO2 measurements NO2 concentration and nighttime
deposition are enhanced under southwesterly conditions as are O3 and the morning NO
maximum
58
34 Discussion
In the following sections we examine relationships of fluxes and concentrations
for various conditions and species The generalized exchange velocity for a species
(fluxconcentration) allows fluxes to be compared in a normalized form In order to
remain consistent with the flux sign convention used herein we define positive exchange
velocity at the sampling height as upward (in the direction of emission) and negative
exchange velocity as downward (in the direction of deposition) regardless of whether the
process represents net emission or deposition to the surface To facilitate the calculation
of exchange velocity in units of cm s-1 we express flux in units of concentration times
velocity (nmol mol-1 cm s-1) which is also the actual quantity measured by the
instrumentation The conversion to SI flux units is 1 nmol mol-1 cm s-1 = 1606 micromol m-2
hr-1 (STP) Temperature and pressure corrections to this conversion have been taken into
account in the following analyses
341 Nighttime Deposition of NO2
At night NO concentration and flux fall to near zero photochemical cycling
ceases and the NO2 flux should capture total NOx exchange The observed nighttime
NO2 flux was generally small Figure 37 shows that nighttime NO2 flux depends
quadratically on [NO2] A polynomial regression of the form FNO2 = F0 + V0 [NO2] + a
[NO2]2 gives the results in Table 31
The quadratic dependence in the regression is largely driven by the two nights
during the sampling period when the median concentration of NO2 was above 10 nmol
mol-1 excluding these nights the parameter a is not statistically significant
59
0 5 10 15 20 25 30
-20
-15
-10
-50
5 Hourly Data (fitted)Nightly Medians +
[NO2] (nmol mol-1)
NO
2Fl
ux (n
mol
mol
-1cm
s-1
)FNO2(night) = F0 + V0 [NO2] + a [NO2]2
F0 = 0V0 = -008 plusmn 003 (cm s-1)a = -0013 plusmn 0001 (nmol-1 mol cm s-1)
R2 = 063
Figure 37 Nighttime hourly (dots) and median nightly (pluses) NO2 flux vs
concentration with results of least-squares fit on the hourly data (curve) The flux is
expressed in units of concentration times velocity (nmol mol-1 cm s-1) in order to simplify
the interpretation of the coefficients in the least-squares fit Pressure and temperature
corrections have been taken into account in the conversion from density to mixing ratio
60
Table 31 Polynomial regression results for nighttime FNO2 = F0 + V0 [NO2] + a [NO2]2
F0 plusmn std error (nmol mol-1 cm s-1)
V0 plusmn std error (cm s-1)
a plusmn std error (nmol-1 mol cm s-1) R2
-02 plusmn 01 (p-value=007)
-001 plusmn 005 (p-value=08)
-0015 plusmn 0002 (p-valuelt1E-4) 060
All Hourly Data
Constrained to 0 -008 plusmn 003
(p-value=001)
-0013 plusmn 0001 (p-valueltlt1E-4) 060
-02 plusmn 01 (p-value=01)
-002 plusmn 01
(p-value=09)
-0014 plusmn 0002 (p-value=03) 003
[NO2]le10 nmol mol-1
Constrained to 0 -016 plusmn 006
(p-value=0005)
-0002 plusmn 001 (p-value=09) 003
-02 plusmn 02 (p-value=03)
-002 plusmn 006
(p-value=07)
-0015 plusmn 0002 (p-valuelt1E-4) 063
[NO2] ge1 nmol mol-1
Constrained to 0 -007 plusmn 003 (p-value=0003)
-0013 plusmn 0002 (p-valuelt1E-4) 052
61
A statistically significant non-zero F0 term cannot be interpreted as a physically
meaningful result NO2 cannot deposit if its concentration is zero The polynomial
regression does not take into account potential uncertainty in [NO2] which could
introduce a bias at low values where the uncertainty in the measurement is larger than the
absolute value By excluding [NO2] lt 1 nmol mol-1 from the regression we obtain an F0
which is not significantly different from zero It is therefore useful to constrain F0 to
zero V0 is frequently indistinguishable from zero If the quadratic dependence is in fact
valid over the full range of NO2 concentrations this result implies that the nighttime
deposition velocity of NO2 increases from approximately 02 cm s-1 at [NO2]=1 nmol
mol-1 to 05 cm s-1 at [NO2]=30 nmol mol-1 The data do not support the existence of a
compensation point for NO2 at night on average NO2 continues to deposit to not emit
from the forest even at low concentrations Note that soil emission fluxes of NO are
very low at Harvard Forest less than 09 micromol m-2 hr-1 [Munger et al 1996] so the
effects of freshly emitted NO conversion to NO2 are insignificant
The downward NO2 flux measured above the forest canopy at night may arise
from direct NO2 deposition to leaves litter bark and soil but not via leaf stomata
because they are largely closed in the absence of sunlight Eugster and Hesterberg [1996]
found that NO2 deposition to a litter meadow at night encountered less resistance than O3
deposition to the same surfaces Other studies have also found significant deposition
velocities for NO2 to soil litter and bark [Hanson et al 1991 and references therein]
Non-stomatal NO2 deposition could proceed via formation and heterogeneous
hydrolysis of N2O5 on forest surfaces below the sensor height as in (R37) ndash (R39) with
formation of NO3 (R37) the rate limiting step [Jacob 2000]
62
NO2 + O3 NO3 + O2 (R37)
NO3 + NO2 + M N2O5 + M (R38)
N2O5 + H2O 2HNO3 (R39)
Since HNO3 deposits rapidly it is unlikely that much (if any) of the HNO3 produced
heterogeneously from N2O5 hydrolysis would escape from the forest in the gas phase
Recent field observations of N2O5 and NO3 at night have shown that concentrations of
N2O5 build up over the course of the night that the NO3 to N2O5 ratio closely follows the
theoretical temperature-dependent equilibrium and that accumulated N2O5 is photolyzed
at dawn to recycle NO2 [Brown et al 2001 a and b] Thus only a portion of any NO2
flux due to (R37) ndash (R39) corresponds to net loss of NOx from the atmosphere
We can estimate the maximum downward NO2 flux due to N2O5 hydrolysis by
assuming a negligible vertical NO2 concentration gradient below the sensor 100
conversion of NO3 to N2O5 and 100 hydrolysis of N2O5 below the sensor height
H=22 m These upper limits are compared to the measured fluxes in Figure 38 for
nightly median NO2 concentrations less than 10 nmol mol-1 (Eq 31)
Max FNO2 (N2O5 hydrolysis) = 2middotHmiddotP(NO3) = 2 Hmiddotk7[NO2][O3] (Eq 31)
The maximum NO2 deposition attributable to N2O5 hydrolysis depends linearly on
[NO2] a linear regression of the computed flux against concentration yields a deposition
velocity of 0048plusmn0008 cm s-1 (p-value lt 1E-4) R2 = 05 a factor of 4-10 lower than the
observed deposition velocities Noisy data prevent definitive identification of the shape
of the observed dependence at concentrations below 10 nmol mol-1 but we infer that the
N2O5 hydrolysis estimate underpredicts the observed NO2 deposition flux At higher
NO2 concentrations the N2O5 hydrolysis estimate vastly underpredicts observed NO2
63
[NO2] (nmol mol-1)
NO
2Fl
ux (n
mol
mol
-1cm
s-1
)
Max N2O5 hydrolysisNightly Medians +
0 2 4 6 8 10
-2-1
01
Figure 38 Nightly median NO2 flux vs concentration for concentrations below 10 nmol
mol-1 (pluses) The maximum contribution to NO2 deposition by N2O5 hydrolysis on
forest surfaces (boxes) was estimated by calculating the production rate of NO3 from NO
+ O3 (the vertical NO2 concentration gradient is negligible) 100 conversion of NO3 to
N2O5 and 100 N2O5 hydrolysis on forest surfaces below 22 m The linear regression of
maximum NO2 deposition due to N2O5 hydrolysis vs [NO2] indicates an upper limit
deposition velocity of 0048plusmn0008 cm s-1 due to this process (R2 = 05 p-valuelt1E-4)
64
deposition (not shown) Although N2O5 hydrolysis very likely occurs on forest surfaces
it appears to account for a small fraction (lt30) of the observed nighttime NO2
deposition
The quadratic dependence of nighttime NO2 flux on concentration could also arise
from heterogeneous hydrolysis of NO2 and production of HONO below sensor height
Observations at urban and rural sites have shown that NOx can be converted to HONO on
aerosols [Notholt et al 1992 Andreacutes-Hernaacutendez et al 1996] Although NO2 is known
to react on hydrated surfaces the mechanism and kinetics of the process are not fully
understood It appears that the most likely heterogeneous NO2 hydrolysis reaction is
(R310) [Goodman et al 1999]
2NO2(g)+ H2O(a) HONO(g) + HNO3(a) (R310)
Laboratory studies have shown first-order kinetics in NO2 for (R310) at parts-per-million
(micromol mol-1) concentrations with NO2 adsorption as the rate-limiting step but the low-
concentration kinetics are unknown The atmospheric mechanism may involve N2O4 as a
key intermediate on the surface [Barney and Finlayson-Pitts 2000] As in the N2O5
hydrolysis mechanism the aqueous-phase HNO3 produced in (R310) is not likely to be
released to the gas phase Harrison et al [1994 1996] observed upward HONO fluxes
over vegetated surfaces at NO2 concentrations above 10 ppb along with a quadratic
dependence of [HONO] on [NO2] If the observed NO2 flux at Harvard Forest is the
result of (R310) then approximately half might be released as gas-phase HONO and
would not contribute to net loss of NOx from the atmosphere The amount of
heterogeneous nighttime HONO formation at the surface is important to daytime HOx
65
chemistry because at sunrise HONO is photolyzed to deliver a burst of OH and NO to
the surface layer
The evidence for direct NO2 deposition to soil litter and bark rests on only a few
studies under ambient conditions where surfaces were likely to be hydrated and none of
which had simultaneous gas-phase HONO measurements [Eugster and Hesterberg 1996
Hanson et al 1991] Thus it is possible that a portion of reported NO2 deposition to
various surfaces proceeds via NO2 hydrolysis in which case half of the deposited NO2
would remain on the surface as HNO3 and half might re-emerge as gas-phase HONO
Nighttime N2O5 hydrolysis leads to aqueous-phase HNO3 production so that this process
is also likely to contribute to some net atmospheric NOx loss Clearly individual
measurements of HONO N2O5 and NO3 concentrations and fluxes are crucial to
unraveling the nighttime NOx budget and its impact on tropospheric HOx and O3
chemistry At Harvard Forest it appears likely that heterogeneous N2O5 and NO2
hydrolysis both contribute to the observed nighttime NO2 flux though we cannot rule
out additional processes
Nighttime concentrations and fluxes of NO2 and NOy (Figure 39) show that the
measured NO2 flux accounts for between zero and 24 of total NOy deposition with a
notable dependence on wind direction The NOy sensor detects NOx HNO3 HONO
PANs and additional species If a portion of the downward NO2 flux is balanced by an
upward HONO flux then additional NOy flux is unattributed For the northwest wind
sector where the flux budget appears to be closed within the noise of the measurements
the fractional impact on the flux budget would be larger than for southwesterly conditions
where unmeasured species account for much of the NOy deposition
66
02
46
810
12
SW
Hour
19 20 21 22 23 0 1 2 3 4
-15
-10
-50
NOyNO2+HNO3NO2
FNO2FNO2+FHNO3FNOy
Flux
(microm
ol m
-2hr
-1)
Con
cent
ratio
n (n
mol
mol
-1)
02
46
810
12
NW
Hour
19 20 21 22 23 0 1 2 3 4
-15
-10
-50
Figure 39 Nighttime medians for the northwest (left) and southwest (right) wind
sectors April-November 2000 Upper panels Concentrations of NO2 NO2+HNO3 and
NOy (with vertical bars spanning 25th and 75th quartiles) Lower panels Fluxes of NO2
NO2+HNO3 and NOy (with 25th and 75th quartiles) For northwesterly conditions NO2
accounts for 48 to 65 of nighttime NOy concentration and 0 to 24 of NOy flux For
southwesterly conditions NO2 accounts for 35 to 58 of nighttime NOy concentration
and 0 to 13 of nighttime NOy flux
67
Most atmospheric models base their NO2 deposition parameterizations on the
modified Wesely [1989] scheme in which the surface resistance for NO2 prohibits
transfer except to lush vegetation exposed to sunlight where leaf stomata are open [eg
Bey et al 2001] Thus NO2 deposition velocity in these models falls to near zero at night
over vegetation regardless of the concentration of NO2 We observed nighttime NO2
deposition to the forest dependent on concentration and we infer that the behavior of
models departs significantly from the observed processes
Figure 310 compares observed nighttime NO2 deposition velocity to 24-hour
NO2 deposition from the Harvard GEOS-CHEM model on a monthly basis for Harvard
Forest [A Fiore personal communication] The nighttime NO2 deposition velocity of the
data is approximately half the modelrsquos 24-hour mean during the months when the canopy
is fully developed Since we believe that NO2 also deposits during the day (see below)
the modelrsquos 24-hour average deposition flux in summer may be approximately correct
although the day-night variation and dependence on NO2 concentration are incorrect
The model has no deposition when trees are bare but our data clearly indicate that
deposition continues at these times This discrepancy suggests a potentially large
underestimate of NOx deposition to forested landscapes during dormant months
342 Daytime Fluxes of NO NO2 O3 and NOy
During the day (R31) ndash (R34) establish a dynamic balance between NO NO2
and O3 while deposition of NO2 and O3 onto the forest canopy and sub-canopy
68
05
04
03
02
01
00
NO
2 Dep
ositi
on V
eloc
ity (c
m s
-1)
1110987654321
Month
GEOS-CHEM Harvard Forest Inland Box24-Hour Monthly Means 1995 1997 OBSERVED Harvard Forest TDLASNighttime Monthly Median 2000
Figure 310 Comparison of 24-hour monthly mean NO2 deposition in the GEOS-CHEM
model Harvard Forest box 1995 and 1997 to the observed nighttime monthly median
NO2 deposition measured at Harvard Forest in 2000 Unlike the observations the modelrsquos
nighttime deposition velocity of NO2 drops to near zero and contributes insignificantly to
total NOx deposition
69
surfaces continues The light gradient through the canopy (see Figure 311) drives (R32)
at a faster rate above than below shifting the balance of NOx toward NO above and NO2
below the canopy height (~20 m at this site) Theoretical studies have predicted that this
photochemical effect should produce coupled upward fluxes of NO2 and downward
fluxes of NO above the forest canopy [eg Gao et al 1993] These studies have
employed large suites of chemical reactions soil NO emissions canopy isoprene
emissions and leaf-level resistance models for NO2 HNO3 O3 and H2O2 deposition
We show below that a simpler approach captures much of the observed behavior of NOx
fluxes at Harvard Forest
Dominant features of the observed daytime NO and NO2 fluxes shown in Figures
35 and 36 are their opposite signs dependence on light and apparent imbalance
Upward NO2 flux at midday is reproducibly several times larger than downward NO flux
A simple model of canopy photochemical NOx cycling reveals that this apparent
imbalance is expected based on the difference in the height of the sampling inlets for the
two gases above the canopy For a trace gas species X continuity requires that a change
in concentration d[X]dt be due to the sum of chemical production PX chemical loss ndashLX
and flux - Φ
d[X]dt = Px ndash Lx ndash Φ (Eq 32)
For NOx photochemical cycling (R31)-(R33) we simplify Eq 32 by assuming steady
state d[X]dt = 0 ignoring horizontal transport and approximating the vertical flux as Φz
= ndashKc(z) d[X(z)]dz where Kc is a vertical exchange coefficient (ldquoeddy diffusivityrdquo) We
write the production and loss terms as
131
][]][[2 τ
NONOOkLP NONO === (Eq 33)
70
25
20
15
10
5
0
heig
ht (m
)
302520151050
295-385 nm Total UV (W m-2)
Harvard Forest 04 Oct 2001Local Noon Clear Sky
EMS Profile UV TDLAS Point UV
Figure 311 Midday profile of total UV radiation at Harvard Forest At each height the
Eppley total UV radiometer was placed horizontally facing upward to measure total
(direct plus diffuse) downwelling radiation and then facing downward to measure total
upwelling radiation The points indicate the sum of total downwelling and total
upwelling UV radiation Horizontal bars show observed variability in total downwelling
+ upwelling UV irradiance at each height within approximately one meter of the
measurement tower
71
2
2222
][][
τNO
NOjPL NONO === (Eq 34)
We scaled Kc(z) from Gao et al [1993] to the height of the Harvard Forest
canopy 20 m and approximated the effect of the light gradient from Figure 311 on the
lifetime of NO2 τ2(z) as shown in Figure 312 based on measurements made manually
with an Eppley UV photometer We estimated τ1asymp70s based on median k1(T) and [O3]
for the site the vertical gradient for O3 is small between 20 and 30 m making the
constant lifetime a reasonable approximation We then solved Eq 32 for NO and NO2 to
derive a simple model of vertical transport and photochemical cycling of NOx shown in
Figure 313
This calculation clarifies the cause of the imbalance between daytime NO and
NO2 fluxes observed in the time series and diel cycles in Figures 34 and 35 Because
the concentrations and fluxes of the two species were measured at separate heights 22 m
for NO2 and 29 m for NO they sampled different points along the concentration and flux
gradients induced by reduced light conditions below the canopy The larger observed
upward NO2 flux is expected based solely on photochemical cycling at a sampling point
closer to the canopy than that of NO
In addition to NO and NO2 fluxes corresponding to photochemical cycling
between the two NO2 is likely to interact with the vegetation via stomata during daylight
hours Canopy surface conductance gc is readily calculated using the Penman-Monteith
equation [Shuttleworth et al 1984] and the measured water vapor flux at Harvard Forest
Deposition velocities for species known to deposit through stomata (ie O3) correlate
strongly with gc [Munger et al 1996] As shown in Figure 314 daytime gc and the O3
72
01 05 50 500
020
4060
8010
0
0 1000 2000 30000 1000 2000 3000
020
4060
8010
0
Eddy Diffusivity K (m2 s-1) τ2 (s)
heig
ht (m
)
01 05 50 500
020
4060
8010
0
0 1000 2000 30000 1000 2000 3000
020
4060
8010
0
Eddy Diffusivity K (m2 s-1) τ2 (s)
heig
ht (m
)
Figure 312 Simple NOx photochemical canopy model inputs Eddy diffusivities are
scaled from Gao et al [1993] to the Harvard Forest canopy height of 20 m τ2 the
lifetime of NO2 against photolysis (reaction 2 NO2 + hν NO + O) scales inversely
with UV radiation τ2 was estimated for typical conditions of [O3] [NO][NO2] and
daytime UV profile under full-canopy conditions at the site The simple canopy model
also accepts an estimate of τ1 the lifetime of NO against reaction with O3 (reaction 31)
73
Concentration (nmol mol-1)
heig
ht (m
)
00 02 04 06 08 10
020
4060
8010
0
NO NO2
Normalized NOx = NO+NO2 = 1 nmol mol-1
Flux (nmol mol-1 cm s-1)
-2 -1 0 1 2-2 -1 0 1 2
020
4060
8010
0
NO NO2
Figure 313 Simple NOx photochemical canopy model outputs Left panel
concentrations of NO (dashed) and NO2 (solid) right fluxes of NO (dashed) and NO2
(solid) Symbols indicate measurement heights for NO (29 m) and NO2 (22 m) at
Harvard Forest The model solves the continuity equation for NO concentration at 200
levels ddz(-Kc(dNOdz)) = PNO ndash LNO where PNO = [NO]τ1 LNO = [NO]τ2 and zero
net deposition or emission of NOx is allowed NOx = NO + NO2 is normalized to 1 ppb
τ1 = 70s in this example Due to the measurement height difference observed upward
NO2 flux due to photochemical cycling alone should be substantially larger than observed
downward NO flux attributable to the same process
74
V(O
3) (c
m s
-1)
g c(c
m s
-1)
PPFD (mmol m-2 s-1)
00 05 10 15
-05
00
05
10
15
20
00 05 10 15
-3-2
-10
12
Figure 314 Daytime (including dawn and dusk) canopy surface conductance gc and O3
exchange velocity V(O3) vs above-canopy photosynthetic photon flux density (PPFD)
during the summer of 2000 at Harvard Forest Dots are hourly values Filled squares
represent quantile-binned means (quantiles of PPFD were used to define bins and all gc
or V(O3) for data hours falling within the bins were averaged) Both quantities are
indicators of stomatal conductance and increase in absolute value with PPFD up to a
maximum level
75
exchange velocity are both related to photosynthetic photon flux density (PPFD) The
dependence is nonlinear absolute values of gc and V(O3) increase with PPFD up to
approximately 1 mmol m-2 s-1 and level off at higher PPFD values Note that PPFD is the
only continuously-monitored measure of light intensity at Harvard Forest (as with many
ecological and trace-gas monitoring stations) and is therefore used in the discussion
below as a proxy of photochemically-active UV wavelengths at the site despite the fact
that PPFD measures only the photosynthetically-active wavelength band (400-700 nm)
For the time period when eddy covariance fluxes of both NO and NO2 were
measured (29 August-8 October 2000) Figure 315 shows that the daytime (as defined by
light level PPFD gt 001 mmol m-2 s-1) upward NO2 flux was strongly correlated with the
downward NO flux We can account for more of the variance in daytime FNO2 by using
in addition to a photochemical NOx cycling term βmiddotFNO additional terms representing a
constant deposition velocity V0middot [NO2] and a stomatal flux γmiddotgc (Table 32)
FNO2 = F0 + βmiddotFNO + V0middot [NO2] + γmiddotgc (Eq 35)
The relationship between FNO2 and FNO is significant in all of the fits as shown by the
low p-values and consistent values of β Note that an upward NO2 flux contribution
could be included as either a constant (zero order) flux term F0 or as a function of
stomatal conductance γ when F0 is constrained to zero For the F0=0 cases R2 has been
calculated as follows in order to omit the origin
)var()var(1
2
2
FNOresidualR minus= (Eq 36)
The constant deposition velocity term V0 is significant when the stomatal term is also
included in the fit A flux term dependent on the square of the NO2 concentration
a[NO2]2 (not shown in Table 32) is only marginally significant regardless of which other
terms are included in the regression
76
NO
2Fl
ux (micro
mol
m-2
hr-1
)
- NO Flux (micromol m-2 hr-1)
0 2 4 6 8 10 12
-10
010
2030
40
Figure 315 Relationship between daytime hourly FNO2 and ndashFNO 29 August to 8
October 2000 FNO2 = (05plusmn01) - (35plusmn01)middotFNO R2 = 079
77
Table 32 Regressions of daytime FNO2 (as defined by light level see above covered
hours 500 to 2000 EST) in terms of linear combinations of βmiddotFNO V0middot[NO2] and γmiddotgc
F0 is the intercept for each fit representing flux at [NO2] = FNO = gc = 0 Flux units of
(nmol mol-1 cm s-1) are used Note that FNO is largely negative (downward) so that a
negative value of β represents a positive flux term
F0 plusmn std error
(nmol mol-1 cm s-1) β plusmn std error
(dimensionless) V0 plusmn std error
(cm s-1) γ plusmn std error (nmol mol-1) R2
05plusmn01 (p-valuelt1E-4)
-35plusmn01 (p-valuelt1E-4) NA NA 079
constrained to 0 -37plusmn01 (p-valuelt1E-4) NA NA 079
07plusmn02 (p-valuelt1E-4)
-38plusmn02 (p-valuelt1E-4)
-016plusmn008 (p-value=004) NA 084
constrained to 0 -37plusmn02 (p-valuelt1E-4)
003plusmn007 (p-value=07) NA 083
01plusmn03 (p-value=06 )
-35plusmn01 (p-valuelt1E-4) NA 10plusmn04
(p-value=002) 083
constrained to 0 -35plusmn01 (p-valuelt1E-4) NA 12plusmn02
(p-valuelt1E-4) 083
04plusmn03 (p-value=02)
-38plusmn02 (p-valuelt1E-4)
-018plusmn009 (p-value=005)
09plusmn05 (p-value=008) 087
constrained to 0 -38plusmn02 (p-valuelt1E-4)
-012plusmn008 (p-value=01)
13plusmn03 (p-valuelt1E-4) 087
78
The stable statistically significant relationship between the daytime fluxes of NO
and NO2 appears to indicate that although the species were measured on nearby towers at
different heights their photochemical cycling is coherent on an hourly basis This
process clearly dominates the behavior of NOx fluxes near the forest canopy but
represents neither net deposition nor net emission The next largest term appears to be a
constant deposition velocity downward flux of NO2 Finally there is a small positive
NO2 flux component which is equally well-fit as a constant flux or a stomatal
conductance-dependent term We performed additional regressions (not shown) using a
stomatal term of the form γprimemiddotgcmiddot([NO2]-[NO2]c) where [NO2]c is the compensation point
concentration below which vegetation emits NO2 While marginally significant values of
γprime could be obtained for [NO2]c values fixed between 1 and 10 nmol mol-1 the data did
not contain enough information to determine the compensation point independently In
2000 median summerfall daytime [NO2] was 11 nmol mol-1 (75th percentile=23 nmol
mol-1) Thus the vegetation at Harvard Forest usually experiences NO2 concentrations at
or below the 05 to 15 nmol mol-1 range of previously observed compensation points for
coniferous and tropical trees in chamber studies [eg Sparks et al 2001 Rondoacuten et al
1993] It is not possible to definitively attribute the small positive flux (γmiddotgc) to a
stomatal process the term could also indicate a chemical or other process which reduces
the deposition velocity under daytime conditions
To investigate the behavior of the NO2 flux beyond the limited period of NO flux
measurements we use above-canopy PPFD as a proxy for photochemical activity for our
data when NO fluxes were not measured Figure 316 shows daytime exchange
velocities of NO and NO2 plotted against PPFD For clarity hourly points are omitted
79
00 05 10 15
-10
12
34
NO2 (h=22m) leaves onNO2 (h=22m) leaves offNO (h=29m) leaves on
Exch
ange
Vel
ocity
(cm
s-1
)
PPFD (mmol m-2 s-1)
Figure 316 Daytime emission velocities of NO2 (leaves on solid triangles
leaves off open triangles) and NO (leaves on solid circles no data for leaves off
periods) plotted against photosynthetic photon flux density (PPFD) Symbols are
medians binned by percentiles of above-canopy PPFD For clarity hourly points are not
shown V(NO2) data span spring through fall 2000 while V(NO) data were collected late
August to early October 2000 only Linear fits to binned median points (exchange
velocities in units of cm s-1 PPFD in units of mmol m-2 s-1) reported in Table 33
80
and only the PPFD quantile-binned medians are plotted For each species we determine
quantiles of PPFD for daytime hours with data These quantiles define for each trace gas
species the measurement hours whose median values are shown The coupling of the bi-
directional NOx fluxes becomes more intense as the difference in light intensity from
above- to below-canopy increases during periods of high above-canopy illumination
cycling ceases as light intensity and therefore light gradient declines NO2 flux data are
segregated into full-canopy (leaves on) conditions from early June to mid-October and
leafless periods in April-May and October-November Linear regressions to the
percentile-binned medians of PPFD (V = VPPFD=0 + bmiddotPPFD) yield the following
relationships for the daytime data shown in Table 33
Before leaf-out and after leaf-fall the coefficient of PPFD in the NO2 regression
is smaller than for full-canopy conditions This expected since the leaf area index at
Harvard Forest at mid-summer is approximately 34 [Munger et al 1996] whereas the
area index for bare stems and twigs is only 09 [Barford et al 2001] The light gradient
for leaves-off conditions is smaller resulting in smaller concentration gradients and
reduced coupled NOx fluxes It is also likely that NO2 emission by the leaves contributes
to the increased slope of VNO2 vs PPFD when the canopy is developed
NO is not expected to deposit to surfaces in large amounts though there is very
little experimental evidence [Hanson et al 1991 Wesely and Hicks 2000] Soil NO
emission at Harvard Forest is small less than 09 micromol m-2 hr-1 [Munger et al 1996]
making NO unlikely to escape from the canopy before conversion to NO2 Thus the NO
flux at Harvard Forest is dominated by photochemical cycling and can be parameterized
as a function of PPFD and [NO] Coefficients for least squares fits to hourly daytime
FNO data (measurement height = 29m 29 Aug-8 Oct 2000) are shown in Table 34
81
Table 33 Linear regression of daytime percentile-binned median VNO2 and VNO
against of PPFD
VPPFD=0 plusmn std error
cm s-1 b plusmn std error
cm s-1 (mmol m-2 s-1)-1 R2
VNO2 leaves on -04 plusmn 01 (p-value=002)
27 plusmn 02 (p-valuelt1E-4) 097
VNO2 leaves off -01 plusmn 01 (p-value=03)
15 plusmn 02 (p-valuelt1E-4) 090
VNO leaves on -042 plusmn 007 (p-value=4E-4)
-05plusmn01 (p-value=7E-4) 078
82
Table 34 Regressions results for daytime FNO = F0_NO + V0_NO [NO] + bprime PPFD [NO]
F0_NO plusmn std error
(nmol mol-1 cm s-1)
bprime plusmn std error cm s-1 (mmol m-2 s-1)-1
V0_NO plusmn std error (cm s-1) R2
-008plusmn001 (p-valuelt1E-4)
-110plusmn002 (p-valuelt1E-4) NA 091
Constrained to 0
-114plusmn002 (p-valuelt1E-4)
NA 091
-006plusmn001
(p-valuelt1E-4)
-092plusmn004
(p-valuelt1E-4)
-018plusmn004
(p-valuelt1E-4) 091
Constrained to 0
-087plusmn004 (p-valuelt1E-4)
-025plusmn003
(p-valuelt1E-4) 091
83
To treat the larger daytime NO2 flux dataset we combine a terms representing the
light dependence shown in Figure 316 constant deposition velocity and stomatal
conductance Because gc was calculated assuming the presence of leaves we use the
measured deposition velocity of O3 Vd(O3) = -V(O3) as a proxy for the stomatal opening
from early spring through late fall Table 35 shows the results for the regressions using
these terms
A quadratic term amiddot[NO2]2 is not statistically significant when included because
we have few measurements with sufficiently high NO2 concentrations We interpret the
term (b+f)middotPPFDmiddot[NO2] as approximately accounting for the NO2 flux that arises from
photochemical cycling with NO (b+f) agrees well with the coefficients found in Table
33 As in the limited dataset regressions using FNO instead of PPFD (Table 32) V0
indicates an exchange velocity for NO2 on the order of -03 cm s-1 (downward) Given
the robust appearance of this term with different fit parameters for both limited and full
datasets we find it likely that V0 represents a roughly constant deposition velocity
process independent of NOx photochemical cycling during the day Though statistical
significance is low an upward flux term associated with stomatal conductance or related
variables also appears in Table 35
343 Parameterization of NOx Fluxes
Both nighttime and daytime NOx fluxes can be combined into a single
parameterization based on the above discussion This framework adopts the hypothesis
that photochemical NO-NO2 cycling can be largely accounted for by a simple light-
dependent term and that net deposition may then be estimated from additional terms
representing constant exchange velocity concentration-dependent exchange velocity and
84
Table 35 Multi-factor regression using all hourly daytime FNO2 data following the
functional form FNO2 = (b+f)middotPPFDmiddot[NO2] + V0 [NO2] + ΓmiddotVd(O3) The intercepts for all
fits have been constrained to zero The parameter f is a canopy flag set to zero for full-
canopy conditions so may be considered a correction to the PPFD term for leaves-off
periods in early spring and late fall
b plusmn std error cm s-1 (mmol m-2 s-1)-1
f plusmn std error cm s-1 (mmol m-2 s-1)-1
= 0 for leaves on V0 plusmn std error
(cm s-1) Γ plusmn std error (nmol mol-1) R2
196plusmn007 (p-valuelt1E-4)
-13plusmn01 (p-valuelt1E-4) NA NA 055
240plusmn009
(p-valueltlt1E-4)
-132plusmn009 (p-valuelt1E-4)
-035plusmn005 (p-valuelt1E-4) NA 060
196plusmn008 (p-valuelt1E-4)
-11plusmn01 (p-valuelt1E-4) NA 01plusmn01
(p-value=04) 062
229plusmn009 (p-valuelt1E-4)
-11plusmn01 (p-valuelt1E-4)
-030plusmn005 (p-valuelt1E-4)
03plusmn01 (p-value=003) 065
85
stomatal conductance-related exchange processes Thus for the height of 22 m relative to
the 20 m canopy the flux of NO2 day and night is given by the simple function of NO2
concentration PPFD and O3 deposition velocity
FNO2 = V0 middot [NO2] + amiddot[NO2]2 + (b+f)middotPPFDmiddot[NO2] + ΓmiddotVd(O3) (Eq 37)
where f is added to the coefficient of PPFD to account for the observed difference
between full-canopy and leaves-off conditions
NO is not present in significant quantities at night and FNO appears to be driven
by a simple dependence on PPFD during the day We include a constant deposition
velocity term as well since evidence of NO deposition to surfaces is weak and
inconclusive At a measurement height of 29 m the flux of NO is given by
FNO = V0_NO middot [NO] + bprime middot PPFD middot [NO] (Eq 38)
The net fluxes of NO and NO2 may be determined by omitting the photochemical terms
from Eq 37 and 38 Since we expect the deposition velocity of NO to be small
FNOx(net)asympFNO2(net)
FNOx(net) asymp V0 middot [NO2] + amiddot[NO2]2 + ΓmiddotVd(O3) (Eq 39)
Multi-factor regressions for Eq 37 and Eq 38 were performed to determine the
coefficients V0 a b f V0_NO and brsquo using all available hourly observations of [NO2]
[NO] PPFD Vd(O3) FNO2 and FNO at Harvard Forest April-November 2000 The
results are presented in Table 36 along with the range of results from the separate
daytime and nighttime analyses discussed earlier
86
Table 36 Multi-factor regressions using all available hourly observations of [NO2]
[NO] PPFD Vd(O3) FNO2 and FNO at Harvard Forest April-November 2000 Note
that Vd(O3)=deposition velocity positive values indicate downward O3 exchange
velocity
z = 22m FNO2 = V0 middot [NO2] + a middot [NO2]2 + (b+f)middotPPFDmiddot[NO2] + Γ middot Vd(O3)
coeff plusmn std err p-value
April ndash November 2000 (R2 = 060)
Range of results from separate day and night analyses
V0 (cm s-1) -021plusmn004 lt1E-4 -03 to -001
a (nmol-1 mol cm s-1) -0002plusmn0004dagger 06 -0013 to ndash0002
b (cm s-1 (mmol m-2 s-1)-1) 221plusmn007 lt1E-4 19 to 24
f (cm s-1 (mmol m-2 s-1)-1) =0 for leaves-on -110plusmn009 lt1E-4 -13 to -10
Γ (nmol mol-1) 021plusmn009 002 01 to 03
z = 29m FNO = V0_NO middot [NO] + bprime middot PPFD middot [NO]
29 August ndash 8 Oct 2000 (R2 = 092)
V0_NO (cm s-1) -025plusmn002 lt1E-4 -087 to -042
bprime (cm s-1 (mmol m-2 s-1)-1) -087plusmn003 lt1E-4 -114 to -05
daggerThe more statistically robust nighttime a =-0013 plusmn 0001 (Table 31) is recommended
87
Nearly all of the coefficients fall within the ranges determined previously except
V0 and V0_NO which differ only slightly from the earlier values As illustrated in Figures
317 and 318 Eq 37 and Eq 38 with the multi-factor regression coefficients in Table
36 are good predictors of the measured fluxes over their entire dynamic ranges and for
all sampled conditions
The diel variations of fluxes and residuals from this parameterization (Figure
319) reveal several interesting features The parameterization captures the overall diel
behavior of both NO and NO2 fluxes It also tends to underestimate the upward flux of
[NO2] during the day for northwesterly flow conditions and to slightly overestimate
during daytime southwesterly flows The disagreement rarely exceeds the 25th and 75th
quantiles of the measured fluxes The dominant flow regimes at Harvard Forest differ in
a number of key respects that may affect this result Northwesterly conditions tend to
bring lower concentrations of reactive nitrogen species cooler temperatures drier
weather and clearer skies than southwest winds [Moody et al 1998] It is possible that
one or more of these factors is contributing to the wind-sector difference in the residuals
One might expect that the residuals would depend on additional factors not taken
into consideration For example mixing and therefore deposition depends on the friction
velocity u (m s-1) As shown in figure 320 the residual NO2 flux tends upward only at
the highest u quantiles during the day and has no significant trend at night Similarly
the temperature-dependent rate for (R31) k1(T)[O3] has not been included yet we find
that the NO2 flux residuals exhibit no statistically significant trend with k1(T)[O3] (Figure
321) Although included as terms in the paratmeterization similar residual analyses are
shown for V(O3) during the day (Figure 321) and for [NO2] during the day and night
(Figure 322) The distinctly different daytime and nighttime behavior of the total NO2
flux is apparent again in Figure 322 as are the small residuals overall
88
Res
idua
l (M
es ndash
Para
m)
FN
O2
(nm
ol m
ol-1
cm s
-1)
Parameterized FNO2 (nmol mol-1 cm s-1)
Mea
sure
d FN
O2
(nm
ol m
ol-1
cm s
-1)
FNO2 = V0middot[NO2] + amiddot[NO2]2 + (b+f)middotPPFDmiddot[NO2] + ΓmiddotVd(O3)
Daytime +Nighttime
11
-20 -10 0 10 20 30
-20
-10
010
2030
Quantiles of Standard Normal
-2 0 2
-10
-50
510
Figure 317 Upper Measured vs parameterized NO2 flux shown with 11 line daytime
(+) and nighttime () The functional form the parameterization is shown at the top
Lower Residuals of FNO2 vs quantiles of the standard normal The residuals are
normally-distributed with extended upper and lower wings
89
-10 -8 -6 -4 -2 0 2
-10
-8-6
-4-2
02
Quantiles of Standard Normal
-2 0 2
-10
-05
00
05
10
15
Mea
sure
d FN
O (n
mol
mol
-1cm
s-1
)
Res
idua
l (M
es ndash
Para
m)
FN
O (n
mol
mol
-1cm
s-1)
Parameterized FNO (nmol mol-1 cm s-1)
FNO = V0_NOmiddot[NO] + b middotPPFDmiddot[NO]
11
Figure 318 Same as Figure 317 for FNO
90
Fl
ux (n
mol
mol
-1cm
s-1
)R
esid
ual (
nmol
mol
-1cm
s-1
)Measured FNO (h=22m)Measured FNO2 (h=22m)Parameterized FNOParameterized FNO2
Meas-Param FNOMeas-Param FNO2
-20
24
-20
24
NW
0 5 10 15 20
-2-1
01
2-2
-10
12
-20
24
-20
24
SW
0 5 10 15 20
-2-1
01
2-2
-10
12
Hour
Figure 319 Top panels Median diel measured (closed symbols solid lines) and
parameterized (open symbols dashed lines) fluxes of NO2 and NO Vertical bars show
the 25th and 75th quantiles for the measurements Lower panels Median diel residual
(measured-parameterized) FNO2 and FNO Northwest wind conditions are shown on the
left southwest on the right The parameterizations capture the daytime behavior of NO
flux due to the photochemical gradient and eddy diffusivity effects For NO2 under
northwesterly conditions the daytime residual is positive indicating that the
parameterization underestimates upward flux of NO2 For southwesterly conditions
daytime NO2 flux residuals are more variable and tend in the opposite direction
91
DAY NIGHT
FNO
2(n
mol
mol
-1cm
s-1
)R
esid
ual F
NO
2(n
mol
mol
-1cm
s-1
)
FNO
2(n
mol
mol
-1cm
s-1
)R
esid
ual F
NO
2(n
mol
mol
-1cm
s-1
)
Res
idua
l FN
O2
(nm
ol m
ol-1
cm s
-1)
Measured FNO2
Parameterized FNO2
Res
idua
l FN
O2
(nm
ol m
ol-1
cm s
-1)
u (m s-1) u (m s-1)
u (m s-1) u (m s-1)
-10
-50
510
00 05 10 15
-10
-50
510
-10
-50
510
00 05 10 15
-10
-50
510
00 02 04 06 08 10 12 14
-20
2
00 02 04 06 08 10 12 14
-20
2
Figure 320 From top to bottom measured and parameterized NO2 fluxes residuals
(measured-parameterized) and expanded-axes quantile-binned mean residuals (plusmn
standard deviation) vs u shown for daytime on the left and nighttime on the right
92
DAY k1(T)[O3] Day V(O3)
FNO
2(n
mol
mol
-1cm
s-1
)R
esid
ual F
NO
2(n
mol
mol
-1cm
s-1
)
FNO
2(n
mol
mol
-1cm
s-1
)R
esid
ual F
NO
2(n
mol
mol
-1cm
s-1
)
Res
idua
l FN
O2
(nm
ol m
ol-1
cm s
-1)
Measured FNO2
Parameterized FNO2
Res
idua
l FN
O2
(nm
ol m
ol-1
cm s
-1)
k1(T)[O3] (s-1) V(O3) (cm s-1)
k1(T)[O3] (s-1) V(O3) (cm s-1)
-10
010
2030
001 002 003 004
-10
-50
510
-10
010
2030
-003 -002 -001 00 001
-10
-50
510
0005 0010 0015 0020 0025 0030
-3-2
-10
12
-0015 -0010 -0005 00
-3-2
-10
12
Figure 321 Same as Figure 321 for daytime k1(T)[O3] (left) and daytime V(O3) (right)
93
DAY NIGHT
FNO
2(n
mol
mol
-1cm
s-1
)R
esid
ual F
NO
2(n
mol
mol
-1cm
s-1
)
FNO
2(n
mol
mol
-1cm
s-1
)R
esid
ual F
NO
2(n
mol
mol
-1cm
s-1
)
Res
idua
l FN
O2
(nm
ol m
ol-1
cm s
-1)
Measured FNO2
Parameterized FNO2
Res
idua
l FN
O2
(nm
ol m
ol-1
cm s
-1)
[NO2] (nmol mol-1) [NO2] (nmol mol-1)
[NO2] (nmol mol-1) [NO2] (nmol mol-1)
-10
010
2030
0 5 10 15 20
-10
-50
510
-20
-15
-10
-50
510
0 5 10 15 20
-10
-50
510
0 2 4 6 8
-3-2
-10
12
0 2 4 6 8 10 12
-20
24
Figure 322 Same as Figure 321 for [NO2] during the daytime (left) and nighttime
(right)
94
The lack of robust trends in the NO2 flux residuals indicates that within the
limitations of the dataset Eq 37 captures the crucial aspects of observed NO2 flux
behavior within and above the tall forest canopy under a wide range of conditions
Similarly Eq 38 accounts for 92 of the observed variance in the measured NO fluxes
under a somewhat narrower set of conditions (the sampling period for NO eddy
covariance flux measurements was relatively short) Figure 323 shows the resulting net
NOx flux (Eq 39 Table 36) and exchange velocity VNOx(net)=FNOx(net)[NO2] on a
diel basis for the sampling period April-November 2000 For the rural low-NOx
conditions at Harvard Forest we find that the flux of NOx is downward at all hours with
a deposition velocity of approximately 02 cm s-1
35 Conclusions
We installed a Tunable Diode Laser Absorption Spectrometer (TDLAS) to
measure continuous NO2 concentrations and eddy covariance fluxes above the canopy at
Harvard Forest during the spring summer and fall of 2000 An existing
chemiluminescence NO detector was configured to measure above-canopy eddy
covariance fluxes for a shorter period in the late summer and early fall A photolysis-
chemiluminescence (P-C) NO2 instrument also measured concentrations for a portion of
the sampling period Hourly average TDLAS and P-C NO2 concentrations agreed very
well under all conditions The agreement between the two instruments in the field and
the independent spectroscopic calibration of the TDLAS validated the long-term
measurements of the tank-calibrated P-C system
95
0 6 12 18
-10
-08
-06
-04
-02
00
-14
-12
-10
-08
-06
-04
-02
00
Net
FN
Ox
(nm
ol m
ol-1
cm s
-1)
(microm
ol m
-2hr
-1)
Net
VN
Ox
(cm
s-1
)
Hour
median| 25th amp 75th percentiles
0 6 12 18
-024
-022
-020
-018
Figure 323 Diel cycle of parameterized net NOx exchange velocity (upper panel) and
flux (lower panel) April-November 2000 FNOx(net) asymp FNO2(net) = V0middot[NO2] +
amiddot[NO2]2 + ΓmiddotVd(O3) VNOx(net) = FNO2(net)[NO2]
96
At night in the absence of significant quantities of NO we observed a consistent
downward flux of NO2 which depended quadratically on the concentration of NO2
although the dependence was apparent mainly on two nights when [NO2] was above 10
nmol mol-1 The nighttime NO2 deposition velocity varied between 02 cm s-1 at [NO2]=1
nmol mol-1 and 05 cm s-1 at [NO2]=30 nmol mol-1 These fluxes could come from direct
NO2 deposition to non-stomatal surfaces in the forest such as soil litter bark and the
outer surfaces of leaves area-normalized deposition velocities to such surfaces in
chamber measurements have varied from less than 01 to 05 cm s-1 for NO2
concentrations between 40 and 80 nmol mol-1 [Hanson and Lindberg 1991] The rate of
heterogeneous N2O5 hydrolysis resulting in aqueous-phase HNO3 (unlikely to re-enter the
gas phase) is insufficient to explain the observed nighttime NO2 deposition rates The
quadratic flux dependence and similarity to the behavior of HONO observed at other sites
suggests that heterogeneous NO2 hydrolysis may also play a significant role in NO2
deposition [Harrison and Kitto 1994 Harrison et al 1996 Barney and Finlayson-Pitts
2000] Half of any NO2 flux due to heterogeneous NO2 hydrolysis would likely escape
from the surfaces as gas-phase HONO potentially impacting the daytime HOx and NOx
budgets when photolyzed at sunrise
During the day we observed coupled fluxes of NO2 (upward) and NO
(downward) due to photochemical cycling driven by canopy-induced light and eddy
diffusivity gradients The imbalance in the observed fluxes corresponded to the
difference in height of the sampling levels relative to the canopy The exchange
velocities of the two species in their respective directions increased with higher above-
canopy light levels as measured by photosynthetic photon flux density (PPFD) due to the
97
stronger light gradient through the canopy under brighter conditions Upward NO2
velocity was smaller in early spring and late fall when there were no leaves on the trees
corresponding to a weaker light gradient condition (NO fluxes were only measured
during full-canopy conditions) and possibly to the absence of stomata-dependent
emission of NO2 We believe that these coupled fluxes are the first to be reported from a
mature tall-canopy site using reliable eddy-covariance appropriate sampling techniques
All of the NO and NO2 flux data day and night were well explained by a simple
parameterization consisting of two equations FNO2 = V0 middot [NO2] + amiddot[NO2]2 +
(b+f)middotPPFDmiddot[NO2] + ΓmiddotVd(O3) and FNO = V0_NO middot [NO] + bprime middot PPFD middot [NO] The net flux
of NOx is approximately equal to the flux of NO2 omitting the PPFD-dependent term
FNOxasympV0 middot [NO2] + amiddot[NO2]2 + ΓmiddotVd(O3) V0 and V0_NO are small constant deposition
velocity terms b and bprime are coefficients of light-dependent coupled fluxes for full-canopy
conditions and f adjusts the NO2 light-dependent term for no-leaves conditions The
deposition velocity of O3 was used as a proxy for stomatal exchange the coefficient Γ
was consistently positive Stomatal conductance correlates with a number of different
variables (light temperature humidity) complicating the interpretation of the final term
It may indicate a stomatal emission of NO2 under low-NOx conditions typical at Harvard
Forest but could also correspond to a chemical or other process which slows NO2
deposition during the day The quadratic term amiddot[NO2]2 was particularly significant at
night during a few high-[NO2] events Multi-factor regressions fitting the hourly data
with these equations yield R2 of 061 for FNO2 and 092 for FNO the coefficients
summarized in Table 36 agree with analyses of segregated daytime and nighttime data
We note that the coefficients are relevant to the specific measurement heights of NO (29
98
m) and NO2 (22 m) at Harvard Forest relative to the forest canopy height (20 m)
However the mechanism should be adaptable for more general application
During the measurement period net NO2 deposition velocity (omitting the PPFD-
dependent term associated with photochemical cycling of NOx) -(V0 + amiddot[NO2] +
ΓmiddotVd(O3)[NO2]) was between 015 and 03 cm s-1 The mean 02 cm s-1 varied by less
than 002 cm s-1 between day and night and between full-canopy and leafless conditions
NO2 deposition velocity measurements to deciduous forest canopies are scarce this result
falls just outside of the range of reported values for coniferous forests 01 to 15 cm s-1
[Hanson and Lindberg 1991 Rondoacuten et al 1993 Joss and Graber 1996] and short
crops such as alfalfa soy and oats 007 to 125 cm s-1 [Hanson and Lindberg 1991]
The only estimates of NO deposition velocity are over grass ~01 to 02 cm s-1 [Hanson
and Lindberg 1991] other observations indicate NO emission from various species
though soil emissions could confound these results [Wildt et al 1997] This is quite
close to the ~025 cm s-1 NO deposition velocity at Harvard Forest (-V0_NO) but we
cannot resolve the debate as to whether NO deposits at all [Wesely and Hicks 2000]
Concentration and flux measurements of HONO N2O5 and NO3 (along with NO
and NO2) are required to better understand the nighttime chemistry and deposition of
NOx Recently-developed continuous analyzers for HONO [Harrison et al 1996] and N-
2O5 and NO3 [Brown et al 2001] may make these measurements possible in the coming
years In addition the use of flux chambers with a TDLAS or other instrument (sub-
nmol mol-1 sensitivity and species-specific detection method) on leaf litter and soil
samples in the lab and field may facilitate direct detection of NO2 compensation points
for various species and quantify the importance of different natural surfaces
99
NOx deposition matters to both the ecosystem and the atmosphere the form of
nitrogen entering plants affects nutrient loading acid stress and toxicity and the form of
nitrogen leaving the atmosphere affects O3 production HOx chemistry and long-range
transport of anthropogenic pollutants We are hopeful that future research endeavors will
approach the problem from the perspective of both ecosystem and atmosphere at scales
ranging from the individual leaf to the vegetated landscape using reliable species-
specific and sensitive measurement techniques
References
Andreacutes-Hernaacutendez J Notholt J Hjorth and O Schrems A DOAS study on the origin of initrous acid at urban and non-urban sites Atmos Environ 30 175-180 1996
Aneja V P P A Roelle G C Murray J Southerland J W Erisman D Fowler W A H Asman and N Patni Atmospheric nitrogen compounds II emissions transport transformation deposition and assessment Atmos Environ 35 1903-1911 2001
Barford C E Hammond Pyle L Hutyra S Wofsy Ecological Measurements to compliment eddy-flux measurements at Harvard Forest [Online data archive] httpwww-asharvardedudatanigec-datahtml 2001
Barnet W S and B J Finlayson-Pitts Enhancement of N2O4 on porous glass at room temperature A key intermediate in the heterogeneous hydrolysis of NO2 J Phys Chem A 104 171-175 2000
Barney W S and B J Finlayson-Pitts Enhancement of N2O4 on Porous Glass at Room Temperature A Key Intermediate in the Heterogeneous Hydrolysis of NO2 J Phys Chem A 104 171-175 2000
Bey I D J Jacob R Yantosca J logan B Field A Fiore Q Li H Liu L Mickley M Schultz Global modeling of tropospheric chemistry with assimilated meteorology Model description and evaluation in press J Geophys Res 2001
Brown S H Stark S J Ciciora and A R Ravishankara In-situ measurement of atmospheric NO3 and N2O5 via cavity ring-down spectroscopy Geophys Res Lett 28 3237-3230 2001 (a)
100
Brown S H Stark S J Ciciora and A R Ravishankara In-situ Detection of Atmospheric NO3 and N2O5 via Cavity Ring-Down Spectroscopy EOS Trans AGU 82 Fall Meeting Suppl A41B-0045 2001 (b)
Coe H and M W Gallagher Measurements of dry deposition of NO2 to a Dutch heathland using the eddy-correlation technique Q J R Meteorol Soc118 767-786 1992
Delaney A C D R Fitzjarrald D H Lenschow R Pearson Jr G J Wendel B Woodruff Direct Measurements of Nitrogen Oxides and Ozone Fluxes over Grassland J Atmos Chem 4 429-444 1986
Eugster W and R Hesterberg Transfer resistances of NO2 determined from eddy correlation flux measurements over a litter meadow at a rural site on the Swiss plateau Atmos Environ 30 1247-1254 1996
Fitzjarrald D R and D H Lenschow Mean concentration and flux profiles for chemically reactive species in the atmospheric surface layer Atmos Environ 17 2505-2512 1983
Galmarini S P G Duynkerke J Vila-Guerau De Arellano Evolution of Nitrogen Oxide Chemistry in the Nocturnal Boundary Layer J Appl Meteorology 36 943-957 1997
Gao W M L Wesely P V Doskey Numerical Modeling of the Turbulent Diffusion and Chemistry of NOx O3 Isoprene and Other Reactive Trace Gases in and Above a Forest Canopy J Geophys Res 98 18339-18353 1993
Gao W and M L Wesely Numerical Modeling of the Turbulent Fluxes of Chemically Reactive Trace Gases in the Atmospheric Boundary Layer J Appl Meteorology 33 835-847 1994
Goodman A L G M Underwood and V H Grassian Heterogeneous Reaction of NO2 Characterization of Gas-Phase and Adsorbed Products from the Reaction 2NO2(g) + H2O(a) HONO(g) + HNO3(a) on Hydrated Silica Particles J Phys Chem A 103 7217-7223 1999
Goulden ML JW Munger S-M Fan B C Daube and S C Wofsy Measurements of carbon sequestration by long-term eddy covariance Methods and a critical evaluation of accuracy Global Change Biology 2 169-182 1996
Harrison R M A-M N Kitto Evidence for a surface source of atmospheric nitrous acid Atmos Environ 28 1089-1094 1994
Harrison R M J D Peak G M Collins Tropospheric cycle of nitrous acid J Geophys Res 101 14429-14439 1996
101
Heal M R B B B Booth J N Cape K J Hargreaves The influence of simplified peroxy radical chemistry on the interpretation of NO2-NO-O3 surface exchange Atmos Environ 35 1687-1696 2001
Horii C V M S Zahniser D D Nelson J B McManus S C Wofsy Nitric Acid and Nitrogen Dioxide Flux Measurements a New Application of Tunable Diode Laser Absorption Spectroscopy Proc of SPIE 3758 152-161 1999
Hosker R P Jr and S E Lindberg Review Atmospheric deposition and plant assimilation of gases and particles Atmos Environ 16 889-910 1982
Hanson P and S E Lindberg Dry deposition of reactive nitrogen compounds a review of leaf canopy and non-foliar measurements Atmos Environ 25A 1615-1634 1991
Jacob D J Heterogeneous chemistry and tropospheric ozone Atmos Environ 34 2131-2159 2000
Joss U and W K Graber Profiles and Simulated Exchange of H2O O3 NO2 Between the Atmosphere and the HartX Scots Pine Plantation Theor Appl Climatol 53 157-172 1996
Lefer B L and R W Talbot Nitric acid and ammonia at a rural northeaster US site J Geophys Res 104 1645-1661 1999
Lerdau M T J W Munger D J Jacob The NO2 Flux Conumdrum Science289 2291-2293 2000
Moody J L J W Munger A H Goldstein D J Jacob and S C Wofsy Harvard Forest regional-scale air mass composition by Patterns in Atmospheric Transport History (PATH) J Geophys Res 103 13181-13194 1998
Munger J W S C Wofsy P S Bakwin S-M Fan M L Goulden B C Daube and A H Goldstein Atmospheric deposition of reactive nitrogen oxides and ozone in a temperate deciduous forest and a subarctic woodland 1 Measurements and mechanisms J Geophys Res 101 12639-12657 1996
Munger J W S-M Fan P S Bakwin M L Goulden A H Goldstein A S Colman and S C Wofsy Regional budgets for nitrogen oxides from continental sources Variations of rates for oxidation and deposition with season and distance from source regions J Geophys Res 103 8355-8368 1998
Notholt J J Hjorth and F Raes Formation of HNO2 on aerosol surfaces during foggy periods in the presence of NO and NO2 Atmos Environ 26A 211-217 1992
Padro J Zhang L and W J Massman An analysis of measurements and modlling of air-surface exchange of NO-NO2-O3 over grass Atmos Environ 32 1365-1375 1998
102
103
Rondon A C Johansson L Granat Dry Deposition of Nitrogen Dioxide and Ozone to Coniferous Forests J Geophys Res 98 5159-5172 1993
Rothman LS et al The HITRAN molecular spectroscopic database and HAWKS (HITRAN Atmospheric Workstation) 1996 Edition J Quant Spectrosc Radiat Transfer 60 665-710 1998
Sparks J P R K Monson K L Sparks M Lerdau Leaf uptake of nitrogen dioxide (NO2) in a tropical wet forest implications for tropospheric chemistry Oecologia 127 214-221 2001
Stocker D W D H Stedman K F Zeller W J Massman D G Fox Fluxes of Nitrogen Oxides and Ozone Measured by Eddy Correlation Over a Shortgrass Prairie J Geophys Res 98 12619-12630 1993
Walton S M W Gallagher T W Choularton J Duyzer Ozone and NO2 Exchange to Fruit Orchards Atmos Environ 31 2767-2776 1997
Wesely M L J A Eastman D H Stedman E D Yalvac An eddy-correlation measurement of NO2 flux to vegetation and comparison to O3 flux Atmos Environ 16 815-820 1982
Wesely M L Parameterization of surface resistances to gaseous dry deposition in regional-scale numerical models Atmos Environ 23 1293-1304 1989
Wesley M L and B B Hicks A review of the current status of knowledge on dry deposition Atmos Environ 34 2261-2282 2000
Wildt J D Kley A Rockel P Rockel H J Schneider Emission of NO from several higher plant species J Geophys Res 102 5919-5927 1997
- April ndash November 2000
- G (nmol mol-1)
- 29 August ndash 8 Oct 2000
- References
- Chapter3_NOx_Part2pdf
-
- 34 Discussion
-
- Chapter3_NOx_Part1pdf
-
- 32 Methods
- 33 Results
-
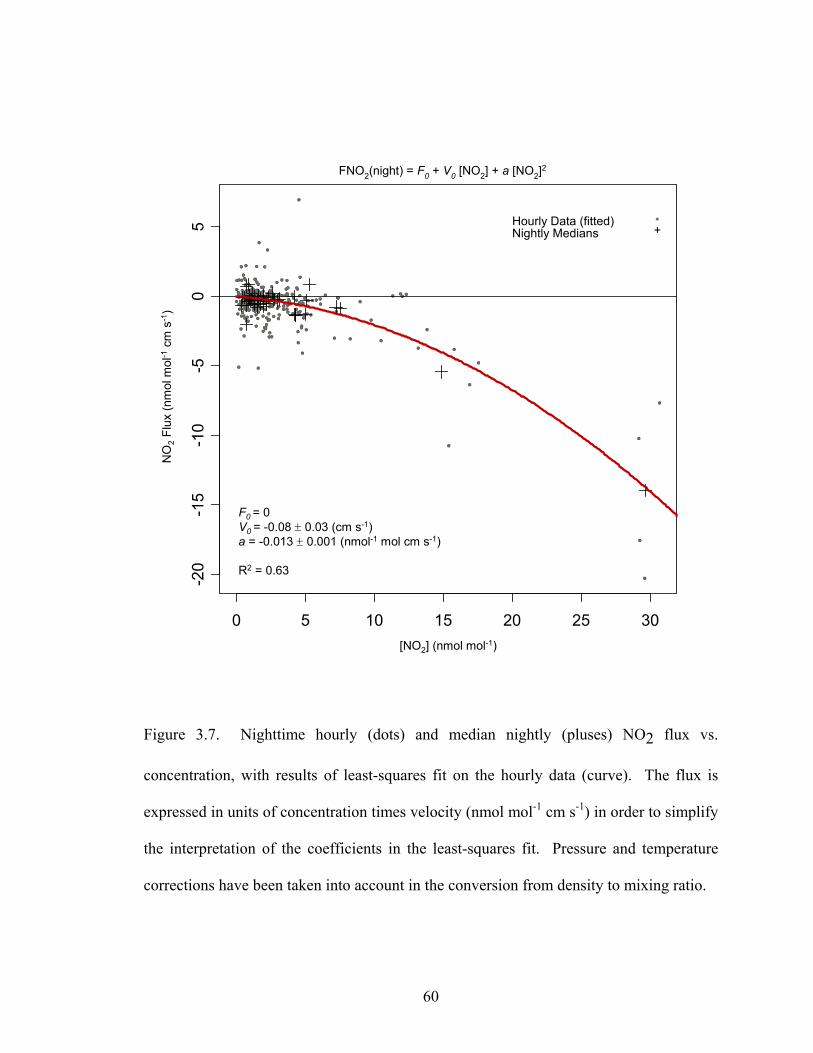

02
46
810
12
SW
Hour
19 20 21 22 23 0 1 2 3 4
-15
-10
-50
NOyNO2+HNO3NO2
FNO2FNO2+FHNO3FNOy
Flux
(microm
ol m
-2hr
-1)
Con
cent
ratio
n (n
mol
mol
-1)
02
46
810
12
NW
Hour
19 20 21 22 23 0 1 2 3 4
-15
-10
-50
Figure 39 Nighttime medians for the northwest (left) and southwest (right) wind
sectors April-November 2000 Upper panels Concentrations of NO2 NO2+HNO3 and
NOy (with vertical bars spanning 25th and 75th quartiles) Lower panels Fluxes of NO2
NO2+HNO3 and NOy (with 25th and 75th quartiles) For northwesterly conditions NO2
accounts for 48 to 65 of nighttime NOy concentration and 0 to 24 of NOy flux For
southwesterly conditions NO2 accounts for 35 to 58 of nighttime NOy concentration
and 0 to 13 of nighttime NOy flux
67
Most atmospheric models base their NO2 deposition parameterizations on the
modified Wesely [1989] scheme in which the surface resistance for NO2 prohibits
transfer except to lush vegetation exposed to sunlight where leaf stomata are open [eg
Bey et al 2001] Thus NO2 deposition velocity in these models falls to near zero at night
over vegetation regardless of the concentration of NO2 We observed nighttime NO2
deposition to the forest dependent on concentration and we infer that the behavior of
models departs significantly from the observed processes
Figure 310 compares observed nighttime NO2 deposition velocity to 24-hour
NO2 deposition from the Harvard GEOS-CHEM model on a monthly basis for Harvard
Forest [A Fiore personal communication] The nighttime NO2 deposition velocity of the
data is approximately half the modelrsquos 24-hour mean during the months when the canopy
is fully developed Since we believe that NO2 also deposits during the day (see below)
the modelrsquos 24-hour average deposition flux in summer may be approximately correct
although the day-night variation and dependence on NO2 concentration are incorrect
The model has no deposition when trees are bare but our data clearly indicate that
deposition continues at these times This discrepancy suggests a potentially large
underestimate of NOx deposition to forested landscapes during dormant months
342 Daytime Fluxes of NO NO2 O3 and NOy
During the day (R31) ndash (R34) establish a dynamic balance between NO NO2
and O3 while deposition of NO2 and O3 onto the forest canopy and sub-canopy
68
05
04
03
02
01
00
NO
2 Dep
ositi
on V
eloc
ity (c
m s
-1)
1110987654321
Month
GEOS-CHEM Harvard Forest Inland Box24-Hour Monthly Means 1995 1997 OBSERVED Harvard Forest TDLASNighttime Monthly Median 2000
Figure 310 Comparison of 24-hour monthly mean NO2 deposition in the GEOS-CHEM
model Harvard Forest box 1995 and 1997 to the observed nighttime monthly median
NO2 deposition measured at Harvard Forest in 2000 Unlike the observations the modelrsquos
nighttime deposition velocity of NO2 drops to near zero and contributes insignificantly to
total NOx deposition
69
surfaces continues The light gradient through the canopy (see Figure 311) drives (R32)
at a faster rate above than below shifting the balance of NOx toward NO above and NO2
below the canopy height (~20 m at this site) Theoretical studies have predicted that this
photochemical effect should produce coupled upward fluxes of NO2 and downward
fluxes of NO above the forest canopy [eg Gao et al 1993] These studies have
employed large suites of chemical reactions soil NO emissions canopy isoprene
emissions and leaf-level resistance models for NO2 HNO3 O3 and H2O2 deposition
We show below that a simpler approach captures much of the observed behavior of NOx
fluxes at Harvard Forest
Dominant features of the observed daytime NO and NO2 fluxes shown in Figures
35 and 36 are their opposite signs dependence on light and apparent imbalance
Upward NO2 flux at midday is reproducibly several times larger than downward NO flux
A simple model of canopy photochemical NOx cycling reveals that this apparent
imbalance is expected based on the difference in the height of the sampling inlets for the
two gases above the canopy For a trace gas species X continuity requires that a change
in concentration d[X]dt be due to the sum of chemical production PX chemical loss ndashLX
and flux - Φ
d[X]dt = Px ndash Lx ndash Φ (Eq 32)
For NOx photochemical cycling (R31)-(R33) we simplify Eq 32 by assuming steady
state d[X]dt = 0 ignoring horizontal transport and approximating the vertical flux as Φz
= ndashKc(z) d[X(z)]dz where Kc is a vertical exchange coefficient (ldquoeddy diffusivityrdquo) We
write the production and loss terms as
131
][]][[2 τ
NONOOkLP NONO === (Eq 33)
70
25
20
15
10
5
0
heig
ht (m
)
302520151050
295-385 nm Total UV (W m-2)
Harvard Forest 04 Oct 2001Local Noon Clear Sky
EMS Profile UV TDLAS Point UV
Figure 311 Midday profile of total UV radiation at Harvard Forest At each height the
Eppley total UV radiometer was placed horizontally facing upward to measure total
(direct plus diffuse) downwelling radiation and then facing downward to measure total
upwelling radiation The points indicate the sum of total downwelling and total
upwelling UV radiation Horizontal bars show observed variability in total downwelling
+ upwelling UV irradiance at each height within approximately one meter of the
measurement tower
71
2
2222
][][
τNO
NOjPL NONO === (Eq 34)
We scaled Kc(z) from Gao et al [1993] to the height of the Harvard Forest
canopy 20 m and approximated the effect of the light gradient from Figure 311 on the
lifetime of NO2 τ2(z) as shown in Figure 312 based on measurements made manually
with an Eppley UV photometer We estimated τ1asymp70s based on median k1(T) and [O3]
for the site the vertical gradient for O3 is small between 20 and 30 m making the
constant lifetime a reasonable approximation We then solved Eq 32 for NO and NO2 to
derive a simple model of vertical transport and photochemical cycling of NOx shown in
Figure 313
This calculation clarifies the cause of the imbalance between daytime NO and
NO2 fluxes observed in the time series and diel cycles in Figures 34 and 35 Because
the concentrations and fluxes of the two species were measured at separate heights 22 m
for NO2 and 29 m for NO they sampled different points along the concentration and flux
gradients induced by reduced light conditions below the canopy The larger observed
upward NO2 flux is expected based solely on photochemical cycling at a sampling point
closer to the canopy than that of NO
In addition to NO and NO2 fluxes corresponding to photochemical cycling
between the two NO2 is likely to interact with the vegetation via stomata during daylight
hours Canopy surface conductance gc is readily calculated using the Penman-Monteith
equation [Shuttleworth et al 1984] and the measured water vapor flux at Harvard Forest
Deposition velocities for species known to deposit through stomata (ie O3) correlate
strongly with gc [Munger et al 1996] As shown in Figure 314 daytime gc and the O3
72
01 05 50 500
020
4060
8010
0
0 1000 2000 30000 1000 2000 3000
020
4060
8010
0
Eddy Diffusivity K (m2 s-1) τ2 (s)
heig
ht (m
)
01 05 50 500
020
4060
8010
0
0 1000 2000 30000 1000 2000 3000
020
4060
8010
0
Eddy Diffusivity K (m2 s-1) τ2 (s)
heig
ht (m
)
Figure 312 Simple NOx photochemical canopy model inputs Eddy diffusivities are
scaled from Gao et al [1993] to the Harvard Forest canopy height of 20 m τ2 the
lifetime of NO2 against photolysis (reaction 2 NO2 + hν NO + O) scales inversely
with UV radiation τ2 was estimated for typical conditions of [O3] [NO][NO2] and
daytime UV profile under full-canopy conditions at the site The simple canopy model
also accepts an estimate of τ1 the lifetime of NO against reaction with O3 (reaction 31)
73
Concentration (nmol mol-1)
heig
ht (m
)
00 02 04 06 08 10
020
4060
8010
0
NO NO2
Normalized NOx = NO+NO2 = 1 nmol mol-1
Flux (nmol mol-1 cm s-1)
-2 -1 0 1 2-2 -1 0 1 2
020
4060
8010
0
NO NO2
Figure 313 Simple NOx photochemical canopy model outputs Left panel
concentrations of NO (dashed) and NO2 (solid) right fluxes of NO (dashed) and NO2
(solid) Symbols indicate measurement heights for NO (29 m) and NO2 (22 m) at
Harvard Forest The model solves the continuity equation for NO concentration at 200
levels ddz(-Kc(dNOdz)) = PNO ndash LNO where PNO = [NO]τ1 LNO = [NO]τ2 and zero
net deposition or emission of NOx is allowed NOx = NO + NO2 is normalized to 1 ppb
τ1 = 70s in this example Due to the measurement height difference observed upward
NO2 flux due to photochemical cycling alone should be substantially larger than observed
downward NO flux attributable to the same process
74
V(O
3) (c
m s
-1)
g c(c
m s
-1)
PPFD (mmol m-2 s-1)
00 05 10 15
-05
00
05
10
15
20
00 05 10 15
-3-2
-10
12
Figure 314 Daytime (including dawn and dusk) canopy surface conductance gc and O3
exchange velocity V(O3) vs above-canopy photosynthetic photon flux density (PPFD)
during the summer of 2000 at Harvard Forest Dots are hourly values Filled squares
represent quantile-binned means (quantiles of PPFD were used to define bins and all gc
or V(O3) for data hours falling within the bins were averaged) Both quantities are
indicators of stomatal conductance and increase in absolute value with PPFD up to a
maximum level
75
exchange velocity are both related to photosynthetic photon flux density (PPFD) The
dependence is nonlinear absolute values of gc and V(O3) increase with PPFD up to
approximately 1 mmol m-2 s-1 and level off at higher PPFD values Note that PPFD is the
only continuously-monitored measure of light intensity at Harvard Forest (as with many
ecological and trace-gas monitoring stations) and is therefore used in the discussion
below as a proxy of photochemically-active UV wavelengths at the site despite the fact
that PPFD measures only the photosynthetically-active wavelength band (400-700 nm)
For the time period when eddy covariance fluxes of both NO and NO2 were
measured (29 August-8 October 2000) Figure 315 shows that the daytime (as defined by
light level PPFD gt 001 mmol m-2 s-1) upward NO2 flux was strongly correlated with the
downward NO flux We can account for more of the variance in daytime FNO2 by using
in addition to a photochemical NOx cycling term βmiddotFNO additional terms representing a
constant deposition velocity V0middot [NO2] and a stomatal flux γmiddotgc (Table 32)
FNO2 = F0 + βmiddotFNO + V0middot [NO2] + γmiddotgc (Eq 35)
The relationship between FNO2 and FNO is significant in all of the fits as shown by the
low p-values and consistent values of β Note that an upward NO2 flux contribution
could be included as either a constant (zero order) flux term F0 or as a function of
stomatal conductance γ when F0 is constrained to zero For the F0=0 cases R2 has been
calculated as follows in order to omit the origin
)var()var(1
2
2
FNOresidualR minus= (Eq 36)
The constant deposition velocity term V0 is significant when the stomatal term is also
included in the fit A flux term dependent on the square of the NO2 concentration
a[NO2]2 (not shown in Table 32) is only marginally significant regardless of which other
terms are included in the regression
76
NO
2Fl
ux (micro
mol
m-2
hr-1
)
- NO Flux (micromol m-2 hr-1)
0 2 4 6 8 10 12
-10
010
2030
40
Figure 315 Relationship between daytime hourly FNO2 and ndashFNO 29 August to 8
October 2000 FNO2 = (05plusmn01) - (35plusmn01)middotFNO R2 = 079
77
Table 32 Regressions of daytime FNO2 (as defined by light level see above covered
hours 500 to 2000 EST) in terms of linear combinations of βmiddotFNO V0middot[NO2] and γmiddotgc
F0 is the intercept for each fit representing flux at [NO2] = FNO = gc = 0 Flux units of
(nmol mol-1 cm s-1) are used Note that FNO is largely negative (downward) so that a
negative value of β represents a positive flux term
F0 plusmn std error
(nmol mol-1 cm s-1) β plusmn std error
(dimensionless) V0 plusmn std error
(cm s-1) γ plusmn std error (nmol mol-1) R2
05plusmn01 (p-valuelt1E-4)
-35plusmn01 (p-valuelt1E-4) NA NA 079
constrained to 0 -37plusmn01 (p-valuelt1E-4) NA NA 079
07plusmn02 (p-valuelt1E-4)
-38plusmn02 (p-valuelt1E-4)
-016plusmn008 (p-value=004) NA 084
constrained to 0 -37plusmn02 (p-valuelt1E-4)
003plusmn007 (p-value=07) NA 083
01plusmn03 (p-value=06 )
-35plusmn01 (p-valuelt1E-4) NA 10plusmn04
(p-value=002) 083
constrained to 0 -35plusmn01 (p-valuelt1E-4) NA 12plusmn02
(p-valuelt1E-4) 083
04plusmn03 (p-value=02)
-38plusmn02 (p-valuelt1E-4)
-018plusmn009 (p-value=005)
09plusmn05 (p-value=008) 087
constrained to 0 -38plusmn02 (p-valuelt1E-4)
-012plusmn008 (p-value=01)
13plusmn03 (p-valuelt1E-4) 087
78
The stable statistically significant relationship between the daytime fluxes of NO
and NO2 appears to indicate that although the species were measured on nearby towers at
different heights their photochemical cycling is coherent on an hourly basis This
process clearly dominates the behavior of NOx fluxes near the forest canopy but
represents neither net deposition nor net emission The next largest term appears to be a
constant deposition velocity downward flux of NO2 Finally there is a small positive
NO2 flux component which is equally well-fit as a constant flux or a stomatal
conductance-dependent term We performed additional regressions (not shown) using a
stomatal term of the form γprimemiddotgcmiddot([NO2]-[NO2]c) where [NO2]c is the compensation point
concentration below which vegetation emits NO2 While marginally significant values of
γprime could be obtained for [NO2]c values fixed between 1 and 10 nmol mol-1 the data did
not contain enough information to determine the compensation point independently In
2000 median summerfall daytime [NO2] was 11 nmol mol-1 (75th percentile=23 nmol
mol-1) Thus the vegetation at Harvard Forest usually experiences NO2 concentrations at
or below the 05 to 15 nmol mol-1 range of previously observed compensation points for
coniferous and tropical trees in chamber studies [eg Sparks et al 2001 Rondoacuten et al
1993] It is not possible to definitively attribute the small positive flux (γmiddotgc) to a
stomatal process the term could also indicate a chemical or other process which reduces
the deposition velocity under daytime conditions
To investigate the behavior of the NO2 flux beyond the limited period of NO flux
measurements we use above-canopy PPFD as a proxy for photochemical activity for our
data when NO fluxes were not measured Figure 316 shows daytime exchange
velocities of NO and NO2 plotted against PPFD For clarity hourly points are omitted
79
00 05 10 15
-10
12
34
NO2 (h=22m) leaves onNO2 (h=22m) leaves offNO (h=29m) leaves on
Exch
ange
Vel
ocity
(cm
s-1
)
PPFD (mmol m-2 s-1)
Figure 316 Daytime emission velocities of NO2 (leaves on solid triangles
leaves off open triangles) and NO (leaves on solid circles no data for leaves off
periods) plotted against photosynthetic photon flux density (PPFD) Symbols are
medians binned by percentiles of above-canopy PPFD For clarity hourly points are not
shown V(NO2) data span spring through fall 2000 while V(NO) data were collected late
August to early October 2000 only Linear fits to binned median points (exchange
velocities in units of cm s-1 PPFD in units of mmol m-2 s-1) reported in Table 33
80
and only the PPFD quantile-binned medians are plotted For each species we determine
quantiles of PPFD for daytime hours with data These quantiles define for each trace gas
species the measurement hours whose median values are shown The coupling of the bi-
directional NOx fluxes becomes more intense as the difference in light intensity from
above- to below-canopy increases during periods of high above-canopy illumination
cycling ceases as light intensity and therefore light gradient declines NO2 flux data are
segregated into full-canopy (leaves on) conditions from early June to mid-October and
leafless periods in April-May and October-November Linear regressions to the
percentile-binned medians of PPFD (V = VPPFD=0 + bmiddotPPFD) yield the following
relationships for the daytime data shown in Table 33
Before leaf-out and after leaf-fall the coefficient of PPFD in the NO2 regression
is smaller than for full-canopy conditions This expected since the leaf area index at
Harvard Forest at mid-summer is approximately 34 [Munger et al 1996] whereas the
area index for bare stems and twigs is only 09 [Barford et al 2001] The light gradient
for leaves-off conditions is smaller resulting in smaller concentration gradients and
reduced coupled NOx fluxes It is also likely that NO2 emission by the leaves contributes
to the increased slope of VNO2 vs PPFD when the canopy is developed
NO is not expected to deposit to surfaces in large amounts though there is very
little experimental evidence [Hanson et al 1991 Wesely and Hicks 2000] Soil NO
emission at Harvard Forest is small less than 09 micromol m-2 hr-1 [Munger et al 1996]
making NO unlikely to escape from the canopy before conversion to NO2 Thus the NO
flux at Harvard Forest is dominated by photochemical cycling and can be parameterized
as a function of PPFD and [NO] Coefficients for least squares fits to hourly daytime
FNO data (measurement height = 29m 29 Aug-8 Oct 2000) are shown in Table 34
81
Table 33 Linear regression of daytime percentile-binned median VNO2 and VNO
against of PPFD
VPPFD=0 plusmn std error
cm s-1 b plusmn std error
cm s-1 (mmol m-2 s-1)-1 R2
VNO2 leaves on -04 plusmn 01 (p-value=002)
27 plusmn 02 (p-valuelt1E-4) 097
VNO2 leaves off -01 plusmn 01 (p-value=03)
15 plusmn 02 (p-valuelt1E-4) 090
VNO leaves on -042 plusmn 007 (p-value=4E-4)
-05plusmn01 (p-value=7E-4) 078
82
Table 34 Regressions results for daytime FNO = F0_NO + V0_NO [NO] + bprime PPFD [NO]
F0_NO plusmn std error
(nmol mol-1 cm s-1)
bprime plusmn std error cm s-1 (mmol m-2 s-1)-1
V0_NO plusmn std error (cm s-1) R2
-008plusmn001 (p-valuelt1E-4)
-110plusmn002 (p-valuelt1E-4) NA 091
Constrained to 0
-114plusmn002 (p-valuelt1E-4)
NA 091
-006plusmn001
(p-valuelt1E-4)
-092plusmn004
(p-valuelt1E-4)
-018plusmn004
(p-valuelt1E-4) 091
Constrained to 0
-087plusmn004 (p-valuelt1E-4)
-025plusmn003
(p-valuelt1E-4) 091
83
To treat the larger daytime NO2 flux dataset we combine a terms representing the
light dependence shown in Figure 316 constant deposition velocity and stomatal
conductance Because gc was calculated assuming the presence of leaves we use the
measured deposition velocity of O3 Vd(O3) = -V(O3) as a proxy for the stomatal opening
from early spring through late fall Table 35 shows the results for the regressions using
these terms
A quadratic term amiddot[NO2]2 is not statistically significant when included because
we have few measurements with sufficiently high NO2 concentrations We interpret the
term (b+f)middotPPFDmiddot[NO2] as approximately accounting for the NO2 flux that arises from
photochemical cycling with NO (b+f) agrees well with the coefficients found in Table
33 As in the limited dataset regressions using FNO instead of PPFD (Table 32) V0
indicates an exchange velocity for NO2 on the order of -03 cm s-1 (downward) Given
the robust appearance of this term with different fit parameters for both limited and full
datasets we find it likely that V0 represents a roughly constant deposition velocity
process independent of NOx photochemical cycling during the day Though statistical
significance is low an upward flux term associated with stomatal conductance or related
variables also appears in Table 35
343 Parameterization of NOx Fluxes
Both nighttime and daytime NOx fluxes can be combined into a single
parameterization based on the above discussion This framework adopts the hypothesis
that photochemical NO-NO2 cycling can be largely accounted for by a simple light-
dependent term and that net deposition may then be estimated from additional terms
representing constant exchange velocity concentration-dependent exchange velocity and
84
Table 35 Multi-factor regression using all hourly daytime FNO2 data following the
functional form FNO2 = (b+f)middotPPFDmiddot[NO2] + V0 [NO2] + ΓmiddotVd(O3) The intercepts for all
fits have been constrained to zero The parameter f is a canopy flag set to zero for full-
canopy conditions so may be considered a correction to the PPFD term for leaves-off
periods in early spring and late fall
b plusmn std error cm s-1 (mmol m-2 s-1)-1
f plusmn std error cm s-1 (mmol m-2 s-1)-1
= 0 for leaves on V0 plusmn std error
(cm s-1) Γ plusmn std error (nmol mol-1) R2
196plusmn007 (p-valuelt1E-4)
-13plusmn01 (p-valuelt1E-4) NA NA 055
240plusmn009
(p-valueltlt1E-4)
-132plusmn009 (p-valuelt1E-4)
-035plusmn005 (p-valuelt1E-4) NA 060
196plusmn008 (p-valuelt1E-4)
-11plusmn01 (p-valuelt1E-4) NA 01plusmn01
(p-value=04) 062
229plusmn009 (p-valuelt1E-4)
-11plusmn01 (p-valuelt1E-4)
-030plusmn005 (p-valuelt1E-4)
03plusmn01 (p-value=003) 065
85
stomatal conductance-related exchange processes Thus for the height of 22 m relative to
the 20 m canopy the flux of NO2 day and night is given by the simple function of NO2
concentration PPFD and O3 deposition velocity
FNO2 = V0 middot [NO2] + amiddot[NO2]2 + (b+f)middotPPFDmiddot[NO2] + ΓmiddotVd(O3) (Eq 37)
where f is added to the coefficient of PPFD to account for the observed difference
between full-canopy and leaves-off conditions
NO is not present in significant quantities at night and FNO appears to be driven
by a simple dependence on PPFD during the day We include a constant deposition
velocity term as well since evidence of NO deposition to surfaces is weak and
inconclusive At a measurement height of 29 m the flux of NO is given by
FNO = V0_NO middot [NO] + bprime middot PPFD middot [NO] (Eq 38)
The net fluxes of NO and NO2 may be determined by omitting the photochemical terms
from Eq 37 and 38 Since we expect the deposition velocity of NO to be small
FNOx(net)asympFNO2(net)
FNOx(net) asymp V0 middot [NO2] + amiddot[NO2]2 + ΓmiddotVd(O3) (Eq 39)
Multi-factor regressions for Eq 37 and Eq 38 were performed to determine the
coefficients V0 a b f V0_NO and brsquo using all available hourly observations of [NO2]
[NO] PPFD Vd(O3) FNO2 and FNO at Harvard Forest April-November 2000 The
results are presented in Table 36 along with the range of results from the separate
daytime and nighttime analyses discussed earlier
86
Table 36 Multi-factor regressions using all available hourly observations of [NO2]
[NO] PPFD Vd(O3) FNO2 and FNO at Harvard Forest April-November 2000 Note
that Vd(O3)=deposition velocity positive values indicate downward O3 exchange
velocity
z = 22m FNO2 = V0 middot [NO2] + a middot [NO2]2 + (b+f)middotPPFDmiddot[NO2] + Γ middot Vd(O3)
coeff plusmn std err p-value
April ndash November 2000 (R2 = 060)
Range of results from separate day and night analyses
V0 (cm s-1) -021plusmn004 lt1E-4 -03 to -001
a (nmol-1 mol cm s-1) -0002plusmn0004dagger 06 -0013 to ndash0002
b (cm s-1 (mmol m-2 s-1)-1) 221plusmn007 lt1E-4 19 to 24
f (cm s-1 (mmol m-2 s-1)-1) =0 for leaves-on -110plusmn009 lt1E-4 -13 to -10
Γ (nmol mol-1) 021plusmn009 002 01 to 03
z = 29m FNO = V0_NO middot [NO] + bprime middot PPFD middot [NO]
29 August ndash 8 Oct 2000 (R2 = 092)
V0_NO (cm s-1) -025plusmn002 lt1E-4 -087 to -042
bprime (cm s-1 (mmol m-2 s-1)-1) -087plusmn003 lt1E-4 -114 to -05
daggerThe more statistically robust nighttime a =-0013 plusmn 0001 (Table 31) is recommended
87
Nearly all of the coefficients fall within the ranges determined previously except
V0 and V0_NO which differ only slightly from the earlier values As illustrated in Figures
317 and 318 Eq 37 and Eq 38 with the multi-factor regression coefficients in Table
36 are good predictors of the measured fluxes over their entire dynamic ranges and for
all sampled conditions
The diel variations of fluxes and residuals from this parameterization (Figure
319) reveal several interesting features The parameterization captures the overall diel
behavior of both NO and NO2 fluxes It also tends to underestimate the upward flux of
[NO2] during the day for northwesterly flow conditions and to slightly overestimate
during daytime southwesterly flows The disagreement rarely exceeds the 25th and 75th
quantiles of the measured fluxes The dominant flow regimes at Harvard Forest differ in
a number of key respects that may affect this result Northwesterly conditions tend to
bring lower concentrations of reactive nitrogen species cooler temperatures drier
weather and clearer skies than southwest winds [Moody et al 1998] It is possible that
one or more of these factors is contributing to the wind-sector difference in the residuals
One might expect that the residuals would depend on additional factors not taken
into consideration For example mixing and therefore deposition depends on the friction
velocity u (m s-1) As shown in figure 320 the residual NO2 flux tends upward only at
the highest u quantiles during the day and has no significant trend at night Similarly
the temperature-dependent rate for (R31) k1(T)[O3] has not been included yet we find
that the NO2 flux residuals exhibit no statistically significant trend with k1(T)[O3] (Figure
321) Although included as terms in the paratmeterization similar residual analyses are
shown for V(O3) during the day (Figure 321) and for [NO2] during the day and night
(Figure 322) The distinctly different daytime and nighttime behavior of the total NO2
flux is apparent again in Figure 322 as are the small residuals overall
88
Res
idua
l (M
es ndash
Para
m)
FN
O2
(nm
ol m
ol-1
cm s
-1)
Parameterized FNO2 (nmol mol-1 cm s-1)
Mea
sure
d FN
O2
(nm
ol m
ol-1
cm s
-1)
FNO2 = V0middot[NO2] + amiddot[NO2]2 + (b+f)middotPPFDmiddot[NO2] + ΓmiddotVd(O3)
Daytime +Nighttime
11
-20 -10 0 10 20 30
-20
-10
010
2030
Quantiles of Standard Normal
-2 0 2
-10
-50
510
Figure 317 Upper Measured vs parameterized NO2 flux shown with 11 line daytime
(+) and nighttime () The functional form the parameterization is shown at the top
Lower Residuals of FNO2 vs quantiles of the standard normal The residuals are
normally-distributed with extended upper and lower wings
89
-10 -8 -6 -4 -2 0 2
-10
-8-6
-4-2
02
Quantiles of Standard Normal
-2 0 2
-10
-05
00
05
10
15
Mea
sure
d FN
O (n
mol
mol
-1cm
s-1
)
Res
idua
l (M
es ndash
Para
m)
FN
O (n
mol
mol
-1cm
s-1)
Parameterized FNO (nmol mol-1 cm s-1)
FNO = V0_NOmiddot[NO] + b middotPPFDmiddot[NO]
11
Figure 318 Same as Figure 317 for FNO
90
Fl
ux (n
mol
mol
-1cm
s-1
)R
esid
ual (
nmol
mol
-1cm
s-1
)Measured FNO (h=22m)Measured FNO2 (h=22m)Parameterized FNOParameterized FNO2
Meas-Param FNOMeas-Param FNO2
-20
24
-20
24
NW
0 5 10 15 20
-2-1
01
2-2
-10
12
-20
24
-20
24
SW
0 5 10 15 20
-2-1
01
2-2
-10
12
Hour
Figure 319 Top panels Median diel measured (closed symbols solid lines) and
parameterized (open symbols dashed lines) fluxes of NO2 and NO Vertical bars show
the 25th and 75th quantiles for the measurements Lower panels Median diel residual
(measured-parameterized) FNO2 and FNO Northwest wind conditions are shown on the
left southwest on the right The parameterizations capture the daytime behavior of NO
flux due to the photochemical gradient and eddy diffusivity effects For NO2 under
northwesterly conditions the daytime residual is positive indicating that the
parameterization underestimates upward flux of NO2 For southwesterly conditions
daytime NO2 flux residuals are more variable and tend in the opposite direction
91
DAY NIGHT
FNO
2(n
mol
mol
-1cm
s-1
)R
esid
ual F
NO
2(n
mol
mol
-1cm
s-1
)
FNO
2(n
mol
mol
-1cm
s-1
)R
esid
ual F
NO
2(n
mol
mol
-1cm
s-1
)
Res
idua
l FN
O2
(nm
ol m
ol-1
cm s
-1)
Measured FNO2
Parameterized FNO2
Res
idua
l FN
O2
(nm
ol m
ol-1
cm s
-1)
u (m s-1) u (m s-1)
u (m s-1) u (m s-1)
-10
-50
510
00 05 10 15
-10
-50
510
-10
-50
510
00 05 10 15
-10
-50
510
00 02 04 06 08 10 12 14
-20
2
00 02 04 06 08 10 12 14
-20
2
Figure 320 From top to bottom measured and parameterized NO2 fluxes residuals
(measured-parameterized) and expanded-axes quantile-binned mean residuals (plusmn
standard deviation) vs u shown for daytime on the left and nighttime on the right
92
DAY k1(T)[O3] Day V(O3)
FNO
2(n
mol
mol
-1cm
s-1
)R
esid
ual F
NO
2(n
mol
mol
-1cm
s-1
)
FNO
2(n
mol
mol
-1cm
s-1
)R
esid
ual F
NO
2(n
mol
mol
-1cm
s-1
)
Res
idua
l FN
O2
(nm
ol m
ol-1
cm s
-1)
Measured FNO2
Parameterized FNO2
Res
idua
l FN
O2
(nm
ol m
ol-1
cm s
-1)
k1(T)[O3] (s-1) V(O3) (cm s-1)
k1(T)[O3] (s-1) V(O3) (cm s-1)
-10
010
2030
001 002 003 004
-10
-50
510
-10
010
2030
-003 -002 -001 00 001
-10
-50
510
0005 0010 0015 0020 0025 0030
-3-2
-10
12
-0015 -0010 -0005 00
-3-2
-10
12
Figure 321 Same as Figure 321 for daytime k1(T)[O3] (left) and daytime V(O3) (right)
93
DAY NIGHT
FNO
2(n
mol
mol
-1cm
s-1
)R
esid
ual F
NO
2(n
mol
mol
-1cm
s-1
)
FNO
2(n
mol
mol
-1cm
s-1
)R
esid
ual F
NO
2(n
mol
mol
-1cm
s-1
)
Res
idua
l FN
O2
(nm
ol m
ol-1
cm s
-1)
Measured FNO2
Parameterized FNO2
Res
idua
l FN
O2
(nm
ol m
ol-1
cm s
-1)
[NO2] (nmol mol-1) [NO2] (nmol mol-1)
[NO2] (nmol mol-1) [NO2] (nmol mol-1)
-10
010
2030
0 5 10 15 20
-10
-50
510
-20
-15
-10
-50
510
0 5 10 15 20
-10
-50
510
0 2 4 6 8
-3-2
-10
12
0 2 4 6 8 10 12
-20
24
Figure 322 Same as Figure 321 for [NO2] during the daytime (left) and nighttime
(right)
94
The lack of robust trends in the NO2 flux residuals indicates that within the
limitations of the dataset Eq 37 captures the crucial aspects of observed NO2 flux
behavior within and above the tall forest canopy under a wide range of conditions
Similarly Eq 38 accounts for 92 of the observed variance in the measured NO fluxes
under a somewhat narrower set of conditions (the sampling period for NO eddy
covariance flux measurements was relatively short) Figure 323 shows the resulting net
NOx flux (Eq 39 Table 36) and exchange velocity VNOx(net)=FNOx(net)[NO2] on a
diel basis for the sampling period April-November 2000 For the rural low-NOx
conditions at Harvard Forest we find that the flux of NOx is downward at all hours with
a deposition velocity of approximately 02 cm s-1
35 Conclusions
We installed a Tunable Diode Laser Absorption Spectrometer (TDLAS) to
measure continuous NO2 concentrations and eddy covariance fluxes above the canopy at
Harvard Forest during the spring summer and fall of 2000 An existing
chemiluminescence NO detector was configured to measure above-canopy eddy
covariance fluxes for a shorter period in the late summer and early fall A photolysis-
chemiluminescence (P-C) NO2 instrument also measured concentrations for a portion of
the sampling period Hourly average TDLAS and P-C NO2 concentrations agreed very
well under all conditions The agreement between the two instruments in the field and
the independent spectroscopic calibration of the TDLAS validated the long-term
measurements of the tank-calibrated P-C system
95
0 6 12 18
-10
-08
-06
-04
-02
00
-14
-12
-10
-08
-06
-04
-02
00
Net
FN
Ox
(nm
ol m
ol-1
cm s
-1)
(microm
ol m
-2hr
-1)
Net
VN
Ox
(cm
s-1
)
Hour
median| 25th amp 75th percentiles
0 6 12 18
-024
-022
-020
-018
Figure 323 Diel cycle of parameterized net NOx exchange velocity (upper panel) and
flux (lower panel) April-November 2000 FNOx(net) asymp FNO2(net) = V0middot[NO2] +
amiddot[NO2]2 + ΓmiddotVd(O3) VNOx(net) = FNO2(net)[NO2]
96
At night in the absence of significant quantities of NO we observed a consistent
downward flux of NO2 which depended quadratically on the concentration of NO2
although the dependence was apparent mainly on two nights when [NO2] was above 10
nmol mol-1 The nighttime NO2 deposition velocity varied between 02 cm s-1 at [NO2]=1
nmol mol-1 and 05 cm s-1 at [NO2]=30 nmol mol-1 These fluxes could come from direct
NO2 deposition to non-stomatal surfaces in the forest such as soil litter bark and the
outer surfaces of leaves area-normalized deposition velocities to such surfaces in
chamber measurements have varied from less than 01 to 05 cm s-1 for NO2
concentrations between 40 and 80 nmol mol-1 [Hanson and Lindberg 1991] The rate of
heterogeneous N2O5 hydrolysis resulting in aqueous-phase HNO3 (unlikely to re-enter the
gas phase) is insufficient to explain the observed nighttime NO2 deposition rates The
quadratic flux dependence and similarity to the behavior of HONO observed at other sites
suggests that heterogeneous NO2 hydrolysis may also play a significant role in NO2
deposition [Harrison and Kitto 1994 Harrison et al 1996 Barney and Finlayson-Pitts
2000] Half of any NO2 flux due to heterogeneous NO2 hydrolysis would likely escape
from the surfaces as gas-phase HONO potentially impacting the daytime HOx and NOx
budgets when photolyzed at sunrise
During the day we observed coupled fluxes of NO2 (upward) and NO
(downward) due to photochemical cycling driven by canopy-induced light and eddy
diffusivity gradients The imbalance in the observed fluxes corresponded to the
difference in height of the sampling levels relative to the canopy The exchange
velocities of the two species in their respective directions increased with higher above-
canopy light levels as measured by photosynthetic photon flux density (PPFD) due to the
97
stronger light gradient through the canopy under brighter conditions Upward NO2
velocity was smaller in early spring and late fall when there were no leaves on the trees
corresponding to a weaker light gradient condition (NO fluxes were only measured
during full-canopy conditions) and possibly to the absence of stomata-dependent
emission of NO2 We believe that these coupled fluxes are the first to be reported from a
mature tall-canopy site using reliable eddy-covariance appropriate sampling techniques
All of the NO and NO2 flux data day and night were well explained by a simple
parameterization consisting of two equations FNO2 = V0 middot [NO2] + amiddot[NO2]2 +
(b+f)middotPPFDmiddot[NO2] + ΓmiddotVd(O3) and FNO = V0_NO middot [NO] + bprime middot PPFD middot [NO] The net flux
of NOx is approximately equal to the flux of NO2 omitting the PPFD-dependent term
FNOxasympV0 middot [NO2] + amiddot[NO2]2 + ΓmiddotVd(O3) V0 and V0_NO are small constant deposition
velocity terms b and bprime are coefficients of light-dependent coupled fluxes for full-canopy
conditions and f adjusts the NO2 light-dependent term for no-leaves conditions The
deposition velocity of O3 was used as a proxy for stomatal exchange the coefficient Γ
was consistently positive Stomatal conductance correlates with a number of different
variables (light temperature humidity) complicating the interpretation of the final term
It may indicate a stomatal emission of NO2 under low-NOx conditions typical at Harvard
Forest but could also correspond to a chemical or other process which slows NO2
deposition during the day The quadratic term amiddot[NO2]2 was particularly significant at
night during a few high-[NO2] events Multi-factor regressions fitting the hourly data
with these equations yield R2 of 061 for FNO2 and 092 for FNO the coefficients
summarized in Table 36 agree with analyses of segregated daytime and nighttime data
We note that the coefficients are relevant to the specific measurement heights of NO (29
98
m) and NO2 (22 m) at Harvard Forest relative to the forest canopy height (20 m)
However the mechanism should be adaptable for more general application
During the measurement period net NO2 deposition velocity (omitting the PPFD-
dependent term associated with photochemical cycling of NOx) -(V0 + amiddot[NO2] +
ΓmiddotVd(O3)[NO2]) was between 015 and 03 cm s-1 The mean 02 cm s-1 varied by less
than 002 cm s-1 between day and night and between full-canopy and leafless conditions
NO2 deposition velocity measurements to deciduous forest canopies are scarce this result
falls just outside of the range of reported values for coniferous forests 01 to 15 cm s-1
[Hanson and Lindberg 1991 Rondoacuten et al 1993 Joss and Graber 1996] and short
crops such as alfalfa soy and oats 007 to 125 cm s-1 [Hanson and Lindberg 1991]
The only estimates of NO deposition velocity are over grass ~01 to 02 cm s-1 [Hanson
and Lindberg 1991] other observations indicate NO emission from various species
though soil emissions could confound these results [Wildt et al 1997] This is quite
close to the ~025 cm s-1 NO deposition velocity at Harvard Forest (-V0_NO) but we
cannot resolve the debate as to whether NO deposits at all [Wesely and Hicks 2000]
Concentration and flux measurements of HONO N2O5 and NO3 (along with NO
and NO2) are required to better understand the nighttime chemistry and deposition of
NOx Recently-developed continuous analyzers for HONO [Harrison et al 1996] and N-
2O5 and NO3 [Brown et al 2001] may make these measurements possible in the coming
years In addition the use of flux chambers with a TDLAS or other instrument (sub-
nmol mol-1 sensitivity and species-specific detection method) on leaf litter and soil
samples in the lab and field may facilitate direct detection of NO2 compensation points
for various species and quantify the importance of different natural surfaces
99
NOx deposition matters to both the ecosystem and the atmosphere the form of
nitrogen entering plants affects nutrient loading acid stress and toxicity and the form of
nitrogen leaving the atmosphere affects O3 production HOx chemistry and long-range
transport of anthropogenic pollutants We are hopeful that future research endeavors will
approach the problem from the perspective of both ecosystem and atmosphere at scales
ranging from the individual leaf to the vegetated landscape using reliable species-
specific and sensitive measurement techniques
References
Andreacutes-Hernaacutendez J Notholt J Hjorth and O Schrems A DOAS study on the origin of initrous acid at urban and non-urban sites Atmos Environ 30 175-180 1996
Aneja V P P A Roelle G C Murray J Southerland J W Erisman D Fowler W A H Asman and N Patni Atmospheric nitrogen compounds II emissions transport transformation deposition and assessment Atmos Environ 35 1903-1911 2001
Barford C E Hammond Pyle L Hutyra S Wofsy Ecological Measurements to compliment eddy-flux measurements at Harvard Forest [Online data archive] httpwww-asharvardedudatanigec-datahtml 2001
Barnet W S and B J Finlayson-Pitts Enhancement of N2O4 on porous glass at room temperature A key intermediate in the heterogeneous hydrolysis of NO2 J Phys Chem A 104 171-175 2000
Barney W S and B J Finlayson-Pitts Enhancement of N2O4 on Porous Glass at Room Temperature A Key Intermediate in the Heterogeneous Hydrolysis of NO2 J Phys Chem A 104 171-175 2000
Bey I D J Jacob R Yantosca J logan B Field A Fiore Q Li H Liu L Mickley M Schultz Global modeling of tropospheric chemistry with assimilated meteorology Model description and evaluation in press J Geophys Res 2001
Brown S H Stark S J Ciciora and A R Ravishankara In-situ measurement of atmospheric NO3 and N2O5 via cavity ring-down spectroscopy Geophys Res Lett 28 3237-3230 2001 (a)
100
Brown S H Stark S J Ciciora and A R Ravishankara In-situ Detection of Atmospheric NO3 and N2O5 via Cavity Ring-Down Spectroscopy EOS Trans AGU 82 Fall Meeting Suppl A41B-0045 2001 (b)
Coe H and M W Gallagher Measurements of dry deposition of NO2 to a Dutch heathland using the eddy-correlation technique Q J R Meteorol Soc118 767-786 1992
Delaney A C D R Fitzjarrald D H Lenschow R Pearson Jr G J Wendel B Woodruff Direct Measurements of Nitrogen Oxides and Ozone Fluxes over Grassland J Atmos Chem 4 429-444 1986
Eugster W and R Hesterberg Transfer resistances of NO2 determined from eddy correlation flux measurements over a litter meadow at a rural site on the Swiss plateau Atmos Environ 30 1247-1254 1996
Fitzjarrald D R and D H Lenschow Mean concentration and flux profiles for chemically reactive species in the atmospheric surface layer Atmos Environ 17 2505-2512 1983
Galmarini S P G Duynkerke J Vila-Guerau De Arellano Evolution of Nitrogen Oxide Chemistry in the Nocturnal Boundary Layer J Appl Meteorology 36 943-957 1997
Gao W M L Wesely P V Doskey Numerical Modeling of the Turbulent Diffusion and Chemistry of NOx O3 Isoprene and Other Reactive Trace Gases in and Above a Forest Canopy J Geophys Res 98 18339-18353 1993
Gao W and M L Wesely Numerical Modeling of the Turbulent Fluxes of Chemically Reactive Trace Gases in the Atmospheric Boundary Layer J Appl Meteorology 33 835-847 1994
Goodman A L G M Underwood and V H Grassian Heterogeneous Reaction of NO2 Characterization of Gas-Phase and Adsorbed Products from the Reaction 2NO2(g) + H2O(a) HONO(g) + HNO3(a) on Hydrated Silica Particles J Phys Chem A 103 7217-7223 1999
Goulden ML JW Munger S-M Fan B C Daube and S C Wofsy Measurements of carbon sequestration by long-term eddy covariance Methods and a critical evaluation of accuracy Global Change Biology 2 169-182 1996
Harrison R M A-M N Kitto Evidence for a surface source of atmospheric nitrous acid Atmos Environ 28 1089-1094 1994
Harrison R M J D Peak G M Collins Tropospheric cycle of nitrous acid J Geophys Res 101 14429-14439 1996
101
Heal M R B B B Booth J N Cape K J Hargreaves The influence of simplified peroxy radical chemistry on the interpretation of NO2-NO-O3 surface exchange Atmos Environ 35 1687-1696 2001
Horii C V M S Zahniser D D Nelson J B McManus S C Wofsy Nitric Acid and Nitrogen Dioxide Flux Measurements a New Application of Tunable Diode Laser Absorption Spectroscopy Proc of SPIE 3758 152-161 1999
Hosker R P Jr and S E Lindberg Review Atmospheric deposition and plant assimilation of gases and particles Atmos Environ 16 889-910 1982
Hanson P and S E Lindberg Dry deposition of reactive nitrogen compounds a review of leaf canopy and non-foliar measurements Atmos Environ 25A 1615-1634 1991
Jacob D J Heterogeneous chemistry and tropospheric ozone Atmos Environ 34 2131-2159 2000
Joss U and W K Graber Profiles and Simulated Exchange of H2O O3 NO2 Between the Atmosphere and the HartX Scots Pine Plantation Theor Appl Climatol 53 157-172 1996
Lefer B L and R W Talbot Nitric acid and ammonia at a rural northeaster US site J Geophys Res 104 1645-1661 1999
Lerdau M T J W Munger D J Jacob The NO2 Flux Conumdrum Science289 2291-2293 2000
Moody J L J W Munger A H Goldstein D J Jacob and S C Wofsy Harvard Forest regional-scale air mass composition by Patterns in Atmospheric Transport History (PATH) J Geophys Res 103 13181-13194 1998
Munger J W S C Wofsy P S Bakwin S-M Fan M L Goulden B C Daube and A H Goldstein Atmospheric deposition of reactive nitrogen oxides and ozone in a temperate deciduous forest and a subarctic woodland 1 Measurements and mechanisms J Geophys Res 101 12639-12657 1996
Munger J W S-M Fan P S Bakwin M L Goulden A H Goldstein A S Colman and S C Wofsy Regional budgets for nitrogen oxides from continental sources Variations of rates for oxidation and deposition with season and distance from source regions J Geophys Res 103 8355-8368 1998
Notholt J J Hjorth and F Raes Formation of HNO2 on aerosol surfaces during foggy periods in the presence of NO and NO2 Atmos Environ 26A 211-217 1992
Padro J Zhang L and W J Massman An analysis of measurements and modlling of air-surface exchange of NO-NO2-O3 over grass Atmos Environ 32 1365-1375 1998
102
103
Rondon A C Johansson L Granat Dry Deposition of Nitrogen Dioxide and Ozone to Coniferous Forests J Geophys Res 98 5159-5172 1993
Rothman LS et al The HITRAN molecular spectroscopic database and HAWKS (HITRAN Atmospheric Workstation) 1996 Edition J Quant Spectrosc Radiat Transfer 60 665-710 1998
Sparks J P R K Monson K L Sparks M Lerdau Leaf uptake of nitrogen dioxide (NO2) in a tropical wet forest implications for tropospheric chemistry Oecologia 127 214-221 2001
Stocker D W D H Stedman K F Zeller W J Massman D G Fox Fluxes of Nitrogen Oxides and Ozone Measured by Eddy Correlation Over a Shortgrass Prairie J Geophys Res 98 12619-12630 1993
Walton S M W Gallagher T W Choularton J Duyzer Ozone and NO2 Exchange to Fruit Orchards Atmos Environ 31 2767-2776 1997
Wesely M L J A Eastman D H Stedman E D Yalvac An eddy-correlation measurement of NO2 flux to vegetation and comparison to O3 flux Atmos Environ 16 815-820 1982
Wesely M L Parameterization of surface resistances to gaseous dry deposition in regional-scale numerical models Atmos Environ 23 1293-1304 1989
Wesley M L and B B Hicks A review of the current status of knowledge on dry deposition Atmos Environ 34 2261-2282 2000
Wildt J D Kley A Rockel P Rockel H J Schneider Emission of NO from several higher plant species J Geophys Res 102 5919-5927 1997
- April ndash November 2000
- G (nmol mol-1)
- 29 August ndash 8 Oct 2000
- References
- Chapter3_NOx_Part2pdf
-
- 34 Discussion
-
- Chapter3_NOx_Part1pdf
-
- 32 Methods
- 33 Results
-

05
04
03
02
01
00
NO
2 Dep
ositi
on V
eloc
ity (c
m s
-1)
1110987654321
Month
GEOS-CHEM Harvard Forest Inland Box24-Hour Monthly Means 1995 1997 OBSERVED Harvard Forest TDLASNighttime Monthly Median 2000
Figure 310 Comparison of 24-hour monthly mean NO2 deposition in the GEOS-CHEM
model Harvard Forest box 1995 and 1997 to the observed nighttime monthly median
NO2 deposition measured at Harvard Forest in 2000 Unlike the observations the modelrsquos
nighttime deposition velocity of NO2 drops to near zero and contributes insignificantly to
total NOx deposition
69
surfaces continues The light gradient through the canopy (see Figure 311) drives (R32)
at a faster rate above than below shifting the balance of NOx toward NO above and NO2
below the canopy height (~20 m at this site) Theoretical studies have predicted that this
photochemical effect should produce coupled upward fluxes of NO2 and downward
fluxes of NO above the forest canopy [eg Gao et al 1993] These studies have
employed large suites of chemical reactions soil NO emissions canopy isoprene
emissions and leaf-level resistance models for NO2 HNO3 O3 and H2O2 deposition
We show below that a simpler approach captures much of the observed behavior of NOx
fluxes at Harvard Forest
Dominant features of the observed daytime NO and NO2 fluxes shown in Figures
35 and 36 are their opposite signs dependence on light and apparent imbalance
Upward NO2 flux at midday is reproducibly several times larger than downward NO flux
A simple model of canopy photochemical NOx cycling reveals that this apparent
imbalance is expected based on the difference in the height of the sampling inlets for the
two gases above the canopy For a trace gas species X continuity requires that a change
in concentration d[X]dt be due to the sum of chemical production PX chemical loss ndashLX
and flux - Φ
d[X]dt = Px ndash Lx ndash Φ (Eq 32)
For NOx photochemical cycling (R31)-(R33) we simplify Eq 32 by assuming steady
state d[X]dt = 0 ignoring horizontal transport and approximating the vertical flux as Φz
= ndashKc(z) d[X(z)]dz where Kc is a vertical exchange coefficient (ldquoeddy diffusivityrdquo) We
write the production and loss terms as
131
][]][[2 τ
NONOOkLP NONO === (Eq 33)
70
25
20
15
10
5
0
heig
ht (m
)
302520151050
295-385 nm Total UV (W m-2)
Harvard Forest 04 Oct 2001Local Noon Clear Sky
EMS Profile UV TDLAS Point UV
Figure 311 Midday profile of total UV radiation at Harvard Forest At each height the
Eppley total UV radiometer was placed horizontally facing upward to measure total
(direct plus diffuse) downwelling radiation and then facing downward to measure total
upwelling radiation The points indicate the sum of total downwelling and total
upwelling UV radiation Horizontal bars show observed variability in total downwelling
+ upwelling UV irradiance at each height within approximately one meter of the
measurement tower
71
2
2222
][][
τNO
NOjPL NONO === (Eq 34)
We scaled Kc(z) from Gao et al [1993] to the height of the Harvard Forest
canopy 20 m and approximated the effect of the light gradient from Figure 311 on the
lifetime of NO2 τ2(z) as shown in Figure 312 based on measurements made manually
with an Eppley UV photometer We estimated τ1asymp70s based on median k1(T) and [O3]
for the site the vertical gradient for O3 is small between 20 and 30 m making the
constant lifetime a reasonable approximation We then solved Eq 32 for NO and NO2 to
derive a simple model of vertical transport and photochemical cycling of NOx shown in
Figure 313
This calculation clarifies the cause of the imbalance between daytime NO and
NO2 fluxes observed in the time series and diel cycles in Figures 34 and 35 Because
the concentrations and fluxes of the two species were measured at separate heights 22 m
for NO2 and 29 m for NO they sampled different points along the concentration and flux
gradients induced by reduced light conditions below the canopy The larger observed
upward NO2 flux is expected based solely on photochemical cycling at a sampling point
closer to the canopy than that of NO
In addition to NO and NO2 fluxes corresponding to photochemical cycling
between the two NO2 is likely to interact with the vegetation via stomata during daylight
hours Canopy surface conductance gc is readily calculated using the Penman-Monteith
equation [Shuttleworth et al 1984] and the measured water vapor flux at Harvard Forest
Deposition velocities for species known to deposit through stomata (ie O3) correlate
strongly with gc [Munger et al 1996] As shown in Figure 314 daytime gc and the O3
72
01 05 50 500
020
4060
8010
0
0 1000 2000 30000 1000 2000 3000
020
4060
8010
0
Eddy Diffusivity K (m2 s-1) τ2 (s)
heig
ht (m
)
01 05 50 500
020
4060
8010
0
0 1000 2000 30000 1000 2000 3000
020
4060
8010
0
Eddy Diffusivity K (m2 s-1) τ2 (s)
heig
ht (m
)
Figure 312 Simple NOx photochemical canopy model inputs Eddy diffusivities are
scaled from Gao et al [1993] to the Harvard Forest canopy height of 20 m τ2 the
lifetime of NO2 against photolysis (reaction 2 NO2 + hν NO + O) scales inversely
with UV radiation τ2 was estimated for typical conditions of [O3] [NO][NO2] and
daytime UV profile under full-canopy conditions at the site The simple canopy model
also accepts an estimate of τ1 the lifetime of NO against reaction with O3 (reaction 31)
73
Concentration (nmol mol-1)
heig
ht (m
)
00 02 04 06 08 10
020
4060
8010
0
NO NO2
Normalized NOx = NO+NO2 = 1 nmol mol-1
Flux (nmol mol-1 cm s-1)
-2 -1 0 1 2-2 -1 0 1 2
020
4060
8010
0
NO NO2
Figure 313 Simple NOx photochemical canopy model outputs Left panel
concentrations of NO (dashed) and NO2 (solid) right fluxes of NO (dashed) and NO2
(solid) Symbols indicate measurement heights for NO (29 m) and NO2 (22 m) at
Harvard Forest The model solves the continuity equation for NO concentration at 200
levels ddz(-Kc(dNOdz)) = PNO ndash LNO where PNO = [NO]τ1 LNO = [NO]τ2 and zero
net deposition or emission of NOx is allowed NOx = NO + NO2 is normalized to 1 ppb
τ1 = 70s in this example Due to the measurement height difference observed upward
NO2 flux due to photochemical cycling alone should be substantially larger than observed
downward NO flux attributable to the same process
74
V(O
3) (c
m s
-1)
g c(c
m s
-1)
PPFD (mmol m-2 s-1)
00 05 10 15
-05
00
05
10
15
20
00 05 10 15
-3-2
-10
12
Figure 314 Daytime (including dawn and dusk) canopy surface conductance gc and O3
exchange velocity V(O3) vs above-canopy photosynthetic photon flux density (PPFD)
during the summer of 2000 at Harvard Forest Dots are hourly values Filled squares
represent quantile-binned means (quantiles of PPFD were used to define bins and all gc
or V(O3) for data hours falling within the bins were averaged) Both quantities are
indicators of stomatal conductance and increase in absolute value with PPFD up to a
maximum level
75
exchange velocity are both related to photosynthetic photon flux density (PPFD) The
dependence is nonlinear absolute values of gc and V(O3) increase with PPFD up to
approximately 1 mmol m-2 s-1 and level off at higher PPFD values Note that PPFD is the
only continuously-monitored measure of light intensity at Harvard Forest (as with many
ecological and trace-gas monitoring stations) and is therefore used in the discussion
below as a proxy of photochemically-active UV wavelengths at the site despite the fact
that PPFD measures only the photosynthetically-active wavelength band (400-700 nm)
For the time period when eddy covariance fluxes of both NO and NO2 were
measured (29 August-8 October 2000) Figure 315 shows that the daytime (as defined by
light level PPFD gt 001 mmol m-2 s-1) upward NO2 flux was strongly correlated with the
downward NO flux We can account for more of the variance in daytime FNO2 by using
in addition to a photochemical NOx cycling term βmiddotFNO additional terms representing a
constant deposition velocity V0middot [NO2] and a stomatal flux γmiddotgc (Table 32)
FNO2 = F0 + βmiddotFNO + V0middot [NO2] + γmiddotgc (Eq 35)
The relationship between FNO2 and FNO is significant in all of the fits as shown by the
low p-values and consistent values of β Note that an upward NO2 flux contribution
could be included as either a constant (zero order) flux term F0 or as a function of
stomatal conductance γ when F0 is constrained to zero For the F0=0 cases R2 has been
calculated as follows in order to omit the origin
)var()var(1
2
2
FNOresidualR minus= (Eq 36)
The constant deposition velocity term V0 is significant when the stomatal term is also
included in the fit A flux term dependent on the square of the NO2 concentration
a[NO2]2 (not shown in Table 32) is only marginally significant regardless of which other
terms are included in the regression
76
NO
2Fl
ux (micro
mol
m-2
hr-1
)
- NO Flux (micromol m-2 hr-1)
0 2 4 6 8 10 12
-10
010
2030
40
Figure 315 Relationship between daytime hourly FNO2 and ndashFNO 29 August to 8
October 2000 FNO2 = (05plusmn01) - (35plusmn01)middotFNO R2 = 079
77
Table 32 Regressions of daytime FNO2 (as defined by light level see above covered
hours 500 to 2000 EST) in terms of linear combinations of βmiddotFNO V0middot[NO2] and γmiddotgc
F0 is the intercept for each fit representing flux at [NO2] = FNO = gc = 0 Flux units of
(nmol mol-1 cm s-1) are used Note that FNO is largely negative (downward) so that a
negative value of β represents a positive flux term
F0 plusmn std error
(nmol mol-1 cm s-1) β plusmn std error
(dimensionless) V0 plusmn std error
(cm s-1) γ plusmn std error (nmol mol-1) R2
05plusmn01 (p-valuelt1E-4)
-35plusmn01 (p-valuelt1E-4) NA NA 079
constrained to 0 -37plusmn01 (p-valuelt1E-4) NA NA 079
07plusmn02 (p-valuelt1E-4)
-38plusmn02 (p-valuelt1E-4)
-016plusmn008 (p-value=004) NA 084
constrained to 0 -37plusmn02 (p-valuelt1E-4)
003plusmn007 (p-value=07) NA 083
01plusmn03 (p-value=06 )
-35plusmn01 (p-valuelt1E-4) NA 10plusmn04
(p-value=002) 083
constrained to 0 -35plusmn01 (p-valuelt1E-4) NA 12plusmn02
(p-valuelt1E-4) 083
04plusmn03 (p-value=02)
-38plusmn02 (p-valuelt1E-4)
-018plusmn009 (p-value=005)
09plusmn05 (p-value=008) 087
constrained to 0 -38plusmn02 (p-valuelt1E-4)
-012plusmn008 (p-value=01)
13plusmn03 (p-valuelt1E-4) 087
78
The stable statistically significant relationship between the daytime fluxes of NO
and NO2 appears to indicate that although the species were measured on nearby towers at
different heights their photochemical cycling is coherent on an hourly basis This
process clearly dominates the behavior of NOx fluxes near the forest canopy but
represents neither net deposition nor net emission The next largest term appears to be a
constant deposition velocity downward flux of NO2 Finally there is a small positive
NO2 flux component which is equally well-fit as a constant flux or a stomatal
conductance-dependent term We performed additional regressions (not shown) using a
stomatal term of the form γprimemiddotgcmiddot([NO2]-[NO2]c) where [NO2]c is the compensation point
concentration below which vegetation emits NO2 While marginally significant values of
γprime could be obtained for [NO2]c values fixed between 1 and 10 nmol mol-1 the data did
not contain enough information to determine the compensation point independently In
2000 median summerfall daytime [NO2] was 11 nmol mol-1 (75th percentile=23 nmol
mol-1) Thus the vegetation at Harvard Forest usually experiences NO2 concentrations at
or below the 05 to 15 nmol mol-1 range of previously observed compensation points for
coniferous and tropical trees in chamber studies [eg Sparks et al 2001 Rondoacuten et al
1993] It is not possible to definitively attribute the small positive flux (γmiddotgc) to a
stomatal process the term could also indicate a chemical or other process which reduces
the deposition velocity under daytime conditions
To investigate the behavior of the NO2 flux beyond the limited period of NO flux
measurements we use above-canopy PPFD as a proxy for photochemical activity for our
data when NO fluxes were not measured Figure 316 shows daytime exchange
velocities of NO and NO2 plotted against PPFD For clarity hourly points are omitted
79
00 05 10 15
-10
12
34
NO2 (h=22m) leaves onNO2 (h=22m) leaves offNO (h=29m) leaves on
Exch
ange
Vel
ocity
(cm
s-1
)
PPFD (mmol m-2 s-1)
Figure 316 Daytime emission velocities of NO2 (leaves on solid triangles
leaves off open triangles) and NO (leaves on solid circles no data for leaves off
periods) plotted against photosynthetic photon flux density (PPFD) Symbols are
medians binned by percentiles of above-canopy PPFD For clarity hourly points are not
shown V(NO2) data span spring through fall 2000 while V(NO) data were collected late
August to early October 2000 only Linear fits to binned median points (exchange
velocities in units of cm s-1 PPFD in units of mmol m-2 s-1) reported in Table 33
80
and only the PPFD quantile-binned medians are plotted For each species we determine
quantiles of PPFD for daytime hours with data These quantiles define for each trace gas
species the measurement hours whose median values are shown The coupling of the bi-
directional NOx fluxes becomes more intense as the difference in light intensity from
above- to below-canopy increases during periods of high above-canopy illumination
cycling ceases as light intensity and therefore light gradient declines NO2 flux data are
segregated into full-canopy (leaves on) conditions from early June to mid-October and
leafless periods in April-May and October-November Linear regressions to the
percentile-binned medians of PPFD (V = VPPFD=0 + bmiddotPPFD) yield the following
relationships for the daytime data shown in Table 33
Before leaf-out and after leaf-fall the coefficient of PPFD in the NO2 regression
is smaller than for full-canopy conditions This expected since the leaf area index at
Harvard Forest at mid-summer is approximately 34 [Munger et al 1996] whereas the
area index for bare stems and twigs is only 09 [Barford et al 2001] The light gradient
for leaves-off conditions is smaller resulting in smaller concentration gradients and
reduced coupled NOx fluxes It is also likely that NO2 emission by the leaves contributes
to the increased slope of VNO2 vs PPFD when the canopy is developed
NO is not expected to deposit to surfaces in large amounts though there is very
little experimental evidence [Hanson et al 1991 Wesely and Hicks 2000] Soil NO
emission at Harvard Forest is small less than 09 micromol m-2 hr-1 [Munger et al 1996]
making NO unlikely to escape from the canopy before conversion to NO2 Thus the NO
flux at Harvard Forest is dominated by photochemical cycling and can be parameterized
as a function of PPFD and [NO] Coefficients for least squares fits to hourly daytime
FNO data (measurement height = 29m 29 Aug-8 Oct 2000) are shown in Table 34
81
Table 33 Linear regression of daytime percentile-binned median VNO2 and VNO
against of PPFD
VPPFD=0 plusmn std error
cm s-1 b plusmn std error
cm s-1 (mmol m-2 s-1)-1 R2
VNO2 leaves on -04 plusmn 01 (p-value=002)
27 plusmn 02 (p-valuelt1E-4) 097
VNO2 leaves off -01 plusmn 01 (p-value=03)
15 plusmn 02 (p-valuelt1E-4) 090
VNO leaves on -042 plusmn 007 (p-value=4E-4)
-05plusmn01 (p-value=7E-4) 078
82
Table 34 Regressions results for daytime FNO = F0_NO + V0_NO [NO] + bprime PPFD [NO]
F0_NO plusmn std error
(nmol mol-1 cm s-1)
bprime plusmn std error cm s-1 (mmol m-2 s-1)-1
V0_NO plusmn std error (cm s-1) R2
-008plusmn001 (p-valuelt1E-4)
-110plusmn002 (p-valuelt1E-4) NA 091
Constrained to 0
-114plusmn002 (p-valuelt1E-4)
NA 091
-006plusmn001
(p-valuelt1E-4)
-092plusmn004
(p-valuelt1E-4)
-018plusmn004
(p-valuelt1E-4) 091
Constrained to 0
-087plusmn004 (p-valuelt1E-4)
-025plusmn003
(p-valuelt1E-4) 091
83
To treat the larger daytime NO2 flux dataset we combine a terms representing the
light dependence shown in Figure 316 constant deposition velocity and stomatal
conductance Because gc was calculated assuming the presence of leaves we use the
measured deposition velocity of O3 Vd(O3) = -V(O3) as a proxy for the stomatal opening
from early spring through late fall Table 35 shows the results for the regressions using
these terms
A quadratic term amiddot[NO2]2 is not statistically significant when included because
we have few measurements with sufficiently high NO2 concentrations We interpret the
term (b+f)middotPPFDmiddot[NO2] as approximately accounting for the NO2 flux that arises from
photochemical cycling with NO (b+f) agrees well with the coefficients found in Table
33 As in the limited dataset regressions using FNO instead of PPFD (Table 32) V0
indicates an exchange velocity for NO2 on the order of -03 cm s-1 (downward) Given
the robust appearance of this term with different fit parameters for both limited and full
datasets we find it likely that V0 represents a roughly constant deposition velocity
process independent of NOx photochemical cycling during the day Though statistical
significance is low an upward flux term associated with stomatal conductance or related
variables also appears in Table 35
343 Parameterization of NOx Fluxes
Both nighttime and daytime NOx fluxes can be combined into a single
parameterization based on the above discussion This framework adopts the hypothesis
that photochemical NO-NO2 cycling can be largely accounted for by a simple light-
dependent term and that net deposition may then be estimated from additional terms
representing constant exchange velocity concentration-dependent exchange velocity and
84
Table 35 Multi-factor regression using all hourly daytime FNO2 data following the
functional form FNO2 = (b+f)middotPPFDmiddot[NO2] + V0 [NO2] + ΓmiddotVd(O3) The intercepts for all
fits have been constrained to zero The parameter f is a canopy flag set to zero for full-
canopy conditions so may be considered a correction to the PPFD term for leaves-off
periods in early spring and late fall
b plusmn std error cm s-1 (mmol m-2 s-1)-1
f plusmn std error cm s-1 (mmol m-2 s-1)-1
= 0 for leaves on V0 plusmn std error
(cm s-1) Γ plusmn std error (nmol mol-1) R2
196plusmn007 (p-valuelt1E-4)
-13plusmn01 (p-valuelt1E-4) NA NA 055
240plusmn009
(p-valueltlt1E-4)
-132plusmn009 (p-valuelt1E-4)
-035plusmn005 (p-valuelt1E-4) NA 060
196plusmn008 (p-valuelt1E-4)
-11plusmn01 (p-valuelt1E-4) NA 01plusmn01
(p-value=04) 062
229plusmn009 (p-valuelt1E-4)
-11plusmn01 (p-valuelt1E-4)
-030plusmn005 (p-valuelt1E-4)
03plusmn01 (p-value=003) 065
85
stomatal conductance-related exchange processes Thus for the height of 22 m relative to
the 20 m canopy the flux of NO2 day and night is given by the simple function of NO2
concentration PPFD and O3 deposition velocity
FNO2 = V0 middot [NO2] + amiddot[NO2]2 + (b+f)middotPPFDmiddot[NO2] + ΓmiddotVd(O3) (Eq 37)
where f is added to the coefficient of PPFD to account for the observed difference
between full-canopy and leaves-off conditions
NO is not present in significant quantities at night and FNO appears to be driven
by a simple dependence on PPFD during the day We include a constant deposition
velocity term as well since evidence of NO deposition to surfaces is weak and
inconclusive At a measurement height of 29 m the flux of NO is given by
FNO = V0_NO middot [NO] + bprime middot PPFD middot [NO] (Eq 38)
The net fluxes of NO and NO2 may be determined by omitting the photochemical terms
from Eq 37 and 38 Since we expect the deposition velocity of NO to be small
FNOx(net)asympFNO2(net)
FNOx(net) asymp V0 middot [NO2] + amiddot[NO2]2 + ΓmiddotVd(O3) (Eq 39)
Multi-factor regressions for Eq 37 and Eq 38 were performed to determine the
coefficients V0 a b f V0_NO and brsquo using all available hourly observations of [NO2]
[NO] PPFD Vd(O3) FNO2 and FNO at Harvard Forest April-November 2000 The
results are presented in Table 36 along with the range of results from the separate
daytime and nighttime analyses discussed earlier
86
Table 36 Multi-factor regressions using all available hourly observations of [NO2]
[NO] PPFD Vd(O3) FNO2 and FNO at Harvard Forest April-November 2000 Note
that Vd(O3)=deposition velocity positive values indicate downward O3 exchange
velocity
z = 22m FNO2 = V0 middot [NO2] + a middot [NO2]2 + (b+f)middotPPFDmiddot[NO2] + Γ middot Vd(O3)
coeff plusmn std err p-value
April ndash November 2000 (R2 = 060)
Range of results from separate day and night analyses
V0 (cm s-1) -021plusmn004 lt1E-4 -03 to -001
a (nmol-1 mol cm s-1) -0002plusmn0004dagger 06 -0013 to ndash0002
b (cm s-1 (mmol m-2 s-1)-1) 221plusmn007 lt1E-4 19 to 24
f (cm s-1 (mmol m-2 s-1)-1) =0 for leaves-on -110plusmn009 lt1E-4 -13 to -10
Γ (nmol mol-1) 021plusmn009 002 01 to 03
z = 29m FNO = V0_NO middot [NO] + bprime middot PPFD middot [NO]
29 August ndash 8 Oct 2000 (R2 = 092)
V0_NO (cm s-1) -025plusmn002 lt1E-4 -087 to -042
bprime (cm s-1 (mmol m-2 s-1)-1) -087plusmn003 lt1E-4 -114 to -05
daggerThe more statistically robust nighttime a =-0013 plusmn 0001 (Table 31) is recommended
87
Nearly all of the coefficients fall within the ranges determined previously except
V0 and V0_NO which differ only slightly from the earlier values As illustrated in Figures
317 and 318 Eq 37 and Eq 38 with the multi-factor regression coefficients in Table
36 are good predictors of the measured fluxes over their entire dynamic ranges and for
all sampled conditions
The diel variations of fluxes and residuals from this parameterization (Figure
319) reveal several interesting features The parameterization captures the overall diel
behavior of both NO and NO2 fluxes It also tends to underestimate the upward flux of
[NO2] during the day for northwesterly flow conditions and to slightly overestimate
during daytime southwesterly flows The disagreement rarely exceeds the 25th and 75th
quantiles of the measured fluxes The dominant flow regimes at Harvard Forest differ in
a number of key respects that may affect this result Northwesterly conditions tend to
bring lower concentrations of reactive nitrogen species cooler temperatures drier
weather and clearer skies than southwest winds [Moody et al 1998] It is possible that
one or more of these factors is contributing to the wind-sector difference in the residuals
One might expect that the residuals would depend on additional factors not taken
into consideration For example mixing and therefore deposition depends on the friction
velocity u (m s-1) As shown in figure 320 the residual NO2 flux tends upward only at
the highest u quantiles during the day and has no significant trend at night Similarly
the temperature-dependent rate for (R31) k1(T)[O3] has not been included yet we find
that the NO2 flux residuals exhibit no statistically significant trend with k1(T)[O3] (Figure
321) Although included as terms in the paratmeterization similar residual analyses are
shown for V(O3) during the day (Figure 321) and for [NO2] during the day and night
(Figure 322) The distinctly different daytime and nighttime behavior of the total NO2
flux is apparent again in Figure 322 as are the small residuals overall
88
Res
idua
l (M
es ndash
Para
m)
FN
O2
(nm
ol m
ol-1
cm s
-1)
Parameterized FNO2 (nmol mol-1 cm s-1)
Mea
sure
d FN
O2
(nm
ol m
ol-1
cm s
-1)
FNO2 = V0middot[NO2] + amiddot[NO2]2 + (b+f)middotPPFDmiddot[NO2] + ΓmiddotVd(O3)
Daytime +Nighttime
11
-20 -10 0 10 20 30
-20
-10
010
2030
Quantiles of Standard Normal
-2 0 2
-10
-50
510
Figure 317 Upper Measured vs parameterized NO2 flux shown with 11 line daytime
(+) and nighttime () The functional form the parameterization is shown at the top
Lower Residuals of FNO2 vs quantiles of the standard normal The residuals are
normally-distributed with extended upper and lower wings
89
-10 -8 -6 -4 -2 0 2
-10
-8-6
-4-2
02
Quantiles of Standard Normal
-2 0 2
-10
-05
00
05
10
15
Mea
sure
d FN
O (n
mol
mol
-1cm
s-1
)
Res
idua
l (M
es ndash
Para
m)
FN
O (n
mol
mol
-1cm
s-1)
Parameterized FNO (nmol mol-1 cm s-1)
FNO = V0_NOmiddot[NO] + b middotPPFDmiddot[NO]
11
Figure 318 Same as Figure 317 for FNO
90
Fl
ux (n
mol
mol
-1cm
s-1
)R
esid
ual (
nmol
mol
-1cm
s-1
)Measured FNO (h=22m)Measured FNO2 (h=22m)Parameterized FNOParameterized FNO2
Meas-Param FNOMeas-Param FNO2
-20
24
-20
24
NW
0 5 10 15 20
-2-1
01
2-2
-10
12
-20
24
-20
24
SW
0 5 10 15 20
-2-1
01
2-2
-10
12
Hour
Figure 319 Top panels Median diel measured (closed symbols solid lines) and
parameterized (open symbols dashed lines) fluxes of NO2 and NO Vertical bars show
the 25th and 75th quantiles for the measurements Lower panels Median diel residual
(measured-parameterized) FNO2 and FNO Northwest wind conditions are shown on the
left southwest on the right The parameterizations capture the daytime behavior of NO
flux due to the photochemical gradient and eddy diffusivity effects For NO2 under
northwesterly conditions the daytime residual is positive indicating that the
parameterization underestimates upward flux of NO2 For southwesterly conditions
daytime NO2 flux residuals are more variable and tend in the opposite direction
91
DAY NIGHT
FNO
2(n
mol
mol
-1cm
s-1
)R
esid
ual F
NO
2(n
mol
mol
-1cm
s-1
)
FNO
2(n
mol
mol
-1cm
s-1
)R
esid
ual F
NO
2(n
mol
mol
-1cm
s-1
)
Res
idua
l FN
O2
(nm
ol m
ol-1
cm s
-1)
Measured FNO2
Parameterized FNO2
Res
idua
l FN
O2
(nm
ol m
ol-1
cm s
-1)
u (m s-1) u (m s-1)
u (m s-1) u (m s-1)
-10
-50
510
00 05 10 15
-10
-50
510
-10
-50
510
00 05 10 15
-10
-50
510
00 02 04 06 08 10 12 14
-20
2
00 02 04 06 08 10 12 14
-20
2
Figure 320 From top to bottom measured and parameterized NO2 fluxes residuals
(measured-parameterized) and expanded-axes quantile-binned mean residuals (plusmn
standard deviation) vs u shown for daytime on the left and nighttime on the right
92
DAY k1(T)[O3] Day V(O3)
FNO
2(n
mol
mol
-1cm
s-1
)R
esid
ual F
NO
2(n
mol
mol
-1cm
s-1
)
FNO
2(n
mol
mol
-1cm
s-1
)R
esid
ual F
NO
2(n
mol
mol
-1cm
s-1
)
Res
idua
l FN
O2
(nm
ol m
ol-1
cm s
-1)
Measured FNO2
Parameterized FNO2
Res
idua
l FN
O2
(nm
ol m
ol-1
cm s
-1)
k1(T)[O3] (s-1) V(O3) (cm s-1)
k1(T)[O3] (s-1) V(O3) (cm s-1)
-10
010
2030
001 002 003 004
-10
-50
510
-10
010
2030
-003 -002 -001 00 001
-10
-50
510
0005 0010 0015 0020 0025 0030
-3-2
-10
12
-0015 -0010 -0005 00
-3-2
-10
12
Figure 321 Same as Figure 321 for daytime k1(T)[O3] (left) and daytime V(O3) (right)
93
DAY NIGHT
FNO
2(n
mol
mol
-1cm
s-1
)R
esid
ual F
NO
2(n
mol
mol
-1cm
s-1
)
FNO
2(n
mol
mol
-1cm
s-1
)R
esid
ual F
NO
2(n
mol
mol
-1cm
s-1
)
Res
idua
l FN
O2
(nm
ol m
ol-1
cm s
-1)
Measured FNO2
Parameterized FNO2
Res
idua
l FN
O2
(nm
ol m
ol-1
cm s
-1)
[NO2] (nmol mol-1) [NO2] (nmol mol-1)
[NO2] (nmol mol-1) [NO2] (nmol mol-1)
-10
010
2030
0 5 10 15 20
-10
-50
510
-20
-15
-10
-50
510
0 5 10 15 20
-10
-50
510
0 2 4 6 8
-3-2
-10
12
0 2 4 6 8 10 12
-20
24
Figure 322 Same as Figure 321 for [NO2] during the daytime (left) and nighttime
(right)
94
The lack of robust trends in the NO2 flux residuals indicates that within the
limitations of the dataset Eq 37 captures the crucial aspects of observed NO2 flux
behavior within and above the tall forest canopy under a wide range of conditions
Similarly Eq 38 accounts for 92 of the observed variance in the measured NO fluxes
under a somewhat narrower set of conditions (the sampling period for NO eddy
covariance flux measurements was relatively short) Figure 323 shows the resulting net
NOx flux (Eq 39 Table 36) and exchange velocity VNOx(net)=FNOx(net)[NO2] on a
diel basis for the sampling period April-November 2000 For the rural low-NOx
conditions at Harvard Forest we find that the flux of NOx is downward at all hours with
a deposition velocity of approximately 02 cm s-1
35 Conclusions
We installed a Tunable Diode Laser Absorption Spectrometer (TDLAS) to
measure continuous NO2 concentrations and eddy covariance fluxes above the canopy at
Harvard Forest during the spring summer and fall of 2000 An existing
chemiluminescence NO detector was configured to measure above-canopy eddy
covariance fluxes for a shorter period in the late summer and early fall A photolysis-
chemiluminescence (P-C) NO2 instrument also measured concentrations for a portion of
the sampling period Hourly average TDLAS and P-C NO2 concentrations agreed very
well under all conditions The agreement between the two instruments in the field and
the independent spectroscopic calibration of the TDLAS validated the long-term
measurements of the tank-calibrated P-C system
95
0 6 12 18
-10
-08
-06
-04
-02
00
-14
-12
-10
-08
-06
-04
-02
00
Net
FN
Ox
(nm
ol m
ol-1
cm s
-1)
(microm
ol m
-2hr
-1)
Net
VN
Ox
(cm
s-1
)
Hour
median| 25th amp 75th percentiles
0 6 12 18
-024
-022
-020
-018
Figure 323 Diel cycle of parameterized net NOx exchange velocity (upper panel) and
flux (lower panel) April-November 2000 FNOx(net) asymp FNO2(net) = V0middot[NO2] +
amiddot[NO2]2 + ΓmiddotVd(O3) VNOx(net) = FNO2(net)[NO2]
96
At night in the absence of significant quantities of NO we observed a consistent
downward flux of NO2 which depended quadratically on the concentration of NO2
although the dependence was apparent mainly on two nights when [NO2] was above 10
nmol mol-1 The nighttime NO2 deposition velocity varied between 02 cm s-1 at [NO2]=1
nmol mol-1 and 05 cm s-1 at [NO2]=30 nmol mol-1 These fluxes could come from direct
NO2 deposition to non-stomatal surfaces in the forest such as soil litter bark and the
outer surfaces of leaves area-normalized deposition velocities to such surfaces in
chamber measurements have varied from less than 01 to 05 cm s-1 for NO2
concentrations between 40 and 80 nmol mol-1 [Hanson and Lindberg 1991] The rate of
heterogeneous N2O5 hydrolysis resulting in aqueous-phase HNO3 (unlikely to re-enter the
gas phase) is insufficient to explain the observed nighttime NO2 deposition rates The
quadratic flux dependence and similarity to the behavior of HONO observed at other sites
suggests that heterogeneous NO2 hydrolysis may also play a significant role in NO2
deposition [Harrison and Kitto 1994 Harrison et al 1996 Barney and Finlayson-Pitts
2000] Half of any NO2 flux due to heterogeneous NO2 hydrolysis would likely escape
from the surfaces as gas-phase HONO potentially impacting the daytime HOx and NOx
budgets when photolyzed at sunrise
During the day we observed coupled fluxes of NO2 (upward) and NO
(downward) due to photochemical cycling driven by canopy-induced light and eddy
diffusivity gradients The imbalance in the observed fluxes corresponded to the
difference in height of the sampling levels relative to the canopy The exchange
velocities of the two species in their respective directions increased with higher above-
canopy light levels as measured by photosynthetic photon flux density (PPFD) due to the
97
stronger light gradient through the canopy under brighter conditions Upward NO2
velocity was smaller in early spring and late fall when there were no leaves on the trees
corresponding to a weaker light gradient condition (NO fluxes were only measured
during full-canopy conditions) and possibly to the absence of stomata-dependent
emission of NO2 We believe that these coupled fluxes are the first to be reported from a
mature tall-canopy site using reliable eddy-covariance appropriate sampling techniques
All of the NO and NO2 flux data day and night were well explained by a simple
parameterization consisting of two equations FNO2 = V0 middot [NO2] + amiddot[NO2]2 +
(b+f)middotPPFDmiddot[NO2] + ΓmiddotVd(O3) and FNO = V0_NO middot [NO] + bprime middot PPFD middot [NO] The net flux
of NOx is approximately equal to the flux of NO2 omitting the PPFD-dependent term
FNOxasympV0 middot [NO2] + amiddot[NO2]2 + ΓmiddotVd(O3) V0 and V0_NO are small constant deposition
velocity terms b and bprime are coefficients of light-dependent coupled fluxes for full-canopy
conditions and f adjusts the NO2 light-dependent term for no-leaves conditions The
deposition velocity of O3 was used as a proxy for stomatal exchange the coefficient Γ
was consistently positive Stomatal conductance correlates with a number of different
variables (light temperature humidity) complicating the interpretation of the final term
It may indicate a stomatal emission of NO2 under low-NOx conditions typical at Harvard
Forest but could also correspond to a chemical or other process which slows NO2
deposition during the day The quadratic term amiddot[NO2]2 was particularly significant at
night during a few high-[NO2] events Multi-factor regressions fitting the hourly data
with these equations yield R2 of 061 for FNO2 and 092 for FNO the coefficients
summarized in Table 36 agree with analyses of segregated daytime and nighttime data
We note that the coefficients are relevant to the specific measurement heights of NO (29
98
m) and NO2 (22 m) at Harvard Forest relative to the forest canopy height (20 m)
However the mechanism should be adaptable for more general application
During the measurement period net NO2 deposition velocity (omitting the PPFD-
dependent term associated with photochemical cycling of NOx) -(V0 + amiddot[NO2] +
ΓmiddotVd(O3)[NO2]) was between 015 and 03 cm s-1 The mean 02 cm s-1 varied by less
than 002 cm s-1 between day and night and between full-canopy and leafless conditions
NO2 deposition velocity measurements to deciduous forest canopies are scarce this result
falls just outside of the range of reported values for coniferous forests 01 to 15 cm s-1
[Hanson and Lindberg 1991 Rondoacuten et al 1993 Joss and Graber 1996] and short
crops such as alfalfa soy and oats 007 to 125 cm s-1 [Hanson and Lindberg 1991]
The only estimates of NO deposition velocity are over grass ~01 to 02 cm s-1 [Hanson
and Lindberg 1991] other observations indicate NO emission from various species
though soil emissions could confound these results [Wildt et al 1997] This is quite
close to the ~025 cm s-1 NO deposition velocity at Harvard Forest (-V0_NO) but we
cannot resolve the debate as to whether NO deposits at all [Wesely and Hicks 2000]
Concentration and flux measurements of HONO N2O5 and NO3 (along with NO
and NO2) are required to better understand the nighttime chemistry and deposition of
NOx Recently-developed continuous analyzers for HONO [Harrison et al 1996] and N-
2O5 and NO3 [Brown et al 2001] may make these measurements possible in the coming
years In addition the use of flux chambers with a TDLAS or other instrument (sub-
nmol mol-1 sensitivity and species-specific detection method) on leaf litter and soil
samples in the lab and field may facilitate direct detection of NO2 compensation points
for various species and quantify the importance of different natural surfaces
99
NOx deposition matters to both the ecosystem and the atmosphere the form of
nitrogen entering plants affects nutrient loading acid stress and toxicity and the form of
nitrogen leaving the atmosphere affects O3 production HOx chemistry and long-range
transport of anthropogenic pollutants We are hopeful that future research endeavors will
approach the problem from the perspective of both ecosystem and atmosphere at scales
ranging from the individual leaf to the vegetated landscape using reliable species-
specific and sensitive measurement techniques
References
Andreacutes-Hernaacutendez J Notholt J Hjorth and O Schrems A DOAS study on the origin of initrous acid at urban and non-urban sites Atmos Environ 30 175-180 1996
Aneja V P P A Roelle G C Murray J Southerland J W Erisman D Fowler W A H Asman and N Patni Atmospheric nitrogen compounds II emissions transport transformation deposition and assessment Atmos Environ 35 1903-1911 2001
Barford C E Hammond Pyle L Hutyra S Wofsy Ecological Measurements to compliment eddy-flux measurements at Harvard Forest [Online data archive] httpwww-asharvardedudatanigec-datahtml 2001
Barnet W S and B J Finlayson-Pitts Enhancement of N2O4 on porous glass at room temperature A key intermediate in the heterogeneous hydrolysis of NO2 J Phys Chem A 104 171-175 2000
Barney W S and B J Finlayson-Pitts Enhancement of N2O4 on Porous Glass at Room Temperature A Key Intermediate in the Heterogeneous Hydrolysis of NO2 J Phys Chem A 104 171-175 2000
Bey I D J Jacob R Yantosca J logan B Field A Fiore Q Li H Liu L Mickley M Schultz Global modeling of tropospheric chemistry with assimilated meteorology Model description and evaluation in press J Geophys Res 2001
Brown S H Stark S J Ciciora and A R Ravishankara In-situ measurement of atmospheric NO3 and N2O5 via cavity ring-down spectroscopy Geophys Res Lett 28 3237-3230 2001 (a)
100
Brown S H Stark S J Ciciora and A R Ravishankara In-situ Detection of Atmospheric NO3 and N2O5 via Cavity Ring-Down Spectroscopy EOS Trans AGU 82 Fall Meeting Suppl A41B-0045 2001 (b)
Coe H and M W Gallagher Measurements of dry deposition of NO2 to a Dutch heathland using the eddy-correlation technique Q J R Meteorol Soc118 767-786 1992
Delaney A C D R Fitzjarrald D H Lenschow R Pearson Jr G J Wendel B Woodruff Direct Measurements of Nitrogen Oxides and Ozone Fluxes over Grassland J Atmos Chem 4 429-444 1986
Eugster W and R Hesterberg Transfer resistances of NO2 determined from eddy correlation flux measurements over a litter meadow at a rural site on the Swiss plateau Atmos Environ 30 1247-1254 1996
Fitzjarrald D R and D H Lenschow Mean concentration and flux profiles for chemically reactive species in the atmospheric surface layer Atmos Environ 17 2505-2512 1983
Galmarini S P G Duynkerke J Vila-Guerau De Arellano Evolution of Nitrogen Oxide Chemistry in the Nocturnal Boundary Layer J Appl Meteorology 36 943-957 1997
Gao W M L Wesely P V Doskey Numerical Modeling of the Turbulent Diffusion and Chemistry of NOx O3 Isoprene and Other Reactive Trace Gases in and Above a Forest Canopy J Geophys Res 98 18339-18353 1993
Gao W and M L Wesely Numerical Modeling of the Turbulent Fluxes of Chemically Reactive Trace Gases in the Atmospheric Boundary Layer J Appl Meteorology 33 835-847 1994
Goodman A L G M Underwood and V H Grassian Heterogeneous Reaction of NO2 Characterization of Gas-Phase and Adsorbed Products from the Reaction 2NO2(g) + H2O(a) HONO(g) + HNO3(a) on Hydrated Silica Particles J Phys Chem A 103 7217-7223 1999
Goulden ML JW Munger S-M Fan B C Daube and S C Wofsy Measurements of carbon sequestration by long-term eddy covariance Methods and a critical evaluation of accuracy Global Change Biology 2 169-182 1996
Harrison R M A-M N Kitto Evidence for a surface source of atmospheric nitrous acid Atmos Environ 28 1089-1094 1994
Harrison R M J D Peak G M Collins Tropospheric cycle of nitrous acid J Geophys Res 101 14429-14439 1996
101
Heal M R B B B Booth J N Cape K J Hargreaves The influence of simplified peroxy radical chemistry on the interpretation of NO2-NO-O3 surface exchange Atmos Environ 35 1687-1696 2001
Horii C V M S Zahniser D D Nelson J B McManus S C Wofsy Nitric Acid and Nitrogen Dioxide Flux Measurements a New Application of Tunable Diode Laser Absorption Spectroscopy Proc of SPIE 3758 152-161 1999
Hosker R P Jr and S E Lindberg Review Atmospheric deposition and plant assimilation of gases and particles Atmos Environ 16 889-910 1982
Hanson P and S E Lindberg Dry deposition of reactive nitrogen compounds a review of leaf canopy and non-foliar measurements Atmos Environ 25A 1615-1634 1991
Jacob D J Heterogeneous chemistry and tropospheric ozone Atmos Environ 34 2131-2159 2000
Joss U and W K Graber Profiles and Simulated Exchange of H2O O3 NO2 Between the Atmosphere and the HartX Scots Pine Plantation Theor Appl Climatol 53 157-172 1996
Lefer B L and R W Talbot Nitric acid and ammonia at a rural northeaster US site J Geophys Res 104 1645-1661 1999
Lerdau M T J W Munger D J Jacob The NO2 Flux Conumdrum Science289 2291-2293 2000
Moody J L J W Munger A H Goldstein D J Jacob and S C Wofsy Harvard Forest regional-scale air mass composition by Patterns in Atmospheric Transport History (PATH) J Geophys Res 103 13181-13194 1998
Munger J W S C Wofsy P S Bakwin S-M Fan M L Goulden B C Daube and A H Goldstein Atmospheric deposition of reactive nitrogen oxides and ozone in a temperate deciduous forest and a subarctic woodland 1 Measurements and mechanisms J Geophys Res 101 12639-12657 1996
Munger J W S-M Fan P S Bakwin M L Goulden A H Goldstein A S Colman and S C Wofsy Regional budgets for nitrogen oxides from continental sources Variations of rates for oxidation and deposition with season and distance from source regions J Geophys Res 103 8355-8368 1998
Notholt J J Hjorth and F Raes Formation of HNO2 on aerosol surfaces during foggy periods in the presence of NO and NO2 Atmos Environ 26A 211-217 1992
Padro J Zhang L and W J Massman An analysis of measurements and modlling of air-surface exchange of NO-NO2-O3 over grass Atmos Environ 32 1365-1375 1998
102
103
Rondon A C Johansson L Granat Dry Deposition of Nitrogen Dioxide and Ozone to Coniferous Forests J Geophys Res 98 5159-5172 1993
Rothman LS et al The HITRAN molecular spectroscopic database and HAWKS (HITRAN Atmospheric Workstation) 1996 Edition J Quant Spectrosc Radiat Transfer 60 665-710 1998
Sparks J P R K Monson K L Sparks M Lerdau Leaf uptake of nitrogen dioxide (NO2) in a tropical wet forest implications for tropospheric chemistry Oecologia 127 214-221 2001
Stocker D W D H Stedman K F Zeller W J Massman D G Fox Fluxes of Nitrogen Oxides and Ozone Measured by Eddy Correlation Over a Shortgrass Prairie J Geophys Res 98 12619-12630 1993
Walton S M W Gallagher T W Choularton J Duyzer Ozone and NO2 Exchange to Fruit Orchards Atmos Environ 31 2767-2776 1997
Wesely M L J A Eastman D H Stedman E D Yalvac An eddy-correlation measurement of NO2 flux to vegetation and comparison to O3 flux Atmos Environ 16 815-820 1982
Wesely M L Parameterization of surface resistances to gaseous dry deposition in regional-scale numerical models Atmos Environ 23 1293-1304 1989
Wesley M L and B B Hicks A review of the current status of knowledge on dry deposition Atmos Environ 34 2261-2282 2000
Wildt J D Kley A Rockel P Rockel H J Schneider Emission of NO from several higher plant species J Geophys Res 102 5919-5927 1997
- April ndash November 2000
- G (nmol mol-1)
- 29 August ndash 8 Oct 2000
- References
- Chapter3_NOx_Part2pdf
-
- 34 Discussion
-
- Chapter3_NOx_Part1pdf
-
- 32 Methods
- 33 Results
-

2
2222
][][
τNO
NOjPL NONO === (Eq 34)
We scaled Kc(z) from Gao et al [1993] to the height of the Harvard Forest
canopy 20 m and approximated the effect of the light gradient from Figure 311 on the
lifetime of NO2 τ2(z) as shown in Figure 312 based on measurements made manually
with an Eppley UV photometer We estimated τ1asymp70s based on median k1(T) and [O3]
for the site the vertical gradient for O3 is small between 20 and 30 m making the
constant lifetime a reasonable approximation We then solved Eq 32 for NO and NO2 to
derive a simple model of vertical transport and photochemical cycling of NOx shown in
Figure 313
This calculation clarifies the cause of the imbalance between daytime NO and
NO2 fluxes observed in the time series and diel cycles in Figures 34 and 35 Because
the concentrations and fluxes of the two species were measured at separate heights 22 m
for NO2 and 29 m for NO they sampled different points along the concentration and flux
gradients induced by reduced light conditions below the canopy The larger observed
upward NO2 flux is expected based solely on photochemical cycling at a sampling point
closer to the canopy than that of NO
In addition to NO and NO2 fluxes corresponding to photochemical cycling
between the two NO2 is likely to interact with the vegetation via stomata during daylight
hours Canopy surface conductance gc is readily calculated using the Penman-Monteith
equation [Shuttleworth et al 1984] and the measured water vapor flux at Harvard Forest
Deposition velocities for species known to deposit through stomata (ie O3) correlate
strongly with gc [Munger et al 1996] As shown in Figure 314 daytime gc and the O3
72
01 05 50 500
020
4060
8010
0
0 1000 2000 30000 1000 2000 3000
020
4060
8010
0
Eddy Diffusivity K (m2 s-1) τ2 (s)
heig
ht (m
)
01 05 50 500
020
4060
8010
0
0 1000 2000 30000 1000 2000 3000
020
4060
8010
0
Eddy Diffusivity K (m2 s-1) τ2 (s)
heig
ht (m
)
Figure 312 Simple NOx photochemical canopy model inputs Eddy diffusivities are
scaled from Gao et al [1993] to the Harvard Forest canopy height of 20 m τ2 the
lifetime of NO2 against photolysis (reaction 2 NO2 + hν NO + O) scales inversely
with UV radiation τ2 was estimated for typical conditions of [O3] [NO][NO2] and
daytime UV profile under full-canopy conditions at the site The simple canopy model
also accepts an estimate of τ1 the lifetime of NO against reaction with O3 (reaction 31)
73
Concentration (nmol mol-1)
heig
ht (m
)
00 02 04 06 08 10
020
4060
8010
0
NO NO2
Normalized NOx = NO+NO2 = 1 nmol mol-1
Flux (nmol mol-1 cm s-1)
-2 -1 0 1 2-2 -1 0 1 2
020
4060
8010
0
NO NO2
Figure 313 Simple NOx photochemical canopy model outputs Left panel
concentrations of NO (dashed) and NO2 (solid) right fluxes of NO (dashed) and NO2
(solid) Symbols indicate measurement heights for NO (29 m) and NO2 (22 m) at
Harvard Forest The model solves the continuity equation for NO concentration at 200
levels ddz(-Kc(dNOdz)) = PNO ndash LNO where PNO = [NO]τ1 LNO = [NO]τ2 and zero
net deposition or emission of NOx is allowed NOx = NO + NO2 is normalized to 1 ppb
τ1 = 70s in this example Due to the measurement height difference observed upward
NO2 flux due to photochemical cycling alone should be substantially larger than observed
downward NO flux attributable to the same process
74
V(O
3) (c
m s
-1)
g c(c
m s
-1)
PPFD (mmol m-2 s-1)
00 05 10 15
-05
00
05
10
15
20
00 05 10 15
-3-2
-10
12
Figure 314 Daytime (including dawn and dusk) canopy surface conductance gc and O3
exchange velocity V(O3) vs above-canopy photosynthetic photon flux density (PPFD)
during the summer of 2000 at Harvard Forest Dots are hourly values Filled squares
represent quantile-binned means (quantiles of PPFD were used to define bins and all gc
or V(O3) for data hours falling within the bins were averaged) Both quantities are
indicators of stomatal conductance and increase in absolute value with PPFD up to a
maximum level
75
exchange velocity are both related to photosynthetic photon flux density (PPFD) The
dependence is nonlinear absolute values of gc and V(O3) increase with PPFD up to
approximately 1 mmol m-2 s-1 and level off at higher PPFD values Note that PPFD is the
only continuously-monitored measure of light intensity at Harvard Forest (as with many
ecological and trace-gas monitoring stations) and is therefore used in the discussion
below as a proxy of photochemically-active UV wavelengths at the site despite the fact
that PPFD measures only the photosynthetically-active wavelength band (400-700 nm)
For the time period when eddy covariance fluxes of both NO and NO2 were
measured (29 August-8 October 2000) Figure 315 shows that the daytime (as defined by
light level PPFD gt 001 mmol m-2 s-1) upward NO2 flux was strongly correlated with the
downward NO flux We can account for more of the variance in daytime FNO2 by using
in addition to a photochemical NOx cycling term βmiddotFNO additional terms representing a
constant deposition velocity V0middot [NO2] and a stomatal flux γmiddotgc (Table 32)
FNO2 = F0 + βmiddotFNO + V0middot [NO2] + γmiddotgc (Eq 35)
The relationship between FNO2 and FNO is significant in all of the fits as shown by the
low p-values and consistent values of β Note that an upward NO2 flux contribution
could be included as either a constant (zero order) flux term F0 or as a function of
stomatal conductance γ when F0 is constrained to zero For the F0=0 cases R2 has been
calculated as follows in order to omit the origin
)var()var(1
2
2
FNOresidualR minus= (Eq 36)
The constant deposition velocity term V0 is significant when the stomatal term is also
included in the fit A flux term dependent on the square of the NO2 concentration
a[NO2]2 (not shown in Table 32) is only marginally significant regardless of which other
terms are included in the regression
76
NO
2Fl
ux (micro
mol
m-2
hr-1
)
- NO Flux (micromol m-2 hr-1)
0 2 4 6 8 10 12
-10
010
2030
40
Figure 315 Relationship between daytime hourly FNO2 and ndashFNO 29 August to 8
October 2000 FNO2 = (05plusmn01) - (35plusmn01)middotFNO R2 = 079
77
Table 32 Regressions of daytime FNO2 (as defined by light level see above covered
hours 500 to 2000 EST) in terms of linear combinations of βmiddotFNO V0middot[NO2] and γmiddotgc
F0 is the intercept for each fit representing flux at [NO2] = FNO = gc = 0 Flux units of
(nmol mol-1 cm s-1) are used Note that FNO is largely negative (downward) so that a
negative value of β represents a positive flux term
F0 plusmn std error
(nmol mol-1 cm s-1) β plusmn std error
(dimensionless) V0 plusmn std error
(cm s-1) γ plusmn std error (nmol mol-1) R2
05plusmn01 (p-valuelt1E-4)
-35plusmn01 (p-valuelt1E-4) NA NA 079
constrained to 0 -37plusmn01 (p-valuelt1E-4) NA NA 079
07plusmn02 (p-valuelt1E-4)
-38plusmn02 (p-valuelt1E-4)
-016plusmn008 (p-value=004) NA 084
constrained to 0 -37plusmn02 (p-valuelt1E-4)
003plusmn007 (p-value=07) NA 083
01plusmn03 (p-value=06 )
-35plusmn01 (p-valuelt1E-4) NA 10plusmn04
(p-value=002) 083
constrained to 0 -35plusmn01 (p-valuelt1E-4) NA 12plusmn02
(p-valuelt1E-4) 083
04plusmn03 (p-value=02)
-38plusmn02 (p-valuelt1E-4)
-018plusmn009 (p-value=005)
09plusmn05 (p-value=008) 087
constrained to 0 -38plusmn02 (p-valuelt1E-4)
-012plusmn008 (p-value=01)
13plusmn03 (p-valuelt1E-4) 087
78
The stable statistically significant relationship between the daytime fluxes of NO
and NO2 appears to indicate that although the species were measured on nearby towers at
different heights their photochemical cycling is coherent on an hourly basis This
process clearly dominates the behavior of NOx fluxes near the forest canopy but
represents neither net deposition nor net emission The next largest term appears to be a
constant deposition velocity downward flux of NO2 Finally there is a small positive
NO2 flux component which is equally well-fit as a constant flux or a stomatal
conductance-dependent term We performed additional regressions (not shown) using a
stomatal term of the form γprimemiddotgcmiddot([NO2]-[NO2]c) where [NO2]c is the compensation point
concentration below which vegetation emits NO2 While marginally significant values of
γprime could be obtained for [NO2]c values fixed between 1 and 10 nmol mol-1 the data did
not contain enough information to determine the compensation point independently In
2000 median summerfall daytime [NO2] was 11 nmol mol-1 (75th percentile=23 nmol
mol-1) Thus the vegetation at Harvard Forest usually experiences NO2 concentrations at
or below the 05 to 15 nmol mol-1 range of previously observed compensation points for
coniferous and tropical trees in chamber studies [eg Sparks et al 2001 Rondoacuten et al
1993] It is not possible to definitively attribute the small positive flux (γmiddotgc) to a
stomatal process the term could also indicate a chemical or other process which reduces
the deposition velocity under daytime conditions
To investigate the behavior of the NO2 flux beyond the limited period of NO flux
measurements we use above-canopy PPFD as a proxy for photochemical activity for our
data when NO fluxes were not measured Figure 316 shows daytime exchange
velocities of NO and NO2 plotted against PPFD For clarity hourly points are omitted
79
00 05 10 15
-10
12
34
NO2 (h=22m) leaves onNO2 (h=22m) leaves offNO (h=29m) leaves on
Exch
ange
Vel
ocity
(cm
s-1
)
PPFD (mmol m-2 s-1)
Figure 316 Daytime emission velocities of NO2 (leaves on solid triangles
leaves off open triangles) and NO (leaves on solid circles no data for leaves off
periods) plotted against photosynthetic photon flux density (PPFD) Symbols are
medians binned by percentiles of above-canopy PPFD For clarity hourly points are not
shown V(NO2) data span spring through fall 2000 while V(NO) data were collected late
August to early October 2000 only Linear fits to binned median points (exchange
velocities in units of cm s-1 PPFD in units of mmol m-2 s-1) reported in Table 33
80
and only the PPFD quantile-binned medians are plotted For each species we determine
quantiles of PPFD for daytime hours with data These quantiles define for each trace gas
species the measurement hours whose median values are shown The coupling of the bi-
directional NOx fluxes becomes more intense as the difference in light intensity from
above- to below-canopy increases during periods of high above-canopy illumination
cycling ceases as light intensity and therefore light gradient declines NO2 flux data are
segregated into full-canopy (leaves on) conditions from early June to mid-October and
leafless periods in April-May and October-November Linear regressions to the
percentile-binned medians of PPFD (V = VPPFD=0 + bmiddotPPFD) yield the following
relationships for the daytime data shown in Table 33
Before leaf-out and after leaf-fall the coefficient of PPFD in the NO2 regression
is smaller than for full-canopy conditions This expected since the leaf area index at
Harvard Forest at mid-summer is approximately 34 [Munger et al 1996] whereas the
area index for bare stems and twigs is only 09 [Barford et al 2001] The light gradient
for leaves-off conditions is smaller resulting in smaller concentration gradients and
reduced coupled NOx fluxes It is also likely that NO2 emission by the leaves contributes
to the increased slope of VNO2 vs PPFD when the canopy is developed
NO is not expected to deposit to surfaces in large amounts though there is very
little experimental evidence [Hanson et al 1991 Wesely and Hicks 2000] Soil NO
emission at Harvard Forest is small less than 09 micromol m-2 hr-1 [Munger et al 1996]
making NO unlikely to escape from the canopy before conversion to NO2 Thus the NO
flux at Harvard Forest is dominated by photochemical cycling and can be parameterized
as a function of PPFD and [NO] Coefficients for least squares fits to hourly daytime
FNO data (measurement height = 29m 29 Aug-8 Oct 2000) are shown in Table 34
81
Table 33 Linear regression of daytime percentile-binned median VNO2 and VNO
against of PPFD
VPPFD=0 plusmn std error
cm s-1 b plusmn std error
cm s-1 (mmol m-2 s-1)-1 R2
VNO2 leaves on -04 plusmn 01 (p-value=002)
27 plusmn 02 (p-valuelt1E-4) 097
VNO2 leaves off -01 plusmn 01 (p-value=03)
15 plusmn 02 (p-valuelt1E-4) 090
VNO leaves on -042 plusmn 007 (p-value=4E-4)
-05plusmn01 (p-value=7E-4) 078
82
Table 34 Regressions results for daytime FNO = F0_NO + V0_NO [NO] + bprime PPFD [NO]
F0_NO plusmn std error
(nmol mol-1 cm s-1)
bprime plusmn std error cm s-1 (mmol m-2 s-1)-1
V0_NO plusmn std error (cm s-1) R2
-008plusmn001 (p-valuelt1E-4)
-110plusmn002 (p-valuelt1E-4) NA 091
Constrained to 0
-114plusmn002 (p-valuelt1E-4)
NA 091
-006plusmn001
(p-valuelt1E-4)
-092plusmn004
(p-valuelt1E-4)
-018plusmn004
(p-valuelt1E-4) 091
Constrained to 0
-087plusmn004 (p-valuelt1E-4)
-025plusmn003
(p-valuelt1E-4) 091
83
To treat the larger daytime NO2 flux dataset we combine a terms representing the
light dependence shown in Figure 316 constant deposition velocity and stomatal
conductance Because gc was calculated assuming the presence of leaves we use the
measured deposition velocity of O3 Vd(O3) = -V(O3) as a proxy for the stomatal opening
from early spring through late fall Table 35 shows the results for the regressions using
these terms
A quadratic term amiddot[NO2]2 is not statistically significant when included because
we have few measurements with sufficiently high NO2 concentrations We interpret the
term (b+f)middotPPFDmiddot[NO2] as approximately accounting for the NO2 flux that arises from
photochemical cycling with NO (b+f) agrees well with the coefficients found in Table
33 As in the limited dataset regressions using FNO instead of PPFD (Table 32) V0
indicates an exchange velocity for NO2 on the order of -03 cm s-1 (downward) Given
the robust appearance of this term with different fit parameters for both limited and full
datasets we find it likely that V0 represents a roughly constant deposition velocity
process independent of NOx photochemical cycling during the day Though statistical
significance is low an upward flux term associated with stomatal conductance or related
variables also appears in Table 35
343 Parameterization of NOx Fluxes
Both nighttime and daytime NOx fluxes can be combined into a single
parameterization based on the above discussion This framework adopts the hypothesis
that photochemical NO-NO2 cycling can be largely accounted for by a simple light-
dependent term and that net deposition may then be estimated from additional terms
representing constant exchange velocity concentration-dependent exchange velocity and
84
Table 35 Multi-factor regression using all hourly daytime FNO2 data following the
functional form FNO2 = (b+f)middotPPFDmiddot[NO2] + V0 [NO2] + ΓmiddotVd(O3) The intercepts for all
fits have been constrained to zero The parameter f is a canopy flag set to zero for full-
canopy conditions so may be considered a correction to the PPFD term for leaves-off
periods in early spring and late fall
b plusmn std error cm s-1 (mmol m-2 s-1)-1
f plusmn std error cm s-1 (mmol m-2 s-1)-1
= 0 for leaves on V0 plusmn std error
(cm s-1) Γ plusmn std error (nmol mol-1) R2
196plusmn007 (p-valuelt1E-4)
-13plusmn01 (p-valuelt1E-4) NA NA 055
240plusmn009
(p-valueltlt1E-4)
-132plusmn009 (p-valuelt1E-4)
-035plusmn005 (p-valuelt1E-4) NA 060
196plusmn008 (p-valuelt1E-4)
-11plusmn01 (p-valuelt1E-4) NA 01plusmn01
(p-value=04) 062
229plusmn009 (p-valuelt1E-4)
-11plusmn01 (p-valuelt1E-4)
-030plusmn005 (p-valuelt1E-4)
03plusmn01 (p-value=003) 065
85
stomatal conductance-related exchange processes Thus for the height of 22 m relative to
the 20 m canopy the flux of NO2 day and night is given by the simple function of NO2
concentration PPFD and O3 deposition velocity
FNO2 = V0 middot [NO2] + amiddot[NO2]2 + (b+f)middotPPFDmiddot[NO2] + ΓmiddotVd(O3) (Eq 37)
where f is added to the coefficient of PPFD to account for the observed difference
between full-canopy and leaves-off conditions
NO is not present in significant quantities at night and FNO appears to be driven
by a simple dependence on PPFD during the day We include a constant deposition
velocity term as well since evidence of NO deposition to surfaces is weak and
inconclusive At a measurement height of 29 m the flux of NO is given by
FNO = V0_NO middot [NO] + bprime middot PPFD middot [NO] (Eq 38)
The net fluxes of NO and NO2 may be determined by omitting the photochemical terms
from Eq 37 and 38 Since we expect the deposition velocity of NO to be small
FNOx(net)asympFNO2(net)
FNOx(net) asymp V0 middot [NO2] + amiddot[NO2]2 + ΓmiddotVd(O3) (Eq 39)
Multi-factor regressions for Eq 37 and Eq 38 were performed to determine the
coefficients V0 a b f V0_NO and brsquo using all available hourly observations of [NO2]
[NO] PPFD Vd(O3) FNO2 and FNO at Harvard Forest April-November 2000 The
results are presented in Table 36 along with the range of results from the separate
daytime and nighttime analyses discussed earlier
86
Table 36 Multi-factor regressions using all available hourly observations of [NO2]
[NO] PPFD Vd(O3) FNO2 and FNO at Harvard Forest April-November 2000 Note
that Vd(O3)=deposition velocity positive values indicate downward O3 exchange
velocity
z = 22m FNO2 = V0 middot [NO2] + a middot [NO2]2 + (b+f)middotPPFDmiddot[NO2] + Γ middot Vd(O3)
coeff plusmn std err p-value
April ndash November 2000 (R2 = 060)
Range of results from separate day and night analyses
V0 (cm s-1) -021plusmn004 lt1E-4 -03 to -001
a (nmol-1 mol cm s-1) -0002plusmn0004dagger 06 -0013 to ndash0002
b (cm s-1 (mmol m-2 s-1)-1) 221plusmn007 lt1E-4 19 to 24
f (cm s-1 (mmol m-2 s-1)-1) =0 for leaves-on -110plusmn009 lt1E-4 -13 to -10
Γ (nmol mol-1) 021plusmn009 002 01 to 03
z = 29m FNO = V0_NO middot [NO] + bprime middot PPFD middot [NO]
29 August ndash 8 Oct 2000 (R2 = 092)
V0_NO (cm s-1) -025plusmn002 lt1E-4 -087 to -042
bprime (cm s-1 (mmol m-2 s-1)-1) -087plusmn003 lt1E-4 -114 to -05
daggerThe more statistically robust nighttime a =-0013 plusmn 0001 (Table 31) is recommended
87
Nearly all of the coefficients fall within the ranges determined previously except
V0 and V0_NO which differ only slightly from the earlier values As illustrated in Figures
317 and 318 Eq 37 and Eq 38 with the multi-factor regression coefficients in Table
36 are good predictors of the measured fluxes over their entire dynamic ranges and for
all sampled conditions
The diel variations of fluxes and residuals from this parameterization (Figure
319) reveal several interesting features The parameterization captures the overall diel
behavior of both NO and NO2 fluxes It also tends to underestimate the upward flux of
[NO2] during the day for northwesterly flow conditions and to slightly overestimate
during daytime southwesterly flows The disagreement rarely exceeds the 25th and 75th
quantiles of the measured fluxes The dominant flow regimes at Harvard Forest differ in
a number of key respects that may affect this result Northwesterly conditions tend to
bring lower concentrations of reactive nitrogen species cooler temperatures drier
weather and clearer skies than southwest winds [Moody et al 1998] It is possible that
one or more of these factors is contributing to the wind-sector difference in the residuals
One might expect that the residuals would depend on additional factors not taken
into consideration For example mixing and therefore deposition depends on the friction
velocity u (m s-1) As shown in figure 320 the residual NO2 flux tends upward only at
the highest u quantiles during the day and has no significant trend at night Similarly
the temperature-dependent rate for (R31) k1(T)[O3] has not been included yet we find
that the NO2 flux residuals exhibit no statistically significant trend with k1(T)[O3] (Figure
321) Although included as terms in the paratmeterization similar residual analyses are
shown for V(O3) during the day (Figure 321) and for [NO2] during the day and night
(Figure 322) The distinctly different daytime and nighttime behavior of the total NO2
flux is apparent again in Figure 322 as are the small residuals overall
88
Res
idua
l (M
es ndash
Para
m)
FN
O2
(nm
ol m
ol-1
cm s
-1)
Parameterized FNO2 (nmol mol-1 cm s-1)
Mea
sure
d FN
O2
(nm
ol m
ol-1
cm s
-1)
FNO2 = V0middot[NO2] + amiddot[NO2]2 + (b+f)middotPPFDmiddot[NO2] + ΓmiddotVd(O3)
Daytime +Nighttime
11
-20 -10 0 10 20 30
-20
-10
010
2030
Quantiles of Standard Normal
-2 0 2
-10
-50
510
Figure 317 Upper Measured vs parameterized NO2 flux shown with 11 line daytime
(+) and nighttime () The functional form the parameterization is shown at the top
Lower Residuals of FNO2 vs quantiles of the standard normal The residuals are
normally-distributed with extended upper and lower wings
89
-10 -8 -6 -4 -2 0 2
-10
-8-6
-4-2
02
Quantiles of Standard Normal
-2 0 2
-10
-05
00
05
10
15
Mea
sure
d FN
O (n
mol
mol
-1cm
s-1
)
Res
idua
l (M
es ndash
Para
m)
FN
O (n
mol
mol
-1cm
s-1)
Parameterized FNO (nmol mol-1 cm s-1)
FNO = V0_NOmiddot[NO] + b middotPPFDmiddot[NO]
11
Figure 318 Same as Figure 317 for FNO
90
Fl
ux (n
mol
mol
-1cm
s-1
)R
esid
ual (
nmol
mol
-1cm
s-1
)Measured FNO (h=22m)Measured FNO2 (h=22m)Parameterized FNOParameterized FNO2
Meas-Param FNOMeas-Param FNO2
-20
24
-20
24
NW
0 5 10 15 20
-2-1
01
2-2
-10
12
-20
24
-20
24
SW
0 5 10 15 20
-2-1
01
2-2
-10
12
Hour
Figure 319 Top panels Median diel measured (closed symbols solid lines) and
parameterized (open symbols dashed lines) fluxes of NO2 and NO Vertical bars show
the 25th and 75th quantiles for the measurements Lower panels Median diel residual
(measured-parameterized) FNO2 and FNO Northwest wind conditions are shown on the
left southwest on the right The parameterizations capture the daytime behavior of NO
flux due to the photochemical gradient and eddy diffusivity effects For NO2 under
northwesterly conditions the daytime residual is positive indicating that the
parameterization underestimates upward flux of NO2 For southwesterly conditions
daytime NO2 flux residuals are more variable and tend in the opposite direction
91
DAY NIGHT
FNO
2(n
mol
mol
-1cm
s-1
)R
esid
ual F
NO
2(n
mol
mol
-1cm
s-1
)
FNO
2(n
mol
mol
-1cm
s-1
)R
esid
ual F
NO
2(n
mol
mol
-1cm
s-1
)
Res
idua
l FN
O2
(nm
ol m
ol-1
cm s
-1)
Measured FNO2
Parameterized FNO2
Res
idua
l FN
O2
(nm
ol m
ol-1
cm s
-1)
u (m s-1) u (m s-1)
u (m s-1) u (m s-1)
-10
-50
510
00 05 10 15
-10
-50
510
-10
-50
510
00 05 10 15
-10
-50
510
00 02 04 06 08 10 12 14
-20
2
00 02 04 06 08 10 12 14
-20
2
Figure 320 From top to bottom measured and parameterized NO2 fluxes residuals
(measured-parameterized) and expanded-axes quantile-binned mean residuals (plusmn
standard deviation) vs u shown for daytime on the left and nighttime on the right
92
DAY k1(T)[O3] Day V(O3)
FNO
2(n
mol
mol
-1cm
s-1
)R
esid
ual F
NO
2(n
mol
mol
-1cm
s-1
)
FNO
2(n
mol
mol
-1cm
s-1
)R
esid
ual F
NO
2(n
mol
mol
-1cm
s-1
)
Res
idua
l FN
O2
(nm
ol m
ol-1
cm s
-1)
Measured FNO2
Parameterized FNO2
Res
idua
l FN
O2
(nm
ol m
ol-1
cm s
-1)
k1(T)[O3] (s-1) V(O3) (cm s-1)
k1(T)[O3] (s-1) V(O3) (cm s-1)
-10
010
2030
001 002 003 004
-10
-50
510
-10
010
2030
-003 -002 -001 00 001
-10
-50
510
0005 0010 0015 0020 0025 0030
-3-2
-10
12
-0015 -0010 -0005 00
-3-2
-10
12
Figure 321 Same as Figure 321 for daytime k1(T)[O3] (left) and daytime V(O3) (right)
93
DAY NIGHT
FNO
2(n
mol
mol
-1cm
s-1
)R
esid
ual F
NO
2(n
mol
mol
-1cm
s-1
)
FNO
2(n
mol
mol
-1cm
s-1
)R
esid
ual F
NO
2(n
mol
mol
-1cm
s-1
)
Res
idua
l FN
O2
(nm
ol m
ol-1
cm s
-1)
Measured FNO2
Parameterized FNO2
Res
idua
l FN
O2
(nm
ol m
ol-1
cm s
-1)
[NO2] (nmol mol-1) [NO2] (nmol mol-1)
[NO2] (nmol mol-1) [NO2] (nmol mol-1)
-10
010
2030
0 5 10 15 20
-10
-50
510
-20
-15
-10
-50
510
0 5 10 15 20
-10
-50
510
0 2 4 6 8
-3-2
-10
12
0 2 4 6 8 10 12
-20
24
Figure 322 Same as Figure 321 for [NO2] during the daytime (left) and nighttime
(right)
94
The lack of robust trends in the NO2 flux residuals indicates that within the
limitations of the dataset Eq 37 captures the crucial aspects of observed NO2 flux
behavior within and above the tall forest canopy under a wide range of conditions
Similarly Eq 38 accounts for 92 of the observed variance in the measured NO fluxes
under a somewhat narrower set of conditions (the sampling period for NO eddy
covariance flux measurements was relatively short) Figure 323 shows the resulting net
NOx flux (Eq 39 Table 36) and exchange velocity VNOx(net)=FNOx(net)[NO2] on a
diel basis for the sampling period April-November 2000 For the rural low-NOx
conditions at Harvard Forest we find that the flux of NOx is downward at all hours with
a deposition velocity of approximately 02 cm s-1
35 Conclusions
We installed a Tunable Diode Laser Absorption Spectrometer (TDLAS) to
measure continuous NO2 concentrations and eddy covariance fluxes above the canopy at
Harvard Forest during the spring summer and fall of 2000 An existing
chemiluminescence NO detector was configured to measure above-canopy eddy
covariance fluxes for a shorter period in the late summer and early fall A photolysis-
chemiluminescence (P-C) NO2 instrument also measured concentrations for a portion of
the sampling period Hourly average TDLAS and P-C NO2 concentrations agreed very
well under all conditions The agreement between the two instruments in the field and
the independent spectroscopic calibration of the TDLAS validated the long-term
measurements of the tank-calibrated P-C system
95
0 6 12 18
-10
-08
-06
-04
-02
00
-14
-12
-10
-08
-06
-04
-02
00
Net
FN
Ox
(nm
ol m
ol-1
cm s
-1)
(microm
ol m
-2hr
-1)
Net
VN
Ox
(cm
s-1
)
Hour
median| 25th amp 75th percentiles
0 6 12 18
-024
-022
-020
-018
Figure 323 Diel cycle of parameterized net NOx exchange velocity (upper panel) and
flux (lower panel) April-November 2000 FNOx(net) asymp FNO2(net) = V0middot[NO2] +
amiddot[NO2]2 + ΓmiddotVd(O3) VNOx(net) = FNO2(net)[NO2]
96
At night in the absence of significant quantities of NO we observed a consistent
downward flux of NO2 which depended quadratically on the concentration of NO2
although the dependence was apparent mainly on two nights when [NO2] was above 10
nmol mol-1 The nighttime NO2 deposition velocity varied between 02 cm s-1 at [NO2]=1
nmol mol-1 and 05 cm s-1 at [NO2]=30 nmol mol-1 These fluxes could come from direct
NO2 deposition to non-stomatal surfaces in the forest such as soil litter bark and the
outer surfaces of leaves area-normalized deposition velocities to such surfaces in
chamber measurements have varied from less than 01 to 05 cm s-1 for NO2
concentrations between 40 and 80 nmol mol-1 [Hanson and Lindberg 1991] The rate of
heterogeneous N2O5 hydrolysis resulting in aqueous-phase HNO3 (unlikely to re-enter the
gas phase) is insufficient to explain the observed nighttime NO2 deposition rates The
quadratic flux dependence and similarity to the behavior of HONO observed at other sites
suggests that heterogeneous NO2 hydrolysis may also play a significant role in NO2
deposition [Harrison and Kitto 1994 Harrison et al 1996 Barney and Finlayson-Pitts
2000] Half of any NO2 flux due to heterogeneous NO2 hydrolysis would likely escape
from the surfaces as gas-phase HONO potentially impacting the daytime HOx and NOx
budgets when photolyzed at sunrise
During the day we observed coupled fluxes of NO2 (upward) and NO
(downward) due to photochemical cycling driven by canopy-induced light and eddy
diffusivity gradients The imbalance in the observed fluxes corresponded to the
difference in height of the sampling levels relative to the canopy The exchange
velocities of the two species in their respective directions increased with higher above-
canopy light levels as measured by photosynthetic photon flux density (PPFD) due to the
97
stronger light gradient through the canopy under brighter conditions Upward NO2
velocity was smaller in early spring and late fall when there were no leaves on the trees
corresponding to a weaker light gradient condition (NO fluxes were only measured
during full-canopy conditions) and possibly to the absence of stomata-dependent
emission of NO2 We believe that these coupled fluxes are the first to be reported from a
mature tall-canopy site using reliable eddy-covariance appropriate sampling techniques
All of the NO and NO2 flux data day and night were well explained by a simple
parameterization consisting of two equations FNO2 = V0 middot [NO2] + amiddot[NO2]2 +
(b+f)middotPPFDmiddot[NO2] + ΓmiddotVd(O3) and FNO = V0_NO middot [NO] + bprime middot PPFD middot [NO] The net flux
of NOx is approximately equal to the flux of NO2 omitting the PPFD-dependent term
FNOxasympV0 middot [NO2] + amiddot[NO2]2 + ΓmiddotVd(O3) V0 and V0_NO are small constant deposition
velocity terms b and bprime are coefficients of light-dependent coupled fluxes for full-canopy
conditions and f adjusts the NO2 light-dependent term for no-leaves conditions The
deposition velocity of O3 was used as a proxy for stomatal exchange the coefficient Γ
was consistently positive Stomatal conductance correlates with a number of different
variables (light temperature humidity) complicating the interpretation of the final term
It may indicate a stomatal emission of NO2 under low-NOx conditions typical at Harvard
Forest but could also correspond to a chemical or other process which slows NO2
deposition during the day The quadratic term amiddot[NO2]2 was particularly significant at
night during a few high-[NO2] events Multi-factor regressions fitting the hourly data
with these equations yield R2 of 061 for FNO2 and 092 for FNO the coefficients
summarized in Table 36 agree with analyses of segregated daytime and nighttime data
We note that the coefficients are relevant to the specific measurement heights of NO (29
98
m) and NO2 (22 m) at Harvard Forest relative to the forest canopy height (20 m)
However the mechanism should be adaptable for more general application
During the measurement period net NO2 deposition velocity (omitting the PPFD-
dependent term associated with photochemical cycling of NOx) -(V0 + amiddot[NO2] +
ΓmiddotVd(O3)[NO2]) was between 015 and 03 cm s-1 The mean 02 cm s-1 varied by less
than 002 cm s-1 between day and night and between full-canopy and leafless conditions
NO2 deposition velocity measurements to deciduous forest canopies are scarce this result
falls just outside of the range of reported values for coniferous forests 01 to 15 cm s-1
[Hanson and Lindberg 1991 Rondoacuten et al 1993 Joss and Graber 1996] and short
crops such as alfalfa soy and oats 007 to 125 cm s-1 [Hanson and Lindberg 1991]
The only estimates of NO deposition velocity are over grass ~01 to 02 cm s-1 [Hanson
and Lindberg 1991] other observations indicate NO emission from various species
though soil emissions could confound these results [Wildt et al 1997] This is quite
close to the ~025 cm s-1 NO deposition velocity at Harvard Forest (-V0_NO) but we
cannot resolve the debate as to whether NO deposits at all [Wesely and Hicks 2000]
Concentration and flux measurements of HONO N2O5 and NO3 (along with NO
and NO2) are required to better understand the nighttime chemistry and deposition of
NOx Recently-developed continuous analyzers for HONO [Harrison et al 1996] and N-
2O5 and NO3 [Brown et al 2001] may make these measurements possible in the coming
years In addition the use of flux chambers with a TDLAS or other instrument (sub-
nmol mol-1 sensitivity and species-specific detection method) on leaf litter and soil
samples in the lab and field may facilitate direct detection of NO2 compensation points
for various species and quantify the importance of different natural surfaces
99
NOx deposition matters to both the ecosystem and the atmosphere the form of
nitrogen entering plants affects nutrient loading acid stress and toxicity and the form of
nitrogen leaving the atmosphere affects O3 production HOx chemistry and long-range
transport of anthropogenic pollutants We are hopeful that future research endeavors will
approach the problem from the perspective of both ecosystem and atmosphere at scales
ranging from the individual leaf to the vegetated landscape using reliable species-
specific and sensitive measurement techniques
References
Andreacutes-Hernaacutendez J Notholt J Hjorth and O Schrems A DOAS study on the origin of initrous acid at urban and non-urban sites Atmos Environ 30 175-180 1996
Aneja V P P A Roelle G C Murray J Southerland J W Erisman D Fowler W A H Asman and N Patni Atmospheric nitrogen compounds II emissions transport transformation deposition and assessment Atmos Environ 35 1903-1911 2001
Barford C E Hammond Pyle L Hutyra S Wofsy Ecological Measurements to compliment eddy-flux measurements at Harvard Forest [Online data archive] httpwww-asharvardedudatanigec-datahtml 2001
Barnet W S and B J Finlayson-Pitts Enhancement of N2O4 on porous glass at room temperature A key intermediate in the heterogeneous hydrolysis of NO2 J Phys Chem A 104 171-175 2000
Barney W S and B J Finlayson-Pitts Enhancement of N2O4 on Porous Glass at Room Temperature A Key Intermediate in the Heterogeneous Hydrolysis of NO2 J Phys Chem A 104 171-175 2000
Bey I D J Jacob R Yantosca J logan B Field A Fiore Q Li H Liu L Mickley M Schultz Global modeling of tropospheric chemistry with assimilated meteorology Model description and evaluation in press J Geophys Res 2001
Brown S H Stark S J Ciciora and A R Ravishankara In-situ measurement of atmospheric NO3 and N2O5 via cavity ring-down spectroscopy Geophys Res Lett 28 3237-3230 2001 (a)
100
Brown S H Stark S J Ciciora and A R Ravishankara In-situ Detection of Atmospheric NO3 and N2O5 via Cavity Ring-Down Spectroscopy EOS Trans AGU 82 Fall Meeting Suppl A41B-0045 2001 (b)
Coe H and M W Gallagher Measurements of dry deposition of NO2 to a Dutch heathland using the eddy-correlation technique Q J R Meteorol Soc118 767-786 1992
Delaney A C D R Fitzjarrald D H Lenschow R Pearson Jr G J Wendel B Woodruff Direct Measurements of Nitrogen Oxides and Ozone Fluxes over Grassland J Atmos Chem 4 429-444 1986
Eugster W and R Hesterberg Transfer resistances of NO2 determined from eddy correlation flux measurements over a litter meadow at a rural site on the Swiss plateau Atmos Environ 30 1247-1254 1996
Fitzjarrald D R and D H Lenschow Mean concentration and flux profiles for chemically reactive species in the atmospheric surface layer Atmos Environ 17 2505-2512 1983
Galmarini S P G Duynkerke J Vila-Guerau De Arellano Evolution of Nitrogen Oxide Chemistry in the Nocturnal Boundary Layer J Appl Meteorology 36 943-957 1997
Gao W M L Wesely P V Doskey Numerical Modeling of the Turbulent Diffusion and Chemistry of NOx O3 Isoprene and Other Reactive Trace Gases in and Above a Forest Canopy J Geophys Res 98 18339-18353 1993
Gao W and M L Wesely Numerical Modeling of the Turbulent Fluxes of Chemically Reactive Trace Gases in the Atmospheric Boundary Layer J Appl Meteorology 33 835-847 1994
Goodman A L G M Underwood and V H Grassian Heterogeneous Reaction of NO2 Characterization of Gas-Phase and Adsorbed Products from the Reaction 2NO2(g) + H2O(a) HONO(g) + HNO3(a) on Hydrated Silica Particles J Phys Chem A 103 7217-7223 1999
Goulden ML JW Munger S-M Fan B C Daube and S C Wofsy Measurements of carbon sequestration by long-term eddy covariance Methods and a critical evaluation of accuracy Global Change Biology 2 169-182 1996
Harrison R M A-M N Kitto Evidence for a surface source of atmospheric nitrous acid Atmos Environ 28 1089-1094 1994
Harrison R M J D Peak G M Collins Tropospheric cycle of nitrous acid J Geophys Res 101 14429-14439 1996
101
Heal M R B B B Booth J N Cape K J Hargreaves The influence of simplified peroxy radical chemistry on the interpretation of NO2-NO-O3 surface exchange Atmos Environ 35 1687-1696 2001
Horii C V M S Zahniser D D Nelson J B McManus S C Wofsy Nitric Acid and Nitrogen Dioxide Flux Measurements a New Application of Tunable Diode Laser Absorption Spectroscopy Proc of SPIE 3758 152-161 1999
Hosker R P Jr and S E Lindberg Review Atmospheric deposition and plant assimilation of gases and particles Atmos Environ 16 889-910 1982
Hanson P and S E Lindberg Dry deposition of reactive nitrogen compounds a review of leaf canopy and non-foliar measurements Atmos Environ 25A 1615-1634 1991
Jacob D J Heterogeneous chemistry and tropospheric ozone Atmos Environ 34 2131-2159 2000
Joss U and W K Graber Profiles and Simulated Exchange of H2O O3 NO2 Between the Atmosphere and the HartX Scots Pine Plantation Theor Appl Climatol 53 157-172 1996
Lefer B L and R W Talbot Nitric acid and ammonia at a rural northeaster US site J Geophys Res 104 1645-1661 1999
Lerdau M T J W Munger D J Jacob The NO2 Flux Conumdrum Science289 2291-2293 2000
Moody J L J W Munger A H Goldstein D J Jacob and S C Wofsy Harvard Forest regional-scale air mass composition by Patterns in Atmospheric Transport History (PATH) J Geophys Res 103 13181-13194 1998
Munger J W S C Wofsy P S Bakwin S-M Fan M L Goulden B C Daube and A H Goldstein Atmospheric deposition of reactive nitrogen oxides and ozone in a temperate deciduous forest and a subarctic woodland 1 Measurements and mechanisms J Geophys Res 101 12639-12657 1996
Munger J W S-M Fan P S Bakwin M L Goulden A H Goldstein A S Colman and S C Wofsy Regional budgets for nitrogen oxides from continental sources Variations of rates for oxidation and deposition with season and distance from source regions J Geophys Res 103 8355-8368 1998
Notholt J J Hjorth and F Raes Formation of HNO2 on aerosol surfaces during foggy periods in the presence of NO and NO2 Atmos Environ 26A 211-217 1992
Padro J Zhang L and W J Massman An analysis of measurements and modlling of air-surface exchange of NO-NO2-O3 over grass Atmos Environ 32 1365-1375 1998
102
103
Rondon A C Johansson L Granat Dry Deposition of Nitrogen Dioxide and Ozone to Coniferous Forests J Geophys Res 98 5159-5172 1993
Rothman LS et al The HITRAN molecular spectroscopic database and HAWKS (HITRAN Atmospheric Workstation) 1996 Edition J Quant Spectrosc Radiat Transfer 60 665-710 1998
Sparks J P R K Monson K L Sparks M Lerdau Leaf uptake of nitrogen dioxide (NO2) in a tropical wet forest implications for tropospheric chemistry Oecologia 127 214-221 2001
Stocker D W D H Stedman K F Zeller W J Massman D G Fox Fluxes of Nitrogen Oxides and Ozone Measured by Eddy Correlation Over a Shortgrass Prairie J Geophys Res 98 12619-12630 1993
Walton S M W Gallagher T W Choularton J Duyzer Ozone and NO2 Exchange to Fruit Orchards Atmos Environ 31 2767-2776 1997
Wesely M L J A Eastman D H Stedman E D Yalvac An eddy-correlation measurement of NO2 flux to vegetation and comparison to O3 flux Atmos Environ 16 815-820 1982
Wesely M L Parameterization of surface resistances to gaseous dry deposition in regional-scale numerical models Atmos Environ 23 1293-1304 1989
Wesley M L and B B Hicks A review of the current status of knowledge on dry deposition Atmos Environ 34 2261-2282 2000
Wildt J D Kley A Rockel P Rockel H J Schneider Emission of NO from several higher plant species J Geophys Res 102 5919-5927 1997
- April ndash November 2000
- G (nmol mol-1)
- 29 August ndash 8 Oct 2000
- References
- Chapter3_NOx_Part2pdf
-
- 34 Discussion
-
- Chapter3_NOx_Part1pdf
-
- 32 Methods
- 33 Results
-

01 05 50 500
020
4060
8010
0
0 1000 2000 30000 1000 2000 3000
020
4060
8010
0
Eddy Diffusivity K (m2 s-1) τ2 (s)
heig
ht (m
)
01 05 50 500
020
4060
8010
0
0 1000 2000 30000 1000 2000 3000
020
4060
8010
0
Eddy Diffusivity K (m2 s-1) τ2 (s)
heig
ht (m
)
Figure 312 Simple NOx photochemical canopy model inputs Eddy diffusivities are
scaled from Gao et al [1993] to the Harvard Forest canopy height of 20 m τ2 the
lifetime of NO2 against photolysis (reaction 2 NO2 + hν NO + O) scales inversely
with UV radiation τ2 was estimated for typical conditions of [O3] [NO][NO2] and
daytime UV profile under full-canopy conditions at the site The simple canopy model
also accepts an estimate of τ1 the lifetime of NO against reaction with O3 (reaction 31)
73
Concentration (nmol mol-1)
heig
ht (m
)
00 02 04 06 08 10
020
4060
8010
0
NO NO2
Normalized NOx = NO+NO2 = 1 nmol mol-1
Flux (nmol mol-1 cm s-1)
-2 -1 0 1 2-2 -1 0 1 2
020
4060
8010
0
NO NO2
Figure 313 Simple NOx photochemical canopy model outputs Left panel
concentrations of NO (dashed) and NO2 (solid) right fluxes of NO (dashed) and NO2
(solid) Symbols indicate measurement heights for NO (29 m) and NO2 (22 m) at
Harvard Forest The model solves the continuity equation for NO concentration at 200
levels ddz(-Kc(dNOdz)) = PNO ndash LNO where PNO = [NO]τ1 LNO = [NO]τ2 and zero
net deposition or emission of NOx is allowed NOx = NO + NO2 is normalized to 1 ppb
τ1 = 70s in this example Due to the measurement height difference observed upward
NO2 flux due to photochemical cycling alone should be substantially larger than observed
downward NO flux attributable to the same process
74
V(O
3) (c
m s
-1)
g c(c
m s
-1)
PPFD (mmol m-2 s-1)
00 05 10 15
-05
00
05
10
15
20
00 05 10 15
-3-2
-10
12
Figure 314 Daytime (including dawn and dusk) canopy surface conductance gc and O3
exchange velocity V(O3) vs above-canopy photosynthetic photon flux density (PPFD)
during the summer of 2000 at Harvard Forest Dots are hourly values Filled squares
represent quantile-binned means (quantiles of PPFD were used to define bins and all gc
or V(O3) for data hours falling within the bins were averaged) Both quantities are
indicators of stomatal conductance and increase in absolute value with PPFD up to a
maximum level
75
exchange velocity are both related to photosynthetic photon flux density (PPFD) The
dependence is nonlinear absolute values of gc and V(O3) increase with PPFD up to
approximately 1 mmol m-2 s-1 and level off at higher PPFD values Note that PPFD is the
only continuously-monitored measure of light intensity at Harvard Forest (as with many
ecological and trace-gas monitoring stations) and is therefore used in the discussion
below as a proxy of photochemically-active UV wavelengths at the site despite the fact
that PPFD measures only the photosynthetically-active wavelength band (400-700 nm)
For the time period when eddy covariance fluxes of both NO and NO2 were
measured (29 August-8 October 2000) Figure 315 shows that the daytime (as defined by
light level PPFD gt 001 mmol m-2 s-1) upward NO2 flux was strongly correlated with the
downward NO flux We can account for more of the variance in daytime FNO2 by using
in addition to a photochemical NOx cycling term βmiddotFNO additional terms representing a
constant deposition velocity V0middot [NO2] and a stomatal flux γmiddotgc (Table 32)
FNO2 = F0 + βmiddotFNO + V0middot [NO2] + γmiddotgc (Eq 35)
The relationship between FNO2 and FNO is significant in all of the fits as shown by the
low p-values and consistent values of β Note that an upward NO2 flux contribution
could be included as either a constant (zero order) flux term F0 or as a function of
stomatal conductance γ when F0 is constrained to zero For the F0=0 cases R2 has been
calculated as follows in order to omit the origin
)var()var(1
2
2
FNOresidualR minus= (Eq 36)
The constant deposition velocity term V0 is significant when the stomatal term is also
included in the fit A flux term dependent on the square of the NO2 concentration
a[NO2]2 (not shown in Table 32) is only marginally significant regardless of which other
terms are included in the regression
76
NO
2Fl
ux (micro
mol
m-2
hr-1
)
- NO Flux (micromol m-2 hr-1)
0 2 4 6 8 10 12
-10
010
2030
40
Figure 315 Relationship between daytime hourly FNO2 and ndashFNO 29 August to 8
October 2000 FNO2 = (05plusmn01) - (35plusmn01)middotFNO R2 = 079
77
Table 32 Regressions of daytime FNO2 (as defined by light level see above covered
hours 500 to 2000 EST) in terms of linear combinations of βmiddotFNO V0middot[NO2] and γmiddotgc
F0 is the intercept for each fit representing flux at [NO2] = FNO = gc = 0 Flux units of
(nmol mol-1 cm s-1) are used Note that FNO is largely negative (downward) so that a
negative value of β represents a positive flux term
F0 plusmn std error
(nmol mol-1 cm s-1) β plusmn std error
(dimensionless) V0 plusmn std error
(cm s-1) γ plusmn std error (nmol mol-1) R2
05plusmn01 (p-valuelt1E-4)
-35plusmn01 (p-valuelt1E-4) NA NA 079
constrained to 0 -37plusmn01 (p-valuelt1E-4) NA NA 079
07plusmn02 (p-valuelt1E-4)
-38plusmn02 (p-valuelt1E-4)
-016plusmn008 (p-value=004) NA 084
constrained to 0 -37plusmn02 (p-valuelt1E-4)
003plusmn007 (p-value=07) NA 083
01plusmn03 (p-value=06 )
-35plusmn01 (p-valuelt1E-4) NA 10plusmn04
(p-value=002) 083
constrained to 0 -35plusmn01 (p-valuelt1E-4) NA 12plusmn02
(p-valuelt1E-4) 083
04plusmn03 (p-value=02)
-38plusmn02 (p-valuelt1E-4)
-018plusmn009 (p-value=005)
09plusmn05 (p-value=008) 087
constrained to 0 -38plusmn02 (p-valuelt1E-4)
-012plusmn008 (p-value=01)
13plusmn03 (p-valuelt1E-4) 087
78
The stable statistically significant relationship between the daytime fluxes of NO
and NO2 appears to indicate that although the species were measured on nearby towers at
different heights their photochemical cycling is coherent on an hourly basis This
process clearly dominates the behavior of NOx fluxes near the forest canopy but
represents neither net deposition nor net emission The next largest term appears to be a
constant deposition velocity downward flux of NO2 Finally there is a small positive
NO2 flux component which is equally well-fit as a constant flux or a stomatal
conductance-dependent term We performed additional regressions (not shown) using a
stomatal term of the form γprimemiddotgcmiddot([NO2]-[NO2]c) where [NO2]c is the compensation point
concentration below which vegetation emits NO2 While marginally significant values of
γprime could be obtained for [NO2]c values fixed between 1 and 10 nmol mol-1 the data did
not contain enough information to determine the compensation point independently In
2000 median summerfall daytime [NO2] was 11 nmol mol-1 (75th percentile=23 nmol
mol-1) Thus the vegetation at Harvard Forest usually experiences NO2 concentrations at
or below the 05 to 15 nmol mol-1 range of previously observed compensation points for
coniferous and tropical trees in chamber studies [eg Sparks et al 2001 Rondoacuten et al
1993] It is not possible to definitively attribute the small positive flux (γmiddotgc) to a
stomatal process the term could also indicate a chemical or other process which reduces
the deposition velocity under daytime conditions
To investigate the behavior of the NO2 flux beyond the limited period of NO flux
measurements we use above-canopy PPFD as a proxy for photochemical activity for our
data when NO fluxes were not measured Figure 316 shows daytime exchange
velocities of NO and NO2 plotted against PPFD For clarity hourly points are omitted
79
00 05 10 15
-10
12
34
NO2 (h=22m) leaves onNO2 (h=22m) leaves offNO (h=29m) leaves on
Exch
ange
Vel
ocity
(cm
s-1
)
PPFD (mmol m-2 s-1)
Figure 316 Daytime emission velocities of NO2 (leaves on solid triangles
leaves off open triangles) and NO (leaves on solid circles no data for leaves off
periods) plotted against photosynthetic photon flux density (PPFD) Symbols are
medians binned by percentiles of above-canopy PPFD For clarity hourly points are not
shown V(NO2) data span spring through fall 2000 while V(NO) data were collected late
August to early October 2000 only Linear fits to binned median points (exchange
velocities in units of cm s-1 PPFD in units of mmol m-2 s-1) reported in Table 33
80
and only the PPFD quantile-binned medians are plotted For each species we determine
quantiles of PPFD for daytime hours with data These quantiles define for each trace gas
species the measurement hours whose median values are shown The coupling of the bi-
directional NOx fluxes becomes more intense as the difference in light intensity from
above- to below-canopy increases during periods of high above-canopy illumination
cycling ceases as light intensity and therefore light gradient declines NO2 flux data are
segregated into full-canopy (leaves on) conditions from early June to mid-October and
leafless periods in April-May and October-November Linear regressions to the
percentile-binned medians of PPFD (V = VPPFD=0 + bmiddotPPFD) yield the following
relationships for the daytime data shown in Table 33
Before leaf-out and after leaf-fall the coefficient of PPFD in the NO2 regression
is smaller than for full-canopy conditions This expected since the leaf area index at
Harvard Forest at mid-summer is approximately 34 [Munger et al 1996] whereas the
area index for bare stems and twigs is only 09 [Barford et al 2001] The light gradient
for leaves-off conditions is smaller resulting in smaller concentration gradients and
reduced coupled NOx fluxes It is also likely that NO2 emission by the leaves contributes
to the increased slope of VNO2 vs PPFD when the canopy is developed
NO is not expected to deposit to surfaces in large amounts though there is very
little experimental evidence [Hanson et al 1991 Wesely and Hicks 2000] Soil NO
emission at Harvard Forest is small less than 09 micromol m-2 hr-1 [Munger et al 1996]
making NO unlikely to escape from the canopy before conversion to NO2 Thus the NO
flux at Harvard Forest is dominated by photochemical cycling and can be parameterized
as a function of PPFD and [NO] Coefficients for least squares fits to hourly daytime
FNO data (measurement height = 29m 29 Aug-8 Oct 2000) are shown in Table 34
81
Table 33 Linear regression of daytime percentile-binned median VNO2 and VNO
against of PPFD
VPPFD=0 plusmn std error
cm s-1 b plusmn std error
cm s-1 (mmol m-2 s-1)-1 R2
VNO2 leaves on -04 plusmn 01 (p-value=002)
27 plusmn 02 (p-valuelt1E-4) 097
VNO2 leaves off -01 plusmn 01 (p-value=03)
15 plusmn 02 (p-valuelt1E-4) 090
VNO leaves on -042 plusmn 007 (p-value=4E-4)
-05plusmn01 (p-value=7E-4) 078
82
Table 34 Regressions results for daytime FNO = F0_NO + V0_NO [NO] + bprime PPFD [NO]
F0_NO plusmn std error
(nmol mol-1 cm s-1)
bprime plusmn std error cm s-1 (mmol m-2 s-1)-1
V0_NO plusmn std error (cm s-1) R2
-008plusmn001 (p-valuelt1E-4)
-110plusmn002 (p-valuelt1E-4) NA 091
Constrained to 0
-114plusmn002 (p-valuelt1E-4)
NA 091
-006plusmn001
(p-valuelt1E-4)
-092plusmn004
(p-valuelt1E-4)
-018plusmn004
(p-valuelt1E-4) 091
Constrained to 0
-087plusmn004 (p-valuelt1E-4)
-025plusmn003
(p-valuelt1E-4) 091
83
To treat the larger daytime NO2 flux dataset we combine a terms representing the
light dependence shown in Figure 316 constant deposition velocity and stomatal
conductance Because gc was calculated assuming the presence of leaves we use the
measured deposition velocity of O3 Vd(O3) = -V(O3) as a proxy for the stomatal opening
from early spring through late fall Table 35 shows the results for the regressions using
these terms
A quadratic term amiddot[NO2]2 is not statistically significant when included because
we have few measurements with sufficiently high NO2 concentrations We interpret the
term (b+f)middotPPFDmiddot[NO2] as approximately accounting for the NO2 flux that arises from
photochemical cycling with NO (b+f) agrees well with the coefficients found in Table
33 As in the limited dataset regressions using FNO instead of PPFD (Table 32) V0
indicates an exchange velocity for NO2 on the order of -03 cm s-1 (downward) Given
the robust appearance of this term with different fit parameters for both limited and full
datasets we find it likely that V0 represents a roughly constant deposition velocity
process independent of NOx photochemical cycling during the day Though statistical
significance is low an upward flux term associated with stomatal conductance or related
variables also appears in Table 35
343 Parameterization of NOx Fluxes
Both nighttime and daytime NOx fluxes can be combined into a single
parameterization based on the above discussion This framework adopts the hypothesis
that photochemical NO-NO2 cycling can be largely accounted for by a simple light-
dependent term and that net deposition may then be estimated from additional terms
representing constant exchange velocity concentration-dependent exchange velocity and
84
Table 35 Multi-factor regression using all hourly daytime FNO2 data following the
functional form FNO2 = (b+f)middotPPFDmiddot[NO2] + V0 [NO2] + ΓmiddotVd(O3) The intercepts for all
fits have been constrained to zero The parameter f is a canopy flag set to zero for full-
canopy conditions so may be considered a correction to the PPFD term for leaves-off
periods in early spring and late fall
b plusmn std error cm s-1 (mmol m-2 s-1)-1
f plusmn std error cm s-1 (mmol m-2 s-1)-1
= 0 for leaves on V0 plusmn std error
(cm s-1) Γ plusmn std error (nmol mol-1) R2
196plusmn007 (p-valuelt1E-4)
-13plusmn01 (p-valuelt1E-4) NA NA 055
240plusmn009
(p-valueltlt1E-4)
-132plusmn009 (p-valuelt1E-4)
-035plusmn005 (p-valuelt1E-4) NA 060
196plusmn008 (p-valuelt1E-4)
-11plusmn01 (p-valuelt1E-4) NA 01plusmn01
(p-value=04) 062
229plusmn009 (p-valuelt1E-4)
-11plusmn01 (p-valuelt1E-4)
-030plusmn005 (p-valuelt1E-4)
03plusmn01 (p-value=003) 065
85
stomatal conductance-related exchange processes Thus for the height of 22 m relative to
the 20 m canopy the flux of NO2 day and night is given by the simple function of NO2
concentration PPFD and O3 deposition velocity
FNO2 = V0 middot [NO2] + amiddot[NO2]2 + (b+f)middotPPFDmiddot[NO2] + ΓmiddotVd(O3) (Eq 37)
where f is added to the coefficient of PPFD to account for the observed difference
between full-canopy and leaves-off conditions
NO is not present in significant quantities at night and FNO appears to be driven
by a simple dependence on PPFD during the day We include a constant deposition
velocity term as well since evidence of NO deposition to surfaces is weak and
inconclusive At a measurement height of 29 m the flux of NO is given by
FNO = V0_NO middot [NO] + bprime middot PPFD middot [NO] (Eq 38)
The net fluxes of NO and NO2 may be determined by omitting the photochemical terms
from Eq 37 and 38 Since we expect the deposition velocity of NO to be small
FNOx(net)asympFNO2(net)
FNOx(net) asymp V0 middot [NO2] + amiddot[NO2]2 + ΓmiddotVd(O3) (Eq 39)
Multi-factor regressions for Eq 37 and Eq 38 were performed to determine the
coefficients V0 a b f V0_NO and brsquo using all available hourly observations of [NO2]
[NO] PPFD Vd(O3) FNO2 and FNO at Harvard Forest April-November 2000 The
results are presented in Table 36 along with the range of results from the separate
daytime and nighttime analyses discussed earlier
86
Table 36 Multi-factor regressions using all available hourly observations of [NO2]
[NO] PPFD Vd(O3) FNO2 and FNO at Harvard Forest April-November 2000 Note
that Vd(O3)=deposition velocity positive values indicate downward O3 exchange
velocity
z = 22m FNO2 = V0 middot [NO2] + a middot [NO2]2 + (b+f)middotPPFDmiddot[NO2] + Γ middot Vd(O3)
coeff plusmn std err p-value
April ndash November 2000 (R2 = 060)
Range of results from separate day and night analyses
V0 (cm s-1) -021plusmn004 lt1E-4 -03 to -001
a (nmol-1 mol cm s-1) -0002plusmn0004dagger 06 -0013 to ndash0002
b (cm s-1 (mmol m-2 s-1)-1) 221plusmn007 lt1E-4 19 to 24
f (cm s-1 (mmol m-2 s-1)-1) =0 for leaves-on -110plusmn009 lt1E-4 -13 to -10
Γ (nmol mol-1) 021plusmn009 002 01 to 03
z = 29m FNO = V0_NO middot [NO] + bprime middot PPFD middot [NO]
29 August ndash 8 Oct 2000 (R2 = 092)
V0_NO (cm s-1) -025plusmn002 lt1E-4 -087 to -042
bprime (cm s-1 (mmol m-2 s-1)-1) -087plusmn003 lt1E-4 -114 to -05
daggerThe more statistically robust nighttime a =-0013 plusmn 0001 (Table 31) is recommended
87
Nearly all of the coefficients fall within the ranges determined previously except
V0 and V0_NO which differ only slightly from the earlier values As illustrated in Figures
317 and 318 Eq 37 and Eq 38 with the multi-factor regression coefficients in Table
36 are good predictors of the measured fluxes over their entire dynamic ranges and for
all sampled conditions
The diel variations of fluxes and residuals from this parameterization (Figure
319) reveal several interesting features The parameterization captures the overall diel
behavior of both NO and NO2 fluxes It also tends to underestimate the upward flux of
[NO2] during the day for northwesterly flow conditions and to slightly overestimate
during daytime southwesterly flows The disagreement rarely exceeds the 25th and 75th
quantiles of the measured fluxes The dominant flow regimes at Harvard Forest differ in
a number of key respects that may affect this result Northwesterly conditions tend to
bring lower concentrations of reactive nitrogen species cooler temperatures drier
weather and clearer skies than southwest winds [Moody et al 1998] It is possible that
one or more of these factors is contributing to the wind-sector difference in the residuals
One might expect that the residuals would depend on additional factors not taken
into consideration For example mixing and therefore deposition depends on the friction
velocity u (m s-1) As shown in figure 320 the residual NO2 flux tends upward only at
the highest u quantiles during the day and has no significant trend at night Similarly
the temperature-dependent rate for (R31) k1(T)[O3] has not been included yet we find
that the NO2 flux residuals exhibit no statistically significant trend with k1(T)[O3] (Figure
321) Although included as terms in the paratmeterization similar residual analyses are
shown for V(O3) during the day (Figure 321) and for [NO2] during the day and night
(Figure 322) The distinctly different daytime and nighttime behavior of the total NO2
flux is apparent again in Figure 322 as are the small residuals overall
88
Res
idua
l (M
es ndash
Para
m)
FN
O2
(nm
ol m
ol-1
cm s
-1)
Parameterized FNO2 (nmol mol-1 cm s-1)
Mea
sure
d FN
O2
(nm
ol m
ol-1
cm s
-1)
FNO2 = V0middot[NO2] + amiddot[NO2]2 + (b+f)middotPPFDmiddot[NO2] + ΓmiddotVd(O3)
Daytime +Nighttime
11
-20 -10 0 10 20 30
-20
-10
010
2030
Quantiles of Standard Normal
-2 0 2
-10
-50
510
Figure 317 Upper Measured vs parameterized NO2 flux shown with 11 line daytime
(+) and nighttime () The functional form the parameterization is shown at the top
Lower Residuals of FNO2 vs quantiles of the standard normal The residuals are
normally-distributed with extended upper and lower wings
89
-10 -8 -6 -4 -2 0 2
-10
-8-6
-4-2
02
Quantiles of Standard Normal
-2 0 2
-10
-05
00
05
10
15
Mea
sure
d FN
O (n
mol
mol
-1cm
s-1
)
Res
idua
l (M
es ndash
Para
m)
FN
O (n
mol
mol
-1cm
s-1)
Parameterized FNO (nmol mol-1 cm s-1)
FNO = V0_NOmiddot[NO] + b middotPPFDmiddot[NO]
11
Figure 318 Same as Figure 317 for FNO
90
Fl
ux (n
mol
mol
-1cm
s-1
)R
esid
ual (
nmol
mol
-1cm
s-1
)Measured FNO (h=22m)Measured FNO2 (h=22m)Parameterized FNOParameterized FNO2
Meas-Param FNOMeas-Param FNO2
-20
24
-20
24
NW
0 5 10 15 20
-2-1
01
2-2
-10
12
-20
24
-20
24
SW
0 5 10 15 20
-2-1
01
2-2
-10
12
Hour
Figure 319 Top panels Median diel measured (closed symbols solid lines) and
parameterized (open symbols dashed lines) fluxes of NO2 and NO Vertical bars show
the 25th and 75th quantiles for the measurements Lower panels Median diel residual
(measured-parameterized) FNO2 and FNO Northwest wind conditions are shown on the
left southwest on the right The parameterizations capture the daytime behavior of NO
flux due to the photochemical gradient and eddy diffusivity effects For NO2 under
northwesterly conditions the daytime residual is positive indicating that the
parameterization underestimates upward flux of NO2 For southwesterly conditions
daytime NO2 flux residuals are more variable and tend in the opposite direction
91
DAY NIGHT
FNO
2(n
mol
mol
-1cm
s-1
)R
esid
ual F
NO
2(n
mol
mol
-1cm
s-1
)
FNO
2(n
mol
mol
-1cm
s-1
)R
esid
ual F
NO
2(n
mol
mol
-1cm
s-1
)
Res
idua
l FN
O2
(nm
ol m
ol-1
cm s
-1)
Measured FNO2
Parameterized FNO2
Res
idua
l FN
O2
(nm
ol m
ol-1
cm s
-1)
u (m s-1) u (m s-1)
u (m s-1) u (m s-1)
-10
-50
510
00 05 10 15
-10
-50
510
-10
-50
510
00 05 10 15
-10
-50
510
00 02 04 06 08 10 12 14
-20
2
00 02 04 06 08 10 12 14
-20
2
Figure 320 From top to bottom measured and parameterized NO2 fluxes residuals
(measured-parameterized) and expanded-axes quantile-binned mean residuals (plusmn
standard deviation) vs u shown for daytime on the left and nighttime on the right
92
DAY k1(T)[O3] Day V(O3)
FNO
2(n
mol
mol
-1cm
s-1
)R
esid
ual F
NO
2(n
mol
mol
-1cm
s-1
)
FNO
2(n
mol
mol
-1cm
s-1
)R
esid
ual F
NO
2(n
mol
mol
-1cm
s-1
)
Res
idua
l FN
O2
(nm
ol m
ol-1
cm s
-1)
Measured FNO2
Parameterized FNO2
Res
idua
l FN
O2
(nm
ol m
ol-1
cm s
-1)
k1(T)[O3] (s-1) V(O3) (cm s-1)
k1(T)[O3] (s-1) V(O3) (cm s-1)
-10
010
2030
001 002 003 004
-10
-50
510
-10
010
2030
-003 -002 -001 00 001
-10
-50
510
0005 0010 0015 0020 0025 0030
-3-2
-10
12
-0015 -0010 -0005 00
-3-2
-10
12
Figure 321 Same as Figure 321 for daytime k1(T)[O3] (left) and daytime V(O3) (right)
93
DAY NIGHT
FNO
2(n
mol
mol
-1cm
s-1
)R
esid
ual F
NO
2(n
mol
mol
-1cm
s-1
)
FNO
2(n
mol
mol
-1cm
s-1
)R
esid
ual F
NO
2(n
mol
mol
-1cm
s-1
)
Res
idua
l FN
O2
(nm
ol m
ol-1
cm s
-1)
Measured FNO2
Parameterized FNO2
Res
idua
l FN
O2
(nm
ol m
ol-1
cm s
-1)
[NO2] (nmol mol-1) [NO2] (nmol mol-1)
[NO2] (nmol mol-1) [NO2] (nmol mol-1)
-10
010
2030
0 5 10 15 20
-10
-50
510
-20
-15
-10
-50
510
0 5 10 15 20
-10
-50
510
0 2 4 6 8
-3-2
-10
12
0 2 4 6 8 10 12
-20
24
Figure 322 Same as Figure 321 for [NO2] during the daytime (left) and nighttime
(right)
94
The lack of robust trends in the NO2 flux residuals indicates that within the
limitations of the dataset Eq 37 captures the crucial aspects of observed NO2 flux
behavior within and above the tall forest canopy under a wide range of conditions
Similarly Eq 38 accounts for 92 of the observed variance in the measured NO fluxes
under a somewhat narrower set of conditions (the sampling period for NO eddy
covariance flux measurements was relatively short) Figure 323 shows the resulting net
NOx flux (Eq 39 Table 36) and exchange velocity VNOx(net)=FNOx(net)[NO2] on a
diel basis for the sampling period April-November 2000 For the rural low-NOx
conditions at Harvard Forest we find that the flux of NOx is downward at all hours with
a deposition velocity of approximately 02 cm s-1
35 Conclusions
We installed a Tunable Diode Laser Absorption Spectrometer (TDLAS) to
measure continuous NO2 concentrations and eddy covariance fluxes above the canopy at
Harvard Forest during the spring summer and fall of 2000 An existing
chemiluminescence NO detector was configured to measure above-canopy eddy
covariance fluxes for a shorter period in the late summer and early fall A photolysis-
chemiluminescence (P-C) NO2 instrument also measured concentrations for a portion of
the sampling period Hourly average TDLAS and P-C NO2 concentrations agreed very
well under all conditions The agreement between the two instruments in the field and
the independent spectroscopic calibration of the TDLAS validated the long-term
measurements of the tank-calibrated P-C system
95
0 6 12 18
-10
-08
-06
-04
-02
00
-14
-12
-10
-08
-06
-04
-02
00
Net
FN
Ox
(nm
ol m
ol-1
cm s
-1)
(microm
ol m
-2hr
-1)
Net
VN
Ox
(cm
s-1
)
Hour
median| 25th amp 75th percentiles
0 6 12 18
-024
-022
-020
-018
Figure 323 Diel cycle of parameterized net NOx exchange velocity (upper panel) and
flux (lower panel) April-November 2000 FNOx(net) asymp FNO2(net) = V0middot[NO2] +
amiddot[NO2]2 + ΓmiddotVd(O3) VNOx(net) = FNO2(net)[NO2]
96
At night in the absence of significant quantities of NO we observed a consistent
downward flux of NO2 which depended quadratically on the concentration of NO2
although the dependence was apparent mainly on two nights when [NO2] was above 10
nmol mol-1 The nighttime NO2 deposition velocity varied between 02 cm s-1 at [NO2]=1
nmol mol-1 and 05 cm s-1 at [NO2]=30 nmol mol-1 These fluxes could come from direct
NO2 deposition to non-stomatal surfaces in the forest such as soil litter bark and the
outer surfaces of leaves area-normalized deposition velocities to such surfaces in
chamber measurements have varied from less than 01 to 05 cm s-1 for NO2
concentrations between 40 and 80 nmol mol-1 [Hanson and Lindberg 1991] The rate of
heterogeneous N2O5 hydrolysis resulting in aqueous-phase HNO3 (unlikely to re-enter the
gas phase) is insufficient to explain the observed nighttime NO2 deposition rates The
quadratic flux dependence and similarity to the behavior of HONO observed at other sites
suggests that heterogeneous NO2 hydrolysis may also play a significant role in NO2
deposition [Harrison and Kitto 1994 Harrison et al 1996 Barney and Finlayson-Pitts
2000] Half of any NO2 flux due to heterogeneous NO2 hydrolysis would likely escape
from the surfaces as gas-phase HONO potentially impacting the daytime HOx and NOx
budgets when photolyzed at sunrise
During the day we observed coupled fluxes of NO2 (upward) and NO
(downward) due to photochemical cycling driven by canopy-induced light and eddy
diffusivity gradients The imbalance in the observed fluxes corresponded to the
difference in height of the sampling levels relative to the canopy The exchange
velocities of the two species in their respective directions increased with higher above-
canopy light levels as measured by photosynthetic photon flux density (PPFD) due to the
97
stronger light gradient through the canopy under brighter conditions Upward NO2
velocity was smaller in early spring and late fall when there were no leaves on the trees
corresponding to a weaker light gradient condition (NO fluxes were only measured
during full-canopy conditions) and possibly to the absence of stomata-dependent
emission of NO2 We believe that these coupled fluxes are the first to be reported from a
mature tall-canopy site using reliable eddy-covariance appropriate sampling techniques
All of the NO and NO2 flux data day and night were well explained by a simple
parameterization consisting of two equations FNO2 = V0 middot [NO2] + amiddot[NO2]2 +
(b+f)middotPPFDmiddot[NO2] + ΓmiddotVd(O3) and FNO = V0_NO middot [NO] + bprime middot PPFD middot [NO] The net flux
of NOx is approximately equal to the flux of NO2 omitting the PPFD-dependent term
FNOxasympV0 middot [NO2] + amiddot[NO2]2 + ΓmiddotVd(O3) V0 and V0_NO are small constant deposition
velocity terms b and bprime are coefficients of light-dependent coupled fluxes for full-canopy
conditions and f adjusts the NO2 light-dependent term for no-leaves conditions The
deposition velocity of O3 was used as a proxy for stomatal exchange the coefficient Γ
was consistently positive Stomatal conductance correlates with a number of different
variables (light temperature humidity) complicating the interpretation of the final term
It may indicate a stomatal emission of NO2 under low-NOx conditions typical at Harvard
Forest but could also correspond to a chemical or other process which slows NO2
deposition during the day The quadratic term amiddot[NO2]2 was particularly significant at
night during a few high-[NO2] events Multi-factor regressions fitting the hourly data
with these equations yield R2 of 061 for FNO2 and 092 for FNO the coefficients
summarized in Table 36 agree with analyses of segregated daytime and nighttime data
We note that the coefficients are relevant to the specific measurement heights of NO (29
98
m) and NO2 (22 m) at Harvard Forest relative to the forest canopy height (20 m)
However the mechanism should be adaptable for more general application
During the measurement period net NO2 deposition velocity (omitting the PPFD-
dependent term associated with photochemical cycling of NOx) -(V0 + amiddot[NO2] +
ΓmiddotVd(O3)[NO2]) was between 015 and 03 cm s-1 The mean 02 cm s-1 varied by less
than 002 cm s-1 between day and night and between full-canopy and leafless conditions
NO2 deposition velocity measurements to deciduous forest canopies are scarce this result
falls just outside of the range of reported values for coniferous forests 01 to 15 cm s-1
[Hanson and Lindberg 1991 Rondoacuten et al 1993 Joss and Graber 1996] and short
crops such as alfalfa soy and oats 007 to 125 cm s-1 [Hanson and Lindberg 1991]
The only estimates of NO deposition velocity are over grass ~01 to 02 cm s-1 [Hanson
and Lindberg 1991] other observations indicate NO emission from various species
though soil emissions could confound these results [Wildt et al 1997] This is quite
close to the ~025 cm s-1 NO deposition velocity at Harvard Forest (-V0_NO) but we
cannot resolve the debate as to whether NO deposits at all [Wesely and Hicks 2000]
Concentration and flux measurements of HONO N2O5 and NO3 (along with NO
and NO2) are required to better understand the nighttime chemistry and deposition of
NOx Recently-developed continuous analyzers for HONO [Harrison et al 1996] and N-
2O5 and NO3 [Brown et al 2001] may make these measurements possible in the coming
years In addition the use of flux chambers with a TDLAS or other instrument (sub-
nmol mol-1 sensitivity and species-specific detection method) on leaf litter and soil
samples in the lab and field may facilitate direct detection of NO2 compensation points
for various species and quantify the importance of different natural surfaces
99
NOx deposition matters to both the ecosystem and the atmosphere the form of
nitrogen entering plants affects nutrient loading acid stress and toxicity and the form of
nitrogen leaving the atmosphere affects O3 production HOx chemistry and long-range
transport of anthropogenic pollutants We are hopeful that future research endeavors will
approach the problem from the perspective of both ecosystem and atmosphere at scales
ranging from the individual leaf to the vegetated landscape using reliable species-
specific and sensitive measurement techniques
References
Andreacutes-Hernaacutendez J Notholt J Hjorth and O Schrems A DOAS study on the origin of initrous acid at urban and non-urban sites Atmos Environ 30 175-180 1996
Aneja V P P A Roelle G C Murray J Southerland J W Erisman D Fowler W A H Asman and N Patni Atmospheric nitrogen compounds II emissions transport transformation deposition and assessment Atmos Environ 35 1903-1911 2001
Barford C E Hammond Pyle L Hutyra S Wofsy Ecological Measurements to compliment eddy-flux measurements at Harvard Forest [Online data archive] httpwww-asharvardedudatanigec-datahtml 2001
Barnet W S and B J Finlayson-Pitts Enhancement of N2O4 on porous glass at room temperature A key intermediate in the heterogeneous hydrolysis of NO2 J Phys Chem A 104 171-175 2000
Barney W S and B J Finlayson-Pitts Enhancement of N2O4 on Porous Glass at Room Temperature A Key Intermediate in the Heterogeneous Hydrolysis of NO2 J Phys Chem A 104 171-175 2000
Bey I D J Jacob R Yantosca J logan B Field A Fiore Q Li H Liu L Mickley M Schultz Global modeling of tropospheric chemistry with assimilated meteorology Model description and evaluation in press J Geophys Res 2001
Brown S H Stark S J Ciciora and A R Ravishankara In-situ measurement of atmospheric NO3 and N2O5 via cavity ring-down spectroscopy Geophys Res Lett 28 3237-3230 2001 (a)
100
Brown S H Stark S J Ciciora and A R Ravishankara In-situ Detection of Atmospheric NO3 and N2O5 via Cavity Ring-Down Spectroscopy EOS Trans AGU 82 Fall Meeting Suppl A41B-0045 2001 (b)
Coe H and M W Gallagher Measurements of dry deposition of NO2 to a Dutch heathland using the eddy-correlation technique Q J R Meteorol Soc118 767-786 1992
Delaney A C D R Fitzjarrald D H Lenschow R Pearson Jr G J Wendel B Woodruff Direct Measurements of Nitrogen Oxides and Ozone Fluxes over Grassland J Atmos Chem 4 429-444 1986
Eugster W and R Hesterberg Transfer resistances of NO2 determined from eddy correlation flux measurements over a litter meadow at a rural site on the Swiss plateau Atmos Environ 30 1247-1254 1996
Fitzjarrald D R and D H Lenschow Mean concentration and flux profiles for chemically reactive species in the atmospheric surface layer Atmos Environ 17 2505-2512 1983
Galmarini S P G Duynkerke J Vila-Guerau De Arellano Evolution of Nitrogen Oxide Chemistry in the Nocturnal Boundary Layer J Appl Meteorology 36 943-957 1997
Gao W M L Wesely P V Doskey Numerical Modeling of the Turbulent Diffusion and Chemistry of NOx O3 Isoprene and Other Reactive Trace Gases in and Above a Forest Canopy J Geophys Res 98 18339-18353 1993
Gao W and M L Wesely Numerical Modeling of the Turbulent Fluxes of Chemically Reactive Trace Gases in the Atmospheric Boundary Layer J Appl Meteorology 33 835-847 1994
Goodman A L G M Underwood and V H Grassian Heterogeneous Reaction of NO2 Characterization of Gas-Phase and Adsorbed Products from the Reaction 2NO2(g) + H2O(a) HONO(g) + HNO3(a) on Hydrated Silica Particles J Phys Chem A 103 7217-7223 1999
Goulden ML JW Munger S-M Fan B C Daube and S C Wofsy Measurements of carbon sequestration by long-term eddy covariance Methods and a critical evaluation of accuracy Global Change Biology 2 169-182 1996
Harrison R M A-M N Kitto Evidence for a surface source of atmospheric nitrous acid Atmos Environ 28 1089-1094 1994
Harrison R M J D Peak G M Collins Tropospheric cycle of nitrous acid J Geophys Res 101 14429-14439 1996
101
Heal M R B B B Booth J N Cape K J Hargreaves The influence of simplified peroxy radical chemistry on the interpretation of NO2-NO-O3 surface exchange Atmos Environ 35 1687-1696 2001
Horii C V M S Zahniser D D Nelson J B McManus S C Wofsy Nitric Acid and Nitrogen Dioxide Flux Measurements a New Application of Tunable Diode Laser Absorption Spectroscopy Proc of SPIE 3758 152-161 1999
Hosker R P Jr and S E Lindberg Review Atmospheric deposition and plant assimilation of gases and particles Atmos Environ 16 889-910 1982
Hanson P and S E Lindberg Dry deposition of reactive nitrogen compounds a review of leaf canopy and non-foliar measurements Atmos Environ 25A 1615-1634 1991
Jacob D J Heterogeneous chemistry and tropospheric ozone Atmos Environ 34 2131-2159 2000
Joss U and W K Graber Profiles and Simulated Exchange of H2O O3 NO2 Between the Atmosphere and the HartX Scots Pine Plantation Theor Appl Climatol 53 157-172 1996
Lefer B L and R W Talbot Nitric acid and ammonia at a rural northeaster US site J Geophys Res 104 1645-1661 1999
Lerdau M T J W Munger D J Jacob The NO2 Flux Conumdrum Science289 2291-2293 2000
Moody J L J W Munger A H Goldstein D J Jacob and S C Wofsy Harvard Forest regional-scale air mass composition by Patterns in Atmospheric Transport History (PATH) J Geophys Res 103 13181-13194 1998
Munger J W S C Wofsy P S Bakwin S-M Fan M L Goulden B C Daube and A H Goldstein Atmospheric deposition of reactive nitrogen oxides and ozone in a temperate deciduous forest and a subarctic woodland 1 Measurements and mechanisms J Geophys Res 101 12639-12657 1996
Munger J W S-M Fan P S Bakwin M L Goulden A H Goldstein A S Colman and S C Wofsy Regional budgets for nitrogen oxides from continental sources Variations of rates for oxidation and deposition with season and distance from source regions J Geophys Res 103 8355-8368 1998
Notholt J J Hjorth and F Raes Formation of HNO2 on aerosol surfaces during foggy periods in the presence of NO and NO2 Atmos Environ 26A 211-217 1992
Padro J Zhang L and W J Massman An analysis of measurements and modlling of air-surface exchange of NO-NO2-O3 over grass Atmos Environ 32 1365-1375 1998
102
103
Rondon A C Johansson L Granat Dry Deposition of Nitrogen Dioxide and Ozone to Coniferous Forests J Geophys Res 98 5159-5172 1993
Rothman LS et al The HITRAN molecular spectroscopic database and HAWKS (HITRAN Atmospheric Workstation) 1996 Edition J Quant Spectrosc Radiat Transfer 60 665-710 1998
Sparks J P R K Monson K L Sparks M Lerdau Leaf uptake of nitrogen dioxide (NO2) in a tropical wet forest implications for tropospheric chemistry Oecologia 127 214-221 2001
Stocker D W D H Stedman K F Zeller W J Massman D G Fox Fluxes of Nitrogen Oxides and Ozone Measured by Eddy Correlation Over a Shortgrass Prairie J Geophys Res 98 12619-12630 1993
Walton S M W Gallagher T W Choularton J Duyzer Ozone and NO2 Exchange to Fruit Orchards Atmos Environ 31 2767-2776 1997
Wesely M L J A Eastman D H Stedman E D Yalvac An eddy-correlation measurement of NO2 flux to vegetation and comparison to O3 flux Atmos Environ 16 815-820 1982
Wesely M L Parameterization of surface resistances to gaseous dry deposition in regional-scale numerical models Atmos Environ 23 1293-1304 1989
Wesley M L and B B Hicks A review of the current status of knowledge on dry deposition Atmos Environ 34 2261-2282 2000
Wildt J D Kley A Rockel P Rockel H J Schneider Emission of NO from several higher plant species J Geophys Res 102 5919-5927 1997
- April ndash November 2000
- G (nmol mol-1)
- 29 August ndash 8 Oct 2000
- References
- Chapter3_NOx_Part2pdf
-
- 34 Discussion
-
- Chapter3_NOx_Part1pdf
-
- 32 Methods
- 33 Results
-

NO
2Fl
ux (micro
mol
m-2
hr-1
)
- NO Flux (micromol m-2 hr-1)
0 2 4 6 8 10 12
-10
010
2030
40
Figure 315 Relationship between daytime hourly FNO2 and ndashFNO 29 August to 8
October 2000 FNO2 = (05plusmn01) - (35plusmn01)middotFNO R2 = 079
77
Table 32 Regressions of daytime FNO2 (as defined by light level see above covered
hours 500 to 2000 EST) in terms of linear combinations of βmiddotFNO V0middot[NO2] and γmiddotgc
F0 is the intercept for each fit representing flux at [NO2] = FNO = gc = 0 Flux units of
(nmol mol-1 cm s-1) are used Note that FNO is largely negative (downward) so that a
negative value of β represents a positive flux term
F0 plusmn std error
(nmol mol-1 cm s-1) β plusmn std error
(dimensionless) V0 plusmn std error
(cm s-1) γ plusmn std error (nmol mol-1) R2
05plusmn01 (p-valuelt1E-4)
-35plusmn01 (p-valuelt1E-4) NA NA 079
constrained to 0 -37plusmn01 (p-valuelt1E-4) NA NA 079
07plusmn02 (p-valuelt1E-4)
-38plusmn02 (p-valuelt1E-4)
-016plusmn008 (p-value=004) NA 084
constrained to 0 -37plusmn02 (p-valuelt1E-4)
003plusmn007 (p-value=07) NA 083
01plusmn03 (p-value=06 )
-35plusmn01 (p-valuelt1E-4) NA 10plusmn04
(p-value=002) 083
constrained to 0 -35plusmn01 (p-valuelt1E-4) NA 12plusmn02
(p-valuelt1E-4) 083
04plusmn03 (p-value=02)
-38plusmn02 (p-valuelt1E-4)
-018plusmn009 (p-value=005)
09plusmn05 (p-value=008) 087
constrained to 0 -38plusmn02 (p-valuelt1E-4)
-012plusmn008 (p-value=01)
13plusmn03 (p-valuelt1E-4) 087
78
The stable statistically significant relationship between the daytime fluxes of NO
and NO2 appears to indicate that although the species were measured on nearby towers at
different heights their photochemical cycling is coherent on an hourly basis This
process clearly dominates the behavior of NOx fluxes near the forest canopy but
represents neither net deposition nor net emission The next largest term appears to be a
constant deposition velocity downward flux of NO2 Finally there is a small positive
NO2 flux component which is equally well-fit as a constant flux or a stomatal
conductance-dependent term We performed additional regressions (not shown) using a
stomatal term of the form γprimemiddotgcmiddot([NO2]-[NO2]c) where [NO2]c is the compensation point
concentration below which vegetation emits NO2 While marginally significant values of
γprime could be obtained for [NO2]c values fixed between 1 and 10 nmol mol-1 the data did
not contain enough information to determine the compensation point independently In
2000 median summerfall daytime [NO2] was 11 nmol mol-1 (75th percentile=23 nmol
mol-1) Thus the vegetation at Harvard Forest usually experiences NO2 concentrations at
or below the 05 to 15 nmol mol-1 range of previously observed compensation points for
coniferous and tropical trees in chamber studies [eg Sparks et al 2001 Rondoacuten et al
1993] It is not possible to definitively attribute the small positive flux (γmiddotgc) to a
stomatal process the term could also indicate a chemical or other process which reduces
the deposition velocity under daytime conditions
To investigate the behavior of the NO2 flux beyond the limited period of NO flux
measurements we use above-canopy PPFD as a proxy for photochemical activity for our
data when NO fluxes were not measured Figure 316 shows daytime exchange
velocities of NO and NO2 plotted against PPFD For clarity hourly points are omitted
79
00 05 10 15
-10
12
34
NO2 (h=22m) leaves onNO2 (h=22m) leaves offNO (h=29m) leaves on
Exch
ange
Vel
ocity
(cm
s-1
)
PPFD (mmol m-2 s-1)
Figure 316 Daytime emission velocities of NO2 (leaves on solid triangles
leaves off open triangles) and NO (leaves on solid circles no data for leaves off
periods) plotted against photosynthetic photon flux density (PPFD) Symbols are
medians binned by percentiles of above-canopy PPFD For clarity hourly points are not
shown V(NO2) data span spring through fall 2000 while V(NO) data were collected late
August to early October 2000 only Linear fits to binned median points (exchange
velocities in units of cm s-1 PPFD in units of mmol m-2 s-1) reported in Table 33
80
and only the PPFD quantile-binned medians are plotted For each species we determine
quantiles of PPFD for daytime hours with data These quantiles define for each trace gas
species the measurement hours whose median values are shown The coupling of the bi-
directional NOx fluxes becomes more intense as the difference in light intensity from
above- to below-canopy increases during periods of high above-canopy illumination
cycling ceases as light intensity and therefore light gradient declines NO2 flux data are
segregated into full-canopy (leaves on) conditions from early June to mid-October and
leafless periods in April-May and October-November Linear regressions to the
percentile-binned medians of PPFD (V = VPPFD=0 + bmiddotPPFD) yield the following
relationships for the daytime data shown in Table 33
Before leaf-out and after leaf-fall the coefficient of PPFD in the NO2 regression
is smaller than for full-canopy conditions This expected since the leaf area index at
Harvard Forest at mid-summer is approximately 34 [Munger et al 1996] whereas the
area index for bare stems and twigs is only 09 [Barford et al 2001] The light gradient
for leaves-off conditions is smaller resulting in smaller concentration gradients and
reduced coupled NOx fluxes It is also likely that NO2 emission by the leaves contributes
to the increased slope of VNO2 vs PPFD when the canopy is developed
NO is not expected to deposit to surfaces in large amounts though there is very
little experimental evidence [Hanson et al 1991 Wesely and Hicks 2000] Soil NO
emission at Harvard Forest is small less than 09 micromol m-2 hr-1 [Munger et al 1996]
making NO unlikely to escape from the canopy before conversion to NO2 Thus the NO
flux at Harvard Forest is dominated by photochemical cycling and can be parameterized
as a function of PPFD and [NO] Coefficients for least squares fits to hourly daytime
FNO data (measurement height = 29m 29 Aug-8 Oct 2000) are shown in Table 34
81
Table 33 Linear regression of daytime percentile-binned median VNO2 and VNO
against of PPFD
VPPFD=0 plusmn std error
cm s-1 b plusmn std error
cm s-1 (mmol m-2 s-1)-1 R2
VNO2 leaves on -04 plusmn 01 (p-value=002)
27 plusmn 02 (p-valuelt1E-4) 097
VNO2 leaves off -01 plusmn 01 (p-value=03)
15 plusmn 02 (p-valuelt1E-4) 090
VNO leaves on -042 plusmn 007 (p-value=4E-4)
-05plusmn01 (p-value=7E-4) 078
82
Table 34 Regressions results for daytime FNO = F0_NO + V0_NO [NO] + bprime PPFD [NO]
F0_NO plusmn std error
(nmol mol-1 cm s-1)
bprime plusmn std error cm s-1 (mmol m-2 s-1)-1
V0_NO plusmn std error (cm s-1) R2
-008plusmn001 (p-valuelt1E-4)
-110plusmn002 (p-valuelt1E-4) NA 091
Constrained to 0
-114plusmn002 (p-valuelt1E-4)
NA 091
-006plusmn001
(p-valuelt1E-4)
-092plusmn004
(p-valuelt1E-4)
-018plusmn004
(p-valuelt1E-4) 091
Constrained to 0
-087plusmn004 (p-valuelt1E-4)
-025plusmn003
(p-valuelt1E-4) 091
83
To treat the larger daytime NO2 flux dataset we combine a terms representing the
light dependence shown in Figure 316 constant deposition velocity and stomatal
conductance Because gc was calculated assuming the presence of leaves we use the
measured deposition velocity of O3 Vd(O3) = -V(O3) as a proxy for the stomatal opening
from early spring through late fall Table 35 shows the results for the regressions using
these terms
A quadratic term amiddot[NO2]2 is not statistically significant when included because
we have few measurements with sufficiently high NO2 concentrations We interpret the
term (b+f)middotPPFDmiddot[NO2] as approximately accounting for the NO2 flux that arises from
photochemical cycling with NO (b+f) agrees well with the coefficients found in Table
33 As in the limited dataset regressions using FNO instead of PPFD (Table 32) V0
indicates an exchange velocity for NO2 on the order of -03 cm s-1 (downward) Given
the robust appearance of this term with different fit parameters for both limited and full
datasets we find it likely that V0 represents a roughly constant deposition velocity
process independent of NOx photochemical cycling during the day Though statistical
significance is low an upward flux term associated with stomatal conductance or related
variables also appears in Table 35
343 Parameterization of NOx Fluxes
Both nighttime and daytime NOx fluxes can be combined into a single
parameterization based on the above discussion This framework adopts the hypothesis
that photochemical NO-NO2 cycling can be largely accounted for by a simple light-
dependent term and that net deposition may then be estimated from additional terms
representing constant exchange velocity concentration-dependent exchange velocity and
84
Table 35 Multi-factor regression using all hourly daytime FNO2 data following the
functional form FNO2 = (b+f)middotPPFDmiddot[NO2] + V0 [NO2] + ΓmiddotVd(O3) The intercepts for all
fits have been constrained to zero The parameter f is a canopy flag set to zero for full-
canopy conditions so may be considered a correction to the PPFD term for leaves-off
periods in early spring and late fall
b plusmn std error cm s-1 (mmol m-2 s-1)-1
f plusmn std error cm s-1 (mmol m-2 s-1)-1
= 0 for leaves on V0 plusmn std error
(cm s-1) Γ plusmn std error (nmol mol-1) R2
196plusmn007 (p-valuelt1E-4)
-13plusmn01 (p-valuelt1E-4) NA NA 055
240plusmn009
(p-valueltlt1E-4)
-132plusmn009 (p-valuelt1E-4)
-035plusmn005 (p-valuelt1E-4) NA 060
196plusmn008 (p-valuelt1E-4)
-11plusmn01 (p-valuelt1E-4) NA 01plusmn01
(p-value=04) 062
229plusmn009 (p-valuelt1E-4)
-11plusmn01 (p-valuelt1E-4)
-030plusmn005 (p-valuelt1E-4)
03plusmn01 (p-value=003) 065
85
stomatal conductance-related exchange processes Thus for the height of 22 m relative to
the 20 m canopy the flux of NO2 day and night is given by the simple function of NO2
concentration PPFD and O3 deposition velocity
FNO2 = V0 middot [NO2] + amiddot[NO2]2 + (b+f)middotPPFDmiddot[NO2] + ΓmiddotVd(O3) (Eq 37)
where f is added to the coefficient of PPFD to account for the observed difference
between full-canopy and leaves-off conditions
NO is not present in significant quantities at night and FNO appears to be driven
by a simple dependence on PPFD during the day We include a constant deposition
velocity term as well since evidence of NO deposition to surfaces is weak and
inconclusive At a measurement height of 29 m the flux of NO is given by
FNO = V0_NO middot [NO] + bprime middot PPFD middot [NO] (Eq 38)
The net fluxes of NO and NO2 may be determined by omitting the photochemical terms
from Eq 37 and 38 Since we expect the deposition velocity of NO to be small
FNOx(net)asympFNO2(net)
FNOx(net) asymp V0 middot [NO2] + amiddot[NO2]2 + ΓmiddotVd(O3) (Eq 39)
Multi-factor regressions for Eq 37 and Eq 38 were performed to determine the
coefficients V0 a b f V0_NO and brsquo using all available hourly observations of [NO2]
[NO] PPFD Vd(O3) FNO2 and FNO at Harvard Forest April-November 2000 The
results are presented in Table 36 along with the range of results from the separate
daytime and nighttime analyses discussed earlier
86
Table 36 Multi-factor regressions using all available hourly observations of [NO2]
[NO] PPFD Vd(O3) FNO2 and FNO at Harvard Forest April-November 2000 Note
that Vd(O3)=deposition velocity positive values indicate downward O3 exchange
velocity
z = 22m FNO2 = V0 middot [NO2] + a middot [NO2]2 + (b+f)middotPPFDmiddot[NO2] + Γ middot Vd(O3)
coeff plusmn std err p-value
April ndash November 2000 (R2 = 060)
Range of results from separate day and night analyses
V0 (cm s-1) -021plusmn004 lt1E-4 -03 to -001
a (nmol-1 mol cm s-1) -0002plusmn0004dagger 06 -0013 to ndash0002
b (cm s-1 (mmol m-2 s-1)-1) 221plusmn007 lt1E-4 19 to 24
f (cm s-1 (mmol m-2 s-1)-1) =0 for leaves-on -110plusmn009 lt1E-4 -13 to -10
Γ (nmol mol-1) 021plusmn009 002 01 to 03
z = 29m FNO = V0_NO middot [NO] + bprime middot PPFD middot [NO]
29 August ndash 8 Oct 2000 (R2 = 092)
V0_NO (cm s-1) -025plusmn002 lt1E-4 -087 to -042
bprime (cm s-1 (mmol m-2 s-1)-1) -087plusmn003 lt1E-4 -114 to -05
daggerThe more statistically robust nighttime a =-0013 plusmn 0001 (Table 31) is recommended
87
Nearly all of the coefficients fall within the ranges determined previously except
V0 and V0_NO which differ only slightly from the earlier values As illustrated in Figures
317 and 318 Eq 37 and Eq 38 with the multi-factor regression coefficients in Table
36 are good predictors of the measured fluxes over their entire dynamic ranges and for
all sampled conditions
The diel variations of fluxes and residuals from this parameterization (Figure
319) reveal several interesting features The parameterization captures the overall diel
behavior of both NO and NO2 fluxes It also tends to underestimate the upward flux of
[NO2] during the day for northwesterly flow conditions and to slightly overestimate
during daytime southwesterly flows The disagreement rarely exceeds the 25th and 75th
quantiles of the measured fluxes The dominant flow regimes at Harvard Forest differ in
a number of key respects that may affect this result Northwesterly conditions tend to
bring lower concentrations of reactive nitrogen species cooler temperatures drier
weather and clearer skies than southwest winds [Moody et al 1998] It is possible that
one or more of these factors is contributing to the wind-sector difference in the residuals
One might expect that the residuals would depend on additional factors not taken
into consideration For example mixing and therefore deposition depends on the friction
velocity u (m s-1) As shown in figure 320 the residual NO2 flux tends upward only at
the highest u quantiles during the day and has no significant trend at night Similarly
the temperature-dependent rate for (R31) k1(T)[O3] has not been included yet we find
that the NO2 flux residuals exhibit no statistically significant trend with k1(T)[O3] (Figure
321) Although included as terms in the paratmeterization similar residual analyses are
shown for V(O3) during the day (Figure 321) and for [NO2] during the day and night
(Figure 322) The distinctly different daytime and nighttime behavior of the total NO2
flux is apparent again in Figure 322 as are the small residuals overall
88
Res
idua
l (M
es ndash
Para
m)
FN
O2
(nm
ol m
ol-1
cm s
-1)
Parameterized FNO2 (nmol mol-1 cm s-1)
Mea
sure
d FN
O2
(nm
ol m
ol-1
cm s
-1)
FNO2 = V0middot[NO2] + amiddot[NO2]2 + (b+f)middotPPFDmiddot[NO2] + ΓmiddotVd(O3)
Daytime +Nighttime
11
-20 -10 0 10 20 30
-20
-10
010
2030
Quantiles of Standard Normal
-2 0 2
-10
-50
510
Figure 317 Upper Measured vs parameterized NO2 flux shown with 11 line daytime
(+) and nighttime () The functional form the parameterization is shown at the top
Lower Residuals of FNO2 vs quantiles of the standard normal The residuals are
normally-distributed with extended upper and lower wings
89
-10 -8 -6 -4 -2 0 2
-10
-8-6
-4-2
02
Quantiles of Standard Normal
-2 0 2
-10
-05
00
05
10
15
Mea
sure
d FN
O (n
mol
mol
-1cm
s-1
)
Res
idua
l (M
es ndash
Para
m)
FN
O (n
mol
mol
-1cm
s-1)
Parameterized FNO (nmol mol-1 cm s-1)
FNO = V0_NOmiddot[NO] + b middotPPFDmiddot[NO]
11
Figure 318 Same as Figure 317 for FNO
90
Fl
ux (n
mol
mol
-1cm
s-1
)R
esid
ual (
nmol
mol
-1cm
s-1
)Measured FNO (h=22m)Measured FNO2 (h=22m)Parameterized FNOParameterized FNO2
Meas-Param FNOMeas-Param FNO2
-20
24
-20
24
NW
0 5 10 15 20
-2-1
01
2-2
-10
12
-20
24
-20
24
SW
0 5 10 15 20
-2-1
01
2-2
-10
12
Hour
Figure 319 Top panels Median diel measured (closed symbols solid lines) and
parameterized (open symbols dashed lines) fluxes of NO2 and NO Vertical bars show
the 25th and 75th quantiles for the measurements Lower panels Median diel residual
(measured-parameterized) FNO2 and FNO Northwest wind conditions are shown on the
left southwest on the right The parameterizations capture the daytime behavior of NO
flux due to the photochemical gradient and eddy diffusivity effects For NO2 under
northwesterly conditions the daytime residual is positive indicating that the
parameterization underestimates upward flux of NO2 For southwesterly conditions
daytime NO2 flux residuals are more variable and tend in the opposite direction
91
DAY NIGHT
FNO
2(n
mol
mol
-1cm
s-1
)R
esid
ual F
NO
2(n
mol
mol
-1cm
s-1
)
FNO
2(n
mol
mol
-1cm
s-1
)R
esid
ual F
NO
2(n
mol
mol
-1cm
s-1
)
Res
idua
l FN
O2
(nm
ol m
ol-1
cm s
-1)
Measured FNO2
Parameterized FNO2
Res
idua
l FN
O2
(nm
ol m
ol-1
cm s
-1)
u (m s-1) u (m s-1)
u (m s-1) u (m s-1)
-10
-50
510
00 05 10 15
-10
-50
510
-10
-50
510
00 05 10 15
-10
-50
510
00 02 04 06 08 10 12 14
-20
2
00 02 04 06 08 10 12 14
-20
2
Figure 320 From top to bottom measured and parameterized NO2 fluxes residuals
(measured-parameterized) and expanded-axes quantile-binned mean residuals (plusmn
standard deviation) vs u shown for daytime on the left and nighttime on the right
92
DAY k1(T)[O3] Day V(O3)
FNO
2(n
mol
mol
-1cm
s-1
)R
esid
ual F
NO
2(n
mol
mol
-1cm
s-1
)
FNO
2(n
mol
mol
-1cm
s-1
)R
esid
ual F
NO
2(n
mol
mol
-1cm
s-1
)
Res
idua
l FN
O2
(nm
ol m
ol-1
cm s
-1)
Measured FNO2
Parameterized FNO2
Res
idua
l FN
O2
(nm
ol m
ol-1
cm s
-1)
k1(T)[O3] (s-1) V(O3) (cm s-1)
k1(T)[O3] (s-1) V(O3) (cm s-1)
-10
010
2030
001 002 003 004
-10
-50
510
-10
010
2030
-003 -002 -001 00 001
-10
-50
510
0005 0010 0015 0020 0025 0030
-3-2
-10
12
-0015 -0010 -0005 00
-3-2
-10
12
Figure 321 Same as Figure 321 for daytime k1(T)[O3] (left) and daytime V(O3) (right)
93
DAY NIGHT
FNO
2(n
mol
mol
-1cm
s-1
)R
esid
ual F
NO
2(n
mol
mol
-1cm
s-1
)
FNO
2(n
mol
mol
-1cm
s-1
)R
esid
ual F
NO
2(n
mol
mol
-1cm
s-1
)
Res
idua
l FN
O2
(nm
ol m
ol-1
cm s
-1)
Measured FNO2
Parameterized FNO2
Res
idua
l FN
O2
(nm
ol m
ol-1
cm s
-1)
[NO2] (nmol mol-1) [NO2] (nmol mol-1)
[NO2] (nmol mol-1) [NO2] (nmol mol-1)
-10
010
2030
0 5 10 15 20
-10
-50
510
-20
-15
-10
-50
510
0 5 10 15 20
-10
-50
510
0 2 4 6 8
-3-2
-10
12
0 2 4 6 8 10 12
-20
24
Figure 322 Same as Figure 321 for [NO2] during the daytime (left) and nighttime
(right)
94
The lack of robust trends in the NO2 flux residuals indicates that within the
limitations of the dataset Eq 37 captures the crucial aspects of observed NO2 flux
behavior within and above the tall forest canopy under a wide range of conditions
Similarly Eq 38 accounts for 92 of the observed variance in the measured NO fluxes
under a somewhat narrower set of conditions (the sampling period for NO eddy
covariance flux measurements was relatively short) Figure 323 shows the resulting net
NOx flux (Eq 39 Table 36) and exchange velocity VNOx(net)=FNOx(net)[NO2] on a
diel basis for the sampling period April-November 2000 For the rural low-NOx
conditions at Harvard Forest we find that the flux of NOx is downward at all hours with
a deposition velocity of approximately 02 cm s-1
35 Conclusions
We installed a Tunable Diode Laser Absorption Spectrometer (TDLAS) to
measure continuous NO2 concentrations and eddy covariance fluxes above the canopy at
Harvard Forest during the spring summer and fall of 2000 An existing
chemiluminescence NO detector was configured to measure above-canopy eddy
covariance fluxes for a shorter period in the late summer and early fall A photolysis-
chemiluminescence (P-C) NO2 instrument also measured concentrations for a portion of
the sampling period Hourly average TDLAS and P-C NO2 concentrations agreed very
well under all conditions The agreement between the two instruments in the field and
the independent spectroscopic calibration of the TDLAS validated the long-term
measurements of the tank-calibrated P-C system
95
0 6 12 18
-10
-08
-06
-04
-02
00
-14
-12
-10
-08
-06
-04
-02
00
Net
FN
Ox
(nm
ol m
ol-1
cm s
-1)
(microm
ol m
-2hr
-1)
Net
VN
Ox
(cm
s-1
)
Hour
median| 25th amp 75th percentiles
0 6 12 18
-024
-022
-020
-018
Figure 323 Diel cycle of parameterized net NOx exchange velocity (upper panel) and
flux (lower panel) April-November 2000 FNOx(net) asymp FNO2(net) = V0middot[NO2] +
amiddot[NO2]2 + ΓmiddotVd(O3) VNOx(net) = FNO2(net)[NO2]
96
At night in the absence of significant quantities of NO we observed a consistent
downward flux of NO2 which depended quadratically on the concentration of NO2
although the dependence was apparent mainly on two nights when [NO2] was above 10
nmol mol-1 The nighttime NO2 deposition velocity varied between 02 cm s-1 at [NO2]=1
nmol mol-1 and 05 cm s-1 at [NO2]=30 nmol mol-1 These fluxes could come from direct
NO2 deposition to non-stomatal surfaces in the forest such as soil litter bark and the
outer surfaces of leaves area-normalized deposition velocities to such surfaces in
chamber measurements have varied from less than 01 to 05 cm s-1 for NO2
concentrations between 40 and 80 nmol mol-1 [Hanson and Lindberg 1991] The rate of
heterogeneous N2O5 hydrolysis resulting in aqueous-phase HNO3 (unlikely to re-enter the
gas phase) is insufficient to explain the observed nighttime NO2 deposition rates The
quadratic flux dependence and similarity to the behavior of HONO observed at other sites
suggests that heterogeneous NO2 hydrolysis may also play a significant role in NO2
deposition [Harrison and Kitto 1994 Harrison et al 1996 Barney and Finlayson-Pitts
2000] Half of any NO2 flux due to heterogeneous NO2 hydrolysis would likely escape
from the surfaces as gas-phase HONO potentially impacting the daytime HOx and NOx
budgets when photolyzed at sunrise
During the day we observed coupled fluxes of NO2 (upward) and NO
(downward) due to photochemical cycling driven by canopy-induced light and eddy
diffusivity gradients The imbalance in the observed fluxes corresponded to the
difference in height of the sampling levels relative to the canopy The exchange
velocities of the two species in their respective directions increased with higher above-
canopy light levels as measured by photosynthetic photon flux density (PPFD) due to the
97
stronger light gradient through the canopy under brighter conditions Upward NO2
velocity was smaller in early spring and late fall when there were no leaves on the trees
corresponding to a weaker light gradient condition (NO fluxes were only measured
during full-canopy conditions) and possibly to the absence of stomata-dependent
emission of NO2 We believe that these coupled fluxes are the first to be reported from a
mature tall-canopy site using reliable eddy-covariance appropriate sampling techniques
All of the NO and NO2 flux data day and night were well explained by a simple
parameterization consisting of two equations FNO2 = V0 middot [NO2] + amiddot[NO2]2 +
(b+f)middotPPFDmiddot[NO2] + ΓmiddotVd(O3) and FNO = V0_NO middot [NO] + bprime middot PPFD middot [NO] The net flux
of NOx is approximately equal to the flux of NO2 omitting the PPFD-dependent term
FNOxasympV0 middot [NO2] + amiddot[NO2]2 + ΓmiddotVd(O3) V0 and V0_NO are small constant deposition
velocity terms b and bprime are coefficients of light-dependent coupled fluxes for full-canopy
conditions and f adjusts the NO2 light-dependent term for no-leaves conditions The
deposition velocity of O3 was used as a proxy for stomatal exchange the coefficient Γ
was consistently positive Stomatal conductance correlates with a number of different
variables (light temperature humidity) complicating the interpretation of the final term
It may indicate a stomatal emission of NO2 under low-NOx conditions typical at Harvard
Forest but could also correspond to a chemical or other process which slows NO2
deposition during the day The quadratic term amiddot[NO2]2 was particularly significant at
night during a few high-[NO2] events Multi-factor regressions fitting the hourly data
with these equations yield R2 of 061 for FNO2 and 092 for FNO the coefficients
summarized in Table 36 agree with analyses of segregated daytime and nighttime data
We note that the coefficients are relevant to the specific measurement heights of NO (29
98
m) and NO2 (22 m) at Harvard Forest relative to the forest canopy height (20 m)
However the mechanism should be adaptable for more general application
During the measurement period net NO2 deposition velocity (omitting the PPFD-
dependent term associated with photochemical cycling of NOx) -(V0 + amiddot[NO2] +
ΓmiddotVd(O3)[NO2]) was between 015 and 03 cm s-1 The mean 02 cm s-1 varied by less
than 002 cm s-1 between day and night and between full-canopy and leafless conditions
NO2 deposition velocity measurements to deciduous forest canopies are scarce this result
falls just outside of the range of reported values for coniferous forests 01 to 15 cm s-1
[Hanson and Lindberg 1991 Rondoacuten et al 1993 Joss and Graber 1996] and short
crops such as alfalfa soy and oats 007 to 125 cm s-1 [Hanson and Lindberg 1991]
The only estimates of NO deposition velocity are over grass ~01 to 02 cm s-1 [Hanson
and Lindberg 1991] other observations indicate NO emission from various species
though soil emissions could confound these results [Wildt et al 1997] This is quite
close to the ~025 cm s-1 NO deposition velocity at Harvard Forest (-V0_NO) but we
cannot resolve the debate as to whether NO deposits at all [Wesely and Hicks 2000]
Concentration and flux measurements of HONO N2O5 and NO3 (along with NO
and NO2) are required to better understand the nighttime chemistry and deposition of
NOx Recently-developed continuous analyzers for HONO [Harrison et al 1996] and N-
2O5 and NO3 [Brown et al 2001] may make these measurements possible in the coming
years In addition the use of flux chambers with a TDLAS or other instrument (sub-
nmol mol-1 sensitivity and species-specific detection method) on leaf litter and soil
samples in the lab and field may facilitate direct detection of NO2 compensation points
for various species and quantify the importance of different natural surfaces
99
NOx deposition matters to both the ecosystem and the atmosphere the form of
nitrogen entering plants affects nutrient loading acid stress and toxicity and the form of
nitrogen leaving the atmosphere affects O3 production HOx chemistry and long-range
transport of anthropogenic pollutants We are hopeful that future research endeavors will
approach the problem from the perspective of both ecosystem and atmosphere at scales
ranging from the individual leaf to the vegetated landscape using reliable species-
specific and sensitive measurement techniques
References
Andreacutes-Hernaacutendez J Notholt J Hjorth and O Schrems A DOAS study on the origin of initrous acid at urban and non-urban sites Atmos Environ 30 175-180 1996
Aneja V P P A Roelle G C Murray J Southerland J W Erisman D Fowler W A H Asman and N Patni Atmospheric nitrogen compounds II emissions transport transformation deposition and assessment Atmos Environ 35 1903-1911 2001
Barford C E Hammond Pyle L Hutyra S Wofsy Ecological Measurements to compliment eddy-flux measurements at Harvard Forest [Online data archive] httpwww-asharvardedudatanigec-datahtml 2001
Barnet W S and B J Finlayson-Pitts Enhancement of N2O4 on porous glass at room temperature A key intermediate in the heterogeneous hydrolysis of NO2 J Phys Chem A 104 171-175 2000
Barney W S and B J Finlayson-Pitts Enhancement of N2O4 on Porous Glass at Room Temperature A Key Intermediate in the Heterogeneous Hydrolysis of NO2 J Phys Chem A 104 171-175 2000
Bey I D J Jacob R Yantosca J logan B Field A Fiore Q Li H Liu L Mickley M Schultz Global modeling of tropospheric chemistry with assimilated meteorology Model description and evaluation in press J Geophys Res 2001
Brown S H Stark S J Ciciora and A R Ravishankara In-situ measurement of atmospheric NO3 and N2O5 via cavity ring-down spectroscopy Geophys Res Lett 28 3237-3230 2001 (a)
100
Brown S H Stark S J Ciciora and A R Ravishankara In-situ Detection of Atmospheric NO3 and N2O5 via Cavity Ring-Down Spectroscopy EOS Trans AGU 82 Fall Meeting Suppl A41B-0045 2001 (b)
Coe H and M W Gallagher Measurements of dry deposition of NO2 to a Dutch heathland using the eddy-correlation technique Q J R Meteorol Soc118 767-786 1992
Delaney A C D R Fitzjarrald D H Lenschow R Pearson Jr G J Wendel B Woodruff Direct Measurements of Nitrogen Oxides and Ozone Fluxes over Grassland J Atmos Chem 4 429-444 1986
Eugster W and R Hesterberg Transfer resistances of NO2 determined from eddy correlation flux measurements over a litter meadow at a rural site on the Swiss plateau Atmos Environ 30 1247-1254 1996
Fitzjarrald D R and D H Lenschow Mean concentration and flux profiles for chemically reactive species in the atmospheric surface layer Atmos Environ 17 2505-2512 1983
Galmarini S P G Duynkerke J Vila-Guerau De Arellano Evolution of Nitrogen Oxide Chemistry in the Nocturnal Boundary Layer J Appl Meteorology 36 943-957 1997
Gao W M L Wesely P V Doskey Numerical Modeling of the Turbulent Diffusion and Chemistry of NOx O3 Isoprene and Other Reactive Trace Gases in and Above a Forest Canopy J Geophys Res 98 18339-18353 1993
Gao W and M L Wesely Numerical Modeling of the Turbulent Fluxes of Chemically Reactive Trace Gases in the Atmospheric Boundary Layer J Appl Meteorology 33 835-847 1994
Goodman A L G M Underwood and V H Grassian Heterogeneous Reaction of NO2 Characterization of Gas-Phase and Adsorbed Products from the Reaction 2NO2(g) + H2O(a) HONO(g) + HNO3(a) on Hydrated Silica Particles J Phys Chem A 103 7217-7223 1999
Goulden ML JW Munger S-M Fan B C Daube and S C Wofsy Measurements of carbon sequestration by long-term eddy covariance Methods and a critical evaluation of accuracy Global Change Biology 2 169-182 1996
Harrison R M A-M N Kitto Evidence for a surface source of atmospheric nitrous acid Atmos Environ 28 1089-1094 1994
Harrison R M J D Peak G M Collins Tropospheric cycle of nitrous acid J Geophys Res 101 14429-14439 1996
101
Heal M R B B B Booth J N Cape K J Hargreaves The influence of simplified peroxy radical chemistry on the interpretation of NO2-NO-O3 surface exchange Atmos Environ 35 1687-1696 2001
Horii C V M S Zahniser D D Nelson J B McManus S C Wofsy Nitric Acid and Nitrogen Dioxide Flux Measurements a New Application of Tunable Diode Laser Absorption Spectroscopy Proc of SPIE 3758 152-161 1999
Hosker R P Jr and S E Lindberg Review Atmospheric deposition and plant assimilation of gases and particles Atmos Environ 16 889-910 1982
Hanson P and S E Lindberg Dry deposition of reactive nitrogen compounds a review of leaf canopy and non-foliar measurements Atmos Environ 25A 1615-1634 1991
Jacob D J Heterogeneous chemistry and tropospheric ozone Atmos Environ 34 2131-2159 2000
Joss U and W K Graber Profiles and Simulated Exchange of H2O O3 NO2 Between the Atmosphere and the HartX Scots Pine Plantation Theor Appl Climatol 53 157-172 1996
Lefer B L and R W Talbot Nitric acid and ammonia at a rural northeaster US site J Geophys Res 104 1645-1661 1999
Lerdau M T J W Munger D J Jacob The NO2 Flux Conumdrum Science289 2291-2293 2000
Moody J L J W Munger A H Goldstein D J Jacob and S C Wofsy Harvard Forest regional-scale air mass composition by Patterns in Atmospheric Transport History (PATH) J Geophys Res 103 13181-13194 1998
Munger J W S C Wofsy P S Bakwin S-M Fan M L Goulden B C Daube and A H Goldstein Atmospheric deposition of reactive nitrogen oxides and ozone in a temperate deciduous forest and a subarctic woodland 1 Measurements and mechanisms J Geophys Res 101 12639-12657 1996
Munger J W S-M Fan P S Bakwin M L Goulden A H Goldstein A S Colman and S C Wofsy Regional budgets for nitrogen oxides from continental sources Variations of rates for oxidation and deposition with season and distance from source regions J Geophys Res 103 8355-8368 1998
Notholt J J Hjorth and F Raes Formation of HNO2 on aerosol surfaces during foggy periods in the presence of NO and NO2 Atmos Environ 26A 211-217 1992
Padro J Zhang L and W J Massman An analysis of measurements and modlling of air-surface exchange of NO-NO2-O3 over grass Atmos Environ 32 1365-1375 1998
102
103
Rondon A C Johansson L Granat Dry Deposition of Nitrogen Dioxide and Ozone to Coniferous Forests J Geophys Res 98 5159-5172 1993
Rothman LS et al The HITRAN molecular spectroscopic database and HAWKS (HITRAN Atmospheric Workstation) 1996 Edition J Quant Spectrosc Radiat Transfer 60 665-710 1998
Sparks J P R K Monson K L Sparks M Lerdau Leaf uptake of nitrogen dioxide (NO2) in a tropical wet forest implications for tropospheric chemistry Oecologia 127 214-221 2001
Stocker D W D H Stedman K F Zeller W J Massman D G Fox Fluxes of Nitrogen Oxides and Ozone Measured by Eddy Correlation Over a Shortgrass Prairie J Geophys Res 98 12619-12630 1993
Walton S M W Gallagher T W Choularton J Duyzer Ozone and NO2 Exchange to Fruit Orchards Atmos Environ 31 2767-2776 1997
Wesely M L J A Eastman D H Stedman E D Yalvac An eddy-correlation measurement of NO2 flux to vegetation and comparison to O3 flux Atmos Environ 16 815-820 1982
Wesely M L Parameterization of surface resistances to gaseous dry deposition in regional-scale numerical models Atmos Environ 23 1293-1304 1989
Wesley M L and B B Hicks A review of the current status of knowledge on dry deposition Atmos Environ 34 2261-2282 2000
Wildt J D Kley A Rockel P Rockel H J Schneider Emission of NO from several higher plant species J Geophys Res 102 5919-5927 1997
- April ndash November 2000
- G (nmol mol-1)
- 29 August ndash 8 Oct 2000
- References
- Chapter3_NOx_Part2pdf
-
- 34 Discussion
-
- Chapter3_NOx_Part1pdf
-
- 32 Methods
- 33 Results
-

00 05 10 15
-10
12
34
NO2 (h=22m) leaves onNO2 (h=22m) leaves offNO (h=29m) leaves on
Exch
ange
Vel
ocity
(cm
s-1
)
PPFD (mmol m-2 s-1)
Figure 316 Daytime emission velocities of NO2 (leaves on solid triangles
leaves off open triangles) and NO (leaves on solid circles no data for leaves off
periods) plotted against photosynthetic photon flux density (PPFD) Symbols are
medians binned by percentiles of above-canopy PPFD For clarity hourly points are not
shown V(NO2) data span spring through fall 2000 while V(NO) data were collected late
August to early October 2000 only Linear fits to binned median points (exchange
velocities in units of cm s-1 PPFD in units of mmol m-2 s-1) reported in Table 33
80
and only the PPFD quantile-binned medians are plotted For each species we determine
quantiles of PPFD for daytime hours with data These quantiles define for each trace gas
species the measurement hours whose median values are shown The coupling of the bi-
directional NOx fluxes becomes more intense as the difference in light intensity from
above- to below-canopy increases during periods of high above-canopy illumination
cycling ceases as light intensity and therefore light gradient declines NO2 flux data are
segregated into full-canopy (leaves on) conditions from early June to mid-October and
leafless periods in April-May and October-November Linear regressions to the
percentile-binned medians of PPFD (V = VPPFD=0 + bmiddotPPFD) yield the following
relationships for the daytime data shown in Table 33
Before leaf-out and after leaf-fall the coefficient of PPFD in the NO2 regression
is smaller than for full-canopy conditions This expected since the leaf area index at
Harvard Forest at mid-summer is approximately 34 [Munger et al 1996] whereas the
area index for bare stems and twigs is only 09 [Barford et al 2001] The light gradient
for leaves-off conditions is smaller resulting in smaller concentration gradients and
reduced coupled NOx fluxes It is also likely that NO2 emission by the leaves contributes
to the increased slope of VNO2 vs PPFD when the canopy is developed
NO is not expected to deposit to surfaces in large amounts though there is very
little experimental evidence [Hanson et al 1991 Wesely and Hicks 2000] Soil NO
emission at Harvard Forest is small less than 09 micromol m-2 hr-1 [Munger et al 1996]
making NO unlikely to escape from the canopy before conversion to NO2 Thus the NO
flux at Harvard Forest is dominated by photochemical cycling and can be parameterized
as a function of PPFD and [NO] Coefficients for least squares fits to hourly daytime
FNO data (measurement height = 29m 29 Aug-8 Oct 2000) are shown in Table 34
81
Table 33 Linear regression of daytime percentile-binned median VNO2 and VNO
against of PPFD
VPPFD=0 plusmn std error
cm s-1 b plusmn std error
cm s-1 (mmol m-2 s-1)-1 R2
VNO2 leaves on -04 plusmn 01 (p-value=002)
27 plusmn 02 (p-valuelt1E-4) 097
VNO2 leaves off -01 plusmn 01 (p-value=03)
15 plusmn 02 (p-valuelt1E-4) 090
VNO leaves on -042 plusmn 007 (p-value=4E-4)
-05plusmn01 (p-value=7E-4) 078
82
Table 34 Regressions results for daytime FNO = F0_NO + V0_NO [NO] + bprime PPFD [NO]
F0_NO plusmn std error
(nmol mol-1 cm s-1)
bprime plusmn std error cm s-1 (mmol m-2 s-1)-1
V0_NO plusmn std error (cm s-1) R2
-008plusmn001 (p-valuelt1E-4)
-110plusmn002 (p-valuelt1E-4) NA 091
Constrained to 0
-114plusmn002 (p-valuelt1E-4)
NA 091
-006plusmn001
(p-valuelt1E-4)
-092plusmn004
(p-valuelt1E-4)
-018plusmn004
(p-valuelt1E-4) 091
Constrained to 0
-087plusmn004 (p-valuelt1E-4)
-025plusmn003
(p-valuelt1E-4) 091
83
To treat the larger daytime NO2 flux dataset we combine a terms representing the
light dependence shown in Figure 316 constant deposition velocity and stomatal
conductance Because gc was calculated assuming the presence of leaves we use the
measured deposition velocity of O3 Vd(O3) = -V(O3) as a proxy for the stomatal opening
from early spring through late fall Table 35 shows the results for the regressions using
these terms
A quadratic term amiddot[NO2]2 is not statistically significant when included because
we have few measurements with sufficiently high NO2 concentrations We interpret the
term (b+f)middotPPFDmiddot[NO2] as approximately accounting for the NO2 flux that arises from
photochemical cycling with NO (b+f) agrees well with the coefficients found in Table
33 As in the limited dataset regressions using FNO instead of PPFD (Table 32) V0
indicates an exchange velocity for NO2 on the order of -03 cm s-1 (downward) Given
the robust appearance of this term with different fit parameters for both limited and full
datasets we find it likely that V0 represents a roughly constant deposition velocity
process independent of NOx photochemical cycling during the day Though statistical
significance is low an upward flux term associated with stomatal conductance or related
variables also appears in Table 35
343 Parameterization of NOx Fluxes
Both nighttime and daytime NOx fluxes can be combined into a single
parameterization based on the above discussion This framework adopts the hypothesis
that photochemical NO-NO2 cycling can be largely accounted for by a simple light-
dependent term and that net deposition may then be estimated from additional terms
representing constant exchange velocity concentration-dependent exchange velocity and
84
Table 35 Multi-factor regression using all hourly daytime FNO2 data following the
functional form FNO2 = (b+f)middotPPFDmiddot[NO2] + V0 [NO2] + ΓmiddotVd(O3) The intercepts for all
fits have been constrained to zero The parameter f is a canopy flag set to zero for full-
canopy conditions so may be considered a correction to the PPFD term for leaves-off
periods in early spring and late fall
b plusmn std error cm s-1 (mmol m-2 s-1)-1
f plusmn std error cm s-1 (mmol m-2 s-1)-1
= 0 for leaves on V0 plusmn std error
(cm s-1) Γ plusmn std error (nmol mol-1) R2
196plusmn007 (p-valuelt1E-4)
-13plusmn01 (p-valuelt1E-4) NA NA 055
240plusmn009
(p-valueltlt1E-4)
-132plusmn009 (p-valuelt1E-4)
-035plusmn005 (p-valuelt1E-4) NA 060
196plusmn008 (p-valuelt1E-4)
-11plusmn01 (p-valuelt1E-4) NA 01plusmn01
(p-value=04) 062
229plusmn009 (p-valuelt1E-4)
-11plusmn01 (p-valuelt1E-4)
-030plusmn005 (p-valuelt1E-4)
03plusmn01 (p-value=003) 065
85
stomatal conductance-related exchange processes Thus for the height of 22 m relative to
the 20 m canopy the flux of NO2 day and night is given by the simple function of NO2
concentration PPFD and O3 deposition velocity
FNO2 = V0 middot [NO2] + amiddot[NO2]2 + (b+f)middotPPFDmiddot[NO2] + ΓmiddotVd(O3) (Eq 37)
where f is added to the coefficient of PPFD to account for the observed difference
between full-canopy and leaves-off conditions
NO is not present in significant quantities at night and FNO appears to be driven
by a simple dependence on PPFD during the day We include a constant deposition
velocity term as well since evidence of NO deposition to surfaces is weak and
inconclusive At a measurement height of 29 m the flux of NO is given by
FNO = V0_NO middot [NO] + bprime middot PPFD middot [NO] (Eq 38)
The net fluxes of NO and NO2 may be determined by omitting the photochemical terms
from Eq 37 and 38 Since we expect the deposition velocity of NO to be small
FNOx(net)asympFNO2(net)
FNOx(net) asymp V0 middot [NO2] + amiddot[NO2]2 + ΓmiddotVd(O3) (Eq 39)
Multi-factor regressions for Eq 37 and Eq 38 were performed to determine the
coefficients V0 a b f V0_NO and brsquo using all available hourly observations of [NO2]
[NO] PPFD Vd(O3) FNO2 and FNO at Harvard Forest April-November 2000 The
results are presented in Table 36 along with the range of results from the separate
daytime and nighttime analyses discussed earlier
86
Table 36 Multi-factor regressions using all available hourly observations of [NO2]
[NO] PPFD Vd(O3) FNO2 and FNO at Harvard Forest April-November 2000 Note
that Vd(O3)=deposition velocity positive values indicate downward O3 exchange
velocity
z = 22m FNO2 = V0 middot [NO2] + a middot [NO2]2 + (b+f)middotPPFDmiddot[NO2] + Γ middot Vd(O3)
coeff plusmn std err p-value
April ndash November 2000 (R2 = 060)
Range of results from separate day and night analyses
V0 (cm s-1) -021plusmn004 lt1E-4 -03 to -001
a (nmol-1 mol cm s-1) -0002plusmn0004dagger 06 -0013 to ndash0002
b (cm s-1 (mmol m-2 s-1)-1) 221plusmn007 lt1E-4 19 to 24
f (cm s-1 (mmol m-2 s-1)-1) =0 for leaves-on -110plusmn009 lt1E-4 -13 to -10
Γ (nmol mol-1) 021plusmn009 002 01 to 03
z = 29m FNO = V0_NO middot [NO] + bprime middot PPFD middot [NO]
29 August ndash 8 Oct 2000 (R2 = 092)
V0_NO (cm s-1) -025plusmn002 lt1E-4 -087 to -042
bprime (cm s-1 (mmol m-2 s-1)-1) -087plusmn003 lt1E-4 -114 to -05
daggerThe more statistically robust nighttime a =-0013 plusmn 0001 (Table 31) is recommended
87
Nearly all of the coefficients fall within the ranges determined previously except
V0 and V0_NO which differ only slightly from the earlier values As illustrated in Figures
317 and 318 Eq 37 and Eq 38 with the multi-factor regression coefficients in Table
36 are good predictors of the measured fluxes over their entire dynamic ranges and for
all sampled conditions
The diel variations of fluxes and residuals from this parameterization (Figure
319) reveal several interesting features The parameterization captures the overall diel
behavior of both NO and NO2 fluxes It also tends to underestimate the upward flux of
[NO2] during the day for northwesterly flow conditions and to slightly overestimate
during daytime southwesterly flows The disagreement rarely exceeds the 25th and 75th
quantiles of the measured fluxes The dominant flow regimes at Harvard Forest differ in
a number of key respects that may affect this result Northwesterly conditions tend to
bring lower concentrations of reactive nitrogen species cooler temperatures drier
weather and clearer skies than southwest winds [Moody et al 1998] It is possible that
one or more of these factors is contributing to the wind-sector difference in the residuals
One might expect that the residuals would depend on additional factors not taken
into consideration For example mixing and therefore deposition depends on the friction
velocity u (m s-1) As shown in figure 320 the residual NO2 flux tends upward only at
the highest u quantiles during the day and has no significant trend at night Similarly
the temperature-dependent rate for (R31) k1(T)[O3] has not been included yet we find
that the NO2 flux residuals exhibit no statistically significant trend with k1(T)[O3] (Figure
321) Although included as terms in the paratmeterization similar residual analyses are
shown for V(O3) during the day (Figure 321) and for [NO2] during the day and night
(Figure 322) The distinctly different daytime and nighttime behavior of the total NO2
flux is apparent again in Figure 322 as are the small residuals overall
88
Res
idua
l (M
es ndash
Para
m)
FN
O2
(nm
ol m
ol-1
cm s
-1)
Parameterized FNO2 (nmol mol-1 cm s-1)
Mea
sure
d FN
O2
(nm
ol m
ol-1
cm s
-1)
FNO2 = V0middot[NO2] + amiddot[NO2]2 + (b+f)middotPPFDmiddot[NO2] + ΓmiddotVd(O3)
Daytime +Nighttime
11
-20 -10 0 10 20 30
-20
-10
010
2030
Quantiles of Standard Normal
-2 0 2
-10
-50
510
Figure 317 Upper Measured vs parameterized NO2 flux shown with 11 line daytime
(+) and nighttime () The functional form the parameterization is shown at the top
Lower Residuals of FNO2 vs quantiles of the standard normal The residuals are
normally-distributed with extended upper and lower wings
89
-10 -8 -6 -4 -2 0 2
-10
-8-6
-4-2
02
Quantiles of Standard Normal
-2 0 2
-10
-05
00
05
10
15
Mea
sure
d FN
O (n
mol
mol
-1cm
s-1
)
Res
idua
l (M
es ndash
Para
m)
FN
O (n
mol
mol
-1cm
s-1)
Parameterized FNO (nmol mol-1 cm s-1)
FNO = V0_NOmiddot[NO] + b middotPPFDmiddot[NO]
11
Figure 318 Same as Figure 317 for FNO
90
Fl
ux (n
mol
mol
-1cm
s-1
)R
esid
ual (
nmol
mol
-1cm
s-1
)Measured FNO (h=22m)Measured FNO2 (h=22m)Parameterized FNOParameterized FNO2
Meas-Param FNOMeas-Param FNO2
-20
24
-20
24
NW
0 5 10 15 20
-2-1
01
2-2
-10
12
-20
24
-20
24
SW
0 5 10 15 20
-2-1
01
2-2
-10
12
Hour
Figure 319 Top panels Median diel measured (closed symbols solid lines) and
parameterized (open symbols dashed lines) fluxes of NO2 and NO Vertical bars show
the 25th and 75th quantiles for the measurements Lower panels Median diel residual
(measured-parameterized) FNO2 and FNO Northwest wind conditions are shown on the
left southwest on the right The parameterizations capture the daytime behavior of NO
flux due to the photochemical gradient and eddy diffusivity effects For NO2 under
northwesterly conditions the daytime residual is positive indicating that the
parameterization underestimates upward flux of NO2 For southwesterly conditions
daytime NO2 flux residuals are more variable and tend in the opposite direction
91
DAY NIGHT
FNO
2(n
mol
mol
-1cm
s-1
)R
esid
ual F
NO
2(n
mol
mol
-1cm
s-1
)
FNO
2(n
mol
mol
-1cm
s-1
)R
esid
ual F
NO
2(n
mol
mol
-1cm
s-1
)
Res
idua
l FN
O2
(nm
ol m
ol-1
cm s
-1)
Measured FNO2
Parameterized FNO2
Res
idua
l FN
O2
(nm
ol m
ol-1
cm s
-1)
u (m s-1) u (m s-1)
u (m s-1) u (m s-1)
-10
-50
510
00 05 10 15
-10
-50
510
-10
-50
510
00 05 10 15
-10
-50
510
00 02 04 06 08 10 12 14
-20
2
00 02 04 06 08 10 12 14
-20
2
Figure 320 From top to bottom measured and parameterized NO2 fluxes residuals
(measured-parameterized) and expanded-axes quantile-binned mean residuals (plusmn
standard deviation) vs u shown for daytime on the left and nighttime on the right
92
DAY k1(T)[O3] Day V(O3)
FNO
2(n
mol
mol
-1cm
s-1
)R
esid
ual F
NO
2(n
mol
mol
-1cm
s-1
)
FNO
2(n
mol
mol
-1cm
s-1
)R
esid
ual F
NO
2(n
mol
mol
-1cm
s-1
)
Res
idua
l FN
O2
(nm
ol m
ol-1
cm s
-1)
Measured FNO2
Parameterized FNO2
Res
idua
l FN
O2
(nm
ol m
ol-1
cm s
-1)
k1(T)[O3] (s-1) V(O3) (cm s-1)
k1(T)[O3] (s-1) V(O3) (cm s-1)
-10
010
2030
001 002 003 004
-10
-50
510
-10
010
2030
-003 -002 -001 00 001
-10
-50
510
0005 0010 0015 0020 0025 0030
-3-2
-10
12
-0015 -0010 -0005 00
-3-2
-10
12
Figure 321 Same as Figure 321 for daytime k1(T)[O3] (left) and daytime V(O3) (right)
93
DAY NIGHT
FNO
2(n
mol
mol
-1cm
s-1
)R
esid
ual F
NO
2(n
mol
mol
-1cm
s-1
)
FNO
2(n
mol
mol
-1cm
s-1
)R
esid
ual F
NO
2(n
mol
mol
-1cm
s-1
)
Res
idua
l FN
O2
(nm
ol m
ol-1
cm s
-1)
Measured FNO2
Parameterized FNO2
Res
idua
l FN
O2
(nm
ol m
ol-1
cm s
-1)
[NO2] (nmol mol-1) [NO2] (nmol mol-1)
[NO2] (nmol mol-1) [NO2] (nmol mol-1)
-10
010
2030
0 5 10 15 20
-10
-50
510
-20
-15
-10
-50
510
0 5 10 15 20
-10
-50
510
0 2 4 6 8
-3-2
-10
12
0 2 4 6 8 10 12
-20
24
Figure 322 Same as Figure 321 for [NO2] during the daytime (left) and nighttime
(right)
94
The lack of robust trends in the NO2 flux residuals indicates that within the
limitations of the dataset Eq 37 captures the crucial aspects of observed NO2 flux
behavior within and above the tall forest canopy under a wide range of conditions
Similarly Eq 38 accounts for 92 of the observed variance in the measured NO fluxes
under a somewhat narrower set of conditions (the sampling period for NO eddy
covariance flux measurements was relatively short) Figure 323 shows the resulting net
NOx flux (Eq 39 Table 36) and exchange velocity VNOx(net)=FNOx(net)[NO2] on a
diel basis for the sampling period April-November 2000 For the rural low-NOx
conditions at Harvard Forest we find that the flux of NOx is downward at all hours with
a deposition velocity of approximately 02 cm s-1
35 Conclusions
We installed a Tunable Diode Laser Absorption Spectrometer (TDLAS) to
measure continuous NO2 concentrations and eddy covariance fluxes above the canopy at
Harvard Forest during the spring summer and fall of 2000 An existing
chemiluminescence NO detector was configured to measure above-canopy eddy
covariance fluxes for a shorter period in the late summer and early fall A photolysis-
chemiluminescence (P-C) NO2 instrument also measured concentrations for a portion of
the sampling period Hourly average TDLAS and P-C NO2 concentrations agreed very
well under all conditions The agreement between the two instruments in the field and
the independent spectroscopic calibration of the TDLAS validated the long-term
measurements of the tank-calibrated P-C system
95
0 6 12 18
-10
-08
-06
-04
-02
00
-14
-12
-10
-08
-06
-04
-02
00
Net
FN
Ox
(nm
ol m
ol-1
cm s
-1)
(microm
ol m
-2hr
-1)
Net
VN
Ox
(cm
s-1
)
Hour
median| 25th amp 75th percentiles
0 6 12 18
-024
-022
-020
-018
Figure 323 Diel cycle of parameterized net NOx exchange velocity (upper panel) and
flux (lower panel) April-November 2000 FNOx(net) asymp FNO2(net) = V0middot[NO2] +
amiddot[NO2]2 + ΓmiddotVd(O3) VNOx(net) = FNO2(net)[NO2]
96
At night in the absence of significant quantities of NO we observed a consistent
downward flux of NO2 which depended quadratically on the concentration of NO2
although the dependence was apparent mainly on two nights when [NO2] was above 10
nmol mol-1 The nighttime NO2 deposition velocity varied between 02 cm s-1 at [NO2]=1
nmol mol-1 and 05 cm s-1 at [NO2]=30 nmol mol-1 These fluxes could come from direct
NO2 deposition to non-stomatal surfaces in the forest such as soil litter bark and the
outer surfaces of leaves area-normalized deposition velocities to such surfaces in
chamber measurements have varied from less than 01 to 05 cm s-1 for NO2
concentrations between 40 and 80 nmol mol-1 [Hanson and Lindberg 1991] The rate of
heterogeneous N2O5 hydrolysis resulting in aqueous-phase HNO3 (unlikely to re-enter the
gas phase) is insufficient to explain the observed nighttime NO2 deposition rates The
quadratic flux dependence and similarity to the behavior of HONO observed at other sites
suggests that heterogeneous NO2 hydrolysis may also play a significant role in NO2
deposition [Harrison and Kitto 1994 Harrison et al 1996 Barney and Finlayson-Pitts
2000] Half of any NO2 flux due to heterogeneous NO2 hydrolysis would likely escape
from the surfaces as gas-phase HONO potentially impacting the daytime HOx and NOx
budgets when photolyzed at sunrise
During the day we observed coupled fluxes of NO2 (upward) and NO
(downward) due to photochemical cycling driven by canopy-induced light and eddy
diffusivity gradients The imbalance in the observed fluxes corresponded to the
difference in height of the sampling levels relative to the canopy The exchange
velocities of the two species in their respective directions increased with higher above-
canopy light levels as measured by photosynthetic photon flux density (PPFD) due to the
97
stronger light gradient through the canopy under brighter conditions Upward NO2
velocity was smaller in early spring and late fall when there were no leaves on the trees
corresponding to a weaker light gradient condition (NO fluxes were only measured
during full-canopy conditions) and possibly to the absence of stomata-dependent
emission of NO2 We believe that these coupled fluxes are the first to be reported from a
mature tall-canopy site using reliable eddy-covariance appropriate sampling techniques
All of the NO and NO2 flux data day and night were well explained by a simple
parameterization consisting of two equations FNO2 = V0 middot [NO2] + amiddot[NO2]2 +
(b+f)middotPPFDmiddot[NO2] + ΓmiddotVd(O3) and FNO = V0_NO middot [NO] + bprime middot PPFD middot [NO] The net flux
of NOx is approximately equal to the flux of NO2 omitting the PPFD-dependent term
FNOxasympV0 middot [NO2] + amiddot[NO2]2 + ΓmiddotVd(O3) V0 and V0_NO are small constant deposition
velocity terms b and bprime are coefficients of light-dependent coupled fluxes for full-canopy
conditions and f adjusts the NO2 light-dependent term for no-leaves conditions The
deposition velocity of O3 was used as a proxy for stomatal exchange the coefficient Γ
was consistently positive Stomatal conductance correlates with a number of different
variables (light temperature humidity) complicating the interpretation of the final term
It may indicate a stomatal emission of NO2 under low-NOx conditions typical at Harvard
Forest but could also correspond to a chemical or other process which slows NO2
deposition during the day The quadratic term amiddot[NO2]2 was particularly significant at
night during a few high-[NO2] events Multi-factor regressions fitting the hourly data
with these equations yield R2 of 061 for FNO2 and 092 for FNO the coefficients
summarized in Table 36 agree with analyses of segregated daytime and nighttime data
We note that the coefficients are relevant to the specific measurement heights of NO (29
98
m) and NO2 (22 m) at Harvard Forest relative to the forest canopy height (20 m)
However the mechanism should be adaptable for more general application
During the measurement period net NO2 deposition velocity (omitting the PPFD-
dependent term associated with photochemical cycling of NOx) -(V0 + amiddot[NO2] +
ΓmiddotVd(O3)[NO2]) was between 015 and 03 cm s-1 The mean 02 cm s-1 varied by less
than 002 cm s-1 between day and night and between full-canopy and leafless conditions
NO2 deposition velocity measurements to deciduous forest canopies are scarce this result
falls just outside of the range of reported values for coniferous forests 01 to 15 cm s-1
[Hanson and Lindberg 1991 Rondoacuten et al 1993 Joss and Graber 1996] and short
crops such as alfalfa soy and oats 007 to 125 cm s-1 [Hanson and Lindberg 1991]
The only estimates of NO deposition velocity are over grass ~01 to 02 cm s-1 [Hanson
and Lindberg 1991] other observations indicate NO emission from various species
though soil emissions could confound these results [Wildt et al 1997] This is quite
close to the ~025 cm s-1 NO deposition velocity at Harvard Forest (-V0_NO) but we
cannot resolve the debate as to whether NO deposits at all [Wesely and Hicks 2000]
Concentration and flux measurements of HONO N2O5 and NO3 (along with NO
and NO2) are required to better understand the nighttime chemistry and deposition of
NOx Recently-developed continuous analyzers for HONO [Harrison et al 1996] and N-
2O5 and NO3 [Brown et al 2001] may make these measurements possible in the coming
years In addition the use of flux chambers with a TDLAS or other instrument (sub-
nmol mol-1 sensitivity and species-specific detection method) on leaf litter and soil
samples in the lab and field may facilitate direct detection of NO2 compensation points
for various species and quantify the importance of different natural surfaces
99
NOx deposition matters to both the ecosystem and the atmosphere the form of
nitrogen entering plants affects nutrient loading acid stress and toxicity and the form of
nitrogen leaving the atmosphere affects O3 production HOx chemistry and long-range
transport of anthropogenic pollutants We are hopeful that future research endeavors will
approach the problem from the perspective of both ecosystem and atmosphere at scales
ranging from the individual leaf to the vegetated landscape using reliable species-
specific and sensitive measurement techniques
References
Andreacutes-Hernaacutendez J Notholt J Hjorth and O Schrems A DOAS study on the origin of initrous acid at urban and non-urban sites Atmos Environ 30 175-180 1996
Aneja V P P A Roelle G C Murray J Southerland J W Erisman D Fowler W A H Asman and N Patni Atmospheric nitrogen compounds II emissions transport transformation deposition and assessment Atmos Environ 35 1903-1911 2001
Barford C E Hammond Pyle L Hutyra S Wofsy Ecological Measurements to compliment eddy-flux measurements at Harvard Forest [Online data archive] httpwww-asharvardedudatanigec-datahtml 2001
Barnet W S and B J Finlayson-Pitts Enhancement of N2O4 on porous glass at room temperature A key intermediate in the heterogeneous hydrolysis of NO2 J Phys Chem A 104 171-175 2000
Barney W S and B J Finlayson-Pitts Enhancement of N2O4 on Porous Glass at Room Temperature A Key Intermediate in the Heterogeneous Hydrolysis of NO2 J Phys Chem A 104 171-175 2000
Bey I D J Jacob R Yantosca J logan B Field A Fiore Q Li H Liu L Mickley M Schultz Global modeling of tropospheric chemistry with assimilated meteorology Model description and evaluation in press J Geophys Res 2001
Brown S H Stark S J Ciciora and A R Ravishankara In-situ measurement of atmospheric NO3 and N2O5 via cavity ring-down spectroscopy Geophys Res Lett 28 3237-3230 2001 (a)
100
Brown S H Stark S J Ciciora and A R Ravishankara In-situ Detection of Atmospheric NO3 and N2O5 via Cavity Ring-Down Spectroscopy EOS Trans AGU 82 Fall Meeting Suppl A41B-0045 2001 (b)
Coe H and M W Gallagher Measurements of dry deposition of NO2 to a Dutch heathland using the eddy-correlation technique Q J R Meteorol Soc118 767-786 1992
Delaney A C D R Fitzjarrald D H Lenschow R Pearson Jr G J Wendel B Woodruff Direct Measurements of Nitrogen Oxides and Ozone Fluxes over Grassland J Atmos Chem 4 429-444 1986
Eugster W and R Hesterberg Transfer resistances of NO2 determined from eddy correlation flux measurements over a litter meadow at a rural site on the Swiss plateau Atmos Environ 30 1247-1254 1996
Fitzjarrald D R and D H Lenschow Mean concentration and flux profiles for chemically reactive species in the atmospheric surface layer Atmos Environ 17 2505-2512 1983
Galmarini S P G Duynkerke J Vila-Guerau De Arellano Evolution of Nitrogen Oxide Chemistry in the Nocturnal Boundary Layer J Appl Meteorology 36 943-957 1997
Gao W M L Wesely P V Doskey Numerical Modeling of the Turbulent Diffusion and Chemistry of NOx O3 Isoprene and Other Reactive Trace Gases in and Above a Forest Canopy J Geophys Res 98 18339-18353 1993
Gao W and M L Wesely Numerical Modeling of the Turbulent Fluxes of Chemically Reactive Trace Gases in the Atmospheric Boundary Layer J Appl Meteorology 33 835-847 1994
Goodman A L G M Underwood and V H Grassian Heterogeneous Reaction of NO2 Characterization of Gas-Phase and Adsorbed Products from the Reaction 2NO2(g) + H2O(a) HONO(g) + HNO3(a) on Hydrated Silica Particles J Phys Chem A 103 7217-7223 1999
Goulden ML JW Munger S-M Fan B C Daube and S C Wofsy Measurements of carbon sequestration by long-term eddy covariance Methods and a critical evaluation of accuracy Global Change Biology 2 169-182 1996
Harrison R M A-M N Kitto Evidence for a surface source of atmospheric nitrous acid Atmos Environ 28 1089-1094 1994
Harrison R M J D Peak G M Collins Tropospheric cycle of nitrous acid J Geophys Res 101 14429-14439 1996
101
Heal M R B B B Booth J N Cape K J Hargreaves The influence of simplified peroxy radical chemistry on the interpretation of NO2-NO-O3 surface exchange Atmos Environ 35 1687-1696 2001
Horii C V M S Zahniser D D Nelson J B McManus S C Wofsy Nitric Acid and Nitrogen Dioxide Flux Measurements a New Application of Tunable Diode Laser Absorption Spectroscopy Proc of SPIE 3758 152-161 1999
Hosker R P Jr and S E Lindberg Review Atmospheric deposition and plant assimilation of gases and particles Atmos Environ 16 889-910 1982
Hanson P and S E Lindberg Dry deposition of reactive nitrogen compounds a review of leaf canopy and non-foliar measurements Atmos Environ 25A 1615-1634 1991
Jacob D J Heterogeneous chemistry and tropospheric ozone Atmos Environ 34 2131-2159 2000
Joss U and W K Graber Profiles and Simulated Exchange of H2O O3 NO2 Between the Atmosphere and the HartX Scots Pine Plantation Theor Appl Climatol 53 157-172 1996
Lefer B L and R W Talbot Nitric acid and ammonia at a rural northeaster US site J Geophys Res 104 1645-1661 1999
Lerdau M T J W Munger D J Jacob The NO2 Flux Conumdrum Science289 2291-2293 2000
Moody J L J W Munger A H Goldstein D J Jacob and S C Wofsy Harvard Forest regional-scale air mass composition by Patterns in Atmospheric Transport History (PATH) J Geophys Res 103 13181-13194 1998
Munger J W S C Wofsy P S Bakwin S-M Fan M L Goulden B C Daube and A H Goldstein Atmospheric deposition of reactive nitrogen oxides and ozone in a temperate deciduous forest and a subarctic woodland 1 Measurements and mechanisms J Geophys Res 101 12639-12657 1996
Munger J W S-M Fan P S Bakwin M L Goulden A H Goldstein A S Colman and S C Wofsy Regional budgets for nitrogen oxides from continental sources Variations of rates for oxidation and deposition with season and distance from source regions J Geophys Res 103 8355-8368 1998
Notholt J J Hjorth and F Raes Formation of HNO2 on aerosol surfaces during foggy periods in the presence of NO and NO2 Atmos Environ 26A 211-217 1992
Padro J Zhang L and W J Massman An analysis of measurements and modlling of air-surface exchange of NO-NO2-O3 over grass Atmos Environ 32 1365-1375 1998
102
103
Rondon A C Johansson L Granat Dry Deposition of Nitrogen Dioxide and Ozone to Coniferous Forests J Geophys Res 98 5159-5172 1993
Rothman LS et al The HITRAN molecular spectroscopic database and HAWKS (HITRAN Atmospheric Workstation) 1996 Edition J Quant Spectrosc Radiat Transfer 60 665-710 1998
Sparks J P R K Monson K L Sparks M Lerdau Leaf uptake of nitrogen dioxide (NO2) in a tropical wet forest implications for tropospheric chemistry Oecologia 127 214-221 2001
Stocker D W D H Stedman K F Zeller W J Massman D G Fox Fluxes of Nitrogen Oxides and Ozone Measured by Eddy Correlation Over a Shortgrass Prairie J Geophys Res 98 12619-12630 1993
Walton S M W Gallagher T W Choularton J Duyzer Ozone and NO2 Exchange to Fruit Orchards Atmos Environ 31 2767-2776 1997
Wesely M L J A Eastman D H Stedman E D Yalvac An eddy-correlation measurement of NO2 flux to vegetation and comparison to O3 flux Atmos Environ 16 815-820 1982
Wesely M L Parameterization of surface resistances to gaseous dry deposition in regional-scale numerical models Atmos Environ 23 1293-1304 1989
Wesley M L and B B Hicks A review of the current status of knowledge on dry deposition Atmos Environ 34 2261-2282 2000
Wildt J D Kley A Rockel P Rockel H J Schneider Emission of NO from several higher plant species J Geophys Res 102 5919-5927 1997
- April ndash November 2000
- G (nmol mol-1)
- 29 August ndash 8 Oct 2000
- References
- Chapter3_NOx_Part2pdf
-
- 34 Discussion
-
- Chapter3_NOx_Part1pdf
-
- 32 Methods
- 33 Results
-

Res
idua
l (M
es ndash
Para
m)
FN
O2
(nm
ol m
ol-1
cm s
-1)
Parameterized FNO2 (nmol mol-1 cm s-1)
Mea
sure
d FN
O2
(nm
ol m
ol-1
cm s
-1)
FNO2 = V0middot[NO2] + amiddot[NO2]2 + (b+f)middotPPFDmiddot[NO2] + ΓmiddotVd(O3)
Daytime +Nighttime
11
-20 -10 0 10 20 30
-20
-10
010
2030
Quantiles of Standard Normal
-2 0 2
-10
-50
510
Figure 317 Upper Measured vs parameterized NO2 flux shown with 11 line daytime
(+) and nighttime () The functional form the parameterization is shown at the top
Lower Residuals of FNO2 vs quantiles of the standard normal The residuals are
normally-distributed with extended upper and lower wings
89
-10 -8 -6 -4 -2 0 2
-10
-8-6
-4-2
02
Quantiles of Standard Normal
-2 0 2
-10
-05
00
05
10
15
Mea
sure
d FN
O (n
mol
mol
-1cm
s-1
)
Res
idua
l (M
es ndash
Para
m)
FN
O (n
mol
mol
-1cm
s-1)
Parameterized FNO (nmol mol-1 cm s-1)
FNO = V0_NOmiddot[NO] + b middotPPFDmiddot[NO]
11
Figure 318 Same as Figure 317 for FNO
90
Fl
ux (n
mol
mol
-1cm
s-1
)R
esid
ual (
nmol
mol
-1cm
s-1
)Measured FNO (h=22m)Measured FNO2 (h=22m)Parameterized FNOParameterized FNO2
Meas-Param FNOMeas-Param FNO2
-20
24
-20
24
NW
0 5 10 15 20
-2-1
01
2-2
-10
12
-20
24
-20
24
SW
0 5 10 15 20
-2-1
01
2-2
-10
12
Hour
Figure 319 Top panels Median diel measured (closed symbols solid lines) and
parameterized (open symbols dashed lines) fluxes of NO2 and NO Vertical bars show
the 25th and 75th quantiles for the measurements Lower panels Median diel residual
(measured-parameterized) FNO2 and FNO Northwest wind conditions are shown on the
left southwest on the right The parameterizations capture the daytime behavior of NO
flux due to the photochemical gradient and eddy diffusivity effects For NO2 under
northwesterly conditions the daytime residual is positive indicating that the
parameterization underestimates upward flux of NO2 For southwesterly conditions
daytime NO2 flux residuals are more variable and tend in the opposite direction
91
DAY NIGHT
FNO
2(n
mol
mol
-1cm
s-1
)R
esid
ual F
NO
2(n
mol
mol
-1cm
s-1
)
FNO
2(n
mol
mol
-1cm
s-1
)R
esid
ual F
NO
2(n
mol
mol
-1cm
s-1
)
Res
idua
l FN
O2
(nm
ol m
ol-1
cm s
-1)
Measured FNO2
Parameterized FNO2
Res
idua
l FN
O2
(nm
ol m
ol-1
cm s
-1)
u (m s-1) u (m s-1)
u (m s-1) u (m s-1)
-10
-50
510
00 05 10 15
-10
-50
510
-10
-50
510
00 05 10 15
-10
-50
510
00 02 04 06 08 10 12 14
-20
2
00 02 04 06 08 10 12 14
-20
2
Figure 320 From top to bottom measured and parameterized NO2 fluxes residuals
(measured-parameterized) and expanded-axes quantile-binned mean residuals (plusmn
standard deviation) vs u shown for daytime on the left and nighttime on the right
92
DAY k1(T)[O3] Day V(O3)
FNO
2(n
mol
mol
-1cm
s-1
)R
esid
ual F
NO
2(n
mol
mol
-1cm
s-1
)
FNO
2(n
mol
mol
-1cm
s-1
)R
esid
ual F
NO
2(n
mol
mol
-1cm
s-1
)
Res
idua
l FN
O2
(nm
ol m
ol-1
cm s
-1)
Measured FNO2
Parameterized FNO2
Res
idua
l FN
O2
(nm
ol m
ol-1
cm s
-1)
k1(T)[O3] (s-1) V(O3) (cm s-1)
k1(T)[O3] (s-1) V(O3) (cm s-1)
-10
010
2030
001 002 003 004
-10
-50
510
-10
010
2030
-003 -002 -001 00 001
-10
-50
510
0005 0010 0015 0020 0025 0030
-3-2
-10
12
-0015 -0010 -0005 00
-3-2
-10
12
Figure 321 Same as Figure 321 for daytime k1(T)[O3] (left) and daytime V(O3) (right)
93
DAY NIGHT
FNO
2(n
mol
mol
-1cm
s-1
)R
esid
ual F
NO
2(n
mol
mol
-1cm
s-1
)
FNO
2(n
mol
mol
-1cm
s-1
)R
esid
ual F
NO
2(n
mol
mol
-1cm
s-1
)
Res
idua
l FN
O2
(nm
ol m
ol-1
cm s
-1)
Measured FNO2
Parameterized FNO2
Res
idua
l FN
O2
(nm
ol m
ol-1
cm s
-1)
[NO2] (nmol mol-1) [NO2] (nmol mol-1)
[NO2] (nmol mol-1) [NO2] (nmol mol-1)
-10
010
2030
0 5 10 15 20
-10
-50
510
-20
-15
-10
-50
510
0 5 10 15 20
-10
-50
510
0 2 4 6 8
-3-2
-10
12
0 2 4 6 8 10 12
-20
24
Figure 322 Same as Figure 321 for [NO2] during the daytime (left) and nighttime
(right)
94
The lack of robust trends in the NO2 flux residuals indicates that within the
limitations of the dataset Eq 37 captures the crucial aspects of observed NO2 flux
behavior within and above the tall forest canopy under a wide range of conditions
Similarly Eq 38 accounts for 92 of the observed variance in the measured NO fluxes
under a somewhat narrower set of conditions (the sampling period for NO eddy
covariance flux measurements was relatively short) Figure 323 shows the resulting net
NOx flux (Eq 39 Table 36) and exchange velocity VNOx(net)=FNOx(net)[NO2] on a
diel basis for the sampling period April-November 2000 For the rural low-NOx
conditions at Harvard Forest we find that the flux of NOx is downward at all hours with
a deposition velocity of approximately 02 cm s-1
35 Conclusions
We installed a Tunable Diode Laser Absorption Spectrometer (TDLAS) to
measure continuous NO2 concentrations and eddy covariance fluxes above the canopy at
Harvard Forest during the spring summer and fall of 2000 An existing
chemiluminescence NO detector was configured to measure above-canopy eddy
covariance fluxes for a shorter period in the late summer and early fall A photolysis-
chemiluminescence (P-C) NO2 instrument also measured concentrations for a portion of
the sampling period Hourly average TDLAS and P-C NO2 concentrations agreed very
well under all conditions The agreement between the two instruments in the field and
the independent spectroscopic calibration of the TDLAS validated the long-term
measurements of the tank-calibrated P-C system
95
0 6 12 18
-10
-08
-06
-04
-02
00
-14
-12
-10
-08
-06
-04
-02
00
Net
FN
Ox
(nm
ol m
ol-1
cm s
-1)
(microm
ol m
-2hr
-1)
Net
VN
Ox
(cm
s-1
)
Hour
median| 25th amp 75th percentiles
0 6 12 18
-024
-022
-020
-018
Figure 323 Diel cycle of parameterized net NOx exchange velocity (upper panel) and
flux (lower panel) April-November 2000 FNOx(net) asymp FNO2(net) = V0middot[NO2] +
amiddot[NO2]2 + ΓmiddotVd(O3) VNOx(net) = FNO2(net)[NO2]
96
At night in the absence of significant quantities of NO we observed a consistent
downward flux of NO2 which depended quadratically on the concentration of NO2
although the dependence was apparent mainly on two nights when [NO2] was above 10
nmol mol-1 The nighttime NO2 deposition velocity varied between 02 cm s-1 at [NO2]=1
nmol mol-1 and 05 cm s-1 at [NO2]=30 nmol mol-1 These fluxes could come from direct
NO2 deposition to non-stomatal surfaces in the forest such as soil litter bark and the
outer surfaces of leaves area-normalized deposition velocities to such surfaces in
chamber measurements have varied from less than 01 to 05 cm s-1 for NO2
concentrations between 40 and 80 nmol mol-1 [Hanson and Lindberg 1991] The rate of
heterogeneous N2O5 hydrolysis resulting in aqueous-phase HNO3 (unlikely to re-enter the
gas phase) is insufficient to explain the observed nighttime NO2 deposition rates The
quadratic flux dependence and similarity to the behavior of HONO observed at other sites
suggests that heterogeneous NO2 hydrolysis may also play a significant role in NO2
deposition [Harrison and Kitto 1994 Harrison et al 1996 Barney and Finlayson-Pitts
2000] Half of any NO2 flux due to heterogeneous NO2 hydrolysis would likely escape
from the surfaces as gas-phase HONO potentially impacting the daytime HOx and NOx
budgets when photolyzed at sunrise
During the day we observed coupled fluxes of NO2 (upward) and NO
(downward) due to photochemical cycling driven by canopy-induced light and eddy
diffusivity gradients The imbalance in the observed fluxes corresponded to the
difference in height of the sampling levels relative to the canopy The exchange
velocities of the two species in their respective directions increased with higher above-
canopy light levels as measured by photosynthetic photon flux density (PPFD) due to the
97
stronger light gradient through the canopy under brighter conditions Upward NO2
velocity was smaller in early spring and late fall when there were no leaves on the trees
corresponding to a weaker light gradient condition (NO fluxes were only measured
during full-canopy conditions) and possibly to the absence of stomata-dependent
emission of NO2 We believe that these coupled fluxes are the first to be reported from a
mature tall-canopy site using reliable eddy-covariance appropriate sampling techniques
All of the NO and NO2 flux data day and night were well explained by a simple
parameterization consisting of two equations FNO2 = V0 middot [NO2] + amiddot[NO2]2 +
(b+f)middotPPFDmiddot[NO2] + ΓmiddotVd(O3) and FNO = V0_NO middot [NO] + bprime middot PPFD middot [NO] The net flux
of NOx is approximately equal to the flux of NO2 omitting the PPFD-dependent term
FNOxasympV0 middot [NO2] + amiddot[NO2]2 + ΓmiddotVd(O3) V0 and V0_NO are small constant deposition
velocity terms b and bprime are coefficients of light-dependent coupled fluxes for full-canopy
conditions and f adjusts the NO2 light-dependent term for no-leaves conditions The
deposition velocity of O3 was used as a proxy for stomatal exchange the coefficient Γ
was consistently positive Stomatal conductance correlates with a number of different
variables (light temperature humidity) complicating the interpretation of the final term
It may indicate a stomatal emission of NO2 under low-NOx conditions typical at Harvard
Forest but could also correspond to a chemical or other process which slows NO2
deposition during the day The quadratic term amiddot[NO2]2 was particularly significant at
night during a few high-[NO2] events Multi-factor regressions fitting the hourly data
with these equations yield R2 of 061 for FNO2 and 092 for FNO the coefficients
summarized in Table 36 agree with analyses of segregated daytime and nighttime data
We note that the coefficients are relevant to the specific measurement heights of NO (29
98
m) and NO2 (22 m) at Harvard Forest relative to the forest canopy height (20 m)
However the mechanism should be adaptable for more general application
During the measurement period net NO2 deposition velocity (omitting the PPFD-
dependent term associated with photochemical cycling of NOx) -(V0 + amiddot[NO2] +
ΓmiddotVd(O3)[NO2]) was between 015 and 03 cm s-1 The mean 02 cm s-1 varied by less
than 002 cm s-1 between day and night and between full-canopy and leafless conditions
NO2 deposition velocity measurements to deciduous forest canopies are scarce this result
falls just outside of the range of reported values for coniferous forests 01 to 15 cm s-1
[Hanson and Lindberg 1991 Rondoacuten et al 1993 Joss and Graber 1996] and short
crops such as alfalfa soy and oats 007 to 125 cm s-1 [Hanson and Lindberg 1991]
The only estimates of NO deposition velocity are over grass ~01 to 02 cm s-1 [Hanson
and Lindberg 1991] other observations indicate NO emission from various species
though soil emissions could confound these results [Wildt et al 1997] This is quite
close to the ~025 cm s-1 NO deposition velocity at Harvard Forest (-V0_NO) but we
cannot resolve the debate as to whether NO deposits at all [Wesely and Hicks 2000]
Concentration and flux measurements of HONO N2O5 and NO3 (along with NO
and NO2) are required to better understand the nighttime chemistry and deposition of
NOx Recently-developed continuous analyzers for HONO [Harrison et al 1996] and N-
2O5 and NO3 [Brown et al 2001] may make these measurements possible in the coming
years In addition the use of flux chambers with a TDLAS or other instrument (sub-
nmol mol-1 sensitivity and species-specific detection method) on leaf litter and soil
samples in the lab and field may facilitate direct detection of NO2 compensation points
for various species and quantify the importance of different natural surfaces
99
NOx deposition matters to both the ecosystem and the atmosphere the form of
nitrogen entering plants affects nutrient loading acid stress and toxicity and the form of
nitrogen leaving the atmosphere affects O3 production HOx chemistry and long-range
transport of anthropogenic pollutants We are hopeful that future research endeavors will
approach the problem from the perspective of both ecosystem and atmosphere at scales
ranging from the individual leaf to the vegetated landscape using reliable species-
specific and sensitive measurement techniques
References
Andreacutes-Hernaacutendez J Notholt J Hjorth and O Schrems A DOAS study on the origin of initrous acid at urban and non-urban sites Atmos Environ 30 175-180 1996
Aneja V P P A Roelle G C Murray J Southerland J W Erisman D Fowler W A H Asman and N Patni Atmospheric nitrogen compounds II emissions transport transformation deposition and assessment Atmos Environ 35 1903-1911 2001
Barford C E Hammond Pyle L Hutyra S Wofsy Ecological Measurements to compliment eddy-flux measurements at Harvard Forest [Online data archive] httpwww-asharvardedudatanigec-datahtml 2001
Barnet W S and B J Finlayson-Pitts Enhancement of N2O4 on porous glass at room temperature A key intermediate in the heterogeneous hydrolysis of NO2 J Phys Chem A 104 171-175 2000
Barney W S and B J Finlayson-Pitts Enhancement of N2O4 on Porous Glass at Room Temperature A Key Intermediate in the Heterogeneous Hydrolysis of NO2 J Phys Chem A 104 171-175 2000
Bey I D J Jacob R Yantosca J logan B Field A Fiore Q Li H Liu L Mickley M Schultz Global modeling of tropospheric chemistry with assimilated meteorology Model description and evaluation in press J Geophys Res 2001
Brown S H Stark S J Ciciora and A R Ravishankara In-situ measurement of atmospheric NO3 and N2O5 via cavity ring-down spectroscopy Geophys Res Lett 28 3237-3230 2001 (a)
100
Brown S H Stark S J Ciciora and A R Ravishankara In-situ Detection of Atmospheric NO3 and N2O5 via Cavity Ring-Down Spectroscopy EOS Trans AGU 82 Fall Meeting Suppl A41B-0045 2001 (b)
Coe H and M W Gallagher Measurements of dry deposition of NO2 to a Dutch heathland using the eddy-correlation technique Q J R Meteorol Soc118 767-786 1992
Delaney A C D R Fitzjarrald D H Lenschow R Pearson Jr G J Wendel B Woodruff Direct Measurements of Nitrogen Oxides and Ozone Fluxes over Grassland J Atmos Chem 4 429-444 1986
Eugster W and R Hesterberg Transfer resistances of NO2 determined from eddy correlation flux measurements over a litter meadow at a rural site on the Swiss plateau Atmos Environ 30 1247-1254 1996
Fitzjarrald D R and D H Lenschow Mean concentration and flux profiles for chemically reactive species in the atmospheric surface layer Atmos Environ 17 2505-2512 1983
Galmarini S P G Duynkerke J Vila-Guerau De Arellano Evolution of Nitrogen Oxide Chemistry in the Nocturnal Boundary Layer J Appl Meteorology 36 943-957 1997
Gao W M L Wesely P V Doskey Numerical Modeling of the Turbulent Diffusion and Chemistry of NOx O3 Isoprene and Other Reactive Trace Gases in and Above a Forest Canopy J Geophys Res 98 18339-18353 1993
Gao W and M L Wesely Numerical Modeling of the Turbulent Fluxes of Chemically Reactive Trace Gases in the Atmospheric Boundary Layer J Appl Meteorology 33 835-847 1994
Goodman A L G M Underwood and V H Grassian Heterogeneous Reaction of NO2 Characterization of Gas-Phase and Adsorbed Products from the Reaction 2NO2(g) + H2O(a) HONO(g) + HNO3(a) on Hydrated Silica Particles J Phys Chem A 103 7217-7223 1999
Goulden ML JW Munger S-M Fan B C Daube and S C Wofsy Measurements of carbon sequestration by long-term eddy covariance Methods and a critical evaluation of accuracy Global Change Biology 2 169-182 1996
Harrison R M A-M N Kitto Evidence for a surface source of atmospheric nitrous acid Atmos Environ 28 1089-1094 1994
Harrison R M J D Peak G M Collins Tropospheric cycle of nitrous acid J Geophys Res 101 14429-14439 1996
101
Heal M R B B B Booth J N Cape K J Hargreaves The influence of simplified peroxy radical chemistry on the interpretation of NO2-NO-O3 surface exchange Atmos Environ 35 1687-1696 2001
Horii C V M S Zahniser D D Nelson J B McManus S C Wofsy Nitric Acid and Nitrogen Dioxide Flux Measurements a New Application of Tunable Diode Laser Absorption Spectroscopy Proc of SPIE 3758 152-161 1999
Hosker R P Jr and S E Lindberg Review Atmospheric deposition and plant assimilation of gases and particles Atmos Environ 16 889-910 1982
Hanson P and S E Lindberg Dry deposition of reactive nitrogen compounds a review of leaf canopy and non-foliar measurements Atmos Environ 25A 1615-1634 1991
Jacob D J Heterogeneous chemistry and tropospheric ozone Atmos Environ 34 2131-2159 2000
Joss U and W K Graber Profiles and Simulated Exchange of H2O O3 NO2 Between the Atmosphere and the HartX Scots Pine Plantation Theor Appl Climatol 53 157-172 1996
Lefer B L and R W Talbot Nitric acid and ammonia at a rural northeaster US site J Geophys Res 104 1645-1661 1999
Lerdau M T J W Munger D J Jacob The NO2 Flux Conumdrum Science289 2291-2293 2000
Moody J L J W Munger A H Goldstein D J Jacob and S C Wofsy Harvard Forest regional-scale air mass composition by Patterns in Atmospheric Transport History (PATH) J Geophys Res 103 13181-13194 1998
Munger J W S C Wofsy P S Bakwin S-M Fan M L Goulden B C Daube and A H Goldstein Atmospheric deposition of reactive nitrogen oxides and ozone in a temperate deciduous forest and a subarctic woodland 1 Measurements and mechanisms J Geophys Res 101 12639-12657 1996
Munger J W S-M Fan P S Bakwin M L Goulden A H Goldstein A S Colman and S C Wofsy Regional budgets for nitrogen oxides from continental sources Variations of rates for oxidation and deposition with season and distance from source regions J Geophys Res 103 8355-8368 1998
Notholt J J Hjorth and F Raes Formation of HNO2 on aerosol surfaces during foggy periods in the presence of NO and NO2 Atmos Environ 26A 211-217 1992
Padro J Zhang L and W J Massman An analysis of measurements and modlling of air-surface exchange of NO-NO2-O3 over grass Atmos Environ 32 1365-1375 1998
102
103
Rondon A C Johansson L Granat Dry Deposition of Nitrogen Dioxide and Ozone to Coniferous Forests J Geophys Res 98 5159-5172 1993
Rothman LS et al The HITRAN molecular spectroscopic database and HAWKS (HITRAN Atmospheric Workstation) 1996 Edition J Quant Spectrosc Radiat Transfer 60 665-710 1998
Sparks J P R K Monson K L Sparks M Lerdau Leaf uptake of nitrogen dioxide (NO2) in a tropical wet forest implications for tropospheric chemistry Oecologia 127 214-221 2001
Stocker D W D H Stedman K F Zeller W J Massman D G Fox Fluxes of Nitrogen Oxides and Ozone Measured by Eddy Correlation Over a Shortgrass Prairie J Geophys Res 98 12619-12630 1993
Walton S M W Gallagher T W Choularton J Duyzer Ozone and NO2 Exchange to Fruit Orchards Atmos Environ 31 2767-2776 1997
Wesely M L J A Eastman D H Stedman E D Yalvac An eddy-correlation measurement of NO2 flux to vegetation and comparison to O3 flux Atmos Environ 16 815-820 1982
Wesely M L Parameterization of surface resistances to gaseous dry deposition in regional-scale numerical models Atmos Environ 23 1293-1304 1989
Wesley M L and B B Hicks A review of the current status of knowledge on dry deposition Atmos Environ 34 2261-2282 2000
Wildt J D Kley A Rockel P Rockel H J Schneider Emission of NO from several higher plant species J Geophys Res 102 5919-5927 1997
- April ndash November 2000
- G (nmol mol-1)
- 29 August ndash 8 Oct 2000
- References
- Chapter3_NOx_Part2pdf
-
- 34 Discussion
-
- Chapter3_NOx_Part1pdf
-
- 32 Methods
- 33 Results
-

DAY NIGHT
FNO
2(n
mol
mol
-1cm
s-1
)R
esid
ual F
NO
2(n
mol
mol
-1cm
s-1
)
FNO
2(n
mol
mol
-1cm
s-1
)R
esid
ual F
NO
2(n
mol
mol
-1cm
s-1
)
Res
idua
l FN
O2
(nm
ol m
ol-1
cm s
-1)
Measured FNO2
Parameterized FNO2
Res
idua
l FN
O2
(nm
ol m
ol-1
cm s
-1)
u (m s-1) u (m s-1)
u (m s-1) u (m s-1)
-10
-50
510
00 05 10 15
-10
-50
510
-10
-50
510
00 05 10 15
-10
-50
510
00 02 04 06 08 10 12 14
-20
2
00 02 04 06 08 10 12 14
-20
2
Figure 320 From top to bottom measured and parameterized NO2 fluxes residuals
(measured-parameterized) and expanded-axes quantile-binned mean residuals (plusmn
standard deviation) vs u shown for daytime on the left and nighttime on the right
92
DAY k1(T)[O3] Day V(O3)
FNO
2(n
mol
mol
-1cm
s-1
)R
esid
ual F
NO
2(n
mol
mol
-1cm
s-1
)
FNO
2(n
mol
mol
-1cm
s-1
)R
esid
ual F
NO
2(n
mol
mol
-1cm
s-1
)
Res
idua
l FN
O2
(nm
ol m
ol-1
cm s
-1)
Measured FNO2
Parameterized FNO2
Res
idua
l FN
O2
(nm
ol m
ol-1
cm s
-1)
k1(T)[O3] (s-1) V(O3) (cm s-1)
k1(T)[O3] (s-1) V(O3) (cm s-1)
-10
010
2030
001 002 003 004
-10
-50
510
-10
010
2030
-003 -002 -001 00 001
-10
-50
510
0005 0010 0015 0020 0025 0030
-3-2
-10
12
-0015 -0010 -0005 00
-3-2
-10
12
Figure 321 Same as Figure 321 for daytime k1(T)[O3] (left) and daytime V(O3) (right)
93
DAY NIGHT
FNO
2(n
mol
mol
-1cm
s-1
)R
esid
ual F
NO
2(n
mol
mol
-1cm
s-1
)
FNO
2(n
mol
mol
-1cm
s-1
)R
esid
ual F
NO
2(n
mol
mol
-1cm
s-1
)
Res
idua
l FN
O2
(nm
ol m
ol-1
cm s
-1)
Measured FNO2
Parameterized FNO2
Res
idua
l FN
O2
(nm
ol m
ol-1
cm s
-1)
[NO2] (nmol mol-1) [NO2] (nmol mol-1)
[NO2] (nmol mol-1) [NO2] (nmol mol-1)
-10
010
2030
0 5 10 15 20
-10
-50
510
-20
-15
-10
-50
510
0 5 10 15 20
-10
-50
510
0 2 4 6 8
-3-2
-10
12
0 2 4 6 8 10 12
-20
24
Figure 322 Same as Figure 321 for [NO2] during the daytime (left) and nighttime
(right)
94
The lack of robust trends in the NO2 flux residuals indicates that within the
limitations of the dataset Eq 37 captures the crucial aspects of observed NO2 flux
behavior within and above the tall forest canopy under a wide range of conditions
Similarly Eq 38 accounts for 92 of the observed variance in the measured NO fluxes
under a somewhat narrower set of conditions (the sampling period for NO eddy
covariance flux measurements was relatively short) Figure 323 shows the resulting net
NOx flux (Eq 39 Table 36) and exchange velocity VNOx(net)=FNOx(net)[NO2] on a
diel basis for the sampling period April-November 2000 For the rural low-NOx
conditions at Harvard Forest we find that the flux of NOx is downward at all hours with
a deposition velocity of approximately 02 cm s-1
35 Conclusions
We installed a Tunable Diode Laser Absorption Spectrometer (TDLAS) to
measure continuous NO2 concentrations and eddy covariance fluxes above the canopy at
Harvard Forest during the spring summer and fall of 2000 An existing
chemiluminescence NO detector was configured to measure above-canopy eddy
covariance fluxes for a shorter period in the late summer and early fall A photolysis-
chemiluminescence (P-C) NO2 instrument also measured concentrations for a portion of
the sampling period Hourly average TDLAS and P-C NO2 concentrations agreed very
well under all conditions The agreement between the two instruments in the field and
the independent spectroscopic calibration of the TDLAS validated the long-term
measurements of the tank-calibrated P-C system
95
0 6 12 18
-10
-08
-06
-04
-02
00
-14
-12
-10
-08
-06
-04
-02
00
Net
FN
Ox
(nm
ol m
ol-1
cm s
-1)
(microm
ol m
-2hr
-1)
Net
VN
Ox
(cm
s-1
)
Hour
median| 25th amp 75th percentiles
0 6 12 18
-024
-022
-020
-018
Figure 323 Diel cycle of parameterized net NOx exchange velocity (upper panel) and
flux (lower panel) April-November 2000 FNOx(net) asymp FNO2(net) = V0middot[NO2] +
amiddot[NO2]2 + ΓmiddotVd(O3) VNOx(net) = FNO2(net)[NO2]
96
At night in the absence of significant quantities of NO we observed a consistent
downward flux of NO2 which depended quadratically on the concentration of NO2
although the dependence was apparent mainly on two nights when [NO2] was above 10
nmol mol-1 The nighttime NO2 deposition velocity varied between 02 cm s-1 at [NO2]=1
nmol mol-1 and 05 cm s-1 at [NO2]=30 nmol mol-1 These fluxes could come from direct
NO2 deposition to non-stomatal surfaces in the forest such as soil litter bark and the
outer surfaces of leaves area-normalized deposition velocities to such surfaces in
chamber measurements have varied from less than 01 to 05 cm s-1 for NO2
concentrations between 40 and 80 nmol mol-1 [Hanson and Lindberg 1991] The rate of
heterogeneous N2O5 hydrolysis resulting in aqueous-phase HNO3 (unlikely to re-enter the
gas phase) is insufficient to explain the observed nighttime NO2 deposition rates The
quadratic flux dependence and similarity to the behavior of HONO observed at other sites
suggests that heterogeneous NO2 hydrolysis may also play a significant role in NO2
deposition [Harrison and Kitto 1994 Harrison et al 1996 Barney and Finlayson-Pitts
2000] Half of any NO2 flux due to heterogeneous NO2 hydrolysis would likely escape
from the surfaces as gas-phase HONO potentially impacting the daytime HOx and NOx
budgets when photolyzed at sunrise
During the day we observed coupled fluxes of NO2 (upward) and NO
(downward) due to photochemical cycling driven by canopy-induced light and eddy
diffusivity gradients The imbalance in the observed fluxes corresponded to the
difference in height of the sampling levels relative to the canopy The exchange
velocities of the two species in their respective directions increased with higher above-
canopy light levels as measured by photosynthetic photon flux density (PPFD) due to the
97
stronger light gradient through the canopy under brighter conditions Upward NO2
velocity was smaller in early spring and late fall when there were no leaves on the trees
corresponding to a weaker light gradient condition (NO fluxes were only measured
during full-canopy conditions) and possibly to the absence of stomata-dependent
emission of NO2 We believe that these coupled fluxes are the first to be reported from a
mature tall-canopy site using reliable eddy-covariance appropriate sampling techniques
All of the NO and NO2 flux data day and night were well explained by a simple
parameterization consisting of two equations FNO2 = V0 middot [NO2] + amiddot[NO2]2 +
(b+f)middotPPFDmiddot[NO2] + ΓmiddotVd(O3) and FNO = V0_NO middot [NO] + bprime middot PPFD middot [NO] The net flux
of NOx is approximately equal to the flux of NO2 omitting the PPFD-dependent term
FNOxasympV0 middot [NO2] + amiddot[NO2]2 + ΓmiddotVd(O3) V0 and V0_NO are small constant deposition
velocity terms b and bprime are coefficients of light-dependent coupled fluxes for full-canopy
conditions and f adjusts the NO2 light-dependent term for no-leaves conditions The
deposition velocity of O3 was used as a proxy for stomatal exchange the coefficient Γ
was consistently positive Stomatal conductance correlates with a number of different
variables (light temperature humidity) complicating the interpretation of the final term
It may indicate a stomatal emission of NO2 under low-NOx conditions typical at Harvard
Forest but could also correspond to a chemical or other process which slows NO2
deposition during the day The quadratic term amiddot[NO2]2 was particularly significant at
night during a few high-[NO2] events Multi-factor regressions fitting the hourly data
with these equations yield R2 of 061 for FNO2 and 092 for FNO the coefficients
summarized in Table 36 agree with analyses of segregated daytime and nighttime data
We note that the coefficients are relevant to the specific measurement heights of NO (29
98
m) and NO2 (22 m) at Harvard Forest relative to the forest canopy height (20 m)
However the mechanism should be adaptable for more general application
During the measurement period net NO2 deposition velocity (omitting the PPFD-
dependent term associated with photochemical cycling of NOx) -(V0 + amiddot[NO2] +
ΓmiddotVd(O3)[NO2]) was between 015 and 03 cm s-1 The mean 02 cm s-1 varied by less
than 002 cm s-1 between day and night and between full-canopy and leafless conditions
NO2 deposition velocity measurements to deciduous forest canopies are scarce this result
falls just outside of the range of reported values for coniferous forests 01 to 15 cm s-1
[Hanson and Lindberg 1991 Rondoacuten et al 1993 Joss and Graber 1996] and short
crops such as alfalfa soy and oats 007 to 125 cm s-1 [Hanson and Lindberg 1991]
The only estimates of NO deposition velocity are over grass ~01 to 02 cm s-1 [Hanson
and Lindberg 1991] other observations indicate NO emission from various species
though soil emissions could confound these results [Wildt et al 1997] This is quite
close to the ~025 cm s-1 NO deposition velocity at Harvard Forest (-V0_NO) but we
cannot resolve the debate as to whether NO deposits at all [Wesely and Hicks 2000]
Concentration and flux measurements of HONO N2O5 and NO3 (along with NO
and NO2) are required to better understand the nighttime chemistry and deposition of
NOx Recently-developed continuous analyzers for HONO [Harrison et al 1996] and N-
2O5 and NO3 [Brown et al 2001] may make these measurements possible in the coming
years In addition the use of flux chambers with a TDLAS or other instrument (sub-
nmol mol-1 sensitivity and species-specific detection method) on leaf litter and soil
samples in the lab and field may facilitate direct detection of NO2 compensation points
for various species and quantify the importance of different natural surfaces
99
NOx deposition matters to both the ecosystem and the atmosphere the form of
nitrogen entering plants affects nutrient loading acid stress and toxicity and the form of
nitrogen leaving the atmosphere affects O3 production HOx chemistry and long-range
transport of anthropogenic pollutants We are hopeful that future research endeavors will
approach the problem from the perspective of both ecosystem and atmosphere at scales
ranging from the individual leaf to the vegetated landscape using reliable species-
specific and sensitive measurement techniques
References
Andreacutes-Hernaacutendez J Notholt J Hjorth and O Schrems A DOAS study on the origin of initrous acid at urban and non-urban sites Atmos Environ 30 175-180 1996
Aneja V P P A Roelle G C Murray J Southerland J W Erisman D Fowler W A H Asman and N Patni Atmospheric nitrogen compounds II emissions transport transformation deposition and assessment Atmos Environ 35 1903-1911 2001
Barford C E Hammond Pyle L Hutyra S Wofsy Ecological Measurements to compliment eddy-flux measurements at Harvard Forest [Online data archive] httpwww-asharvardedudatanigec-datahtml 2001
Barnet W S and B J Finlayson-Pitts Enhancement of N2O4 on porous glass at room temperature A key intermediate in the heterogeneous hydrolysis of NO2 J Phys Chem A 104 171-175 2000
Barney W S and B J Finlayson-Pitts Enhancement of N2O4 on Porous Glass at Room Temperature A Key Intermediate in the Heterogeneous Hydrolysis of NO2 J Phys Chem A 104 171-175 2000
Bey I D J Jacob R Yantosca J logan B Field A Fiore Q Li H Liu L Mickley M Schultz Global modeling of tropospheric chemistry with assimilated meteorology Model description and evaluation in press J Geophys Res 2001
Brown S H Stark S J Ciciora and A R Ravishankara In-situ measurement of atmospheric NO3 and N2O5 via cavity ring-down spectroscopy Geophys Res Lett 28 3237-3230 2001 (a)
100
Brown S H Stark S J Ciciora and A R Ravishankara In-situ Detection of Atmospheric NO3 and N2O5 via Cavity Ring-Down Spectroscopy EOS Trans AGU 82 Fall Meeting Suppl A41B-0045 2001 (b)
Coe H and M W Gallagher Measurements of dry deposition of NO2 to a Dutch heathland using the eddy-correlation technique Q J R Meteorol Soc118 767-786 1992
Delaney A C D R Fitzjarrald D H Lenschow R Pearson Jr G J Wendel B Woodruff Direct Measurements of Nitrogen Oxides and Ozone Fluxes over Grassland J Atmos Chem 4 429-444 1986
Eugster W and R Hesterberg Transfer resistances of NO2 determined from eddy correlation flux measurements over a litter meadow at a rural site on the Swiss plateau Atmos Environ 30 1247-1254 1996
Fitzjarrald D R and D H Lenschow Mean concentration and flux profiles for chemically reactive species in the atmospheric surface layer Atmos Environ 17 2505-2512 1983
Galmarini S P G Duynkerke J Vila-Guerau De Arellano Evolution of Nitrogen Oxide Chemistry in the Nocturnal Boundary Layer J Appl Meteorology 36 943-957 1997
Gao W M L Wesely P V Doskey Numerical Modeling of the Turbulent Diffusion and Chemistry of NOx O3 Isoprene and Other Reactive Trace Gases in and Above a Forest Canopy J Geophys Res 98 18339-18353 1993
Gao W and M L Wesely Numerical Modeling of the Turbulent Fluxes of Chemically Reactive Trace Gases in the Atmospheric Boundary Layer J Appl Meteorology 33 835-847 1994
Goodman A L G M Underwood and V H Grassian Heterogeneous Reaction of NO2 Characterization of Gas-Phase and Adsorbed Products from the Reaction 2NO2(g) + H2O(a) HONO(g) + HNO3(a) on Hydrated Silica Particles J Phys Chem A 103 7217-7223 1999
Goulden ML JW Munger S-M Fan B C Daube and S C Wofsy Measurements of carbon sequestration by long-term eddy covariance Methods and a critical evaluation of accuracy Global Change Biology 2 169-182 1996
Harrison R M A-M N Kitto Evidence for a surface source of atmospheric nitrous acid Atmos Environ 28 1089-1094 1994
Harrison R M J D Peak G M Collins Tropospheric cycle of nitrous acid J Geophys Res 101 14429-14439 1996
101
Heal M R B B B Booth J N Cape K J Hargreaves The influence of simplified peroxy radical chemistry on the interpretation of NO2-NO-O3 surface exchange Atmos Environ 35 1687-1696 2001
Horii C V M S Zahniser D D Nelson J B McManus S C Wofsy Nitric Acid and Nitrogen Dioxide Flux Measurements a New Application of Tunable Diode Laser Absorption Spectroscopy Proc of SPIE 3758 152-161 1999
Hosker R P Jr and S E Lindberg Review Atmospheric deposition and plant assimilation of gases and particles Atmos Environ 16 889-910 1982
Hanson P and S E Lindberg Dry deposition of reactive nitrogen compounds a review of leaf canopy and non-foliar measurements Atmos Environ 25A 1615-1634 1991
Jacob D J Heterogeneous chemistry and tropospheric ozone Atmos Environ 34 2131-2159 2000
Joss U and W K Graber Profiles and Simulated Exchange of H2O O3 NO2 Between the Atmosphere and the HartX Scots Pine Plantation Theor Appl Climatol 53 157-172 1996
Lefer B L and R W Talbot Nitric acid and ammonia at a rural northeaster US site J Geophys Res 104 1645-1661 1999
Lerdau M T J W Munger D J Jacob The NO2 Flux Conumdrum Science289 2291-2293 2000
Moody J L J W Munger A H Goldstein D J Jacob and S C Wofsy Harvard Forest regional-scale air mass composition by Patterns in Atmospheric Transport History (PATH) J Geophys Res 103 13181-13194 1998
Munger J W S C Wofsy P S Bakwin S-M Fan M L Goulden B C Daube and A H Goldstein Atmospheric deposition of reactive nitrogen oxides and ozone in a temperate deciduous forest and a subarctic woodland 1 Measurements and mechanisms J Geophys Res 101 12639-12657 1996
Munger J W S-M Fan P S Bakwin M L Goulden A H Goldstein A S Colman and S C Wofsy Regional budgets for nitrogen oxides from continental sources Variations of rates for oxidation and deposition with season and distance from source regions J Geophys Res 103 8355-8368 1998
Notholt J J Hjorth and F Raes Formation of HNO2 on aerosol surfaces during foggy periods in the presence of NO and NO2 Atmos Environ 26A 211-217 1992
Padro J Zhang L and W J Massman An analysis of measurements and modlling of air-surface exchange of NO-NO2-O3 over grass Atmos Environ 32 1365-1375 1998
102
103
Rondon A C Johansson L Granat Dry Deposition of Nitrogen Dioxide and Ozone to Coniferous Forests J Geophys Res 98 5159-5172 1993
Rothman LS et al The HITRAN molecular spectroscopic database and HAWKS (HITRAN Atmospheric Workstation) 1996 Edition J Quant Spectrosc Radiat Transfer 60 665-710 1998
Sparks J P R K Monson K L Sparks M Lerdau Leaf uptake of nitrogen dioxide (NO2) in a tropical wet forest implications for tropospheric chemistry Oecologia 127 214-221 2001
Stocker D W D H Stedman K F Zeller W J Massman D G Fox Fluxes of Nitrogen Oxides and Ozone Measured by Eddy Correlation Over a Shortgrass Prairie J Geophys Res 98 12619-12630 1993
Walton S M W Gallagher T W Choularton J Duyzer Ozone and NO2 Exchange to Fruit Orchards Atmos Environ 31 2767-2776 1997
Wesely M L J A Eastman D H Stedman E D Yalvac An eddy-correlation measurement of NO2 flux to vegetation and comparison to O3 flux Atmos Environ 16 815-820 1982
Wesely M L Parameterization of surface resistances to gaseous dry deposition in regional-scale numerical models Atmos Environ 23 1293-1304 1989
Wesley M L and B B Hicks A review of the current status of knowledge on dry deposition Atmos Environ 34 2261-2282 2000
Wildt J D Kley A Rockel P Rockel H J Schneider Emission of NO from several higher plant species J Geophys Res 102 5919-5927 1997
- April ndash November 2000
- G (nmol mol-1)
- 29 August ndash 8 Oct 2000
- References
- Chapter3_NOx_Part2pdf
-
- 34 Discussion
-
- Chapter3_NOx_Part1pdf
-
- 32 Methods
- 33 Results
-
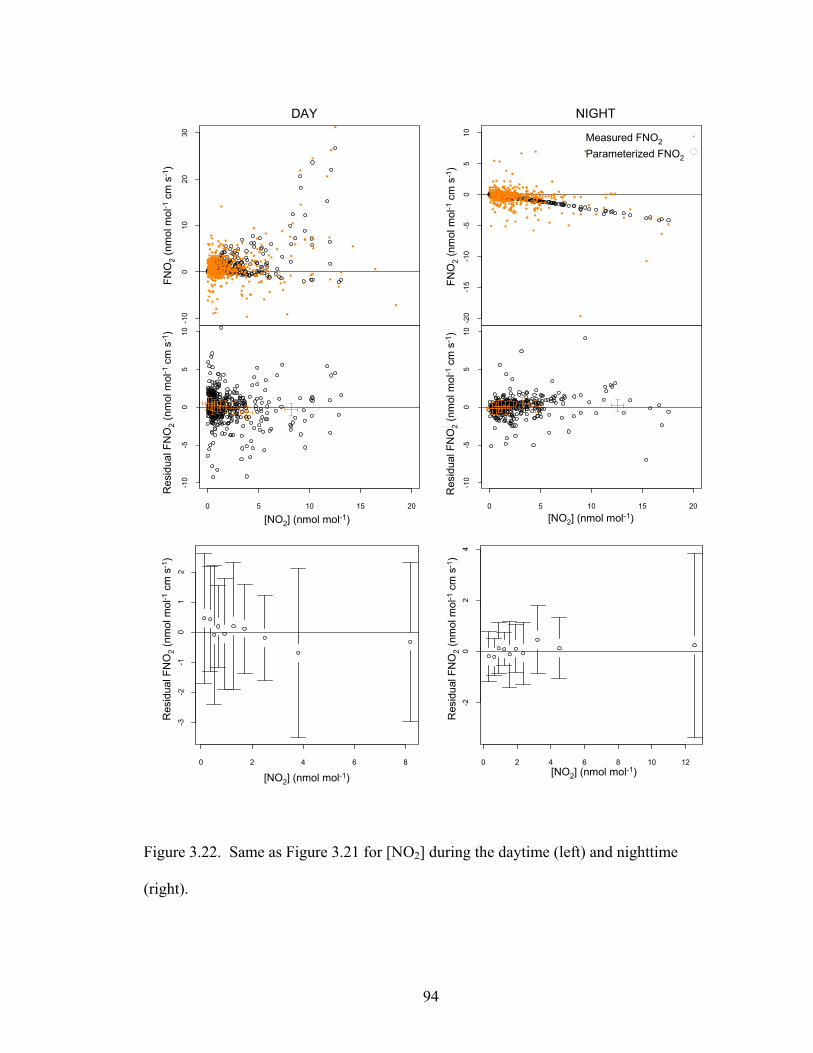

0 6 12 18
-10
-08
-06
-04
-02
00
-14
-12
-10
-08
-06
-04
-02
00
Net
FN
Ox
(nm
ol m
ol-1
cm s
-1)
(microm
ol m
-2hr
-1)
Net
VN
Ox
(cm
s-1
)
Hour
median| 25th amp 75th percentiles
0 6 12 18
-024
-022
-020
-018
Figure 323 Diel cycle of parameterized net NOx exchange velocity (upper panel) and
flux (lower panel) April-November 2000 FNOx(net) asymp FNO2(net) = V0middot[NO2] +
amiddot[NO2]2 + ΓmiddotVd(O3) VNOx(net) = FNO2(net)[NO2]
96
At night in the absence of significant quantities of NO we observed a consistent
downward flux of NO2 which depended quadratically on the concentration of NO2
although the dependence was apparent mainly on two nights when [NO2] was above 10
nmol mol-1 The nighttime NO2 deposition velocity varied between 02 cm s-1 at [NO2]=1
nmol mol-1 and 05 cm s-1 at [NO2]=30 nmol mol-1 These fluxes could come from direct
NO2 deposition to non-stomatal surfaces in the forest such as soil litter bark and the
outer surfaces of leaves area-normalized deposition velocities to such surfaces in
chamber measurements have varied from less than 01 to 05 cm s-1 for NO2
concentrations between 40 and 80 nmol mol-1 [Hanson and Lindberg 1991] The rate of
heterogeneous N2O5 hydrolysis resulting in aqueous-phase HNO3 (unlikely to re-enter the
gas phase) is insufficient to explain the observed nighttime NO2 deposition rates The
quadratic flux dependence and similarity to the behavior of HONO observed at other sites
suggests that heterogeneous NO2 hydrolysis may also play a significant role in NO2
deposition [Harrison and Kitto 1994 Harrison et al 1996 Barney and Finlayson-Pitts
2000] Half of any NO2 flux due to heterogeneous NO2 hydrolysis would likely escape
from the surfaces as gas-phase HONO potentially impacting the daytime HOx and NOx
budgets when photolyzed at sunrise
During the day we observed coupled fluxes of NO2 (upward) and NO
(downward) due to photochemical cycling driven by canopy-induced light and eddy
diffusivity gradients The imbalance in the observed fluxes corresponded to the
difference in height of the sampling levels relative to the canopy The exchange
velocities of the two species in their respective directions increased with higher above-
canopy light levels as measured by photosynthetic photon flux density (PPFD) due to the
97
stronger light gradient through the canopy under brighter conditions Upward NO2
velocity was smaller in early spring and late fall when there were no leaves on the trees
corresponding to a weaker light gradient condition (NO fluxes were only measured
during full-canopy conditions) and possibly to the absence of stomata-dependent
emission of NO2 We believe that these coupled fluxes are the first to be reported from a
mature tall-canopy site using reliable eddy-covariance appropriate sampling techniques
All of the NO and NO2 flux data day and night were well explained by a simple
parameterization consisting of two equations FNO2 = V0 middot [NO2] + amiddot[NO2]2 +
(b+f)middotPPFDmiddot[NO2] + ΓmiddotVd(O3) and FNO = V0_NO middot [NO] + bprime middot PPFD middot [NO] The net flux
of NOx is approximately equal to the flux of NO2 omitting the PPFD-dependent term
FNOxasympV0 middot [NO2] + amiddot[NO2]2 + ΓmiddotVd(O3) V0 and V0_NO are small constant deposition
velocity terms b and bprime are coefficients of light-dependent coupled fluxes for full-canopy
conditions and f adjusts the NO2 light-dependent term for no-leaves conditions The
deposition velocity of O3 was used as a proxy for stomatal exchange the coefficient Γ
was consistently positive Stomatal conductance correlates with a number of different
variables (light temperature humidity) complicating the interpretation of the final term
It may indicate a stomatal emission of NO2 under low-NOx conditions typical at Harvard
Forest but could also correspond to a chemical or other process which slows NO2
deposition during the day The quadratic term amiddot[NO2]2 was particularly significant at
night during a few high-[NO2] events Multi-factor regressions fitting the hourly data
with these equations yield R2 of 061 for FNO2 and 092 for FNO the coefficients
summarized in Table 36 agree with analyses of segregated daytime and nighttime data
We note that the coefficients are relevant to the specific measurement heights of NO (29
98
m) and NO2 (22 m) at Harvard Forest relative to the forest canopy height (20 m)
However the mechanism should be adaptable for more general application
During the measurement period net NO2 deposition velocity (omitting the PPFD-
dependent term associated with photochemical cycling of NOx) -(V0 + amiddot[NO2] +
ΓmiddotVd(O3)[NO2]) was between 015 and 03 cm s-1 The mean 02 cm s-1 varied by less
than 002 cm s-1 between day and night and between full-canopy and leafless conditions
NO2 deposition velocity measurements to deciduous forest canopies are scarce this result
falls just outside of the range of reported values for coniferous forests 01 to 15 cm s-1
[Hanson and Lindberg 1991 Rondoacuten et al 1993 Joss and Graber 1996] and short
crops such as alfalfa soy and oats 007 to 125 cm s-1 [Hanson and Lindberg 1991]
The only estimates of NO deposition velocity are over grass ~01 to 02 cm s-1 [Hanson
and Lindberg 1991] other observations indicate NO emission from various species
though soil emissions could confound these results [Wildt et al 1997] This is quite
close to the ~025 cm s-1 NO deposition velocity at Harvard Forest (-V0_NO) but we
cannot resolve the debate as to whether NO deposits at all [Wesely and Hicks 2000]
Concentration and flux measurements of HONO N2O5 and NO3 (along with NO
and NO2) are required to better understand the nighttime chemistry and deposition of
NOx Recently-developed continuous analyzers for HONO [Harrison et al 1996] and N-
2O5 and NO3 [Brown et al 2001] may make these measurements possible in the coming
years In addition the use of flux chambers with a TDLAS or other instrument (sub-
nmol mol-1 sensitivity and species-specific detection method) on leaf litter and soil
samples in the lab and field may facilitate direct detection of NO2 compensation points
for various species and quantify the importance of different natural surfaces
99
NOx deposition matters to both the ecosystem and the atmosphere the form of
nitrogen entering plants affects nutrient loading acid stress and toxicity and the form of
nitrogen leaving the atmosphere affects O3 production HOx chemistry and long-range
transport of anthropogenic pollutants We are hopeful that future research endeavors will
approach the problem from the perspective of both ecosystem and atmosphere at scales
ranging from the individual leaf to the vegetated landscape using reliable species-
specific and sensitive measurement techniques
References
Andreacutes-Hernaacutendez J Notholt J Hjorth and O Schrems A DOAS study on the origin of initrous acid at urban and non-urban sites Atmos Environ 30 175-180 1996
Aneja V P P A Roelle G C Murray J Southerland J W Erisman D Fowler W A H Asman and N Patni Atmospheric nitrogen compounds II emissions transport transformation deposition and assessment Atmos Environ 35 1903-1911 2001
Barford C E Hammond Pyle L Hutyra S Wofsy Ecological Measurements to compliment eddy-flux measurements at Harvard Forest [Online data archive] httpwww-asharvardedudatanigec-datahtml 2001
Barnet W S and B J Finlayson-Pitts Enhancement of N2O4 on porous glass at room temperature A key intermediate in the heterogeneous hydrolysis of NO2 J Phys Chem A 104 171-175 2000
Barney W S and B J Finlayson-Pitts Enhancement of N2O4 on Porous Glass at Room Temperature A Key Intermediate in the Heterogeneous Hydrolysis of NO2 J Phys Chem A 104 171-175 2000
Bey I D J Jacob R Yantosca J logan B Field A Fiore Q Li H Liu L Mickley M Schultz Global modeling of tropospheric chemistry with assimilated meteorology Model description and evaluation in press J Geophys Res 2001
Brown S H Stark S J Ciciora and A R Ravishankara In-situ measurement of atmospheric NO3 and N2O5 via cavity ring-down spectroscopy Geophys Res Lett 28 3237-3230 2001 (a)
100
Brown S H Stark S J Ciciora and A R Ravishankara In-situ Detection of Atmospheric NO3 and N2O5 via Cavity Ring-Down Spectroscopy EOS Trans AGU 82 Fall Meeting Suppl A41B-0045 2001 (b)
Coe H and M W Gallagher Measurements of dry deposition of NO2 to a Dutch heathland using the eddy-correlation technique Q J R Meteorol Soc118 767-786 1992
Delaney A C D R Fitzjarrald D H Lenschow R Pearson Jr G J Wendel B Woodruff Direct Measurements of Nitrogen Oxides and Ozone Fluxes over Grassland J Atmos Chem 4 429-444 1986
Eugster W and R Hesterberg Transfer resistances of NO2 determined from eddy correlation flux measurements over a litter meadow at a rural site on the Swiss plateau Atmos Environ 30 1247-1254 1996
Fitzjarrald D R and D H Lenschow Mean concentration and flux profiles for chemically reactive species in the atmospheric surface layer Atmos Environ 17 2505-2512 1983
Galmarini S P G Duynkerke J Vila-Guerau De Arellano Evolution of Nitrogen Oxide Chemistry in the Nocturnal Boundary Layer J Appl Meteorology 36 943-957 1997
Gao W M L Wesely P V Doskey Numerical Modeling of the Turbulent Diffusion and Chemistry of NOx O3 Isoprene and Other Reactive Trace Gases in and Above a Forest Canopy J Geophys Res 98 18339-18353 1993
Gao W and M L Wesely Numerical Modeling of the Turbulent Fluxes of Chemically Reactive Trace Gases in the Atmospheric Boundary Layer J Appl Meteorology 33 835-847 1994
Goodman A L G M Underwood and V H Grassian Heterogeneous Reaction of NO2 Characterization of Gas-Phase and Adsorbed Products from the Reaction 2NO2(g) + H2O(a) HONO(g) + HNO3(a) on Hydrated Silica Particles J Phys Chem A 103 7217-7223 1999
Goulden ML JW Munger S-M Fan B C Daube and S C Wofsy Measurements of carbon sequestration by long-term eddy covariance Methods and a critical evaluation of accuracy Global Change Biology 2 169-182 1996
Harrison R M A-M N Kitto Evidence for a surface source of atmospheric nitrous acid Atmos Environ 28 1089-1094 1994
Harrison R M J D Peak G M Collins Tropospheric cycle of nitrous acid J Geophys Res 101 14429-14439 1996
101
Heal M R B B B Booth J N Cape K J Hargreaves The influence of simplified peroxy radical chemistry on the interpretation of NO2-NO-O3 surface exchange Atmos Environ 35 1687-1696 2001
Horii C V M S Zahniser D D Nelson J B McManus S C Wofsy Nitric Acid and Nitrogen Dioxide Flux Measurements a New Application of Tunable Diode Laser Absorption Spectroscopy Proc of SPIE 3758 152-161 1999
Hosker R P Jr and S E Lindberg Review Atmospheric deposition and plant assimilation of gases and particles Atmos Environ 16 889-910 1982
Hanson P and S E Lindberg Dry deposition of reactive nitrogen compounds a review of leaf canopy and non-foliar measurements Atmos Environ 25A 1615-1634 1991
Jacob D J Heterogeneous chemistry and tropospheric ozone Atmos Environ 34 2131-2159 2000
Joss U and W K Graber Profiles and Simulated Exchange of H2O O3 NO2 Between the Atmosphere and the HartX Scots Pine Plantation Theor Appl Climatol 53 157-172 1996
Lefer B L and R W Talbot Nitric acid and ammonia at a rural northeaster US site J Geophys Res 104 1645-1661 1999
Lerdau M T J W Munger D J Jacob The NO2 Flux Conumdrum Science289 2291-2293 2000
Moody J L J W Munger A H Goldstein D J Jacob and S C Wofsy Harvard Forest regional-scale air mass composition by Patterns in Atmospheric Transport History (PATH) J Geophys Res 103 13181-13194 1998
Munger J W S C Wofsy P S Bakwin S-M Fan M L Goulden B C Daube and A H Goldstein Atmospheric deposition of reactive nitrogen oxides and ozone in a temperate deciduous forest and a subarctic woodland 1 Measurements and mechanisms J Geophys Res 101 12639-12657 1996
Munger J W S-M Fan P S Bakwin M L Goulden A H Goldstein A S Colman and S C Wofsy Regional budgets for nitrogen oxides from continental sources Variations of rates for oxidation and deposition with season and distance from source regions J Geophys Res 103 8355-8368 1998
Notholt J J Hjorth and F Raes Formation of HNO2 on aerosol surfaces during foggy periods in the presence of NO and NO2 Atmos Environ 26A 211-217 1992
Padro J Zhang L and W J Massman An analysis of measurements and modlling of air-surface exchange of NO-NO2-O3 over grass Atmos Environ 32 1365-1375 1998
102
103
Rondon A C Johansson L Granat Dry Deposition of Nitrogen Dioxide and Ozone to Coniferous Forests J Geophys Res 98 5159-5172 1993
Rothman LS et al The HITRAN molecular spectroscopic database and HAWKS (HITRAN Atmospheric Workstation) 1996 Edition J Quant Spectrosc Radiat Transfer 60 665-710 1998
Sparks J P R K Monson K L Sparks M Lerdau Leaf uptake of nitrogen dioxide (NO2) in a tropical wet forest implications for tropospheric chemistry Oecologia 127 214-221 2001
Stocker D W D H Stedman K F Zeller W J Massman D G Fox Fluxes of Nitrogen Oxides and Ozone Measured by Eddy Correlation Over a Shortgrass Prairie J Geophys Res 98 12619-12630 1993
Walton S M W Gallagher T W Choularton J Duyzer Ozone and NO2 Exchange to Fruit Orchards Atmos Environ 31 2767-2776 1997
Wesely M L J A Eastman D H Stedman E D Yalvac An eddy-correlation measurement of NO2 flux to vegetation and comparison to O3 flux Atmos Environ 16 815-820 1982
Wesely M L Parameterization of surface resistances to gaseous dry deposition in regional-scale numerical models Atmos Environ 23 1293-1304 1989
Wesley M L and B B Hicks A review of the current status of knowledge on dry deposition Atmos Environ 34 2261-2282 2000
Wildt J D Kley A Rockel P Rockel H J Schneider Emission of NO from several higher plant species J Geophys Res 102 5919-5927 1997
- April ndash November 2000
- G (nmol mol-1)
- 29 August ndash 8 Oct 2000
- References
- Chapter3_NOx_Part2pdf
-
- 34 Discussion
-
- Chapter3_NOx_Part1pdf
-
- 32 Methods
- 33 Results
-