chapter 3 efficiency improvement in cage...
TRANSCRIPT
37
CHAPTER 3
EFFICIENCY IMPROVEMENT IN CAGE INDUCTION
MOTORS BY USING DCR TECHNOLOGY
3.1 INTRODUCTION
This chapter describes, a comparison of the performance
characteristics of a 2.2 kW induction motor with conventional Die-cast
Aluminium Rotor to that of a 2.2 kW induction motor with proposed Die- cast
Copper Rotor. Both the motors are fabricated and its steady state
characteristics are compared using MATLAB 7 software, whose inputs are
No-load and Blocked rotor tests, obtained from the above motors. These test
results are used to determine the equivalent circuit parameters of each motor.
The actual load tests were also performed in the motors in accordance with IS
12615: 2004 standard. The possibility of the efficiency improvement for the
three phase, low voltage, squirrel-cage induction motor is also experimentally
verified between the ratings from 0.37 kW to 11 kW.
3.2 INTERNATIONAL RECOMMENDATIONS ON ENERGY
EFFICIENCY
In today's power scenario, we are facing a major power crunch.
Day by day, the gap between demand and supply of electrical energy is
widening at the rate of 3%. Bridging this gap from supply side is very
difficult and expensive proposition. Due to the pressure of energy shortages,
energy cost and environmental considerations, various Government/Non-

38
Government agencies through out the world started looking at the ways of
improving the efficiency and creating awareness amongst the industry by
enacting mandatory laws/modifying standards for voluntary adoption.
Comparative picture of laws and standards as established today in
USA, EU and India is given in Table 3.1.
Table 3.1 International Recommendations on Energy Efficiency
Factors USA (EPAct)EU (CEMEP Agreement)
INDIA
(Energy Conservation Act)
Legislation Mandatory Voluntary Voluntary
Type of EE motor 3 Phase Induction
3 Phase Induction
3 Phase Induction
Ratings 0.75 kW – 150 kW
1.1 kW–90 kW 0.37kW – 160 kW
Polarities 2,4 & 6 Pole 2 & 4 Pole 2,4,6 & 8 Pole
Efficiency Standard Minimum Specified
Minimum EFF category to be
labelled
Minimum Specified as per IS : 12615
Testing Specification
IEEE – 112 B IEC 600 34.2 IS 12615
Minimum Efficiency Specified for (11kW, 4 Pole, TEFC)
91.0 %
(60 Hz)
88.4 %
(50 Hz)
88.4 %
(50 Hz)

39
3.3 FOCUS ON ENERGY EFFICIENCY OF ELECTRICAL
MOTORS
In simplest terms, energy-efficient electric motors are high-quality
versions of standard motor products. They pack more of 'active' electric
materials (steel laminations and copper) into essentially the same physical
package. By introducing this motor which have different characteristic from a
standard motor, less energy is required to produce the same output torque.
The usage of energy efficient motor, can reduce financial cost of industrial
sector such as the cost of motor maintenance and cost of buying a new motor
because it has long life span.
The importance of energy saving in induction motor was
emphasized about 20 years ago, in the academic area, but the motor
manufacturer’s interest is focused only on the maximum benefit. As a
costumer, it is better to take into account not only the motor price, but also the
cost of the used energy during the whole lifetime of the motor. The new
requirement to improve the motor efficiency is a serious research subject,
which must be about the possibility of loss minimization in the induction
motor.
For the three phase, low voltage, induction motor, the used material
for the squirrel cage is aluminum because of the lower price when compared
to copper, which is convenient for the existing technological solutions. As it is
known, the copper’s resistivity is lower than that of aluminium, and therefore
the copper squirrel cage losses decrease with the ratio of resistivity of copper
to resistivity of aluminium. Till now, the actual technology has no solutions
for low voltage motors and hence new solutions are necessary in the
technological area. This chapter analyzes a series of industrial induction
machines with squirrel cage, considering the rotor losses decreasing, the
material cost increase and the saved energy for the whole machine life.

40
3.4 ENERGY EFFICIENT MOTOR
An ‘Energy Efficient’ motor produces the same shaft output (HP), but absorbs less input power (kW) than a standard motor.
Efficiency = Output / Input= (Input – Losses) / Input= 1 – (Losses* / Input)
* Lesser the loss, higher the efficiency.
The efficiency can be improved by reducing the various losses in motor. The various losses encountered in an induction motor are given in Table 3.2.
Table 3.2 Losses Encountered in Induction Motor
S.No. Motor Component Loss Share on Total Loss
1 Stator copper loss 37% 2 Rotor copper (Conductor) loss 18% 3 Iron Loss 20% 4 Friction and Windage loss 9% 5 Stray loss 16%
Various attempts are made to reduce the above category of losses in
induction motors, primarily to reduce rotor copper loss using DCR
technology.
Energy - efficient motors, also called premium or high efficiency
motors. Motors qualify as ‘energy efficient’ if they met or exceed the
efficiency level listed in the National Electric Manufactures Association’s
(NEMA’s) MG1-1993 Publication (NEMA Standards Publication MG1
1993 and 1996).

41
100
99989796959493929190898887
Historical Motors - 1975
Today’s Standard Motor
Today’s Premium Efficiency Motor
Die Cast Copper Rotor Motor
Amorphous Steel Laminations
Super Conducting
Nirvana
20 HP Induction
motor Efficiency
Comparison with the
Past and Future
3.4.1 Die-cast Copper Rotor Motor - The Economical way of Energy Conservation
Figure 3.1 Technology Vs Efficiency of Induction Motors
In conventional design, the cost of motor increases while attempting to reduce the losses.
The task of efficiency improvement by various methods is illustrated in Figure 3.1 for a 20 HP rating of motor. DCR has helped to achieve efficiencies to meet EFF1 standards in the previous experiences. It also gave confidence that with optimisation of design. It may be possible to achieve efficiencies above EFF1 level also. The DCR Technology increases the efficiency of motor with a nominal increase in cost. As shown in the Figure 3.2, the DCR technology is the best way in the 21st century to increase the motor efficiency above the premium level.
It is an interesting fact that, Two-third (2/3) of electricity generated globally is used to run motors, which is almost equal to 2 Trillion (2×10¹²) kWhr/Year. Out of this, about 8.5% of all electricity is consumed to meet the loss in Electrical motors. Of these, motors up to 20HP constitute approximately two third of losses (i.e.) 5.4% of all electricity is wasted as loss for these motors.
42
MOTOR LOSSES MOTOR COST
PAST
DCR Motor
21ST
CENTURY FUTURE
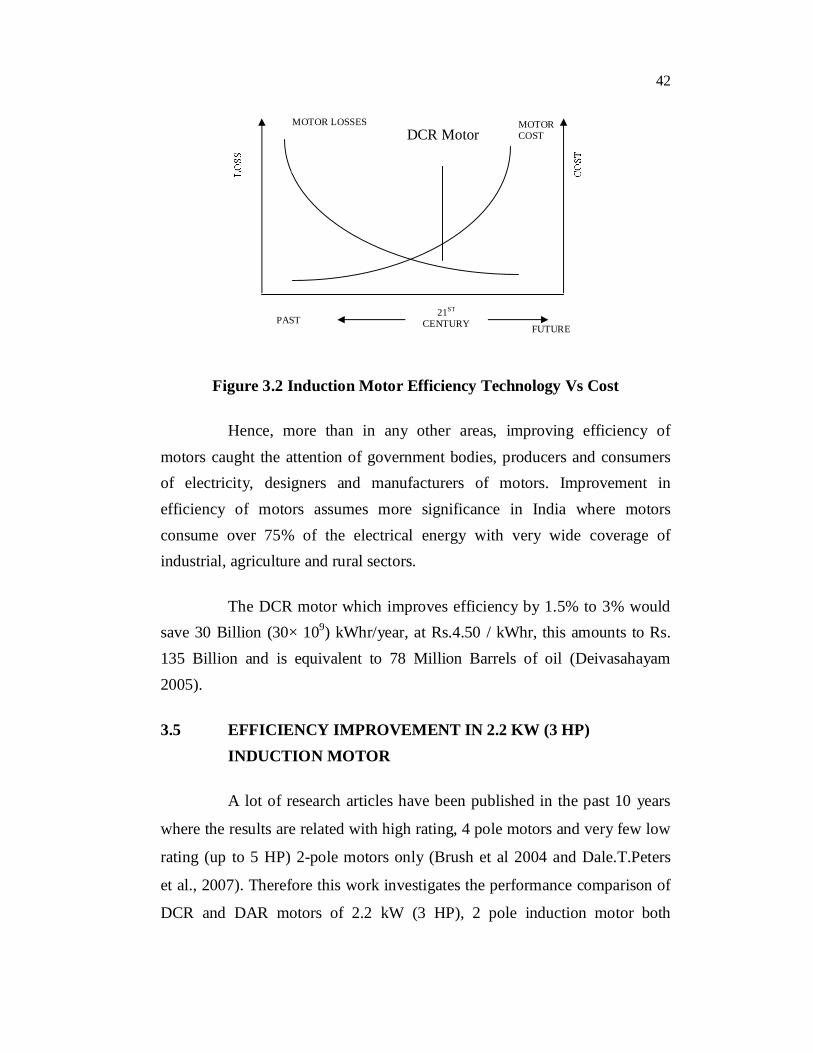
Figure 3.2 Induction Motor Efficiency Technology Vs Cost
Hence, more than in any other areas, improving efficiency of motors caught the attention of government bodies, producers and consumers of electricity, designers and manufacturers of motors. Improvement in efficiency of motors assumes more significance in India where motors consume over 75% of the electrical energy with very wide coverage of industrial, agriculture and rural sectors.
The DCR motor which improves efficiency by 1.5% to 3% would save 30 Billion (30× 109) kWhr/year, at Rs.4.50 / kWhr, this amounts to Rs. 135 Billion and is equivalent to 78 Million Barrels of oil (Deivasahayam2005).
3.5 EFFICIENCY IMPROVEMENT IN 2.2 KW (3 HP) INDUCTION MOTOR
A lot of research articles have been published in the past 10 years
where the results are related with high rating, 4 pole motors and very few low
rating (up to 5 HP) 2-pole motors only (Brush et al 2004 and Dale.T.Peters
et al., 2007). Therefore this work investigates the performance comparison of
DCR and DAR motors of 2.2 kW (3 HP), 2 pole induction motor both

43
theoretical calculation using Matlab 7 software and by experimentation in
accordance with IS 12615 standard.
3.5.1 IS 12615: 2004 Standard
Several international standards exist for testing the efficiency of
induction motors. The standards include:
IEEE 112, IEC 60034-2, CSA 390 and JEC 37. The standards differ
mainly in their treatment of the stray losses in an induction machine (Renier
et al 1999). A detailed comparison of the different efficiency results between
the standards was presented. The Indian standard IS 12615: 2004 was used in
the research related to this chapter. The IS 12615: 2004 standard uses the
segregation of losses method to determine the efficiency of an induction
motor as in the same way of reference international standard IEC 60034-2-1.
(Rotating Electrical Machines Testing Standard IEC60034-2 and IEC60034-
30). The efficiency can be expressed in terms of output power (Pout) and the
sum of losses ( losses), as:
out out
in out losses
P PP P P
(3.1)
Three tests are performed in order to determine the losses in an
induction machine accurately. The tests and results associated with each are
as follows:
3.5.2 Temperature Test
The motor is loaded and allowed to run until its temperature
stabilizes. The temperature and winding resistances are recorded.
44
3.5.3 Load Test
The motor is loaded at six different loading points ranging from
25%-150% of rated load. The stator and rotor copper losses are calculated
from this.
3.5.4 No-load Test
The motor is run at no-load with a varying supply voltage between
125% to 20% of rated voltage. The friction and windage and core losses are
calculated from this.
Temperature correction (to 25C ) is done on the Stator and Rotor
losses using the winding temperature and resistance from the temperature test.
The stray load losses (SLL) are then found by subtracting all the calculated
losses from the measured loss.
The loss segregation method is regarded as the most accurate
method for calculating efficiency. This of course depends on the accuracy of
the equipment. It also has the advantage of very high repeatability, due to the
temperature correction of the losses.
3.6 PERFORMANCE CHARACTERISTICS
In order to analyze the performance of an induction motor, first, the
conventional aluminium die cast material is placed in its rotor. After that,
DCR is substituted in place of former one. A locked rotor test and a no-load
test can be used to determine the equivalent circuit parameters of an induction
machine. (Nasar et al 1979; Rajput 1993 and Engelmann et al 1995). So, these
tests were performed on each of the motor and the test results are shown in
Table 3.3 and 3.4 respectively. The equivalent circuit parameters for the DCR
motor and the comparison with the DAR motor are shown in Table 3.5.

45
Subsequently, the calculated equivalent circuit parameters are fed in to
Matlab 7 software to determine the steady-state characteristic of the induction
motor. From Table 3.5 it is observed that the value of no load resistance (R0)
in the DCR motor is more than that of DAR motor. This is due to slot
geometry which is designed for DAR motor. i.e., the slot design had not been
optimized for copper.
Table 3.3 No-Load test results for 2.2 kW (3 HP), 415 V, 50 Hz, 2-pole,
3-phase induction motor
Parameters DAR
MotorDCR
Motor
No load voltage/ phase 240V 240V
No load current / phase 2A 1.90A
No load power 220W 180W
Table 3.4 Locked rotor test results for 2.2 kW (3 HP), 415 V, 50 Hz, 2-
pole, 3-phase induction motor
Parameters DAR
Motor DCR Motor
L.R. voltage / phase 48.5V 47.3V
L.R. current / phase 4.6A 4.47A
L.R. power 410W 320W
Stator resistance per phase

46
Table 3.5 Comparison of equivalent circuit parameters of 2.2 kW
(3 HP) DCR motor with DAR motor
Parameters DAR Motor DCR Motor
Iw (A) 0.30556 0.25
Iu (A) 1.9765 1.8835
I0 (A) 0.30556-1.9765i 0.25-1.8835i
R0 ( ) 785.45 960
X0 ( ) 121.43 127.42
Z01 ( ) 10.543 10.592
R01 ( ) 6.4587 5.3384
X01 ( ) 8.3333 9.1478
R21 ( ) 3.7287 2.6084
R1 ( ) 2.73 2.73
Figure 3.3 Equivalent circuit of an induction motor

47
(a) (b)
(c) (d)
(e)
Figure 3.4 Performance characteristics of a 2.2 kW (3 HP) induction
motor
48
The equivalent circuit model of an induction machine can be used
to predict its performance characteristics (Sen 1999 and Wildi 2000). One
such circuit is shown in Figure 3.3. The variation (with output power) of its
torque, current, input power factor, efficiency, and slip are determined using
Matlab 7 which is shown in Figure 3.4 (a-e) (Ong 1998 and Okoro 2004).
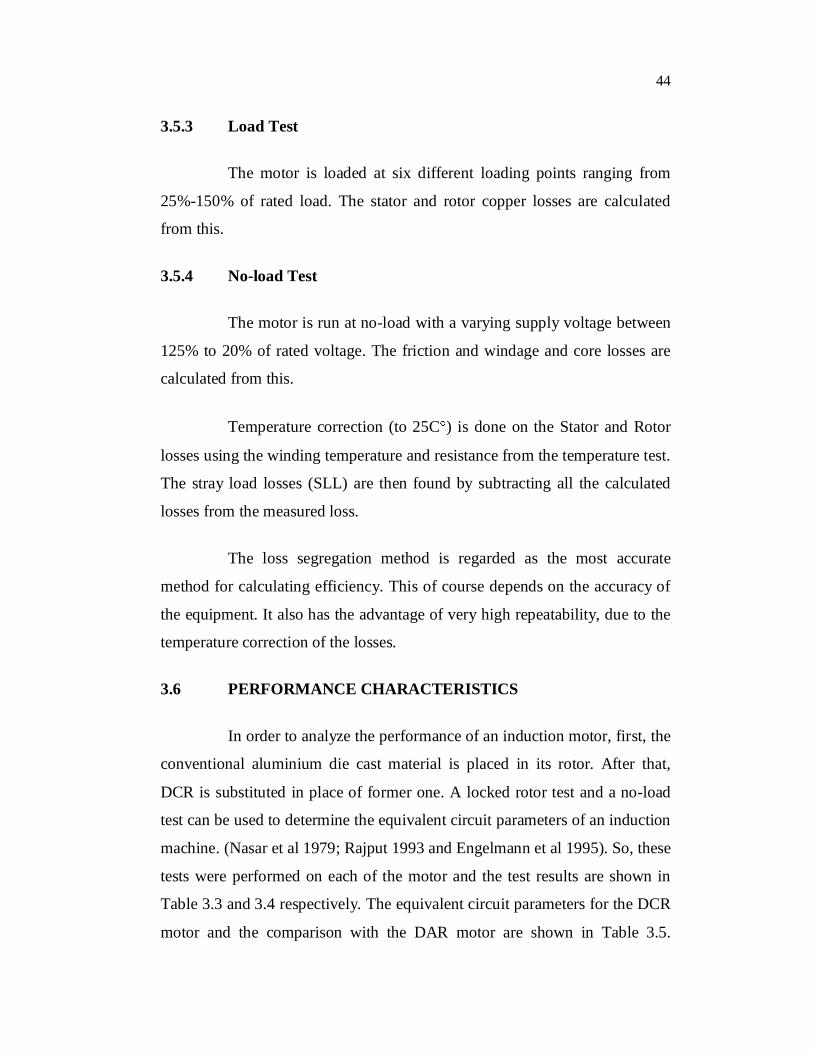
The experimental set up for conducting the full load test is shown
in Figure 3.5.
Figure 3.5 Experimental setup of 3-HP DCR Motor
The results from the tests obtained on one of the 2-pole motors of
3-phase, 2.2 kW (3 HP), 415V, 50 Hz are shown in Table 3.6. The important
parameters responsible for the induction motor characteristics like Efficiency,
Locked rotor Torque, Slip etc., are calculated from Matlab 7 and compared to
the tested results as shown in Table 3.7. Both the results are found equivalent
with each other.
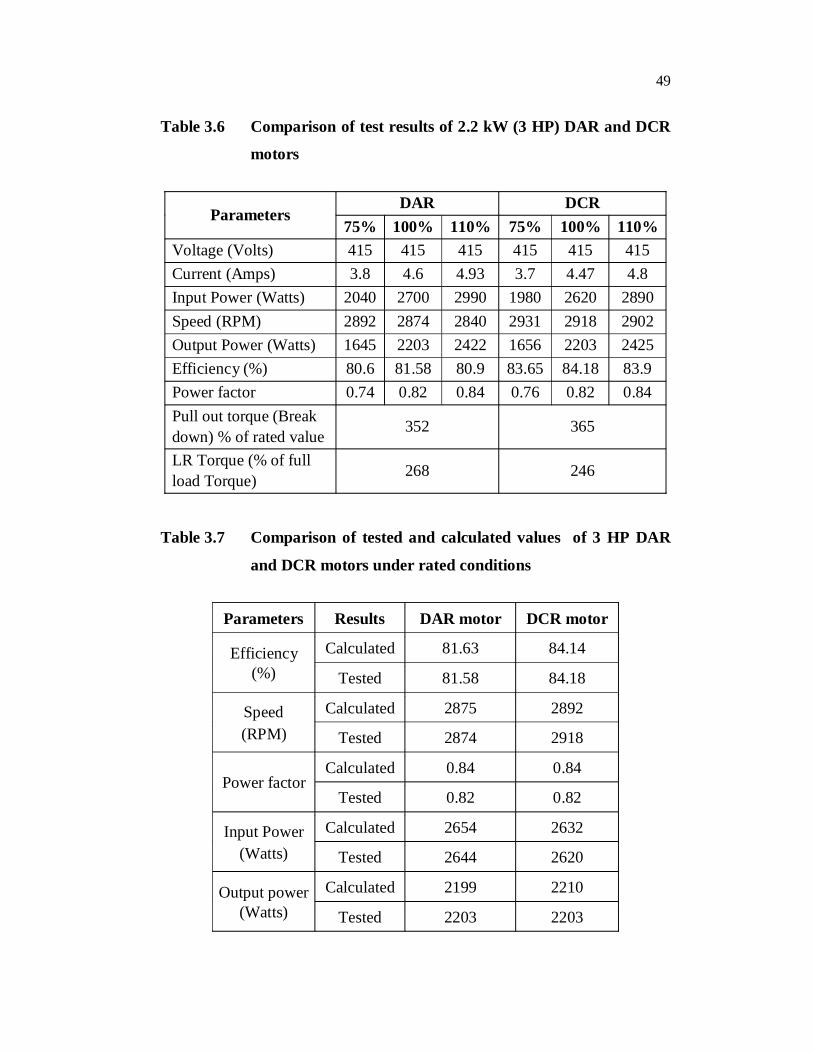
49
Table 3.6 Comparison of test results of 2.2 kW (3 HP) DAR and DCR
motors
Parameters DAR DCR
75% 100% 110% 75% 100% 110%Voltage (Volts) 415 415 415 415 415 415 Current (Amps) 3.8 4.6 4.93 3.7 4.47 4.8 Input Power (Watts) 2040 2700 2990 1980 2620 2890 Speed (RPM) 2892 2874 2840 2931 2918 2902 Output Power (Watts) 1645 2203 2422 1656 2203 2425 Efficiency (%) 80.6 81.58 80.9 83.65 84.18 83.9 Power factor 0.74 0.82 0.84 0.76 0.82 0.84 Pull out torque (Break down) % of rated value 352 365
LR Torque (% of full load Torque) 268 246
Table 3.7 Comparison of tested and calculated values of 3 HP DAR
and DCR motors under rated conditions
Parameters Results DAR motor DCR motor
Efficiency(%)
Calculated 81.63 84.14
Tested 81.58 84.18
Speed (RPM)
Calculated 2875 2892
Tested 2874 2918
Power factor Calculated 0.84 0.84
Tested 0.82 0.82
Input Power(Watts)
Calculated 2654 2632
Tested 2644 2620
Output power(Watts)
Calculated 2199 2210
Tested 2203 2203

50
3.7 EFFICIENCY IMPROVEMENTS IN SMALL/MEDIUM
RATED MOTORS
3.7.1 Experimental Results
During the first test process, seven rotors were cast for 15-HP
(11 kW), 4 Pole, 50 Hz motor and were 150 mm in diameter with 165 mm
core length containing 7 kg of copper in the conductor bars and end rings. It
is important to note that, the laminations used here were designed for
aluminium, i.e., the slot design had not been optimized for copper. Rotor watt
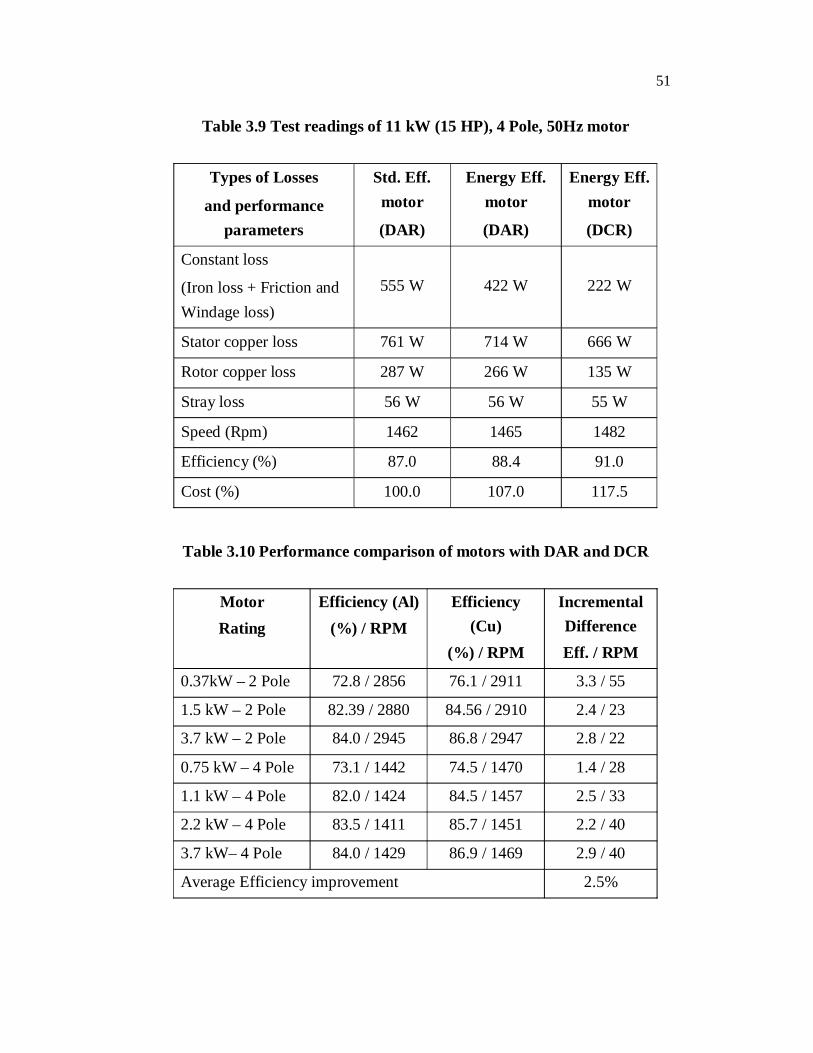
loss averaged 135 watts with a range of 131 to 145 W losses. Table 3.8 shows
the CSA390 test results for the seven rotors tested. Similarly, the CSA390
test results for the 10-HP (7.5 kW), 4 Pole, 50 Hz motor and the segregation
of losses is given in Table 3.9. Relative costs are summed up for each rating
as per present research.
Table 3.8 Test readings of 7.5 kW (10 HP), 4 Pole, 50 Hz motor
Types of Lossesand performance
parameters
Std. Eff. motor(DAR)
Energy Eff. motor(DAR)
Energy Eff. motor(DCR)
Constant loss
(Iron loss + Friction and Windage loss)
505 W 342 W 202 W
Stator copper loss 452 W 424 W 422 W
Rotor copper loss 357 W 243 W 166 W
Stray loss 37 W 37 W 38 W
Speed (Rpm) 1432 1453 1468
Efficiency (%) 84.70 87.80 90.4
Cost (%) 100 107 115
51
Table 3.9 Test readings of 11 kW (15 HP), 4 Pole, 50Hz motor
Types of Losses
and performance parameters
Std. Eff. motor
(DAR)
Energy Eff. motor
(DAR)
Energy Eff. motor
(DCR)
Constant loss
(Iron loss + Friction and Windage loss)
555 W 422 W 222 W
Stator copper loss 761 W 714 W 666 W
Rotor copper loss 287 W 266 W 135 W
Stray loss 56 W 56 W 55 W
Speed (Rpm) 1462 1465 1482
Efficiency (%) 87.0 88.4 91.0
Cost (%) 100.0 107.0 117.5
Table 3.10 Performance comparison of motors with DAR and DCR
Motor Rating
Efficiency (Al) (%) / RPM
Efficiency (Cu)
(%) / RPM
Incremental DifferenceEff. / RPM
0.37kW – 2 Pole 72.8 / 2856 76.1 / 2911 3.3 / 55
1.5 kW – 2 Pole 82.39 / 2880 84.56 / 2910 2.4 / 23
3.7 kW – 2 Pole 84.0 / 2945 86.8 / 2947 2.8 / 22
0.75 kW – 4 Pole 73.1 / 1442 74.5 / 1470 1.4 / 28
1.1 kW – 4 Pole 82.0 / 1424 84.5 / 1457 2.5 / 33
2.2 kW – 4 Pole 83.5 / 1411 85.7 / 1451 2.2 / 40
3.7 kW– 4 Pole 84.0 / 1429 86.9 / 1469 2.9 / 40
Average Efficiency improvement 2.5%

52
Improved efficiencies obtained by using DCR in the existing
designs are given in Table 3.10 for certain popular ratings. This goes to prove
that the DCR motor is the only economical way of obtaining energy
efficiency above levels acceptable.
Table 3.11 Test readings of 10 HP (7.5 kW) 4 pole Induction motor
under Full load condition
Parameter DAR DCR
Voltage (Volts) 415 415
Current (Amps) 14.4 14.73
Input Power (Watts) 8750 8500
Speed (RPM) 1442 1458
Output Power (Watts) 7487 7508
Efficiency (%) 85.57 87.78
Power factor 0.825 0.808
Slip (%) 3.87 2.8
Pull out torque (Break down) % of rated value
298 355
LR Torque (in kg-m) 14.12 14.06
LR Current (Amps) 85.0 86.6
As expected, in the higher conductivity (copper) rotor material, the
speed of DCR motor is increased slightly, the slip and input currents are
reduced and the efficiency is increased. For the same output power, by merely
replacing the DAR with DCR (without changing the other parameters), the
efficiency of the motor is increased by nearly 2.6% points in the 2.2 kW, 2
pole motor. The efficiencies of small/medium rated motors between the

53
ratings (0.37 kW- 3.7 kW) were increased by about 1.5% and nearly 3%
points, a rather remarkable improvement. The test methods for the above
motors are loss separation method of CSA 390 and the test conditions are 3
Phase, 415 V, 50 Hz. Results from tests on one of the 4 pole, 7.5 kW motor
and one of the 2 pole, 1.5 kW motor is shown in Tables 3.11 and 3.12
respectively.
It may be noted that the breakdown torque values of the DCR
motor has 30% points over those for similar motors with aluminium rotor.
Table 3.12 Test readings of 2 HP (1.5 kW) 2 pole 50 Hz induction
motor under Full load condition
Parameter DAR DCR
Voltage (Volts) 415 415
Current (Amps) 2.79 2.81
Input Power (Watts) 1840 1780
Speed (RPM) 2880 2910
Output Power (Watts) 1516 1505
Efficiency (%) 82.39 84.56
Power factor 0.92 0.891
Slip (%) 4 3
Pull out torque (Break down) % of rated value
390 448
LR Torque (in kg-m) 1.46 1.33
LR Current (Amps) 18.47 20.39

54
It is observed that this increment in efficiency in DCR is due to the
better conductivity of DCR. Starting (locked rotor) Torque is reduced
somewhat for aluminium laminations with slots designed for aluminium. In
applications where the lower starting torque is a problem, a modified design
of the rotor slots offers the solution.
The pull out (Breakdown) torque values are also reported in Table
3.6 for a 2.2 kW motor. It is observed that the pull out torque in DCR is high.
i.e., 365 % of the rated torque compared to 352 % of the rated torque for the
same motor with DAR. From the mechanical characteristics shown in Figure
3.4 (c), the DCR motor has the advantage of a higher torque at running speed.
This characteristic of a DCR motor often finds very useful in applications
such as centrifugal pumps, which need high torque at high speed.
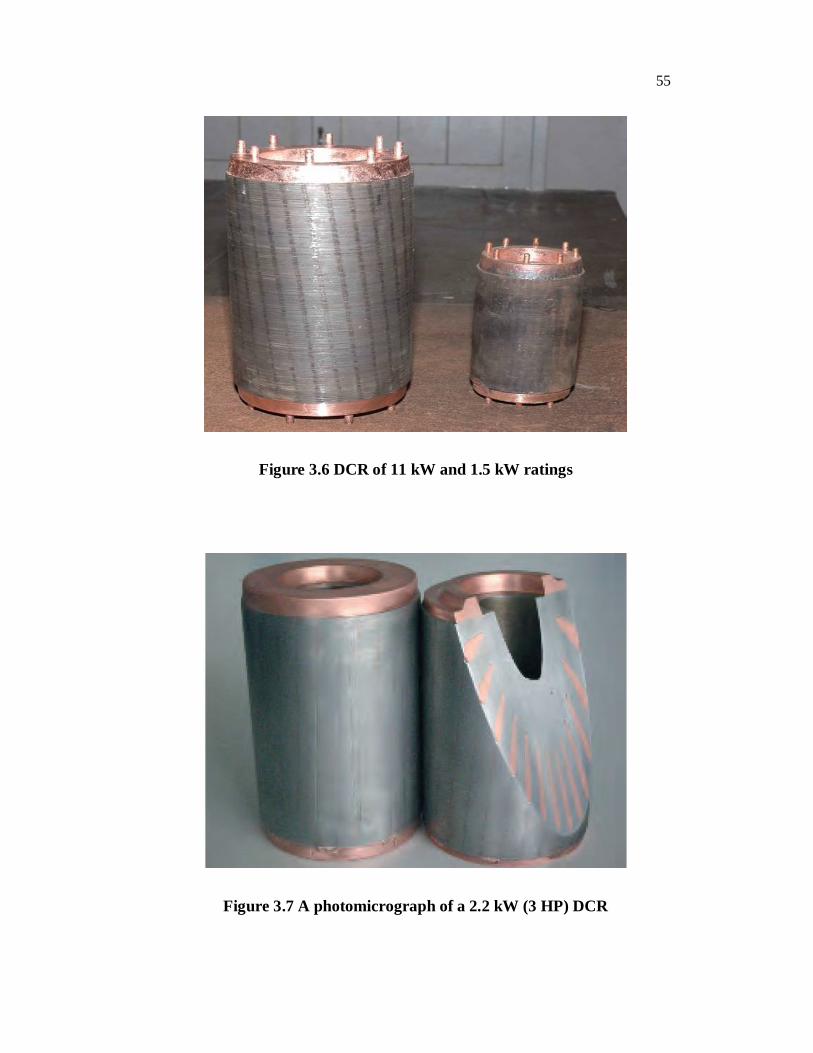
The p.f of the motor under various load conditions of both the DAR
and DCR motors are nearly equal. The pictorial views of 11 kW and 1.5 kW
DCR’s are shown in Figure 3.6. A photomicrograph of a 2.2 kW DCR is
shown in Figure 3.7.
3.7.2 Efficiency Comparison
The graphical representations of efficiency comparison of two 4
pole motors are shown in Figure 3.8 and 3.9. Both these motors are 415V, 50
Hz, 3 phase. Figure 3.9 shows the DCR of 11kW and 1.5 kW respectively. A
core plate of a 5 HP DCR is shown in Figure 3.10.
55
Figure 3.6 DCR of 11 kW and 1.5 kW ratings
Figure 3.7 A photomicrograph of a 2.2 kW (3 HP) DCR

56
2 HP (1.5 kW)
73.9
79.3
81.1
75.9
81.3
83.5
68
70
72
74
76
78
80
82
84
86
50% LOAD 75 % LOAD 100 % LOAD
LOAD (%)
ALUMINIUM COPPER
Figure 3.8 Efficiency Comparison of 2 HP Motor
0.5 HP (0.375 kW)
55.3
66.5
72.8
58.2
69.7
76.1
0
10
20
30
40
50
60
70
80
50% LOAD 75 % LOAD 100 % LOAD
LOAD (%)
ALUMINIUM COPPER
Figure 3.9 Efficiency Comparison of 0.5 HP Motor

57
Figure 3.10 Core plate of 5HP DCR
3.8 SAMPLE WORKING OF ENERGY SAVINGS AND
PAYBACK
The slightly higher (15%) initial cost of DCR motors is often
misunderstood as a demerit. It is not at all true. The increase in initial cost is
offset by the energy saved and the following equation outlines a method for
calculating the cost savings from improved motor efficiency.
The difference in losses for the two motors is:
FLSM EM
1 1L kW x F xE E
(3.2)
where,
kWFL = Full load rating (kW) (taken from motor nameplate)
ESM = Full load efficiency (%) of Standard Motor
EEM = Full load efficiency (%) of EE Motor
F = Running load as a % of full load

58
Capital Cost DifferentialPay Back Period Months Savings per Month
(3.3)
In the above equation for SM at part loads
falls steeply to a lower value unlike EEM which remains almost constant.
Hence the payback period reduces more, than what is calculated using the
above equation.
Consider an example, assume we have a standard-efficiency 11 kW
motor. Assume the motor operates 600 hours, and that power costs
Rs.4.50/kWh. Such motors have an average efficiency rating of 87% at full
load and the capital cost is $350. This motor may be replaced with a DCR
motor having an efficiency of 91% and the capital cost is $380.
The pay back period is calculated as follows:
Increased cost of motor with 91% efficiency is $30
Let,
X - Input power per hour for 87% efficiency motor
= 11/0.87 = 12.6 units
Y - Input power per hour for 91% efficiency motor
= 11/0.91 = 12.08 units
Reduction in electricity cost for 91% efficiency motor per
month = (X-Y)*600*0.1= $31.2
Hence payback of incremental cost is less than 2 months.

59
3.9 CONCLUSION
This chapter is a comparative analysis of performance
characteristics of 2.2 kW, 3-phase 2 pole TEFC induction motor and practical
verification using conventional Die-cast Aluminium Rotor with proposed Die-
cast Copper Rotor. The equivalent circuit parameters of an induction motor is
obtained from No load and Blocked rotor tests are fed to Matlab 7 software to
draw the performance characteristics of both DAR and DCR motors. The
experimental results are compared with the calculated results. Both the results
are almost tallying with each other. It was found that by using DCR technique
the efficiency of 2.2 kW, 3-phase 2 pole TEFC induction motor is improved
by 2.6%. Similarly, performance comparison with DAR and DCR were
carried out between the ranges from 0.37 kW to 11 kW. By merely replacing
the DAR with DCR (without change in the other parameters), the efficiency
of the motor were proven to improve by 1.5% to 3% and the average
efficiency improvement of 2.5% is achieved.