chapter 3 experimental set-up, instrumentation and...
TRANSCRIPT

30
CHAPTER 3
EXPERIMENTAL SET-UP, INSTRUMENTATION AND
TECHNIQUES
3.1 GENERAL
In this chapter, the experimental details and procedure to evaluate
the performance, emission and combustion parameters of a DI diesel engine
using WPO and DWPO adopting different techniques are discussed.
3.2 EXPERIMENTAL SET UP
In the present work, tests were conducted on a single cylinder, air-
cooled, four stroke, vertical, naturally aspirated, stationary, D.I diesel engine
with a displacement volume of 661.5 cc, compression ratio of 16.5:1,
developing 4.4 kW of power at 1500 rpm. The detailed technical
specifications of the engine are given in Appendix 1.
The test facility includes the following arrangements/ instruments/
analysers:
1. Test engine coupled to an alternator and an electrical loading
device.
2. Diesel flow measurement using a burette and stopwatch
arrangement.
3. Piezo-electric pressure pick up for in -cylinder pressure
measurement.
4. Thermocouples for the measurement of temperature of
exhaust gases, cooling water, EGR system and intake charge.
31
5. Computer based digital data acquisition system for analysing
the pressure crank angle data and to obtain the heat release rate.
6. Smoke meter for measuring the exhaust smoke.
7. Exhaust gas analyser for measuring HC, CO, NOX, and CO2
emissions.
8. Exhaust Gas Recirculation unit.
9. Flow meter for maintaining EGR flow rates.
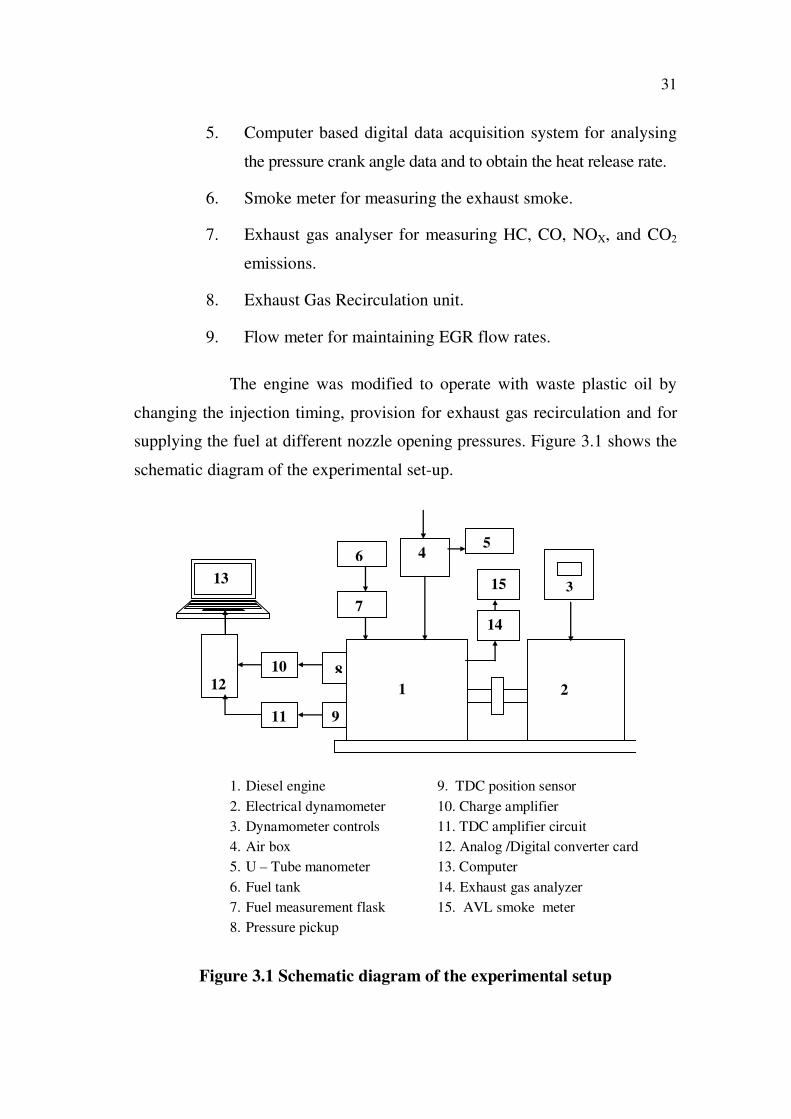
The engine was modified to operate with waste plastic oil by
changing the injection timing, provision for exhaust gas recirculation and for
supplying the fuel at different nozzle opening pressures. Figure 3.1 shows the
schematic diagram of the experimental set-up.
14
13
9
8
1 2
7
6 5
4
10
12
11
3 15
1. Diesel engine 9. TDC position sensor
2. Electrical dynamometer 10. Charge amplifier
3. Dynamometer controls 11. TDC amplifier circuit
4. Air box 12. Analog /Digital converter card
5. U – Tube manometer 13. Computer
6. Fuel tank 14. Exhaust gas analyzer
7. Fuel measurement flask 15. AVL smoke meter
8. Pressure pickup
Figure 3.1 Schematic diagram of the experimental setup
32
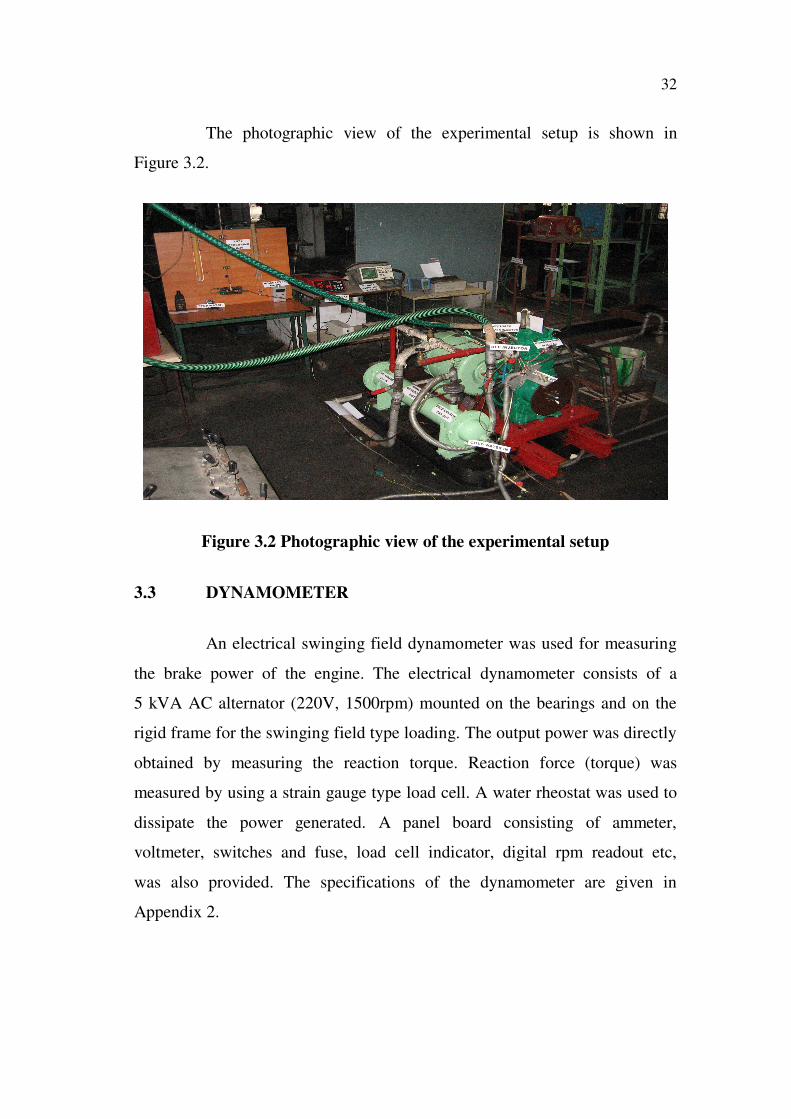
The photographic view of the experimental setup is shown in
Figure 3.2.
Figure 3.2 Photographic view of the experimental setup
3.3 DYNAMOMETER
An electrical swinging field dynamometer was used for measuring
the brake power of the engine. The electrical dynamometer consists of a
5 kVA AC alternator (220V, 1500rpm) mounted on the bearings and on the
rigid frame for the swinging field type loading. The output power was directly
obtained by measuring the reaction torque. Reaction force (torque) was
measured by using a strain gauge type load cell. A water rheostat was used to
dissipate the power generated. A panel board consisting of ammeter,
voltmeter, switches and fuse, load cell indicator, digital rpm readout etc,
was also provided. The specifications of the dynamometer are given in
Appendix 2.

33
3.4 EMISSION MEASUREMENTS
3.4.1 HC, CO, CO2 Measurements
Carbon monoxide, carbon dioxide and hydrocarbon were measured
using a Qrotech (QRO-401) Non-Dispersive Infra Red (NDIR) exhaust gas
analyser. The analyser works on the principle of selective absorption of the
infrared energy of a particular wavelength peculiar to a certain gas, which will
be absorbed by that gas. The specifications of exhaust gas analyser are given
in Appendix 3.
3.4.2 Measurement of Smoke
Smoke emissions were measured using a standard BOSCH type
smoke meter. Gas samples were trapped on a filter paper for 30 seconds and
the filtered smoke was evaluated by using a photocell reflector, which gives a
smoke emission from 0 to 10. The value 0 indicates the absence of smoke and
10 indicates the full smoke. The value intermediate from 0 to 10 indicates the
proportionate concentration of smoke intensity. The specifications of smoke
meter are given in Appendix 4.
3.4.3 NOX Measurement
NO constitutes about 90 % of the total oxides of nitrogen. The
exhaust gas sample was passed through a glass bottle to remove the moisture
before it was analysed. The NOx emission was measured by using a Qrotech
exhaust gas analyser.
3.5 COMBUSTION CHAMBER PRESSURE
Engine cylinder pressure is the basic parameter, necessary for any
type of engine combustion analysis. Cylinder pressure changes with crank

34
angle because of cylinder volume change, combustion, heat transfer to the
walls, flow in and out of the crevice regions and leakage. The combustion rate
information can be obtained from accurate pressure data.
3.5.1 Cylinder Pressure Measurement
The engine cylinder pressure was measured using a water-cooled
Kistler piezo electric pressure sensor, which has a sensitivity of 15.2 pC/bar.
The pressure transducer was located in a hole drilled through the cylinder
head into the combustion chamber. The sensing element consists of a metal
diaphragm, which deflects under pressure. This deflection was converted into
voltage, which is proportional to pressure. The charge output of the pressure
transducer is amplified by using a Kistler charge amplifier. The amplified
signals were correlated with the signal from crank angle encoder and the data
were stored on a personal computer for analysis. The specifications of
pressure transducer are given in Appendix 5. With the help of cylinder
pressure measurements, the heat release rate was determined as given in
Appendix 6.
3.5.2 Charge Amplifier
The charge amplifier is used to convert the electrical charge output
of the pressure transducer into proportional voltage. It consists of an
operational amplifier with a feedback through a variable capacitor, which is
changed according to the range selected. This combination acts as an
integrator for the current inputs from the transducer and the integral of the
change variation appears as the output voltage. This voltage output is
proportional to the total charge at any instant. To ensure the accuracy of the
pressure measurement, the charge amplifier is allowed to warm up for four
hours before the measurements are taken. The specifications of charge
amplifier are given in Appendix 7.
35
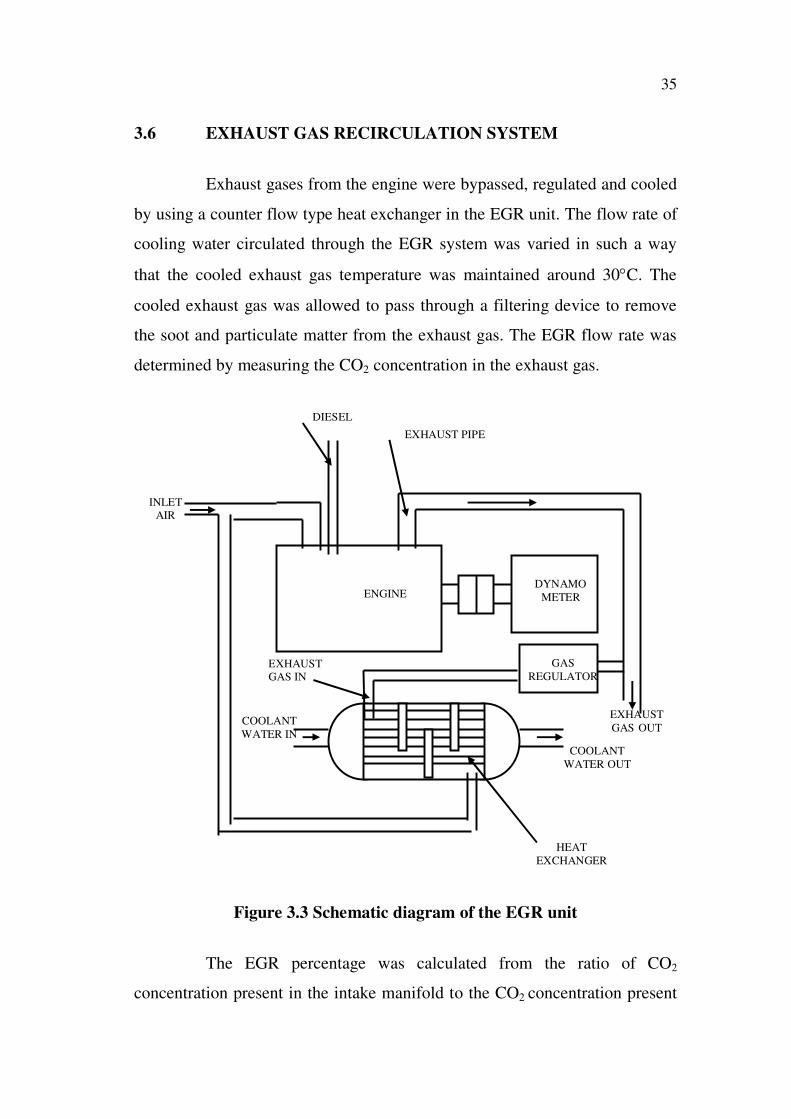
3.6 EXHAUST GAS RECIRCULATION SYSTEM
Exhaust gases from the engine were bypassed, regulated and cooled
by using a counter flow type heat exchanger in the EGR unit. The flow rate of
cooling water circulated through the EGR system was varied in such a way
that the cooled exhaust gas temperature was maintained around 30 C. The
cooled exhaust gas was allowed to pass through a filtering device to remove
the soot and particulate matter from the exhaust gas. The EGR flow rate was
determined by measuring the CO2 concentration in the exhaust gas.
ENGINEDYNAMO
METER
EXHAUST PIPE
HEAT
EXCHANGER
GAS
REGULATOREXHAUST
GAS IN
INLET
AIR
DIESEL
EXHAUST
GAS OUTCOOLANT
WATER IN
COOLANT
WATER OUT
Figure 3.3 Schematic diagram of the EGR unit
The EGR percentage was calculated from the ratio of CO2
concentration present in the intake manifold to the CO2 concentration present
36
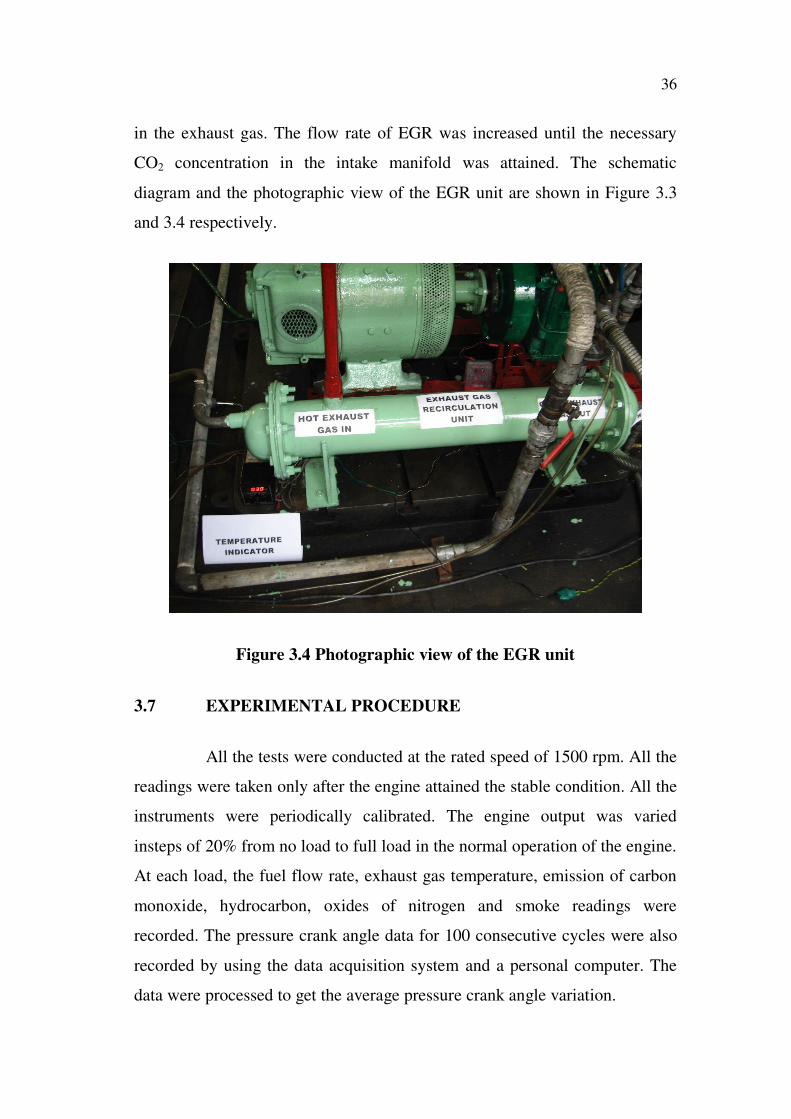
in the exhaust gas. The flow rate of EGR was increased until the necessary
CO2 concentration in the intake manifold was attained. The schematic
diagram and the photographic view of the EGR unit are shown in Figure 3.3
and 3.4 respectively.
Figure 3.4 Photographic view of the EGR unit
3.7 EXPERIMENTAL PROCEDURE
All the tests were conducted at the rated speed of 1500 rpm. All the
readings were taken only after the engine attained the stable condition. All the
instruments were periodically calibrated. The engine output was varied
insteps of 20% from no load to full load in the normal operation of the engine.
At each load, the fuel flow rate, exhaust gas temperature, emission of carbon
monoxide, hydrocarbon, oxides of nitrogen and smoke readings were
recorded. The pressure crank angle data for 100 consecutive cycles were also
recorded by using the data acquisition system and a personal computer. The
data were processed to get the average pressure crank angle variation.
37
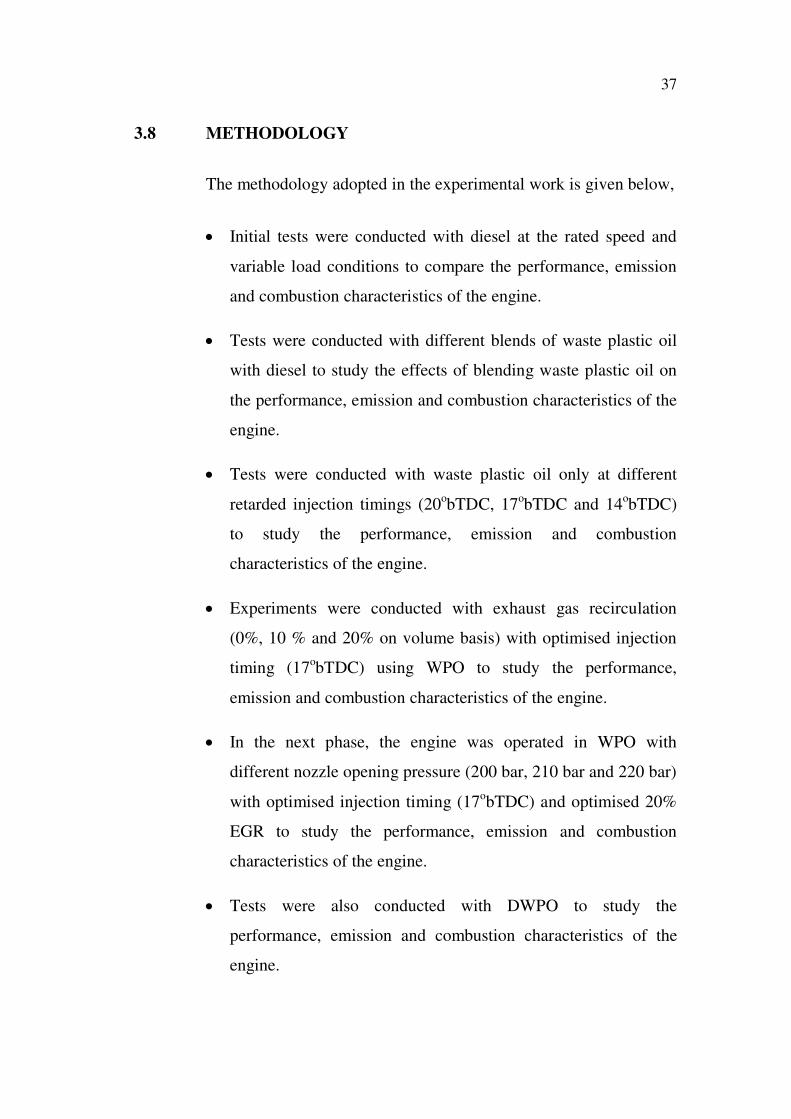
3.8 METHODOLOGY
The methodology adopted in the experimental work is given below,
Initial tests were conducted with diesel at the rated speed and
variable load conditions to compare the performance, emission
and combustion characteristics of the engine.
Tests were conducted with different blends of waste plastic oil
with diesel to study the effects of blending waste plastic oil on
the performance, emission and combustion characteristics of the
engine.
Tests were conducted with waste plastic oil only at different
retarded injection timings (20obTDC, 17
obTDC and 14
obTDC)
to study the performance, emission and combustion
characteristics of the engine.
Experiments were conducted with exhaust gas recirculation
(0%, 10 % and 20% on volume basis) with optimised injection
timing (17obTDC) using WPO to study the performance,
emission and combustion characteristics of the engine.
In the next phase, the engine was operated in WPO with
different nozzle opening pressure (200 bar, 210 bar and 220 bar)
with optimised injection timing (17obTDC) and optimised 20%
EGR to study the performance, emission and combustion
characteristics of the engine.
Tests were also conducted with DWPO to study the
performance, emission and combustion characteristics of the
engine.
38
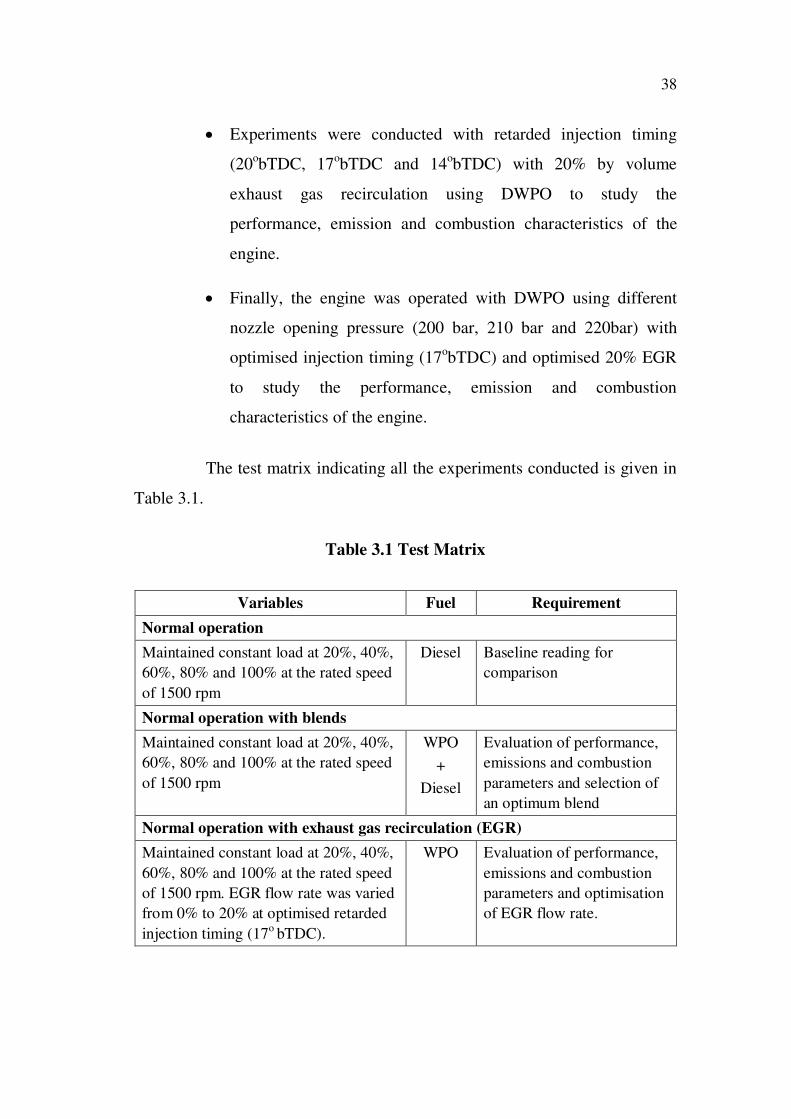
Experiments were conducted with retarded injection timing
(20obTDC, 17
obTDC and 14
obTDC) with 20% by volume
exhaust gas recirculation using DWPO to study the
performance, emission and combustion characteristics of the
engine.
Finally, the engine was operated with DWPO using different
nozzle opening pressure (200 bar, 210 bar and 220bar) with
optimised injection timing (17obTDC) and optimised 20% EGR
to study the performance, emission and combustion
characteristics of the engine.
The test matrix indicating all the experiments conducted is given in
Table 3.1.
Table 3.1 Test Matrix
Variables Fuel Requirement
Normal operation
Maintained constant load at 20%, 40%,
60%, 80% and 100% at the rated speed
of 1500 rpm
Diesel Baseline reading for
comparison
Normal operation with blends
Maintained constant load at 20%, 40%,
60%, 80% and 100% at the rated speed
of 1500 rpm
WPO
+
Diesel
Evaluation of performance,
emissions and combustion
parameters and selection of
an optimum blend
Normal operation with exhaust gas recirculation (EGR)
Maintained constant load at 20%, 40%,
60%, 80% and 100% at the rated speed
of 1500 rpm. EGR flow rate was varied
from 0% to 20% at optimised retarded
injection timing (17obTDC).
WPO Evaluation of performance,
emissions and combustion
parameters and optimisation
of EGR flow rate.
39
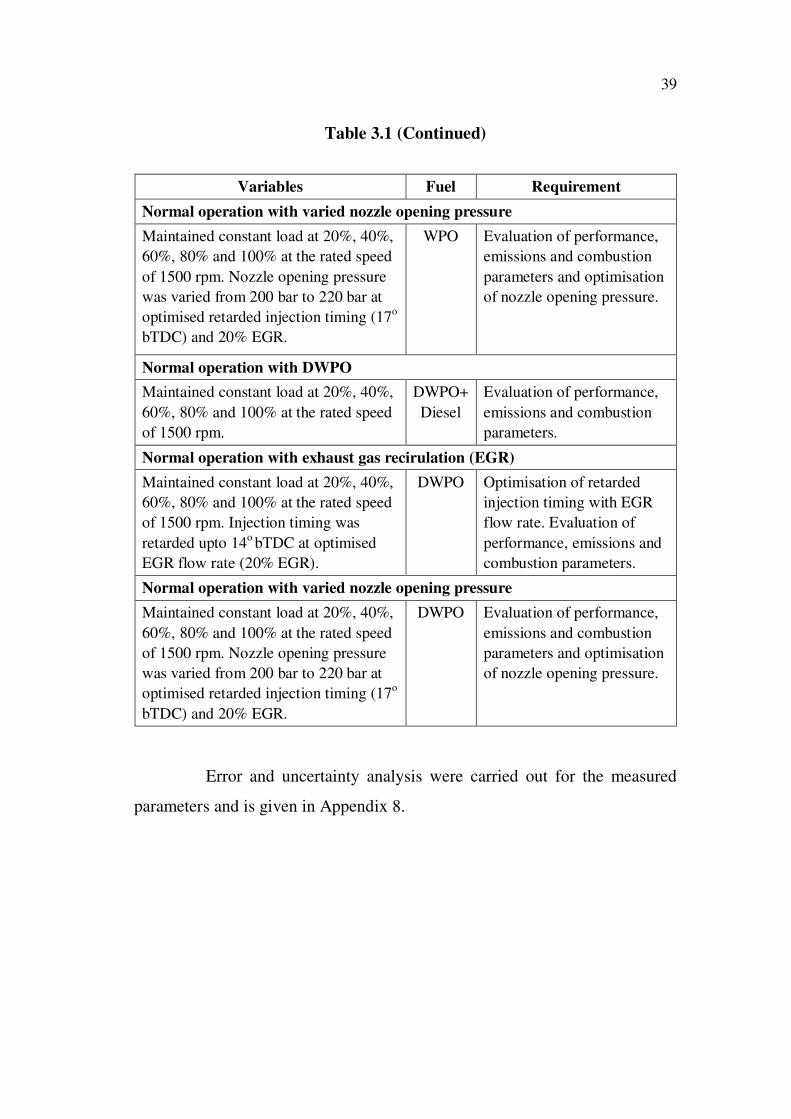
Table 3.1 (Continued)
Variables Fuel Requirement
Normal operation with varied nozzle opening pressure
Maintained constant load at 20%, 40%,
60%, 80% and 100% at the rated speed
of 1500 rpm. Nozzle opening pressure
was varied from 200 bar to 220 bar at
optimised retarded injection timing (17o
bTDC) and 20% EGR.
WPO Evaluation of performance,
emissions and combustion
parameters and optimisation
of nozzle opening pressure.
Normal operation with DWPO
Maintained constant load at 20%, 40%,
60%, 80% and 100% at the rated speed
of 1500 rpm.
DWPO+
Diesel
Evaluation of performance,
emissions and combustion
parameters.
Normal operation with exhaust gas recirulation (EGR)
Maintained constant load at 20%, 40%,
60%, 80% and 100% at the rated speed
of 1500 rpm. Injection timing was
retarded upto 14obTDC at optimised
EGR flow rate (20% EGR).
DWPO Optimisation of retarded
injection timing with EGR
flow rate. Evaluation of
performance, emissions and
combustion parameters.
Normal operation with varied nozzle opening pressure
Maintained constant load at 20%, 40%,
60%, 80% and 100% at the rated speed
of 1500 rpm. Nozzle opening pressure
was varied from 200 bar to 220 bar at
optimised retarded injection timing (17o
bTDC) and 20% EGR.
DWPO Evaluation of performance,
emissions and combustion
parameters and optimisation
of nozzle opening pressure.
Error and uncertainty analysis were carried out for the measured
parameters and is given in Appendix 8.