chapter 3 experimental work -...
TRANSCRIPT

50
CHAPTER 3
EXPERIMENTAL WORK
Friction Stir Welding is a solid state welding process and has emerged
as a welding technique to be used in high strength aluminium alloys, which are
difficult to join with conventional techniques. In this process, the external tool
has a probe and shoulder stirs the material to be joined and forges the surface.
FSW combines forging and extrusion processes. The probe and shoulder extrude
the material by stirring and the shoulder alone forges the material surface to be
joined. Aluminium material was profitably developed and the welding plates
from 1 to 75 mm thickness can be welded by FSW process. Most of the research
works considered the friction stir welding parameters of FSW machine and FSW
Tool geometry (Leal and Loureiro 2006; Rajakumar et al 2010; Merzoug et al
2010; Elangovan et al 2009). The parameters of FSW machine are tool rotation
speed, welding speed and axial force. Some of the parameters of FSW tool
geometry are probe or pin diameter, shoulder diameter to probe diameter ratio,
probe length and probe profile (Padmanaban and Balasubramanian 2009). The
experiments as per Taguchi�s L25 orthogonal array were formulated for different
thicknesses of 4 mm, 6 mm and 8 mm plates. Moreover the orthogonal array
directly gives the optimum level of the parameters. This provides the certainity
to directly study the results of optimum value of different thickness plate. The
Central Composite Design of the Response Surface Method is considered for
double side weld of 8 mm thickness plate.

51

52
The main objective of the work is to perform a tensile test on friction
stir welded 6082-T6 aluminium alloy. An attempt has been made to optimize the
parameters to maximize the tensile strength of the different thickness FSW joint.
The optimum parameter level for every thickness was interpreted and projected.
Also the reduced weld zone by double side weld is discussed. The macro-
structure, micro-structure and micro-hardness of the weld joint were discussed at
different heat inputs. Numerical investigation was carried out to predict the
temperature distribution in the weldments. The flow chart described in figure 3.1
details the plan of the research work.
3.1 FRICTION STIR WELDING MACHINE AND PARAMETERS
The experiments were carried out on conventional HMT FN2V
vertical milling machine with a capacity of 7.5 hp and 1800 rpm as shown in
Figure 3.2. Process parameters such as spindle speed, welding speed, shoulder
penetration; probe profile and the shoulder profile were considered.
Figure 3.2 - Vertical milling machine

53
The conventional milling (CM) machine offers the tool rotational
speed and welding speed by their spindle speed and table feed. Only the axial
force is difficult to attain in conventional milling machine (Minton and Mynors
2006). In CM machine, tool shoulder penetration executes the force parameter.
When the tool shoulder penetration increases, the axial force increases by the
resistance offered between the tool shoulder and material to be welded with
backup plate. Even in FSW machine, axial force is difficult to retain throughout
the welding. But the shoulder penetration/plunge depth can be maintained
(Zimmer et al 2010).
Trial runs are conducted to find the upper and lower limit of process
parameters, by varying one of the parameters and keeping the rest of them at
constant values. Feasible limits of the parameters are chosen in such a way that
the joint should be free from visible defects. The upper limit of a factor is coded
as +2 and lower limit as -2. The intermediate coded values are calculated from
the equation (3.1).
Xi = 2 [2X- (Xmax +Xmin)] / (Xmax - Xmin) (3.1)
Where Xi is the required coded value of a variable X; and X is any
value of the variable from Xmin to Xmax. Xmin is the lower limit of the variable and
Xmax is the upper limit of the variable.
The range of tool rotational speed and welding speed were taken from
700 rpm to 1500 rpm and 0.8 mm/sec to 4 mm/sec respectively (Minton and
Mynors 2006). Shoulder penetration was gradually increased in five steps of
0.05 mm from 0 mm to 0.20 mm for 6 mm and 8 mm thick plates. But this has
been modified for 4 mm thick plate, the shoulder penetration is considered at
five steps of 0.04 mm from 0 mm to 0.16 mm. The selected process parameters
with their limits, units and notations are given in Table 3.1.

54
3.2 FRICTION STIR WELDING TOOL
High carbon high chromium steel (HCHCr) has been favoured among
high speed steel and carbides, to weld Aluminium Alloy materials due to the
Aluminium alloy�s low melting point and low hardness. Also HCHCr tool cost is
comparatively less, easy to process, easy availability and offers high strength and
high hot hardness. (Vijay and Murugan 2010). Double end usage of tool
minimizes tool material and tool cost. A typical double end tool used for trial
runs is shown in Figure 3.3. A collar or step has been provided in mid portion, to
constrain the axial movement of the tool and it also offers excess area for
transfer of torque which multiplies the force (Shigley and Mitchell 1984).
Figure 3.3 - Typical double end tool - shows (a) collar at mid and (b) square pin
(a)
(b)

55
In tool geometry, shoulder profile (Badarinarayan et al 2009; Ericsson
et al 2007) is considered as a parameter. The inclination angles given for
shoulder are 5° inward and 5° outward, 10° inward and 10° outward, and with no
inclination. The inward slope extrudes the material at the nugget area of the joint
which might increase the tensile strength at joint. The outward slope closely
forges the material at the nugget area of the joint which might also increase the
tensile strength. Twenty five various FSW tools were established (Appendix 2)
by the combinations of five different pin profiles of square, pentagon, hexagon,
heptagon and octagon; for five different shoulder profiles of 10° inward, 5°
inward, flat, 5° outward and 10° outward. Few of them are shown in Figure 3.4.
Figure 3.4 - Various friction stir weld tool profiles

56
Table 3.1
Process parameter with their range and values at five levels
Process Parameters Range Level 1
(-2) Level 2 (-1)
Level 3 (0)
Level 4 (1)
Level 5 (2)
Spindle Speed or Tool Rotational Speed (SS)
700 to1500 rpm
700 900 1100 1300 1500
Table Feed or Welding Speed (WS)
0.8 to 4.0 mm/sec
0.8 1.6 2.4 3.2 4.0
Shoulder Penetration (PE)
0.0 to 0.16* mm
0.00 0.04 0.08 0.12 0.16
0.0 to 0.2** mm
0.00 0.05 0.10 0.15 0.20
Probe Profile (PP)
Probe profile*
Triangle TR
Square SQ
Pentagon PN
Hexagon HX
Heptagon HP
Probe profile**
Square SQ
Pentagon PN
Hexagon HX
Heptagon HP
Octagon OC
Shoulder Profile (SP)
-10° to 10° -10° -5° 0° 5° 10°
*For 4 mm plates, **For 6 mm and 8 mm plates.
57
For 4 mm thickness plate five different pin profiles of triangle,
square, pentagon, hexagon, and heptagon were considered. Friction stir tool has
two parts namely shoulder and pin. In this study pin diameter, shoulder diameter
to pin diameter (D/d) ratio and the pin length were taken as d mm, 3d and 0.95d
mm (Elangovan and Balasubramanian, 2008a) respectively. Table 3.1 shows the
process parameters in detail. The pin profiles were cut by spark erosion with
WEDM machine and others including inward and outward taper of the shoulders
was obtained in CNC turning center. The tools were oil hardened to obtain a
hardness of 60-62 HRC.
3.3 MATERIAL SPECIFICATION AND PREPARATION
The 6xxx-group is high strength AL-Mg-Si alloys that contain
manganese to increase ductility and toughness. Aluminium alloy 6082 has the
highest strength among the 6000 series alloys with excellent corrosion resistance
property. Alloy 6082 is known as a structural alloy. The addition of large amount
of manganese controls the grain structure which in turn results in a stronger
alloy. The 6082-T6 extruded medium to high strength Al-Mg-Si alloys contains
manganese to increase ductility and toughness (Appendix 3). The T6 condition is
obtained through artificial ageing at a temperature approximately 180°C
(Ericsson and Sandstorm 2003). The alloy 6082 is very common in Europe
(Alcoa, 2007) and is intended for structural applications including rod, bar, tube
and profiles.
Table 3.2
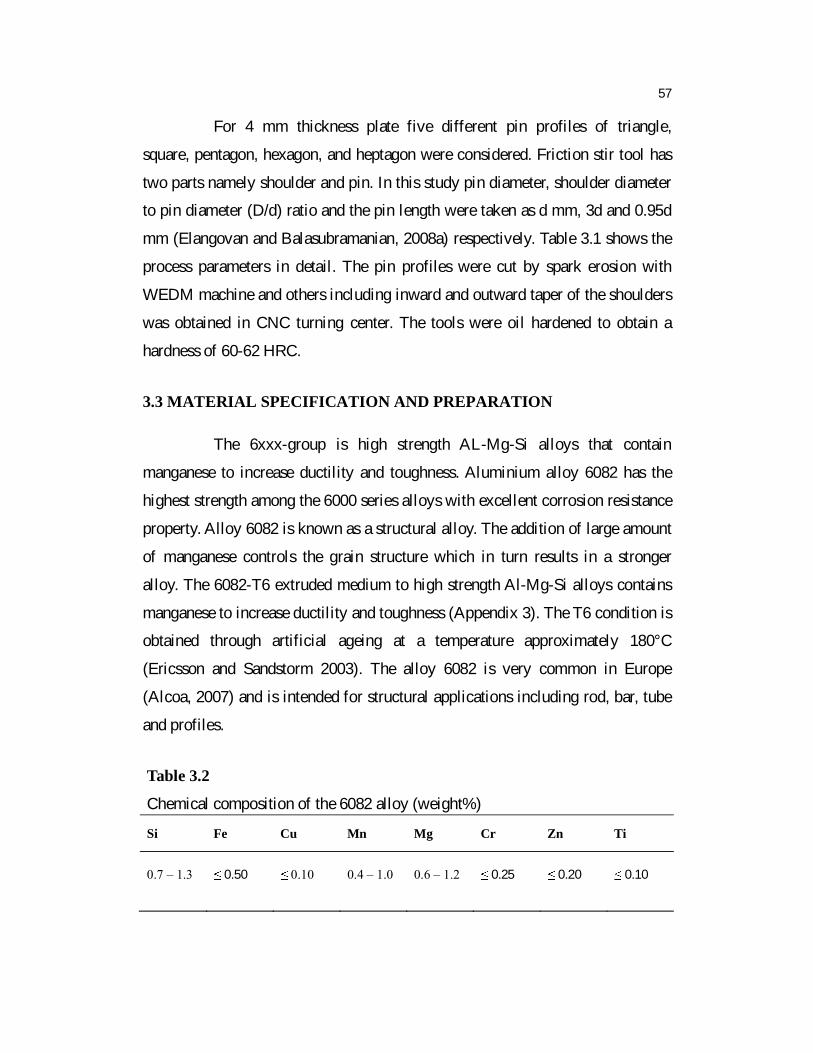
Chemical composition of the 6082 alloy (weight%)
Si Fe Cu Mn Mg Cr Zn Ti
0.7 � 1.3 0.50 0.10 0.4 � 1.0 0.6 � 1.2 0.25 0.20 0.10

58
Table 3.3
Mechanical properties of the 6082 alloy
Thickness of the Material
Yield Strength (MPa)
Ultimate Strength (MPa)
Elongation (%)
Hardness (HV)
Density(g/cm3 )
Melting Point (°C)
4 mm 221.02 303.80 11.0 91-96 2.70 555
6 mm 223.25 306.85 11.0 93-98 2.70 555
8 mm 225.22 308.55 11.5 93-98 2.70 555
Composition of the AA 6082-T6 material is presented in Table 3.2.
The tensile specimen was prepared as per ASTM E8M-04 standard (2006) and
the base metal has been tested on the Universal Testing Machine. Micro Vickers
hardness of the AA 6082-T6 base material was measured. The results are shown
in Table 3.3.
3.4 MATHEMATICAL TOOLS FOR OPTIMIZING THE WELDING
PARAMETERS
3.4.1 Taguchi Experimental Design Technique
Taguchi Experimental Design Technique, Orthogonal Array, (Philip J
Rose 2005; Nicolo Belavendran, 1995; Montgomery 2001; Box et al, 1978)
assesses the influence of factors on the response, the means and the signal-to-
noise ratios (S/N) for each control factors which are to be calculated. Signals are
indicators of effect on average response and noises are a measure of deviations
from experiment output. The appropriate S/N ratio must be chosen using
previous knowledge, expertise and understanding of the process. In this study,
S/N ratio has been chosen based on the quality characteristic, �larger-the-better�

59
in order to maximize the response. In Taguchi Method, S/N ratio ( j) in the jth
experiment is expressed in equation (3.2).
j =-10 log [1/n (1/Yijk2)] (3.2)
Where �n� is the number of tests and �Yijk� is an experimental value of
�i' th quality characteristics in �j� th experiment at �k� th test. In the present study,
tensile strength was measured from the samples and the data are analyzed to
determine the effect of FSW process parameters. Experimental results are
transformed into means and S/N ratio.
Analysis of the mean for each of the experiments gives better
combination of parameter levels. The mean response refers to an average value
of performance characteristics for each parameter at different levels. Means for
one level is calculated as the average of all responses that are obtained within
that level. Analyzing means and S/N ratio of various process parameters, the
larger S/N ratio corresponds to better quality characteristics. Therefore, optimal
level of process parameters is at the level of highest S/N ratio.
3.4.2 Response Surface Methodology
The statistical experimental designs most widely used in optimization
experiments are termed "response surface designs." In addition to the trials at the
extreme level settings of the variables, response surface designs contain trials in
which one or more of the variables are set at the central level of the study range
(other levels in the interior of the range may also be represented). Thus, these
designs provide information on direct effects, pairwise interaction effects and
curvilinear variable effects. Response surface methodology approach to product
and process optimization work (Box et al, 1978; Montgomery 2001).

60
Figure 3.5 - Central composite circumscribed (CCC) design
A Box-Wilson Central Composite Design, commonly called a central
composite design, contains an imbedded factorial or fractional factorial design
with center points that is augmented with a group of `star points' that allow
estimation of curvature. If the distance from the center of the design space to a
factorial point is ±1 unit for each factor, the distance from the center of the
design space to a star point is ± with | | > 1. The precise value of depends on
certain properties desired in the design and on the number of factors involved.
The Central Composite Circumscribed (CCC) explores the largest
process space and the Central Composite Inscribed (CCI) explores the smallest
process space. Both the CCC and CCI are rotatable designs, but the Central
Composite Face-centered (CCF) is not. In the CCC design, the design points
describe a circle circumscribed about the factorial square. For three factors, the
CCC design points describe a sphere around the factorial cube.

61
Central composite circumscribed designs are the original form of the
central composite design. The star points are at some distance from the center
based on the properties desired in the design and the number of factors in the
design. The star points establish new extremes for the low and high settings for
all factors. Figure 3.5 presents a rotatable CCD for time and temperature using
the previously defined lower and upper variable bounds.
When all independent variables are measurable, controllable and
continuous in the experiments, with negligible error, then the response surface
can be expressed by
y = f (x1, x2,��, xk)
Where, �k� is the number of independent variables. To optimize the
response �y�, it is necessary to find an appropriate approximation for the true
functional relationship between the independent variables and the response
surface. Usually a second-order polynomial equation (3.3) is used in RSM.
y = bo + biXi + biiXii2+ bijXiXj+ (3.3)
The test was designed based on a five factors at five levels; central
composite rotatable design with full replication consisting of 32 experimental
runs (Gopalakrishnan and Murugan 2011) allowed the prediction of
mathematical model and the influence of parameters on the mechanical
properties. The Friction stir welding input variables are spindle speed, welding
speed, shoulder penetration, pin profile and shoulder profile. A statistical
software �Minitab� was used to code the variables and to establish the design
matrix to obtain the required equation.

62
3.5 TESTING OF WELDS
Figure 3.6 - Universal testing machine
Tensile tests provide information on the strength and ductility of
materials under uniaxial tensile stresses. This information may be useful in
comparisons of materials, alloy development, quality control, and design under
certain circumstances. The results of tension tests of specimens machined to
standard dimensions from selected portions of a part or material may not totally
represent the strength and ductility properties of the entire end product or its in-
service behavior in different environments. These test methods are considered
satisfactory for acceptance testing of commercial shipments. The test methods
have been used extensively in the trade for this purpose. The tensile specimen
was prepared as per ASTM E8M-04 standard (2006) and the base metal as well
as the welded joints has been tested on the TUE-CN-1000 Universal Testing
Machine as shown in Figure 3.6.

63
Figure 3.7 - Vickers micro hardness tester
The Vickers micro hardness method is based on an optical
measurement system. The Micro hardness test procedure, ASTM E-384,
specifies a range of light loads using a diamond indenter to make an indentation
which is measured and converted to a hardness value. It is very useful for testing
a wide type of materials as long as the test samples are carefully prepared. A
square base pyramid shaped diamond is used for testing in the Vickers scale.
Typically loads are very light, ranging from a few grams to one or several
kilograms, although "Macro" Vickers loads can range up to 30 kg or more. The
Micro hardness methods are used to test metals, ceramics, and composites.
Sample preparation is necessary with a micro hardness test in order to
provide a small enough specimen that can fit into the tester. Additionally, the
sample preparation will need to make the specimen�s surface smooth to permit a
regular indentation shape and good measurement, and to ensure that the sample
can be held perpendicular to the indenter. Usually, the prepared samples are

64
mounted on a plastic medium to facilitate preparation and testing. The
indentations should be as large as possible to maximize the measurement
resolution. (The error is magnified as indentation sizes decrease) The test
procedure is subject to problems of operator influence on the test results. Micro-
hardness of the welds was measured at a test load of 5 N for 10 seconds. The
indentations were made at the midsection of the thickness of the plates across the
joint using Mitutoyo Vickers Micro hardness tester as shown in Figure 3.7.
3.6 METALLOGRAPHIC INVESTIGATION
To reveal the true microstructure of a material, the following points
must be observed during the specimen preparation. Surface undulation must be
completely removed using an appropriate etchant. Surface undulation can be
implanted into the surface of the specimen by sectioning, grinding and polishing.
Induced surface undulation falls into two categories, gross undulation and plastic
undulation. The gross undulation may be visible before surface preparation and
can be attributed to the method used to remove the sample from its original
surroundings and the planar grinding steps. The plastic undulation is hidden by
the gross undulation and is complementary to it. For successful specimen
preparation, all the stages of undulation must be removed or reduced to a
negligible level.
Metallographic analysis is an experience based practice. Many guides
for specimen preparation give a basic and universal approach to this science,
however each material is different and may require alterations to certain
preparatory steps in order to produce the correct images. The list below briefly
shows the different stages of sample preparation, in order to ensure a quality
surface finish and correct imaging of the aluminium alloy 6082 investigated.
1. Sampling - Choosing the specimen.
2. Sectioning - Removing the area of interest.

65
3. Encapsulation � Mounting the specimen.
4. Grinding and polishing - Removing all the surface undulations and
irregularities to provide a undulation free surface.
5. Initial visual examination - Preparation quality assessment.
6. Etching - Highlighting of specific material characteristics.
7. Visual examination - Microstructural interpretation.
8. Quantitative Metallography - Obtaining data from the prepared
specimen.
9. Data interpretation - Drawing conclusions from the data.
The samples mounted for micro structural observation are cut from
the weld in the transverse direction to study the weld structure in detail. A piece
of 5 mm x 2 mm x 2 mm is cut from the welded sheets across the weld. The
samples are ground on a grinder, to smoothen the edges and to get an even
surface, for studying the micro structure. Mounting is done on a Buehler
automatic mounting press with black phenolic powder.
The mounted samples are polished on emery paper of grit 400, 600
and 800 with a combination of water and diamond paste for smooth finish. The
final stage of polishing is on smooth cloth with a diamond suspension liquid for
smooth finish. The samples are etched after polishing to reveal the
microstructure clearly. The acids in the etchant attack the grain boundaries and
give a clear image of the size of the grains. The agent used for aluminum alloys
is Keller�s etchant, which is prepared by adding 1 percent of hydrofluoric acid
by volume, 1.5 percent of hydrochloric acid by volume, 2.5 percent of nitric acid
by volume and 95 percent of distilled water by volume. The etched samples are
washed thoroughly to remove the carbon deposits and make dry to study the
microstructure under the optical microscope.
In this work, the welded plates were cut at mid welded portion and
specimens of size 40 mm x 10 mm x 4 mm, 40 mm x 10 mm x 6 mm and 40 mm

66
x 10 mm x 8 mm were obtained for metallographic study. The samples were
prepared as per standard metallographic procedure from the welded plates and
macro etched using Keller�s solution (Beraha and Shpigler 1977). The images of
the macrograph of the etched specimen were captured using an optical scanner.
The metallographic study was carried along the various zones of the parent
metal, heat affected zone, thermo mechanically affected zone and weld nugget
across the cross sections of friction stir welded specimens using scanning
electron microscope (SEM) and energy dispersive X-ray spectrometer (EDS)
(Liu et al 1997; Rhodes et al 1997; Flores et al 1998; Su et al 2003; Sutton et al
2002).
Scanning Electron Microscopes (SEM) are used for inspecting
topographies of materials with a magnification range that encompasses that of
optical microscopy and extends it to the nanoscale. SEM can scan the surface of
a sample with a finely focused electron beam to produce an image from the
beam-specimen interactions detected by a wide array of detectors. A variety of
detectors are available, from secondary electron detectors to provide surface
information, to backscattered detectors for compositional information in both
high and low vacuum modes.
3.7 HEAT ENERGY IN FRICTION STIR WELDING
Heat generated from friction between tool shoulder and workpiece
was implemented as the heat input (Chao and Qi 1998). The empirical equation
for calculating the heat input to the workpiece is given by equation (3.4).
Q(r) = 3Qt / 2 (ro3 ri
3) (3.4)
Where Q(r) is the rate of heat input, ro and ri are the radii of the
shoulder and the nib of the pin tool, and Qt is the total rate of heat input to the
work piece expressed as shown in equation (3.5).

67
Qt = F (ro2+rori+ri
2) / 45 (r0+ri) (3.5)
Where, is the tool rotational speed, is the frictional coefficient,
and F is the downward force. The total heat developed is fully dependent on the
tool rotation speed and the axial force. The axial force is must to have the tool
material contact to generate the heat. But if the axial force is excess, the tool will
penetrate inside the work. So, the axial force is constant and negligible compared
to the tool rotation speed. The total heat generated will travel along the joint
interface to have weld. If this travelling speed is slower, then the total heat is
concentrated to that short span of the area. If the travel speed is faster, then the
total heat is dissipated to the larger span of the area. This can be expressed by
Q Spindle speed or Tool rotation speed and
Q (Welding speed or Travel speed) -1
The combination of higher spindle speed and lower weld speed
generates a more amount of heat during friction stir welding. Similarly, the lower
spindle speed and higher weld speed combination does not produce sufficient
heat. The deduced working zone or range of parameters is 700 rpm to 1500 rpm
spindle speed and 0.8 mm/sec to 4.0 mm/sec weld speed. From this the higher
spindle speed and lower weld speed combination, produces a higher amount of
heat during welding termed (Rodrigues 2009) as �hot weld� (HW) and the lower
spindle speed and higher weld speed combination produces lesser amount of
heat during welding termed as �cold weld� (CW). The optimum condition
combination obtained through experimental design technique is termed as �weld
at optimum condition� (WOC). HW is designated for the parameter condition of
1500 rpm spindle speed and 0.8 mm/sec weld speed. CW is designated for the
parameter condition of 700 rpm spindle speed and 4.0 mm/sec weld speed.