chapter 3 rapid growth and economic transformation in...
TRANSCRIPT

Mozambique’s economic growth after 1992 and thepoverty alleviation achieved since then constitutean extremely successful development take-off.
Average real GDP growth rate soared from 0 percent(1981–1992) to 8.1 percent (1993–2008), makingMozambique the fastest-growing non-oil economy in Sub-Saharan Africa over the period (AfDB 2009) (figure 3.1). Asa result, per capita GDP has doubled since 1992 (figure 3.2).The poverty headcount dropped rapidly during the earlyyears of this process, falling from 69 percent in 1996 to 54 percent in 2002.
The political stability brought about by the end of thearmed conflict in 1992, a first wave of structural reformscoinciding with responsible macroeconomic policies, andthe support of the international donor community havebeen the bedrock of Mozambique’s transformation.They have enabled the country to better face the develop-ment challenges that lie ahead—in particular, how to tapinto the country’s resources (labor and land) and the entre-preneurial drive of its people to promote strong, sustain-able, and inclusive economic growth. Large mineralresources and the recent growth in extraction activities isallowing Mozambique to expand further its developmentstrategy. On the one hand this new revenue source canallow the country to become less dependent on foreign aidand define with more independence new elements of itsdevelopment agenda. On the other, it raises a number oftextbook challenges such as how to trigger externalities
65
Rapid Growth and EconomicTransformation in Mozambique,1993–2009Antonio M. D. Nucifora and Luiz A. Pereira da Silva
C H A P T E R 3
(e.g., job creation) in other sectors and how to effectivelyemploy these revenues, while improving governance andaccountability.
This chapter provides a brief overview of Mozambique’sprofound economic transformation and highlights themajor drivers of change and the challenges ahead. It doesnot discuss the macroeconomic policies and performancethat underpinned the economic transformation over thepast two decades (for a detailed discussion of macroeco-nomic and stabilization issues in Mozambique, see Clementand Peiris 2008).
GROWTH DRIVERS AND ECONOMICTRANSFORMATION
Sound macroeconomic environment allowed donors tocontribute substantial amounts of aid to Mozambique,averaging about 14 percent of GDP a year since 1993 (figure3.3). That aid inflows have remained fairly constant as a per-centage of GDP over the period, during a period when theeconomy grew at an average annual rate of more than 8 per-cent, reflects the rapid growth in aid inflows in U.S. dollarterms. These large inflows financed investments in educa-tion and health, as reflected in the rapid improvements inhuman development indicators (table 3.1).1 They alsofinanced substantial investments in rebuilding the country’sroads, ports, and railways, which had been shattered by 16 years of war.

Good macroeconomic management also attracted sub-stantial foreign direct investment (FDI). FDI inflowsincreased from an average of 1.5 percent of GDP in1993–98 to an average of 5.2 percent of GDP in 1999–2010(figure 3.4). In 2009 and 2010 FDI reached an estimated$900 million, about 9 percent of GDP. A large part of these
inflows has funded large investment projects in the miningsector, underpinning recent export performance inMozambique.
From a supply-side perspective, capital accumulation,higher quality–adjusted labor input, and positive aggregateproductivity performance were important determinants of
66 CHAPTER 3: RAPID GROWTH AND ECONOMIC TRANSFORMATION IN MOZAMBIQUE, 1993–2009
–20
–15
–10
–5
0
5
10
15
20
1981
1983
1985
1987
1989
1991
1993
1995
1997
1999
2001
2003
2005
Perc
ent
Mozambique Sub-Saharan Africa (median)
Figure 3.1 Real GDP Growth in Mozambique and Sub-Saharan Africa, 1981–2005
Source: World Bank World Development Indicators various years.
–300
–200
–100
0
100
200
300
400
1980
1982
1984
1986
1988
1990
1992
1994
1996
1998
2000
2002
2004
2006
In c
onst
ant
(200
0) U
S$
Mozambique Sub-Saharan Africa (median)
Distance from median
Figure 3.2 Per Capita GDP in Mozambique and Sub-Saharan Africa, 1980–2006
Source: World Bank World Development Indicators various years.

growth in Mozambique. Growth accounting exercises indi-cate that physical investments partly associated with mega-projects and significant improvements in education led togrowth dynamics heavily influenced by the accumulation ofhuman (quality-adjusted) and physical capital between1993 and 2008. Figure 3.5 shows the average capital contri-bution to growth strengthening from 1999 onward, a resultconsistent with the timing of mega-projects. Aggregate pro-ductivity growth (total factor productivity)—measured asthe residual of output growth after labor and capital contri-
butions are subtracted—was also important. Figure 3.6 sug-gests roughly balanced growth of inputs and productivity.2
Productivity increases contributed about a third to overallgrowth between 1993 and 2008. These results are broadlyconsistent with those of Jones (2006) and Vitek (2010).3
Jones presents evidence suggesting a positive contribution(crowding in) of public capital accumulation in the after-math of the civil war, which opened the door for privateinvestment to play an increasingly important role inMozambique’s growth.
CHAPTER 3: RAPID GROWTH AND ECONOMIC TRANSFORMATION IN MOZAMBIQUE, 1993–2009 67
0
Perc
ent
of G
DP
Mill
ions
of d
olla
rs
5
10
15
20
0
500
1,000
1,500
2,000
Gross aid inflows (USD million), lefthand side
Gross aid inflows (percent of GDP), righthand side
1998
1999
2000
2001
2002
2003
2004
2005
2006
2007
2008
2009
2010
(pro
jected
)
Figure 3.3 Gross Annual Aid Inflows to Mozambique, 1998–2010
Source: Bank of Mozambique, IMF, and World Bank.
Table 3.1 Selected Social Indicators for Mozambique, 1990–2008
Indicator
Latest single year
1990–1996 2000–03 2006–08
Primary school enrollment (net %) 43.000 56.000 96.000Primary school enrollment (gross %) 61.000 84.000 105.000Ratio of girls to boys in primary
and secondary education (%) 72.000 75.000 85.000Under-5 mortality rate
(per 1,000 live births) 212.000 178.000 138.000Infant mortality rate
(per 1,000 live births) 145.000 122.000 93.000Life expectancy at birth (years) 27.000 42.000 42.000Physicians per 1,000 people 0.012 0.024 0.030Inmunization, DPT (% of children
under 12 months) 60.000 72.000 72.000Inmunization, measles (% of
children under 12 months) 58.000 77.000 77.000Access to improved water
sources (% of population) 39.000 42.000 48.000Access to sanitation facilities
(% of population) 22.000 27.000 31.000
Source: World Bank staff, based on data from Instituto National de Estatistica.Note: Latest single year means the latest year for which data are available in a given period.

A level change in aggregate investment from mega proj-ects triggered strong export and import activity from 1999onward, with direct impact on aggregate demand. Theexpenditure components of output (figure 3.7) indicatethat GDP and consumption have been trending up sincethe end of the civil war but that growth after 1999 has beendifferent. Strong investment performance starting in1999—which matured into strong export performancefrom 2001 onward—allowed for continued increases inoutput and consumption at the same time that importswere growing. This pattern inaugurated a different growthmodel for Mozambique, whereby strong exports, thoughoffset by accompanying imports, reflected stronger privatesector activity.
More recently, as a result of sharp increases in the price ofaluminum from 2004 onward, the pace of profit repatriation
68 CHAPTER 3: RAPID GROWTH AND ECONOMIC TRANSFORMATION IN MOZAMBIQUE, 1993–2009
0
2
4
6
8
10
0
200
400
600
800
1,000
FDI (millions of dollars), left hand side
FDI (Percent of GDP), right hand side
Perc
ent
of G
DP
Mill
ions
of d
olla
rs
1998
1993
1994
1995
1996
1997
1999
2000
2001
2002
2003
2004
2005
2006
2007
2008
2009
2010
(pro
jected
)
Figure 3.4 Foreign Direct Investment in Mozambique, 1993–2010
Source: Bank of Mozambique.
–6–4–202Pe
rcen
t
468
101214
Capital contribution
Total factor productivity GDP growth
Labor contribution (quality adjusted)
1998
1993
1994
1995
1996
1997
1999
2000
2001
2002
2003
2004
2005
2006
2007
2008
Figure 3.5 Decomposition of Growth in Mozambique by Factors, 1993–2008
Source: World Bank staff calculations based on World Development Indicators (World Bank various years).
Capital
Total factor productivity
Labor (quality-adjusted)
45%
23%
32%
Figure 3.6 Average Factor Contributions to Growth inMozambique, 1993–2008
Source: World Bank staff calculations based on World Development Indica-tors (World Bank various years).

associated with mega-projects has widened the gap betweenGNP and GDP (figure 3.8). This stylized fact is a reminderof a key challenge for the country: the need to complimentthe current export drive based on mega–projects with adiversification strategy that activates a broader set of growthdrivers and taps more effectively into Mozambique’s more
abundant factors of production, particularly labor, land, andentrepreneurial drive.
Although the private sector has spearheaded large mega-projects in the mining sector, its role in economic growthover the past decade should not be overemphasized.Sonne-Schmidt, Arndt, and Magaua (2008) developed a
CHAPTER 3: RAPID GROWTH AND ECONOMIC TRANSFORMATION IN MOZAMBIQUE, 1993–2009 69
0
20,000
40,000
60,000
80,000
100,000
120,000
140,000
160,000
1993
1994
1995
1996
1997
1998
1999
2000
2001
2002
2003
2004
2005
2006
Mill
ions
in lo
cal c
urre
ncy
Consumption Investment Exports Imports GDP
Figure 3.7 Components of GDP Expenditure in Mozambique, 1993–2006
Source: World Bank 2010a.
0
20,000
40,000
60,000
80,000
100,000
120,000
140,000
160,000
180,000
0
2
4
6
8
10
12
14
1993
1994
1995
1996
1997
1998 19
9920
0020
0120
0220
0320
0420
0520
0620
0720
08
Mill
ions
in lo
cal c
urre
ncy
Gro
wth
rat
e (%
)
GDP growth rate (left hand side) GNP growth rate (left hand side)
GDP level (right hand side) GNP level (right hand side)
Figure 3.8 Gap between GDP and GNP in Mozambique, 1994–2007
Source: World Bank 2010a.

methodology to evaluate the direct contribution of threekey operational mega-projects (Mozal, Sasol, and Moma)to growth at factor cost. They conclude that the directeffects of these mega-projects were an increase in theaverage annual growth rate between 1996 and 2006 ofabout 1 percentage point (average annual growth rate wasabout 8 percent). Moreover, as foreign-owned, capital-intensive, export-oriented companies benefiting fromfiscal exemptions, mega-projects made only a small contribu-tion to job creation, tax revenue, use of domestic intermedi-ate inputs, and profit reinvestment in Mozambique.
Benito-Spinetto and Moll (2005) present similar results.Using a computable general equilibrium (CGE) model toreplicate the performance of the Mozambican economy,they find that about half of the 8 percent average GDPgrowth during 1994–2004 was driven by catch-up growth inthe agricultural sector (as people returned to the fields fol-lowing the end of the war), a quarter was driven by thegrowth in aid inflows (and the resulting investments insocial and physical infrastructure sectors), and a quarterwas equally divided between mega-projects and growth inother private sector activities. Clearly, the initial bet onmega-projects, despite the usual uncertainty in quantifyingtheir precise economic effects, rested more on their capacityto generate immediate revenue rather than truly createdownstream externalities (especially jobs and demand forindustrial and services inputs).
Indeed, the positive total factor productivity reflectsthe reshuffling of labor resources and a rapid transforma-tion in the output structure of the economy. In a postwarcontext—where reconstruction efforts, a first wave ofstructural reforms, and a stabilized macroeconomic envi-ronment spurred private sector activity—the Mozambicaneconomy posted double-digit growth rates in mining,manufacturing, construction, electricity, gas, and water.Sectoral output shares experienced substantial changesbetween 1993 and 2006, especially in agriculture, whichnearly halved its output participation, despite the positivecontributions of agriculture to overall economic growth(figures 3.9 and 3.10). Sectoral output reflects a deeptransformation to more productive sectors that generatedpositive composition effects in aggregate productivity.4
Nevertheless, although economic growth has been strongand has underpinned the process of economic transfor-mation, the structure of the economy still remains nar-rowly based on subsistence agriculture and a few isolated,albeit large, mega-projects. Agriculture, which employedabout 78 percent of the economically active population,accounted for 25 percent of GDP in 2009. It was followedby manufacturing (12 percent, two-thirds of which wasaccounted for by one large aluminum smelter); trade andretail services (11 percent); transport and communica-tions (10 percent); financial services (7 percent); andextractive industries (1 percent). Going forward, a key
70 CHAPTER 3: RAPID GROWTH AND ECONOMIC TRANSFORMATION IN MOZAMBIQUE, 1993–2009
–5
0
5
10
15
Perc
ent
20
1994
1995
1996
1997
1998
1999
2000
2001
2002
2003
2004
2005
2006
Agriculture Mining Manufacturing Electricity, gas, and water
Construction Services GDP growth
Figure 3.9 Sectoral Contribution to Growth in Mozambique, 1994–2006
Source: World Bank various years.

CHAPTER 3: RAPID GROWTH AND ECONOMIC TRANSFORMATION IN MOZAMBIQUE, 1993–2009 71
0
5
10
15
20
25
30
35
40
45
0
5
10
15
20
25
30
35
40
45
Agricu
lture
Manufa
cturin
g
Constr
uctio
n
Electr
icity,
gas,
and
water
Mining
Rea
l gro
wth
rat
e (p
erce
nt)
Sect
oral
sha
re (
perc
ent)
1993 Share 2008 Share Average annual real growth (93–08)
Figure 3.10 Changes in Sectoral Output Share in Mozambique, 1993–2008
Source: World Bank various years.
challenge is not only to support the continuation ofintersectoral (structural) transformations but to ensurewithin-sector productivity gains by addressing impedi-ments to microeconomic efficiency (World Bank 2008a).
Economic transformation in Mozambique entailed aprofound rebalancing of sectoral roles, with the (pri-vate) service sector absorbing labor at a particularlystrong pace. Agriculture displays the lowest level of laborproductivity of all sectors (figure 3.11). Between 1996and 2003 its output contribution to GDP fell by 6 per-centage points (to 27 percent), and its share of employ-ment in the total labor force fell by 8 percentage points(to 82 percent) (figure 3.12). Although output shareswere gained primarily by the industry sector, employ-ment shares were gained by the private service sector.
While the increase in the employment share of the pri-vate service sector has benefited the poor (World Bank2008b),5 the challenge to generate an even greater numberof jobs at higher levels of the value chain remains. Theoverwhelming concentration of employment (more than78 percent) remains in agriculture. In urban areas, retailtrade and vehicle repair employ a quarter of all workers;manufacturing industries employ 7.5 percent (table 3.2).
Formal employment generation has been very limited inrecent years and is confined to a few large companies. Estab-lishment-level data from a sample of 600 firms suggest thatlarge firms (more than 100 employees) and some medium-large firms (about 100 employees) were responsible for themajority of jobs created in the manufacturing, services, con-
struction, and transportation sectors between 2003 and2006 (table 3.3).6 The dominance of large companies in for-mal employment generation reflects the lack of growth insmall and medium enterprises. The “entry margin” (cre-ation of formal jobs through new firms) also appears con-siderably more stifled for micro and small firms than formedium and large firms, perhaps a reflection of the fact thatentry costs and overall business environment constraintsimpinge more severely on smaller producers.
The concentration of the economy in a few large compa-nies is also reflected in export patterns. The export basketremains extremely limited, with only 15 products register-ing exports of more than $1 million a year. More than halfof Mozambique’s exports remain concentrated in the Mozalaluminum smeltering enclave (figure 3.13), virtually all ofwhose production goes to the European Union. Electricityand gas are also important export products (bought largelyby South Africa).
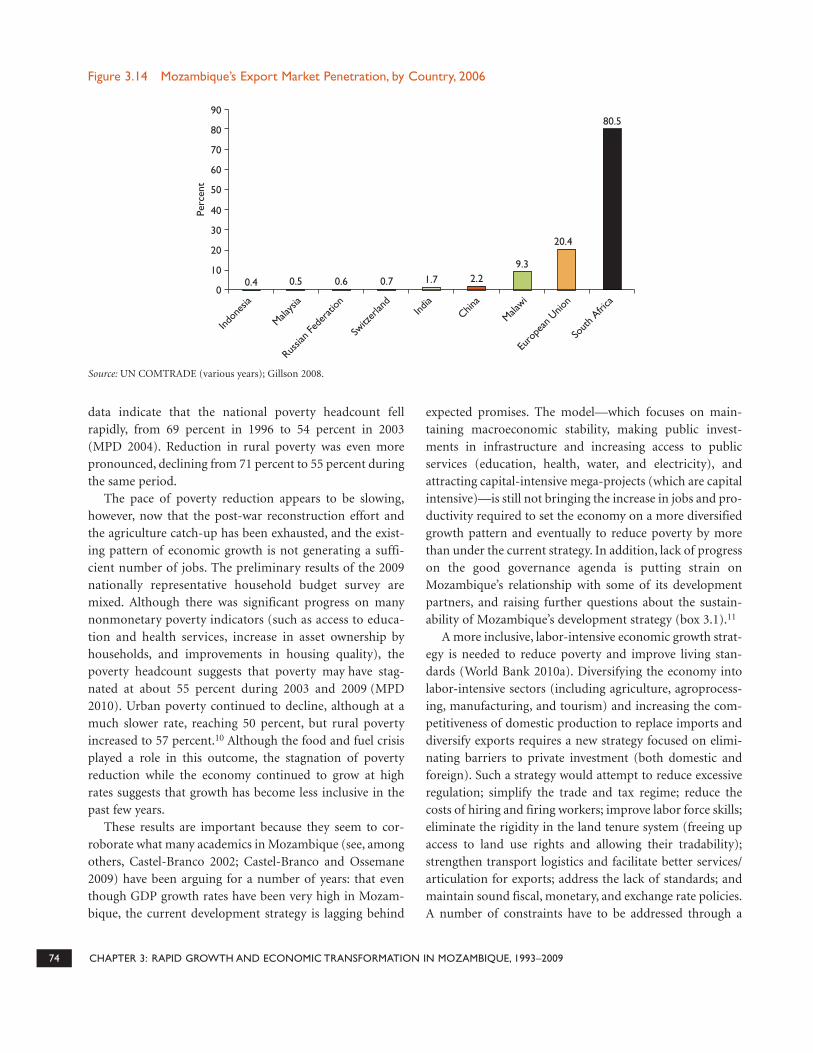
Overall, Mozambique’s exports increased significantly(in real terms), with average annual growth rates of14.9 percent over 1995–99 and 19.8 percent over 2000–08.Most of this growth, however, was driven by exports fromthe mega-projects; although excluding mega-projects,exports grew at an average rate of 10 percent a year during2000–08, which represents a reasonable performance.Progress in penetrating Southern Africa DevelopmentCommunity (SADC) countries continues; Mozambiqueshould position itself to exploit non–SADC markets aswell. Mozambique exploits only 2 percent of the potential

72 CHAPTER 3: RAPID GROWTH AND ECONOMIC TRANSFORMATION IN MOZAMBIQUE, 1993–2009
–60
–40
–20
0
20
40
60
80
100
–50 0 50 100 150 200
Change in employment share between 1996 and 2003 (percent)
Cha
nge
in o
utpu
t sh
are
betw
een
1996
and
200
3 (p
erce
nt)
Industry Services (public) Services (private) Agriculture
Figure 3.12 Changes in Employment versus Output Shares in Mozambique, by Sector, 1996–2003
Source: World Bank 2008b.Note: Services (private) include trade, and transport. Services (public) include health, education, and public administration. The larger the bubble, thehigher the labor productivity.
0
5
10
15
20A
vera
ge la
bor
prod
uctiv
ity n
orm
aliz
edto
agr
icul
ture
25
30
Industry Services (private) Services (public)
1996 2003
Figure 3.11 Labor Productivity in Mozambique by Sector (Relative to Agriculture), 1996 and 2003
Source: World Bank 2008b.Note: Figures are normalized to agriculture.
bilateral flows for all the products it exports (Gillson2008).7 Although this is comparable to other countries inthe region, it is far lower than the levels achieved by moreadvanced and better integrated economies (such as SouthAfrica) (figure 3.14).8
A STRATEGY FOR BROADLY SHAREDECONOMIC GROWTH
Rapid economic growth was accompanied by significantstrides in reducing poverty during the stabilization phase,after the peace accords and up to 2003.9 Household survey

CHAPTER 3: RAPID GROWTH AND ECONOMIC TRANSFORMATION IN MOZAMBIQUE, 1993–2009 73
Table 3.2 Distribution of Employment in Mozambique, by Sector, Gender,and Location, 2004/05(percent)
Sector Total Men Women Urban Rural
Agriculture and fishing 78.5 68.0 87.3 40.1 92.7Extractive industries 0.3 0.6 0.0 0.4 0.2Manufacturing industries 3.1 5.4 1.2 7.5 1.5Electricity, water, and construction 1.2 2.6 0.1 3.5 0.4Retail trade and vehicle repair 9.2 11.7 7.0 25.9 3.0Transport and communication 0.8 1.6 0.1 2.6 0.1Financial services and rental 2.9 3.9 2.0 9.5 0.5Administration 1.7 2.9 0.7 5.3 0.4Education 1.6 2.3 1.0 3.5 0.9Health and social work 0.7 0.8 0.5 1.6 0.3
Source: INE 2006.
Table 3.3 Number of Full-Time Employees in Sample of 600 Firms in Mozambique, by Firm Size, 2003 and 2006
Firm size
Growth rate innumber of
employees between2003 and 2006
(percent)Number of
employees in 2003Number of
employees in 2006In firms created
before 2003In firms created
after 2003
Micro 63 408 666 190 68Small 35 2,064 2,803 493 246Medium 36 4,630 6,323 992 701Large 60 2,922 4,685 772 991Total 44 10,024 14,477 2,447 2,006
Source: World Bank 2010b.Note: Full-time employment in 2003 was used to determine firm size. For firms created after 2003, employment in 2006 was used to determinefirm size.
1452
226 193 15271 62 58 37 33 31 26 5 5 3 2
0
200
400
600
800
1,000
1,200
1,400
1,600
Aluminu
m
Electr
icity
Tobac
co GasSu
gar
Froz
en sh
rimp
Cotto
n
Woo
d pro
ducts
Cashew
nuts
Sesam
e see
ds
Titaniu
m
Bana
nas
Cocon
ut o
ilTea
Maize
Mill
ions
of d
olla
rs
Figure 3.13 Mozambique’s Main Exports, 2008
Change in number of employees between 2003 and 2006
data indicate that the national poverty headcount fellrapidly, from 69 percent in 1996 to 54 percent in 2003(MPD 2004). Reduction in rural poverty was even morepronounced, declining from 71 percent to 55 percent duringthe same period.
The pace of poverty reduction appears to be slowing,however, now that the post-war reconstruction effort andthe agriculture catch-up has been exhausted, and the exist-ing pattern of economic growth is not generating a suffi-cient number of jobs. The preliminary results of the 2009nationally representative household budget survey aremixed. Although there was significant progress on manynonmonetary poverty indicators (such as access to educa-tion and health services, increase in asset ownership byhouseholds, and improvements in housing quality), thepoverty headcount suggests that poverty may have stag-nated at about 55 percent during 2003 and 2009 (MPD2010). Urban poverty continued to decline, although at amuch slower rate, reaching 50 percent, but rural povertyincreased to 57 percent.10 Although the food and fuel crisisplayed a role in this outcome, the stagnation of povertyreduction while the economy continued to grow at highrates suggests that growth has become less inclusive in thepast few years.
These results are important because they seem to cor-roborate what many academics in Mozambique (see, amongothers, Castel-Branco 2002; Castel-Branco and Ossemane2009) have been arguing for a number of years: that eventhough GDP growth rates have been very high in Mozam-bique, the current development strategy is lagging behind
expected promises. The model—which focuses on main-taining macroeconomic stability, making public invest-ments in infrastructure and increasing access to publicservices (education, health, water, and electricity), andattracting capital-intensive mega-projects (which are capitalintensive)—is still not bringing the increase in jobs and pro-ductivity required to set the economy on a more diversifiedgrowth pattern and eventually to reduce poverty by morethan under the current strategy. In addition, lack of progresson the good governance agenda is putting strain onMozambique’s relationship with some of its developmentpartners, and raising further questions about the sustain-ability of Mozambique’s development strategy (box 3.1).11
A more inclusive, labor-intensive economic growth strat-egy is needed to reduce poverty and improve living stan-dards (World Bank 2010a). Diversifying the economy intolabor-intensive sectors (including agriculture, agroprocess-ing, manufacturing, and tourism) and increasing the com-petitiveness of domestic production to replace imports anddiversify exports requires a new strategy focused on elimi-nating barriers to private investment (both domestic andforeign). Such a strategy would attempt to reduce excessiveregulation; simplify the trade and tax regime; reduce thecosts of hiring and firing workers; improve labor force skills;eliminate the rigidity in the land tenure system (freeing upaccess to land use rights and allowing their tradability);strengthen transport logistics and facilitate better services/articulation for exports; address the lack of standards; andmaintain sound fiscal, monetary, and exchange rate policies.A number of constraints have to be addressed through a
74 CHAPTER 3: RAPID GROWTH AND ECONOMIC TRANSFORMATION IN MOZAMBIQUE, 1993–2009
0.4 0.5 0.6 0.7 1.7 2.29.3
20.4
80.5
0
10
20
30
40
50
60
70
80
90
Perc
ent
Indon
esia
Malays
ia
Russia
n Fed
erati
on
Switz
erlan
dInd
iaChin
a
Malawi
Euro
pean
Unio
n
Sout
h Afri
ca
Figure 3.14 Mozambique’s Export Market Penetration, by Country, 2006
Source: UN COMTRADE (various years); Gillson 2008.

CHAPTER 3: RAPID GROWTH AND ECONOMIC TRANSFORMATION IN MOZAMBIQUE, 1993–2009 75
Box 3.1 Signs of Political Maturity: Is Mozambique’s “Aid-Supported Growth Engine” Beginning to Shift?
Aid flows needed to finance public investments andexpand service delivery are becoming increasinglyuncertain in Mozambique but also for other Low IncomeCountries. This is due, in part, from the budgetary con-sequences of the 2008 global financial crisis in ODA allo-cation in many OECD countries.
OECD donors have been considering Mozambiquean emblematic success story since the 1990s, especiallysince the end of the Civil War (1992). Official develop-ment assistance flows were significant and relativelystable both for projects and for direct budget support,given the country’s good performance and “donor-agencies” high ratings. Throughout the early 2000schanges occurred in Mozambican politics: from a rela-tively strong showing in the first, post–Civil War elec-tions in 1994, RENAMO’s electoral results declinedsubsequently and posed a lesser threat to FRELIMO-dominated politics. Changes also affected the FRELIMOleadership, rotating toward a more business-orientedframework. With more investment opportunitiesbrought by macroeconomic stabilization, positivedonor sentiment, and increased aid inflows, amongother things, a shift toward a market-oriented frame-work took place, accentuated by the discovery in themid-2000s of significant mineral resources that trig-gered private sector interest and investment. In recentyears, the discovery of such sizable reserves of miner-als began to engender business interest in the countryby global players, triggering expectations of large,
private sector-led investments in these areas but also in the accompanying infrastructure for export corridors.
Inevitably these prospects brought more attentionto issues of economic governance such as the relation-ship between an emerging class of businesses andentrepreneurs with the dominant political elite. Fol-lowing several years of unhappiness about mixedprogress in the good governance agenda and fears thatincreasing growth of non-aid revenue would allowMozambique to become less aid-dependent. SomeOECD donors in late 2009 threatened to “cut budgetsupport” if very specific actions on political reformswere not urgently undertaken. While the 2009–10standoff has since been largely resolved, some of thereasons and the political dynamics that led to theimpasse appear to signal a structural change inMozambique’s relationship with the budget supportdonors. Many donors, however, consider such interfer-ence in the country's political affairs as unwarrantedand refrain from entering into this type of conditional-ity. In fact, the government has also started to considerdifferent possible scenarios to reduce its political vul-nerability to aid-dependence, ranging from the possibil-ity of revising some contracts with some mega-projectsthat benefit from generous tax incentives, or turning tosome of BRIC countries for support, in addition to theneed to expand the tax collection base and diversifyrevenues, among other strategies.
mix of simultaneous policy reforms, investments, andstrengthening of institutions. They can be categorized asbusiness environment, factor markets, trade logistics, andexport-supporting institutions.
Aggressive reforms are required to improve the businessenvironment and entice potential investors. First, the regula-tory environment is very unfriendly to small and mediumenterprises, and licensing, inspections, and red tape are aheavy burden. This is arguably the most important priorityneeding attention to unleash private sector potential, startingwith domestic investors. Second, the Mozambican tax andtariff system is characterized by many different exemptionswhose cumulative effects are unclear. Additionaly, smallentrepreneurs normally do not benefit from current exemp-tions, because they cannot afford the fixed cost involved in
applying for them. The standard statutory tax regime(excluding incentives) continues to place a substantial bur-den on investors, notably small domestic entrepreneurs. Thecombination of a statutory tax regime with relatively hightax rates with a generous system of tax incentives influencesinvestment decisions and the allocation of resources in away that is not immediately visible but distortionary in thelong run. One widely recognized distortion is that the pasttax regime encouraged industries that used more capitalrather than labor. Mozambique’s fiscal climate could besignificantly improved by simultaneously reducing fiscalincentives and the number and level of tax rates withoutcompromising government revenues. Third, despiteprogress in recent years, tax administration remainsanother impediment to Mozambique’s competitiveness

and productivity. A large number of the firms interviewedin the recent Investment Climate Assessment (World Bank2010b) reported that tax administration is a major or severeobstacle to doing business. Reducing the number of taxes onthe books and simplifying compliance with tax legislationwould reduce transaction costs of businesses.
Factor markets—land, labor, and capital—need to allocateresources to their most productive uses. The 1997 Land Lawis generally considered to be exemplary in Africa. However,10 years after its approval, its implementation is weak, and thereality on the ground is one of extensive extralegal land mar-kets, multiple claims to the same pieces of land, and a lack ofguidance on how to protect or compensate customary andgood-faith occupation rights. This situation has led to exten-sive land speculation and corruption, potentially leading toland conflicts and landlessness in the future. In the short run,the land situation acts as a deterrent to investors, particularlyin tourism and agribusiness. Access to land for productivepurposes needs to be improved. The new labor law approvedin 2007 has substantially improved labor regulations for newinvestments. However, the labor market could and should beallowed to work even better to attract more domestic and for-eign investment and sustain high growth rates.
In addition, despite significant progress, education levelsin Mozambique are still very low and constitute a structuralconstraint for job creation in the formal sector. Quality ofeducation is key for inclusive growth. Professional services(such as engineering, auditing, legal, and medical services)are expensive and in short supply in Mozambique; at thesame time, many highly skilled Mozambicans are emigrat-ing because they can earn more money abroad. Thisparadox of not having enough supply of skills (making pro-fessional services very expensive) while at the same time nothaving enough demand for them (leading to emigration)needs to be analyzed carefully to come up with an appropri-ate package of policy reforms. Inappropriate standards oftenstifle demand for services in areas such as engineering andaccounting. Professional associations can play a key role increating, with government support, a framework for regula-tion and appropriate standards, and also monitor qualityand skills development. Immigration rules for qualified spe-cialists who can provide managerial and technical expertiseto Mozambican enterprises are still very restrictive, particu-larly for companies providing professional services. In theshort run, a more liberal policy of granting work visas toskilled foreigners would help to develop the market for pro-fessional services in Mozambique and would enableMozambican companies to compete better with foreigncompanies providing such services.
Legislation for the financial sector has been evolvingcontinuously, and all banks were privatized in the 1990s.However, capital markets remain very shallow. The bankingsystem is now sound and highly profitable. Exceptionallyhigh ratios of capital adequacy (17 percent on Basle I) andliquidity (55.4 percent) of commercial banks raise a legiti-mate question as to whether there is sufficient financialintermediation for a fast-growing economy. Only a quarterof all districts have any kind of banking service, housingfinance faces big constraints, and trade finance is stillunderdeveloped.
Trade logistics remain a serious constraint. Mozam-bique has the potential to be a major outlet for southernAfrica based on its strategic location and congestion inDurban port, provided that it becomes more logisticsfriendly. Maputo port is the closest route for the largestmining and manufacturing region of South Africa, whileBeira and Nacala are the closest ports for the other neigh-boring countries. Yet corridor traffic potential remainsmainly untapped. Traffic going to and from Gauteng andMpumalanga provinces equals at least 700 million tons. IfMaputo could capture 1 percent of this traffic, its totalthroughput would be doubled and port revenues would beincreased by several tens of millions of dollars. Despite arather successful concession process, transit traffic atMaputo port remains relatively low, and the port operatesat less than 30 percent of its capacity. Beira port has alsooperated at less than 40 percent capacity for the past fiveyears. Mozambique’s main deficiencies for trade mostlyderive from logistics problems and low transport reliability.Low ratings in the logistic performance index (LPI) (2.29)and in the timeliness index (2.83) put Mozambican ports ata disadvantage compared with the port of Durban (with anLPI of 3.53 and a timeliness index of 3.78). The WorldBank’s 2008 Doing Business report highlights a web of pro-cedures taking 27 days for exports and 38 days for imports.Some large South African shippers are still reluctant toshift their transport routes from Durban to Maputo becausethey still perceive the business climate there as unpre-dictable, including a higher incidence of bribe payments forthe port of Maputo than for Durban (World Bank 2010a).Also, the poor integration of trucking services with the restof the subregion explains why South African shippers arestill reluctant to use Mozambican ports. High transportunpredictability is closely linked to low traffic volumes. Asa result, shipping lines do not call directly in Maputo andcargo has to be transshipped in Durban or Mombasa.Physical investments and reforms of customs proceduresshould be carried out simultaneously to reach a critical mass
76 CHAPTER 3: RAPID GROWTH AND ECONOMIC TRANSFORMATION IN MOZAMBIQUE, 1993–2009

in port transport volume. At that point, international ship-ping lines will make direct calls, which will greatly improvepredictability. Constructing the “one-stop border post” inRessano Garcia for trade with South Africa is of highest pri-ority and should be quickly emulated in other large borderposts. At the same time, all the customs clearance proce-dures including at the dry ports have to be revised. Longtruck immobilization creates unnecessary delays and costsfor shippers and transporters. Capital dredging of the Beiraport is also very important, as is the reconstruction of theroad between Nampula City and the border of Malawi.
Strengthening specialized export-supporting institu-tions that can assist small- and medium-size exporters isimportant for product and market development. Neededare a national system for standards and quality controls; anICT-based proactive trade information system; product IDcards, and CITEs (centers supporting knowledge, innova-tion, and technology transfer and services otherwise notavailable). In addition, more “articulators” are needed toconnect Mozambican businesses and products withregional and global markets. For a country where produc-tion is highly fragmented, such articulation initiatives arecritical to secure scale benefits and knowledge transfer.There are already a number of ongoing articulation effortsin Mozambique through nongovernmental organizations,producer associations, private sector firms, and governmentagencies. But more needs to be done to get the benefits ofeconomies of scale.
CONCLUDING REMARKS
The government of Mozambique has consistently pursuedsound fiscal, monetary, and external policies, demonstratinga clear understanding of the benefits of a solid underlyingmacroeconomic framework for fostering further privatesector-led growth. Mozambique’s stable macroeconomicenvironment has allowed the economy to undergo signifi-cant transformation over the past two decades, in part sup-ported by a stable source of ODA funding. Sectoral outputcomposition has witnessed significant changes, with theparticipation of agriculture in output diminishing as moreproductive sectors grow. Although employment is still over-whelmingly concentrated in agriculture, job growth in theprivate sector (mostly informal) has led to increased partici-pation of private services in output. Nevertheless, Mozam-bique’s current growth model is not creating enough jobs orwidening the productive base in order to create an economyin which wealth is broadly shared. However, the strategyimplemented since the discovery and exploitation of large
mineral resources has produced positive results. The countryhas achieved high growth rates, is getting significantamounts of export revenue and has begun to reduce its aid-dependency, especially vis-a-vis traditional Western donors.However, the trickle-down effect of such a bet has not (yet)produced the expected impact on local businesses and labormarkets. Moreover, uneven income distribution in urbanareas and rising food prices during the last global commod-ity price cycle triggered protests.
Shifting growth dynamics toward a more inclusivepattern based on economic diversification and increasedparticipation of small and medium enterprises will requirepolicy action. Businesses’ interest in expanding and initiat-ing operations in Mozambique is palpable. This ongoingdiversification of productive activities is bound to spurtransformations in the economic landscape. Economicdiversification and increasing engagement of small andmedium enterprises leveraged by sustained efforts to partic-ipate in world markets represent a strategic orientation inthe Mozambican growth model that is required to acceler-ate growth and reduce poverty. Harnessing such transfor-mations for economic development will require strategicpolicy steps. By promoting competition and trade integra-tion measures, the government should induce furtherprivate sector demand for Mozambique’s factors of produc-tion, diversifying the economy and achieving shared andsustained economic growth.
A more balanced growth path, that would rely on localbusiness initiatives, is fundamentally about creating theright incentives and necessary underlying conditions tofoster entrepreneurial drive. These conditions can beachieved through policies to improve the business environ-ment, the functioning of factor markets and land alloca-tion, and the trade infrastructure, aiming to strengthen orcreate the institutions necessary for more absorption oflabor, in particular helping small and medium enterprisesto succeed. Such a shift requires political commitment andattention to new institutional bottlenecks and implementa-tion capacity.
The bet that Mozambique has taken is showing somepositive results. It was perhaps, given its chronic aid-dependency during most of its post-independence history,the only possible way to depart from it. This bet is notexempt from risks, and there are several indications that thepolitical leadership is fully aware of many of them. Losingtoo soon significant portions of ODA would certainly beharmful to both macroeconomic stability and the quality ofpolicies, although it should be acknowledged that thecountry has fully owned and implemented the standard
CHAPTER 3: RAPID GROWTH AND ECONOMIC TRANSFORMATION IN MOZAMBIQUE, 1993–2009 77

agenda aimed at stability. The benefits from the exportwindfall could be captured by vested interests and not re-invested into the rest of the economy. There could be a sub-stitution of aid-dependency by an excessive reliance on thebusiness interests of large private groups.
Nevertheless, it is overall quite a success story, despitethese risks and perhaps because of these risks. To the extentthat the country understands these challenges and works toaddress them, especially in the efficient allocation of wind-falls to development purposes, chances are that Mozambiquecould be a bright spot in terms of a successful strategy thatovercame a civil war, instabilities of all sorts, lack of initialresources, lack of human capital, poverty and excessivedependency on external assistance.
NOTES
1. In primary education (grades 1–7), the number ofchildren more than tripled, from about 1.3 million in1992 to 4.2 million in 2008. Net enrollment rates in pri-mary education doubled, from 45 percent in 1998 tomore than 96 percent in 2008, with rates for girls risingfrom 40 percent to 93 percent. The number of primaryschool teachers increased from 30,000 in 1992 to 73,900in 2008. The gross enrollment rate in lower secondaryeducation (ES1) increased from 4.8 percent in 1998 to 28.0percent in 2008. The gross enrollment rate for upper sec-ondary school (ES2) increased from 1.3 percent in 2008 to8.0 percent in 2008. Under-five mortality rates decreasedfrom 212 per 1,000 live births in 1996 to 178 in 2003 and138 in 2008. Infant mortality decreased from 145 per 1,000live births in 1996 to 122 in 2003 and 93 in 2008. Maternalmortality fell from an estimated 1,000 per 100,000 livebirths in the early 1990s to 408 in 2003 and 340 in 2007.The share of the population with access to an improvedwater source increased from 39 percent in 1995 to 48 per-cent in 2008. Although the rate of HIV prevalenceremains very high, the capacity of the health system wasexpanded to start providing free antiretroviral treatmentfor HIV infection.
2. The methodology applied to obtain the decompositionwas based on a Cobb-Douglas production function withcapital and quality-adjusted labor as inputs. Shares of theinputs were considered fixed at 0.4 and 0.6. Data from theInstituto National de Estatistica (INE 1998, 2004) were usedto adjust for labor quality.
3. Jones (2006) provides a thorough discussion of growthaccounting in Mozambique between 1980 and 2004. Heconsiders alternative and more flexible functional formsfor the production function; discusses perils of the growthaccounting exercises with specific Mozambican data con-straints in mind; and reviews results from other authors,
such as Sulename (2001); Benito-Spinetto and Moll(2005); IMF (2005); Tahari, Akitoby, and Aka (2004); andNdulu and O’Connell (2003). Vitek (2010) provides agrowth accounting exercise in Mozambique between 1990and 2008.
4. The shrinking of the labor force in agriculture in favorof other more productive sectors is a general pattern in thedevelopment process of many other advancing economiesand should not be viewed as a negative phenomenon.
5. Job creation in the nonagricultural informal sectorbetween 1997 and 2003 was also an important determinantof poverty reduction (World Bank 2008b). It provided eco-nomic opportunities to the poor and led to economywideproductivity gains.
6. The enterprise survey of 600 firms was carried out in2008 by the World Bank for the Investment ClimateAssessment (World Bank 2010b). Each firm in the samplewas visited to collect employment information on 2003and 2006.
7. The index essentially compares each product Mozam-bique exports with all importing countries of the productfrom all world sources. By tracing all bilateral flows foreach exported good, Gillson (2008) proposes a measure thatcaptures the extent to which markets have been penetratedby Mozambican products. For instance, if country A exportsgood X only to country B, but good X is also imported bycountries C and D only from country E, then country A isexploiting one of three (or one-third of) bilateral flows forgood X.
8. Market penetration measures disaggregated by largestexport partners indicate that Mozambique is alreadyexploiting 80 percent of its potential bilateral flows toSouth Africa.
9. This section draws heavily on the recent Country Eco-nomic Memorandum on “Reshaping Growth and CreatingJobs through Trade and Regional Integration” (World Bank2010a).
10. These results should be treated with caution, however.Substantial underreporting of food consumption has beenidentified in the 2008/09 household survey data, whichcould affect both the poverty levels and their trend overtime. The data problem also affects the 1996/97 and 2002/03household surveys, albeit to a different extent. Additionalanalytical work is required to test the robustness of thepoverty analysis in Mozambique by correcting for the dataproblems.
11. The considerable amounts of aid and the presence of agreat number of aid agencies led to the establishment ofdonor coordination mechanisms that were considered bestinternational practices until recently. A number of donor-government working groups were established during a“golden era” for coordination that brought benefits to both
78 CHAPTER 3: RAPID GROWTH AND ECONOMIC TRANSFORMATION IN MOZAMBIQUE, 1993–2009

donors and the government—in terms of transactioncosts—and culminated with the adoption of the Paris andAccra Declarations. In parallel, a distinction beganbetween donors providing direct budget support (such asa regrouping into a group of nineteen OECD countries orthe G-19) and those involved in more traditional projectactivities. While important donors (such as the UnitedStates) concentrated efforts in specific sectors (like healthand clean water), the G-19 elaborated a memorandum ofunderstanding to define quasi-contractual rules for dis-bursing budget support, considered as a sign of a moremature relationship with recipient governments. In fact,while Mozambique’s success led the country to benefit fromlarger shares of aid under direct budget support (by theG-19), this theoretically more “advanced” form of aid, ade-quate for countries with a solid track record, also makes thecountry more dependent on the political and budgetarycycles of OECD donors (see box 3.1).
REFERENCES
AfDB (African Development Bank). 2009. African Develop-ment Indicators 2009. Tunis.
Benito-Spinetto, M., and P. Moll. 2005. “MacroeconomicDevelopments, Economic Growth and Consequences forPoverty.” Background Paper for the 2005 Country Eco-nomic Memorandum. World Bank and InternationalMonetary Fund, Washington, DC.
Castel-Branco, Carlos Nuno. 2002. “Mega projectos eestratégia de desenvolvimento.” http://www.iese.ac.mz/lib/cncb/Mega_projectos_Moz_texto.pdf.
Castel-Branco, Carlos Nuno, and Rogéio Ossemane. 2009.“Crises cíclicas e dasfios de transformação do padrão decrescimento económico em Moçambique.” In Desafiospara Moçambique 2010, ed. L. Brito, C. Castel-Branco,S. Chichava, and A. Francisco, pp. 141–82. Maputo: Insti-tuto de Estudos Sociais e Económicos (IESE).
Clement, Jean A. P., and Shanaka J. Peiris, eds. 2008. Post-Stabilization Economics in Sub-Saharan Africa. Washing-ton, DC: International Monetary Fund.
Gillson, Ian. 2008.“Mozambique’s Export Market Penetration.”World Bank, Poverty Reduction and Economic Manage-ment (PREM), Africa Region, Washington, DC.
IMF (International Monetary Fund). 2005. Republic ofMozambique: Selected Issues and Statistical Appendix.IMF Country Report 05/311, Washington, DC.
INE (Instituto National de Estatistica). 1998. Relatório finaldo inquérito sobre orçamento familiar (IOF), 1996/7.Maputo.
———. 2004. Relatório final do inquérito aos agregados famil-iares sobre orçamento familiar (IAF), 2002/3. Maputo.
———. 2006. National Labor Force Survey 2004/5. Maputo.
———. 2010. Relatório final do inquérito sobre orçamentofamiliar (IOF), 2008/9. Maputo.
Jones, Sam. 2006. Growth Accounting for Mozambique,1980–2004. Discussion Paper 22E, Ministry of Planningand Development, National Directorate of Studies andPolicy Analysis, Maputo.
MPD (Ministry of Planning and Development), Govern-ment of Mozambique. 2004. Second National PovertyAssessment. Maputo.
———. 2010. Third National Poverty Assessment. Maputo.
Ndulu, B., and S. O’Connell. 2003. Revised Collins/Bosworth Growth Accounting Decompositions. AERCGrowth Project, African Economic Research Consor-tium, Nairobi.
Sonne-Schmidt, C., C. Arndt, and M. Magaua. 2008. Contri-bution of Mega-Projects on GDP. Ministry of Planningand Development, Direcção Nacional de Estudos eAnálise de Políticas (DNEAP), Maputo.
Sulename, Jose. 2001. “Economic Decline: A Study with Reference to Mozambique.” Ph.D. diss., Departmentof Economics, University of Notre Dame, South Bend, IN.
Tahari A., B. Akitoby, and E. Aka. 2004. “Sources of Growthin Sub-Saharan Africa.” IMF Working Paper 04/176,International Monetary Fund, Washington, DC.
UN COMTRADE (various years). United Nations Com-modity Trade Statistics Database. http://comtrade.un.org/db/
Vitek, Francis. 2010. “Economic Growth in Mozambique:Experience and Policy Challenges.” International Mone-tary Fund, Africa Department, Washington, DC.
World Bank. 2008a. Expanding the Possible in Sub-SaharanAfrica: How Tertiary Institutions Can Increase Growth andCompetitiveness. Poverty Reduction and EconomicManagement (PREM), Washington, DC.
———. 2008b. Mozambique, Beating the Odds: SustainingInclusion in a Growing Economy. A Mozambique Poverty,Gender, and Social Assessment. Poverty Reduction andEconomic Management (PREM), Washington, DC.
———. 2010a. Mozambique Country Economic Memoran-dum: Reshaping Growth and Creating Jobs through Tradeand Regional Integration. Washington, DC.
———. 2010b. Mozambique Investment Climate Assessment2010. Washington, DC.
———. Various years. World Development Indicators.Washington, DC.
CHAPTER 3: RAPID GROWTH AND ECONOMIC TRANSFORMATION IN MOZAMBIQUE, 1993–2009 79
