chapter 3 sustainable urban water...
TRANSCRIPT

3-1
Chapter 3
Sustainable Urban Water Management
James P. Heaney, Len Wright, and David Sample
IntroductionWater supply, wastewater, and stormwater systems are explored in this chapter, firstindividually and then looking at them in an integrative manner. Key areas ofpotential integration of these three functions are in reuse of wastewater andstormwater to reduce the required net import of water for water supply. Theliterature review summarizes previous and on-going work nationally andinternationally to develop more sustainable urban water management systems.
Systems View of Urban Water ManagementThe mid 1960's were a period of great change in the water resource field in theUnited States. The 1964 Water Resources Research Act established the Office ofWater Resources Research (OWRR) with a mission of promoting interdisciplinaryresearch because the individual federal agencies were only looking at theirmandated piece of the total water system. Also, the 1965 Water ResourcesPlanning Act established river basin commissions to better integrate water resourcesplanning across federal agencies. Great strides were made in urban water andenvironmental management during the 1960's and 1970's because of strong federalsupport for research, a national mood to look at revitalizing our cities and restoringthe environment, and the concomitant emergence of the systems approach andessential computer hardware and software.
The leadership in urban water resources during the early years can be traced to theASCE Urban Water Resources Research Council (UWRRC) headed by M.B.McPherson. With funding from OWRR and the National Science Foundation (NSF),the UWRRC sponsored research conferences and numerous research projectsdealing with a wide variety of urban water resources issues. The early results arepublished in McPherson et al. (1968). They pointed out that:
A single aspect research approach is totallyinadequate and, indeed, is entirely inappropriate, forresolving multi-aspect problems. The formersimplistic approach of regarding a unit of water as afixed entity, such as stormwater, must be abandonedfor that same unit at a different point in time will becategorized as water supply, recreation, esthetics,etc., perhaps several times before leaving a givenmetropolis.
The ASCE UWRRC defined urban water resources to consist of:

3-2
1. Urban water uses:Water supply (domestic, commercial, agricultural and for fireprotection).Conveyance of wastes (from buildings and industries).Dilution of combined and storm sewerage system effluents andtreatment plant effluents (by receiving bodies of water).Water-oriented recreation and fish management.Aesthetics (such as landscaped creeks and ponds in parks and
parkways).Transportation (commercial and recreational).Power generation.
2. Protection of urban areas from flooding:Removal of surface water at the source.Conveyance of upstream surface water through the area.Barricading banks, detaining or expressing flow natural streams to
mitigate spillover in occupied zones of flood plain.Flood proofing of structures.
3. Manipulation of urban water:Groundwater recharge.Recycling of water.
4. Pollution abatement in urban areas:Conveyance of sanitary sewage and industrial wastes in separate
sewerage systems.Interception of sanitary sewage and industrial wastes.Interception and treatment of storm sewer discharges or combinedsewer overflows.Reinforcing waste assimilative capacity of receiving water bodies.Treatment of sanitary wastes at point of origin.
5. Interfacial public services:Snowstorm and rainstorm traffic routing.Street cleaning scheduling.Snow removal strategies.Lawn irrigation conservation.Air pollution control.
The review of the integrated approach to urban water systems, which was in voguein the late 1960's and 1970's, indicates that these researchers had scoped theproblem very well. The spatial scale for these early systems studies tended to bemacro in that it encompassed the entire urban area with a view towards finding themost cost-effective overall system. This approach was compatible with federalinfrastructure funding patterns that required that the funded projects be part of anoverall transportation or wastewater master plan for the entire urban area.

3-3
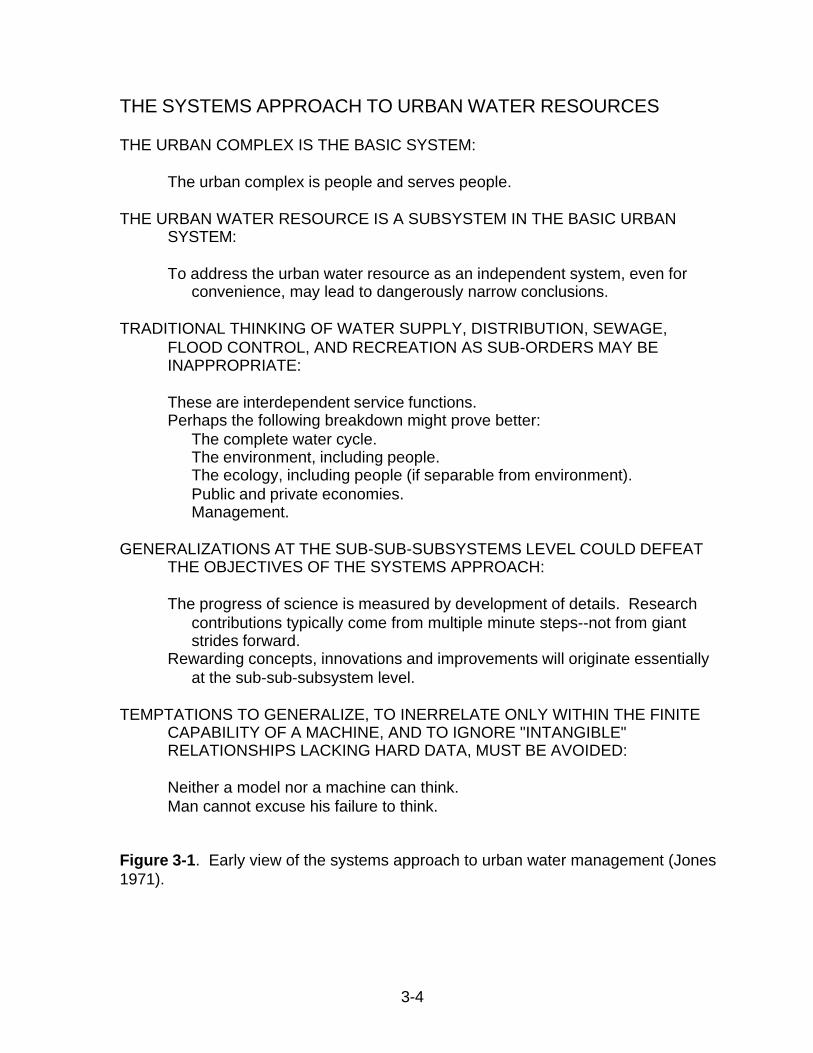
A systems approach to urban water management was described by Jones in 1971(see Figure 3-1). McPherson (1973) argued that developing an urban water budgetwas an essential first step in using a systems approach as shown in Figure 3-2.Concurrently, researchers at Resources for the Future were stressing the use of amaterials balance approach for inventorying and evaluating the generation anddisposal of "residuals" or the quality constituents associated with transport in the airor water (Kneese, Ayres, and d'Arge 1970). A more recent summary of the residualmanagement approach and a comprehensive catalog of models is presented inBasta and Bower (1982). Heaney (1994) presents an overview of these earlystudies.
Sustainability Principles for Urban Water InfrastructureWith regard to urban development in general and urban water systems in particular,Grottker and Otterpohl (1996) list the following general principles for providingsustainable development:For the same or more activities, use less energy and material.
• Do not transfer problems in space or time to other persons.• Minimize degradation of air, water, and land.
Application of these principles to urban water systems yields the following principles(Grottker and Otterpohl 1996):
1. Minimize the distance of water and wastewater transportation.2. Use stormwater from roofs, preferably for water supply, instead of infiltrating
ordischarging it.
3. Do not mix the human food cycle with the water cycle. Do not mix wastewatersof different origin.
4. Decentralize urban water systems and do not allow human activities withwater iflocal integration into the water cycle is not possible.
5. Increase the responsibility of individual humans for their impacts on localwater and wastewater systems.
3-4
THE SYSTEMS APPROACH TO URBAN WATER RESOURCES
THE URBAN COMPLEX IS THE BASIC SYSTEM:
The urban complex is people and serves people.
THE URBAN WATER RESOURCE IS A SUBSYSTEM IN THE BASIC URBANSYSTEM:
To address the urban water resource as an independent system, even forconvenience, may lead to dangerously narrow conclusions.
TRADITIONAL THINKING OF WATER SUPPLY, DISTRIBUTION, SEWAGE,FLOOD CONTROL, AND RECREATION AS SUB-ORDERS MAY BEINAPPROPRIATE:
These are interdependent service functions.Perhaps the following breakdown might prove better:
The complete water cycle.The environment, including people.The ecology, including people (if separable from environment).Public and private economies.Management.
GENERALIZATIONS AT THE SUB-SUB-SUBSYSTEMS LEVEL COULD DEFEATTHE OBJECTIVES OF THE SYSTEMS APPROACH:
The progress of science is measured by development of details. Researchcontributions typically come from multiple minute steps--not from giantstrides forward.
Rewarding concepts, innovations and improvements will originate essentiallyat the sub-sub-subsystem level.
TEMPTATIONS TO GENERALIZE, TO INERRELATE ONLY WITHIN THE FINITECAPABILITY OF A MACHINE, AND TO IGNORE "INTANGIBLE"RELATIONSHIPS LACKING HARD DATA, MUST BE AVOIDED:
Neither a model nor a machine can think.Man cannot excuse his failure to think.
Figure 3-1. Early view of the systems approach to urban water management (Jones1971).

3-5
Figure 3-2. Water budget for urban water systems (McPherson 1973).
Sustainability has become popular as a general goal of future societies in generaland environmental and economic systems in particular. A recent issue of WaterScience and Technology featured numerous articles by European authors on thetheme of “Sustainable Sanitation” (Henze et al. 1997). They could not find anoperational definition of sustainability as it applies to urban water problems. Severalauthors did strongly advocate taking an holistic view of urban water systemsranging from water supply to wastewater and stormwater collection, treatment, anddisposal.
Clark, Perkins, and Wood (1997) have developed and applied concepts ofsustainability to evaluating alternative futures for the water system in Adelaide,Australia. This effort is the largest known case study of a group that is taking anintegrative look at this problem. The purpose of the Water Sustainability in UrbanAreas (WSIUA) project is to investigate the feasibility and benefits of progressivereplacement of the existing large scale , single purpose water systems with replicatedsmall scale, multipurpose water systems. These water systems consist of watersupply, wastewater and stormwater. The key concepts explored in this study are

3-6
(Clark et al. 1997):
1. Adoption of a long planning cycle compatible with the life span of majorcomponents of the water systems.
2. Planning water systems to achieve multiple objectives-environmental,social,
and economic.3. Viewing water as a valuable resource warranting conservation and
efficientutilization.
4. Undertaking water planning which seeks efficiency gains through taking atotal water cycle approach on a local and regional basis as the bestmeans of meeting multiple objectives.
5. Integrating water systems as appropriate to achieve efficiencies throughinfrastructure cost sharing.
6. Localizing water systems to achieve efficiencies through maximizing localopportunities.
7. Utilizing rainwater capture, effluent recycling and groundwater storage tomaximize system resilience.
8. Franchising the operation of small scale systems as the best means ofbalancing cost competition with maintenance of adequate reliability
andpublic health standards.
9. Recognizing the organizational and social implications of integrated localwater systems.
Urban Water Budget
Literature ReviewWater budgets have become popular in recent years as water professionals attemptto do more holistic evaluations of urban water systems. Grimmond et al. (1986)present a schematic of the components of the urban water budget as shown inFigure 3-4.
Stephenson (1996) cites three impacts of urbanization on stormwater runoff:• Increased stormwater runoff.• Recession of the water table.• Shorter response time due to imperviousness.
He compares the water budgets of an undeveloped catchment with an urbanizedcatchment in Johannesburg, South Africa. The results show the expected increasein direct runoff and the need to import water for water supply. He also cites an urbanwater budget of a suburb of Vancouver, B.C. (Grimmond and Oke 1986).
Nelen et al. (1996) describe the planning of a new development for about 10,000people in Ede, Netherlands. The three underlying environmental principles are

3-7
sustainability, quality, and ecology. This area has a high groundwater table sogroundwater management is an important part of the project. They plan toincorporate water-conserving hardware and divert the more polluted stormwater intothe sanitary sewer. In addition, they are considering a dual water supply system.
Fujita (1996) describes efforts in Japan to encourage stormwater infiltration. Themultiple objectives of this approach include:
1. River flow maintenance.2. Springwater restoration.3. Water resources guarantee.4. Ground subsidence prevention.5. Groundwater salination prevention.
Herrmann and Klaus (1996) do general water and nutrient budgets for urban watersystems including stormwater. Imbe et al. (1996) performs a water budget analysisto determine the impact of urbanization on the hydrological cycle of a newdevelopment near Tokyo, Japan. This development is trying to minimize hydrologicimpacts by encouraging infiltration systems and storing rainwater. Mitchell et al.(1996) describes a water budget approach to integrated water management inAustralia. Budgeting is done at the individual parcel, neighborhood, and widercatchment scale. On-site management options include providing rain and graywaterstorage.Clark et al. (1997) uses a water budget approach to evaluate decentralized urbanwater infrastructure for Adelaide, Australia.

3-8
Figure 3-3. The urban hydrologic system (Grimmond et al. 1986).
Dry Weather Urban Water BudgetUrban water use, wastewater, and urban stormwater are interdependent. Virtuallyall of the indoor water use is discharged to separate or combined sewers. The totalquantity of wastewater is strongly influenced by infiltration and inflow, which oftenincrease as a result of wet-weather conditions. Outdoor urban use for irrigation ofplants makes pervious areas wetter and reduces the potential soil moisture storageavailable during wet weather periods. However, properly managed, a significantportion of urban stormwater can be directed onto pervious areas to reduce irrigationneeds. These interactions and the potential for better integration of uses aredescribed in this section.
The residential water demand data presented in this study are based on the resultsof a national study sponsored by the American Water Works Association ResearchFoundation (AWWARF) and 12 participating cities. Using an innovative monitoringand data logging system, detailed water use was monitored for approximately 1,200houses in 12 cities. Each house was monitored for two weeks in a warmer period

3-9
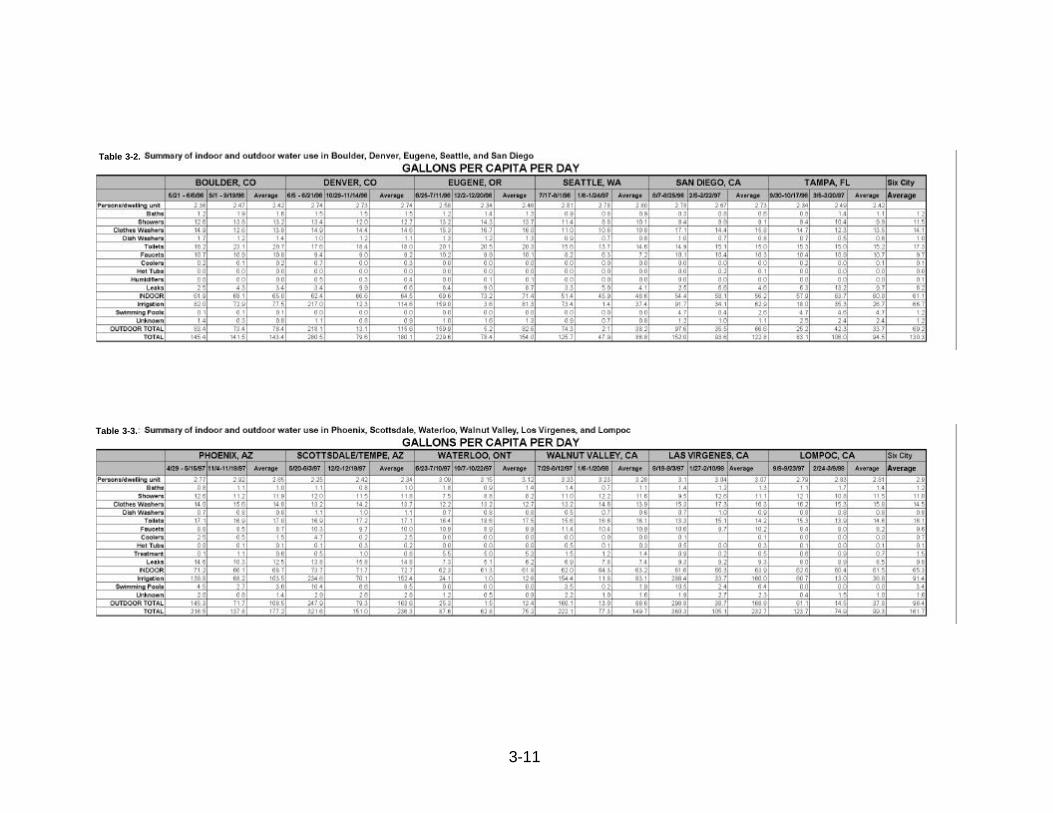
and 12 weeks in a colder period. Readings were taken every 10 seconds andconverted into individual water using events using specially developed software.This work was finished in April 1998. This project is referred to as the NorthAmerican End Use Study (NAREUS) project. Descriptions of this effort can be foundin DeOreo et al. (1996), Harpring (1997), Mayer et al. (1997), Stadjuhar (1997), or byvisiting the homepage of Aquacraft at www.aquacraft.com. The summary results ofthis water use study are presented in Table 3-1 that describes overall water use inthe 12 cities, and Tables 3-2 and 3-3 that present the city summaries for eachsampling period so that the reader can see the difference between the results for thewarmer versus the colder periods.
Indoor Urban Residential Water UseThe results of the NAREUS project indicate an average indoor water use of 63.2gallons per capita per day (gpcd) with a range from 49 to 73 as shown in Table 3-1.Perusal of Tables 3-2 and 3-3 indicates that indoor water use does not varysignificantly between winter and summer. Indoor residential water use per capita isquite stable in the United States reflecting the fact that indoor water use is forrelatively essential purposes. These results are quite similar to previous studies ofindoor water use. Based on a nationwide evaluation, Maddaus (1987) concludedthat indoor residential water use averaged 60 gpcd. Studies of the expected valueof wastewater into sewers likewise report an average of 60 gpcd. Toilets account forthe largest percentage of indoor water use in all three studies followed byclotheswashers, showers, and faucets. The basis for the results shown in thesethree studies is described below.
Indoor water use does not vary significantly over the year. Some daily variabilityoccurs between weekdays and weekends. The hourly distribution of indoorresidential water use is shown in Figure 3-5 (Harpring 1997). Peak usage occursduring the early morning hours of 7 am to 10 am. Most of this peak is due to toiletand shower use. Toilet flushing continues at a similar rate for the rest of the day andinto the evening. On the other hand, showers are taken primarily in the morning.Peak clothes washing activity occurs from 9 am to 1 pm. In general, water use inhouses declines during the middle of the day because fewer people are at home.Use increases in the evening as people return home and prepare dinner, and thenreaches its lowest level between midnight and 6 am when people are asleep.Interestingly, the British studies show use during the early morning hours for dishand clothes washing. The explanation for this usage pattern is that customers aretaking advantage of lower electric rates during these hours (Edwards and Martin1995). A general discussion of expected future trends in indoor water use follows.

3-10
Table 3-1.
3-11
Table 3-2.
Table 3-3.

3-12
Figure 3-4. Hourly variability of indoor water use in 88 houses, Boulder, CO. (Harpring 1997).

3-13
Toilet Flushing: Toilet flushing is the most regular and predictable of allof the indoor water uses with an average of 16.7 gpcd and a range from 14.2 to 20.7gpcd. Residents and guests will use the toilets every few hours if they are home.The only significant break in this pattern is during the night when people are asleep.Day to day variation in toilet flushing depends upon how many people are home at agiven time. More people would be expected to be home on weekends and in thesummer when school is not in session. Toilet flushing generates the black water thatis the main source of pollutants at the wastewater treatment plant. The lowvariability of toilet use is good news from a design point of view since it is then onlynecessary to design for relatively small peaking factors. Also, low quality water canbe used for toilet flushing. Thus, it is a good candidate for using reclaimedwastewater or stormwater.
Conservation options for toilets have focused on reducing the volume per flush fromfour to five gallons to 1.6 gallons which is mandated nationally in the plumbingcodes. An important concern with regard to lower volume per flush is that peoplewould double or triple flush. Based on a nationwide study of toilet flushing, Mayer etal. (1997) conclude that double flushing is a minor problem with low-flush toilets,occurring only about 6% of the time. Also, it does not appear that people will changetheir flushing patterns. British studies of the nature of toilet flushing indicate thatonly about 25 % of toilet flushes are to dispose of fecal material as shown in Table3-4 (Friedler et al. 1996).
Table 3-4. Number of toilet flushes per day and proportion related to fecal flushes(Friedler et al. 1996)
Flushes/day Week Day Weekend DayFecal related 0.87 1.09Other 2.24 2.43Total 3.11 3.52
The diurnal pattern of fecal related flushes indicates that the majority take placebetween 6 am and 9 am. Thus, the savings result from fewer gallons per flush andnot fewer flushes per day. The associated pollutant load would remain constant;accordingly, the wastewater concentrations would increase. Some concern existsthat odors from sewers would be further intensified with the implementation of waterconservation (Joyce 1995).
The volume per flush can be reduced to 0.5 gallons using pressurized systems.This technology may gain more widespread use in the future. Future toilets includethe currently mandated low-flush (1.6 gallons) and ultra low-flush (0.5 gallons)conventional toilets. Johnson et al. (1997) describe an innovative toilet whereinfeces and urine are collected in separate compartments. This toilet reduces wateruse and allows more efficient treatment of the two separate waste streams. Dualflush toilets are employed in Australia wherein the user selects whether to use more
3-14
or less flushing water depending upon the need.
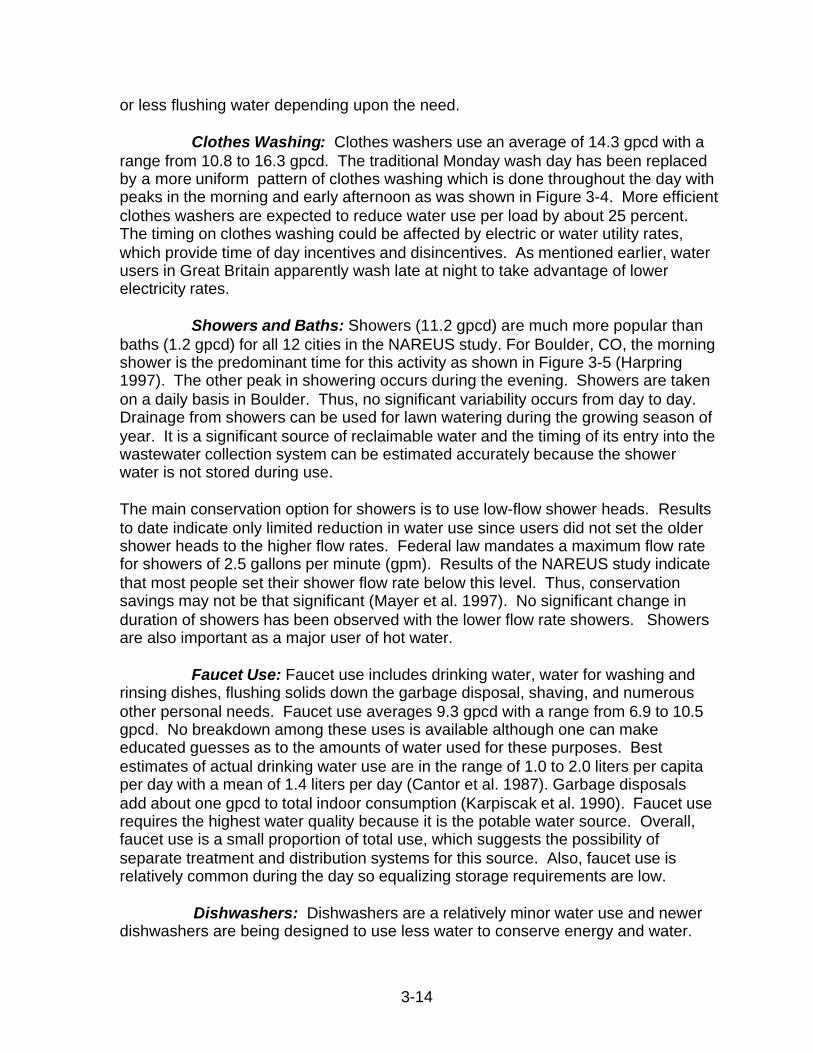
Clothes Washing: Clothes washers use an average of 14.3 gpcd with arange from 10.8 to 16.3 gpcd. The traditional Monday wash day has been replacedby a more uniform pattern of clothes washing which is done throughout the day withpeaks in the morning and early afternoon as was shown in Figure 3-4. More efficientclothes washers are expected to reduce water use per load by about 25 percent.The timing on clothes washing could be affected by electric or water utility rates,which provide time of day incentives and disincentives. As mentioned earlier, waterusers in Great Britain apparently wash late at night to take advantage of lowerelectricity rates.
Showers and Baths: Showers (11.2 gpcd) are much more popular thanbaths (1.2 gpcd) for all 12 cities in the NAREUS study. For Boulder, CO, the morningshower is the predominant time for this activity as shown in Figure 3-5 (Harpring1997). The other peak in showering occurs during the evening. Showers are takenon a daily basis in Boulder. Thus, no significant variability occurs from day to day.Drainage from showers can be used for lawn watering during the growing season ofyear. It is a significant source of reclaimable water and the timing of its entry into thewastewater collection system can be estimated accurately because the showerwater is not stored during use.
The main conservation option for showers is to use low-flow shower heads. Resultsto date indicate only limited reduction in water use since users did not set the oldershower heads to the higher flow rates. Federal law mandates a maximum flow ratefor showers of 2.5 gallons per minute (gpm). Results of the NAREUS study indicatethat most people set their shower flow rate below this level. Thus, conservationsavings may not be that significant (Mayer et al. 1997). No significant change induration of showers has been observed with the lower flow rate showers. Showersare also important as a major user of hot water.
Faucet Use: Faucet use includes drinking water, water for washing andrinsing dishes, flushing solids down the garbage disposal, shaving, and numerousother personal needs. Faucet use averages 9.3 gpcd with a range from 6.9 to 10.5gpcd. No breakdown among these uses is available although one can makeeducated guesses as to the amounts of water used for these purposes. Bestestimates of actual drinking water use are in the range of 1.0 to 2.0 liters per capitaper day with a mean of 1.4 liters per day (Cantor et al. 1987). Garbage disposalsadd about one gpcd to total indoor consumption (Karpiscak et al. 1990). Faucet userequires the highest water quality because it is the potable water source. Overall,faucet use is a small proportion of total use, which suggests the possibility ofseparate treatment and distribution systems for this source. Also, faucet use isrelatively common during the day so equalizing storage requirements are low.
Dishwashers: Dishwashers are a relatively minor water use and newerdishwashers are being designed to use less water to conserve energy and water.

3-15
Present per capita water use averages only 0.9 gpcd.
Water Use for Cooling: For some houses, and for many commercialand industrial establishments, water use for cooling is a significant part of the waterbudget. Swamp coolers are used in the more arid areas of the United States.Karpiscak et al. (1994) estimate that residential evaporative coolers use about sixgpcd in Tucson, AZ. Because of the relatively small number of houses using coolers,the average usage is quite low, only 0.4 gpcd.
Outdoor Urban Residential Water UseWhereas indoor residential water use is very constant across the United States anddoes not vary seasonally, irrigation water use varies widely from little use to beingthe dominant water use. Also, it varies seasonally. The 12 cities in the NAREUSare not a representative sample of the United States with regard to climate types.Also, the amount of natural precipitation that occurred during the study periods canhave a significant impact on the results. Nevertheless, the results certainly suggestthe potential major impact of irrigation on average and peak water use.
A detailed evaluation of irrigation water use as a potential reuse of urban stormwateris presented in Chapter 8. This section only introduces the subject. Irrigation wateruse follows a definite pattern of high use rates in the morning and evening with lowuse rates during the day and late at night. Thus, these customers are following thecommon recommendations to not water during the middle of the day. Watering lateat night is discouraged because of the noise from the sprinklers.
For the entire NAREUS study, outdoor water use averaged 82.8 gpcd, significantlymore than the indoor water use of 63.2 gpcd. Studies of overall residential wateruse in Boulder and Denver show that outdoor water use averaged over the entireyear exceeds indoor water use. Thus, outdoor water use can be a significantcomponent of total annual average water use.
For the NAREUS study, Waterloo, Ontario is representative of conditions in thenortheastern part of North America. During the summer, the outdoor water useaveraged 25.3 gpcd compared to indoor water use of 62.3 gpcd. As expected theoutdoor water use became negligible in the colder months, averaging only 1.5 gpcdin October.
At the other extreme, outdoor water use in Las Virgenes, CA averaged 299 gpcd,nearly five times the indoor water use of 61.6 gpcd during the summer samplingperiod. Thus, for residential areas in the more arid and warmer parts of the country,lawn watering is the largest single use on an annual average basis and is thedominant component of peak daily and hourly use during the summer months.
In the arid areas, evapotranspiration requirements are much greater than naturalrainfall. In warmer parts of the country, even those with abundant rainfall, such asFlorida, irrigation water use rates are high because of the long growing season

3-16
which includes some dry periods. Irrigation water use is a major input to the urbanwater budget during the growing season. A growing number of people are installingautomatic sprinkling systems. These systems tend to use more water than manualsystems (Mayer 1995). Also, the timers on these systems are seldom adjusted.Thus, lawn watering occurs even during rainy periods. Experience with soil moisturesensors to control sprinkling use has been mixed. Automatic sprinkling systems dooffer the potential for more efficient use of water if they are properly calibrated andoperated (Courtney 1997).
The hourly pattern of total residential water use (indoor plus outdoor) for Boulder,CO is shown in Figure 3-5 (Harpring 1997). The study period from late May to earlyJune included some rainy days. Peak hourly use between 6 and 8 am is causedpredominantly by irrigation. Comparison of Figures 3-4 (indoor only) and 4-5 (total)indicates the importance of irrigation. The indoor water use at 6 am is about 7.5gallons per house while the total water use at the same time is about 41 gallons perhouse. Thus, irrigation constitutes over 80% of the peak hourly use.
Options for reducing outdoor water use include using less water-loving plants,applying water more efficiently, reducing the irrigated area, and using nonpotablewater including stormwater runoff and treated wastewater (Courtney 1997).Irrigation use has an indirect effect on urban runoff because it causes much wetterantecedent conditions, which increases the portion of rainfall that runs off. Sakrison(1996) projects a potential decrease of 35% in the demand for irrigation water inKing County, WA if the higher density urbanization occurs. For King County, themain way that water use is managed is by restrictions on outdoor water use forlandscaping. A maximum permissible evapotranspiration is allotted that forces theproperty owner to reduce the amount of pervious area devoted to turf grass.Stormwater run-on to the pervious area can be used for an extra credit. Theamounts of irrigable area for three typical single family lot sizes are shown below.
The advantage of clustering is obvious from inspection of Table 3-5. The amount ofirrigable area per house is reduced from 5 ,000 sq. ft. to 1,500 sq. ft., a reduction of70%. This is the main savings in water use. However, from a stormwater runoffpoint of view, the imperviousness would increase.
Table 3-5. Typical lot sizes and irrigable area, King County, WA (Sakrison 1996).
Density Lot Size,(sq.ft.)
Irrigable Area Per lot(sq. ft.)
% of total
Low 10,000 5,000 50Medium 7,000 3,000 43High 4,500 1,500 33
Lawn watering has increased in the U.S. as population migration occurs to warmer,more arid areas. Also, urban sprawl means much larger irrigable area per dwelling

3-17
unit. Lawn watering needs are a dominant component of peak water use in urbanareas. Reuse of treated wastewater and stormwater for lawn watering appears to bea very attractive possibility for more sustainable communities.
Infiltration and InflowInfiltration and inflow are major issues in urban stormwater management. Forexample, the results of studies of Boulder, CO indicate that I/I is the major source offlow during high flow periods, which might cause SSOs (Heaney et al. 1996).Indeed, the actual sewage flow in the system is 8-10 mgd whereas flows reach 45-50 mgd during peak periods as shown in Figure 3-6. Thus, I/I is over four times theamount of legitimate dry weather flow (DWF). For Boulder, evidence exists that theI/I is clean ground water since pollutant concentrations drop as sewage flowincreases. Thus, pollutant loads remain relatively constant. I/I is discussed in detailin Chapter 6.
Summary of Sources of Dry-Weather Flow intoSanitary and Combined Sewers
Based on a sampling of nearly 1,200 houses in 12 North American cities, in whichflows were measured for four weeks in each house, very accurate information isavailable on indoor water use patterns. Indoor residential water use averages 63.2gpcd and remains constant throughout the year. Commercial, industrial, and publicuses need to be added to this amount to estimate total water use. Essentially all ofthe indoor water use enters the sanitary or combined sewers. Outdoor water use isan important, and highly variable, water use.
Outdoor water use exceeds indoor water use on an annual average in more aridparts of the country. It also the primary cause of peak summer water use, and canrange as high as five to six times indoor water use during these periods. Because ofits seasonal nature, outdoor water use is a major component of the peak design flowas is water for firefighting.
Water conservation practices can reduce water use significantly, particularly outdoorwater use. The increasingly high cost of treating water should encourage a new lookat dual water systems and more aggressive reuse systems. Infiltration and infloware the main unknowns in designing sanitary sewer systems. I/I varies widely withina city and across cities. Contemporary practice still allows much higher peak flowsto account for this uncertainty.
The primary source of degraded water quality for residential uses is toilet flushingwhich accounts for about 30% of the DWF. Faucet water is also of concern,especially where garbage grinders are used. Thus, about 50 % of the DWF could beclassified as “blackwater”. The remaining sources including showers, baths,clotheswashers, and dishwashers would be classified as “graywater”. The largestsource of illicit “wastewater” is I/I which can range from a small fraction to severaltimes DWF.

3-18
The conclusion from this simple water budget is that only a small portion of thewastewater entering sewers requires a high level of treatment. The remaining watercould receive less treatment or does not need treatment because it is probably theinfiltration of clean groundwater. This mass balance indicates that innovativechanges in current practices may be very cost-effective.

3-19
Figure 3-5. Weekday variability in total residential water use for 88 houses, Boulder, Co. (Harpring 1997).

3-20
Figure 3-6. DWF., I/I and total wastewater flow, Boulder, CO, 1995 (Heaney et al.1996).
Quantities of Precipitation in Urban AreasAnnual precipitation amounts for selected U.S. cities are listed in Table 3-6. Theresults of water budgets presented in the literature and water budgets for Denverand New York are presented in the remaining sections of this chapter.
Results of Water Budget Case Studies
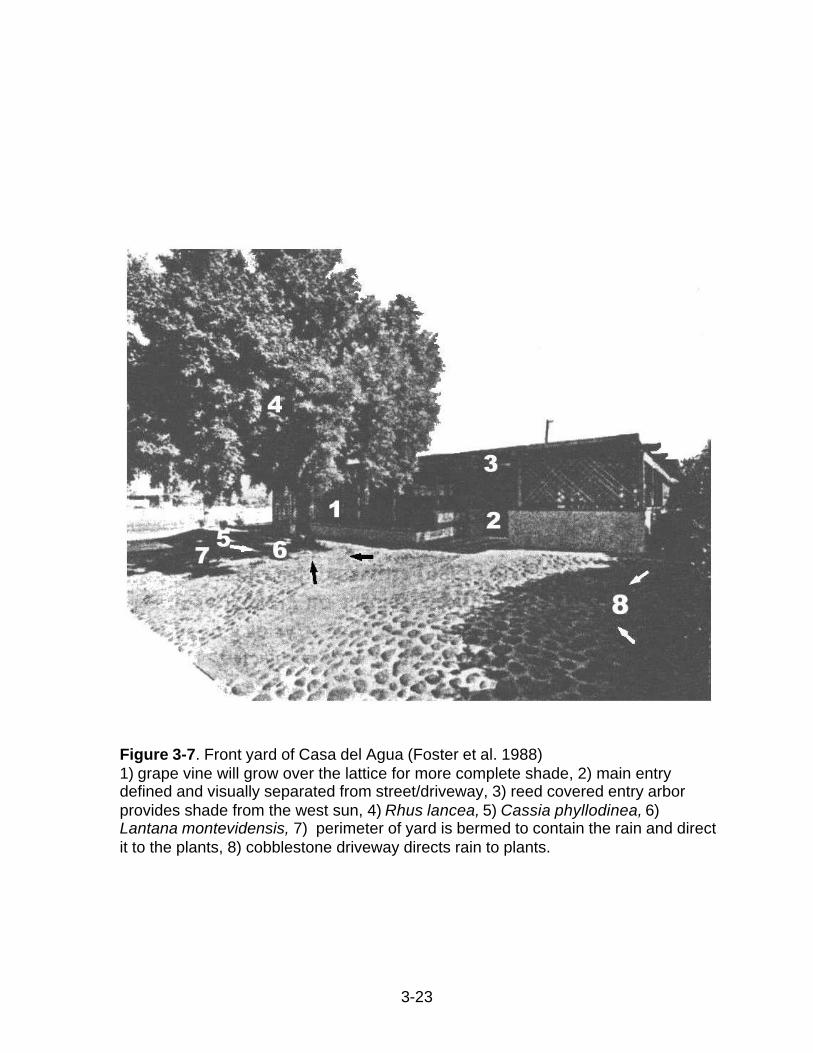
ArizonaTwo demonstration projects in Arizona provide examples of the results of aggressivewater and energy conservation. The first project, which began in 1985, is located inTucson, AZ, and is a demonstration house called Casa del Agua. The layout of thehouse and lot are shown in Figures 3-7 and 3-8 (Foster et al. 1988). Stormwaterrunoff from the impervious surfaces is directed to the adjacent pervious areas toprovide supplemental irrigation water. Roof runoff is collected in rain cisterns with atotal capacity of 14,000 gallons. Casa del Agua is a three bedroom, two-bathroomresidence that has been retrofitted to incorporate low water use fixtures and waterreuse systems. All graywater from the washing machine, tub, shower, lavatories,and one side of the kitchen sink is directed into a collection sump where it receivestreatment (filtration) and then is stored until needed. Rainwater is a very high qualitywater source and is low in total dissolved solids making it ideal for use forevaporative cooling (Foster et al. 1988). It is also used for toilet flushing. Theproblem with rainwater, in Tucson, is that the supply is small and highly variable.The average annual precipitation for Tucson is only 11 inches (Karpiscak et al.1990).

3-21
The baseline water use for an average Tucson house indicates a total daily use of105 gallons per capita, of which 68 gpcd is for indoor use. All of this water issupplied from the municipal system. By comparison, the goal of the waterconservation project was to import only 37 gpcd and to use 12 gpcd from rainwaterand 30 gpcd from recycled graywater. The main reduction in indoor water use wasto be achieved by flushing toilets with recycled water. The actual water use duringthe first year of the study was reduced by 33%. The total water use was brokendown as follows: city water (77%), gray water (24%), and rain water (4%).Rainwater use was less than expected due to below average rainfall.
Graywater use was less than expected due to insufficient storage for gray water,necessitating its discharge periodically to the sanitary sewer. After four years ofoperation with some adaptation to improve performance, the use of municipal waterwas reduced by 66%. A key change was to convert one of the two 7,000 gallonrainwater collection tanks to a graywater storage tank (Karpiscak et al. 1990). As aresult, very little graywater was discharged to the sanitary sewer system, greatlyreducing the dry-weather wastewater flow to the WWTP. The use of graywaterstorage over the year indicates seasonal variability in the utilization with the storagefull, or nearly full, in spring and then emptying during the main water use summerperiod of the year.
In addition to Casa del Agua, in Tucson, a newer demonstration house opened inPhoenix, AZ in May 1993. It is called Desert House and is located at the DesertBotanical Garden (Karpiscak et al. 1994). The goal of this demonstration house is toreduce energy and water use by 40%. This design will also focus on reducing peaksummer water use. The main savings in indoor water use is due to reductions intoilet, shower, and washing machine use. The main reduction in outdoor water useresults from using graywater for lawn watering. This 1,657 square foot, one story,single familyhouse is equipped with 1.5 gallon per flush toilets, 2.75 gallons per minuteshowerheads, and faucet aerators. Roof runoff goes to a 4 ,750 gallon cistern. Thedesign size of the cistern had decreased significantly from the original size of 14,000gallons in Casa del Agua. Desert House is designed for high visitor use so it is notoperated in as routine a manner as Casa del Agua.

3-22
Table 3-6. Annual precipitation and days with rain for selected U.S. cities (US EPA1979).
State City Region Annual Precipitation, in. Annual Days w/ Rain Average in/dayAL Birmingham East 53.52 118 0.45CT Harford East 42.43 128 0.33FL Miami East 57.48 127 0.45GA Atlanta East 47.14 115 0.41KY Louisville East 41.47 122 0.34LA New Orleans East 63.54 120 0.53MA Boston East 42.77 128 0.33MD Baltimore East 44.21 112 0.39NC Charlotte East 43.38 110 0.39NY Buffalo East 35.65 165 0.22NY New York East 42.37 119 0.36OH Cincinnati East 39.34 134 0.29OH Cleveland East 32.08 156 0.21PA Pittsburg East 36.87 146 0.25PA Philadelphia East 42.48 115 0.37TN Nashville East 45.00 120 0.38IA Des Moines Midwest 31.06 105 0.30IL Chicago Midwest 33.49 120 0.28IN Indianapolis Midwest 39.69 124 0.32MI Detroit Midwest 30.95 130 0.24MN Minneapolis Midwest 24.78 113 0.22MO St. Louis Midwest 36.46 104 0.35MO Kansas City Midwest 34.07 98 0.35NE Omaha Midwest 25.90 94 0.28TX Austin Midwest 32.58 81 0.40TX Dallas Midwest 34.55 80 0.43TX Houston Midwest 45.26 103 0.44WI Milwaukee Midwest 27.57 119 0.23CO Boulder Rocky Mtn. 18.57 87 0.21NM Albuquerque Rocky Mtn. 8.13 58 0.14UT Salt Lake City Rocky Mtn. 14.74 87 0.17A K Anchorage West 14.71 126 0.12AZ Phoenix West 7.42 34 0.22CA Los Angeles West 14.62 35 0.42CA San Francisco West 20.78 67 0.31DC Washington West 40.78 107 0.38HI Honolulu West 23.96 99 0.24NV Las Vegas West 4.35 25 0.17OR Portland West 39.91 149 0.27WA Seattle West 34.10 164 0.21WA Spokane West 17.19 118 0.15
Mean 33.30 109 0.31Max 63.54 165 0.53min 4.35 25 0.12
3-23
Figure 3-7. Front yard of Casa del Agua (Foster et al. 1988)1) grape vine will grow over the lattice for more complete shade, 2) main entrydefined and visually separated from street/driveway, 3) reed covered entry arborprovides shade from the west sun, 4) Rhus lancea, 5) Cassia phyllodinea, 6)Lantana montevidensis, 7) perimeter of yard is bermed to contain the rain and directit to the plants, 8) cobblestone driveway directs rain to plants.

3-24
Figure 3-8. Back yard of Casa del Agua (Foster et al. 1988).1) evaporative cooler, 2) new aluminum gutter, 3) new filon greenhouse roof, 4)existing gravel roof, 5) new filon porch roof, 6) new aluminum downspout, 7) pipefrom downspout to filter, 8) concrete filter box with screen, 9) rain cisterns (14,000gallons total), 10) cistern access, 11) supply to pump, 12) graywater cistern (800gallons), 13) supply to pump, 14) overflow to sewer, 15) seat walls, 16) brick pavingdefined and visually separated from street/driveway, 17) kalanchoe species, 18)herb garden, 19) Acacia pennacula.
GermanyAccording to Grottker and Ottterpohl (1996), "the separation of feces and urine fromthe domestic waste water is identified as the most important step to a sustainablewater concept." A 100-unit housing complex in Lubeck-Flintenbreite, Germany isbeing built using this concept. Key components of this innovative project are:
1. Storm water of private properties is re-used for toilet flushing, washing-

3-25
machines and irrigation in gardens. The overflow of stormwater storage isconnected to the infiltration trenches of the road drainage. Twoadvantages of this approach are less potable water consumption and lessdetergent consumption.
2. Storm water from roads and other public surfaces is drained by infiltrationdepressions with trenches to the small creek. This method increasesevaporation and retention of storm runoff.
3. Graywater is treated in aerated sand filters or constructed wetlands. Theoverflow is connected to the infiltration trenches of the public roaddrainage. Two advantages of this approach are using a simple treatmenttechnique with high efficiency and waste water runoff retention.
4. Feces and other organic matter from households are transported by avacuum system to a semi-central aerobic reactor with sludge storage,where the organic matter of 100 living units is treated. Vacuum toilets areused as inlets. Further, collected organic matter/waste is added to theanaerobic reactor. The treated sludge is stored and later carried to afarm. Three advantages of this approach are no I/I problem, less pollutionin the treated sludge yields very high fertilizer, and biogas can be used ina semi-central heating system
This new system will be completely monitored for two years to do a final evaluation.
Melborne, AustraliaMitchell et al. (1996) used a daily water budget simulation model to evaluate theimpact of on-site water management. They evaluated water use for two blocks inMelbourne, Australia. The attributes of each block are shown in Table 3-7.
Table 3-7. Attributes of two neighborhoods in Melbourne, Australia (Mitchell et al.1996).
NeighborhoodAttributeEssendon Scoresby
Rainfall, mm/yr 591 887Rain, days/yr 196 215Evaporative demand, mm/yr. 1054 1054Soil Type clay silty clayArea, sq m 750 750Roof plan area, sq m 203 203Paved area, sq m 113 113Garden area, sq m 434 434People/house 3 3Type of garden standard standard
The following retrofits were evaluated in these two areas:

3-26
• 13 kiloliter rain tank for storage of roof runoff for laundry, toilet, and gardenwater uses. Spillage is directed to the storm drainage network.
• Graywater from bathrooms and laundry is used for gardening through asub-surface irrigation system. Overflows go to the wastewater sewer.
The simulated performance of the modified system is summarized in Table 3-8(Mitchell et al. 1996).
Table 3-8 Simulated performance of modified urban systems (Mitchell et al. 1996).
NeighborhoodAttributeEssendon Scoresby
Water demand, kl/yr 278 265Reduced demand for imported water, % 41 49Reduced off-site stormwater runoff, % 56 49Reduced wastewater runoff, % 11 8Usage from rainwater tank, kl/yr 84 107Rain tank deficit/demand 0.48 0.3Use of graywater, kl/yr 28 24Graywater deficit/demand 0.65 0.65
The reduction in demand for imported water was 41 and 49% for the two systemswhile off-site stormwater runoff was reduced by 56 and 49% for the twoneighborhoods. These results indicate the potentially major impact of on-site watermanagement on overall water use.
Adelaide, AustraliaAdelaide is typical of other cities in that the water supply, wastewater, andstormwater infrastructure systems have developed independently of each other andnow exist as large centralized systems. Adelaide has a separate sewer system.The demand for water in Adelaide, shown in Figure 3-9, indicates that direct contactneeds are about 52 GL/a, 8 GL/a for process and manufacturing, 82 GL/a forgardens and other irrigation, and 18 GL/a for toilet flushing, or a total of 157 Gl/a.Thus, the majority of the water demand does not require high quality water. Thepotentially available local supply, shown in Figure 3-10, indicates 30GL/a from roofrunoff, 95 GL/a from hillside runoff, 61 GL/a from street runoff, 52 GL/a fromgraywater effluent, and 24 GL/a from blackwater effluent, or a total of 260 GL/a.Thus, on the average, the potential local supply exceeds the demand, and thepossibility exists for a locally sustainable system if the necessary storage, treatment,and redistribution facilities could be provided.
The monthly variability in demand, rural runoff, effluent, and urban runoff are shownin Figure 3-11. The present centralized system utilizes 550 kl per person in storage.According to calculations of Clark et al. (1997), the decentralized system wouldrequire only 150 kl per person to provide adequate water during a one in a 100 yeardrought. The overall proposed water budget components for the Adelaide system isshown in Figure 3-12.

3-27
Urban wastewater is being reused at several locations in Australia, (e.g., Rouse Hillnear Sydney), with a first stage of 25,000 dwellings (Law 1997) and on a small scaleat New Haven Village in Adelaide with 67 dwellings. New Haven Village is aninnovative development of 65 medium density affordable dwellings that is designedas an implementation of the integrated approach (Clark et al. 1997). Key watermanagement features include on-site treatment and reuse of household effluent, aninnovative stormwater drainage system, and demonstration technology for anunderground sub-surface irrigation system. With on-site treatment and reuse ofhousehold sewage and stormwater runoff, virtually no water leaves the site. Thewastewater plant is located underground. Treated water is used for irrigation andtoilet flushing, thereby reducing water demand by 50%. Two 22,500 literunderground storage tanks provide effluent storage. Sludge is disposed to a sludgethickening plant on site. Street widths have been reduced from 12.4 meters to only6.8 meters. The stormwater is captured in a 40,000 liter underground concrete tank.Overflows go to an infiltration trench, and finally to a retention area for extremelyheavy rainfalls. The tank delivers stormwater to the treatment plant at night fortreatment.
Other larger demonstration projects are underway in Australia. Notable projectsinclude New Brompton Estate in which roof runoff is being stored in an undergroundaquifer. Overall, the studies by Clark et al. (1997) demonstrate the feasibility ofwater self-sufficiency for the City of Adelaide with an annual rainfall of 600 mm,which is typical of average rainfall conditions in the United States.

3-28
0 10 20 30 40 50 60 70 80 90
Low Grade (toilet flush,etc.)
Gardens and OtherIrrigation
Process andManufacturing
Contact Consumption
GL/a
IncreasingQuality
Total=157 GL/a
Figure 3-9. Consumption of water in Adelaide, Australia according to quality (Clark,1997).

3-29
0 10 20 30 40 50 60 70 80 90 100
Blackwater Effluent
Graywater Runoff
Street Runoff
Hillsface Runoff
Roof Runoff
GL/a
IncreasingQuality
Total=260 GL/a
Figure 3-10. Availability of wastewaters in Adelaide, Australia according to quality(Clark, 1997).

3-30
Figure 3-11. Typical monthly water supply and demand, Adelaide, Australia (Clark1997).
Figure 3-12. Flow chart of proposed integrated water system for Adelaide, Australia(Clark et al. 1997).
3-31
Simulated Monthly Urban Water Budgets for Denver and New York
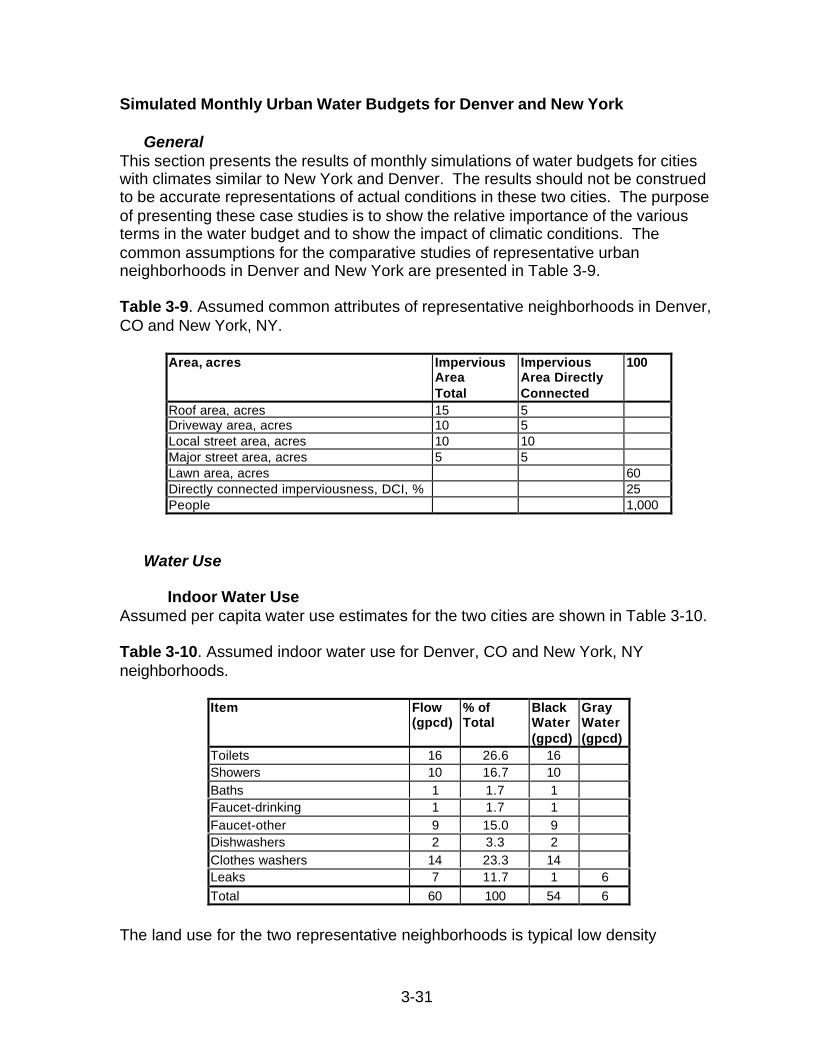
GeneralThis section presents the results of monthly simulations of water budgets for citieswith climates similar to New York and Denver. The results should not be construedto be accurate representations of actual conditions in these two cities. The purposeof presenting these case studies is to show the relative importance of the variousterms in the water budget and to show the impact of climatic conditions. Thecommon assumptions for the comparative studies of representative urbanneighborhoods in Denver and New York are presented in Table 3-9.
Table 3-9. Assumed common attributes of representative neighborhoods in Denver,CO and New York, NY.
Area, acres ImperviousAreaTotal
ImperviousArea DirectlyConnected
100
Roof area, acres 15 5Driveway area, acres 10 5Local street area, acres 10 10Major street area, acres 5 5Lawn area, acres 60Directly connected imperviousness, DCI, % 25People 1,000
Water Use
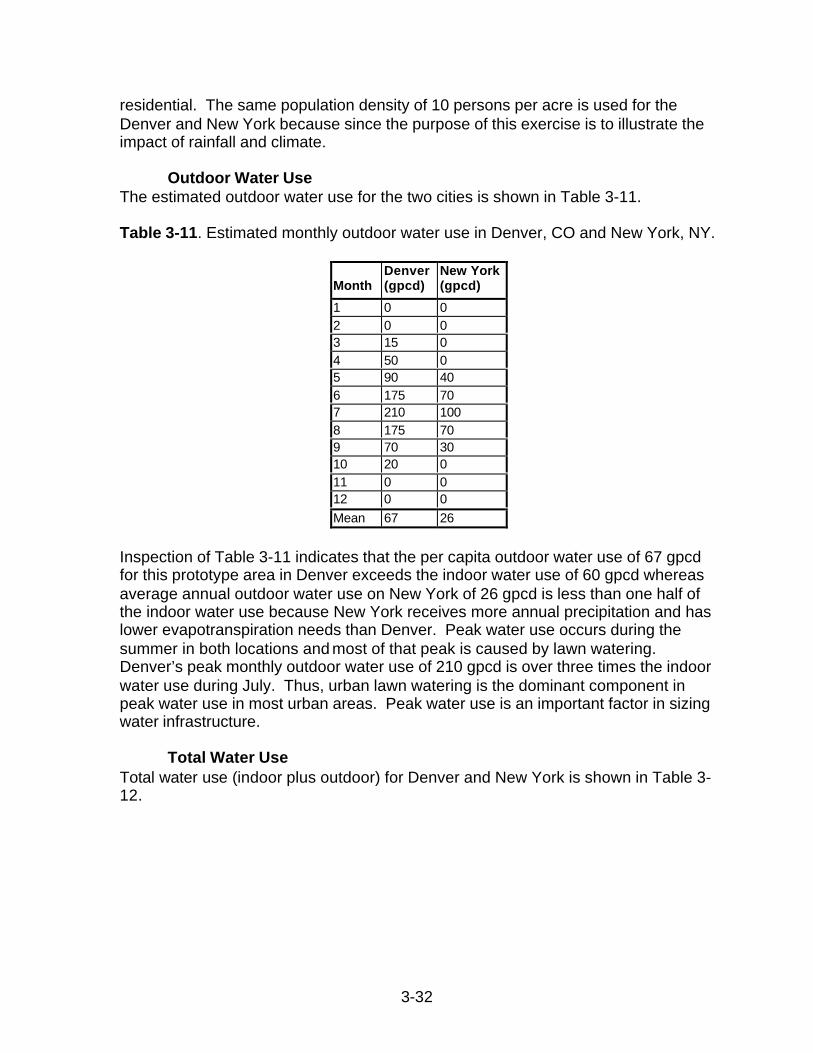
Indoor Water UseAssumed per capita water use estimates for the two cities are shown in Table 3-10.
Table 3-10. Assumed indoor water use for Denver, CO and New York, NYneighborhoods.
Item Flow(gpcd)
% ofTotal
BlackWater(gpcd)
GrayWater(gpcd)
Toilets 16 26.6 16Showers 10 16.7 10Baths 1 1.7 1Faucet-drinking 1 1.7 1Faucet-other 9 15.0 9Dishwashers 2 3.3 2Clothes washers 14 23.3 14Leaks 7 11.7 1 6
Total 60 100 54 6
The land use for the two representative neighborhoods is typical low density
3-32
residential. The same population density of 10 persons per acre is used for theDenver and New York because since the purpose of this exercise is to illustrate theimpact of rainfall and climate.
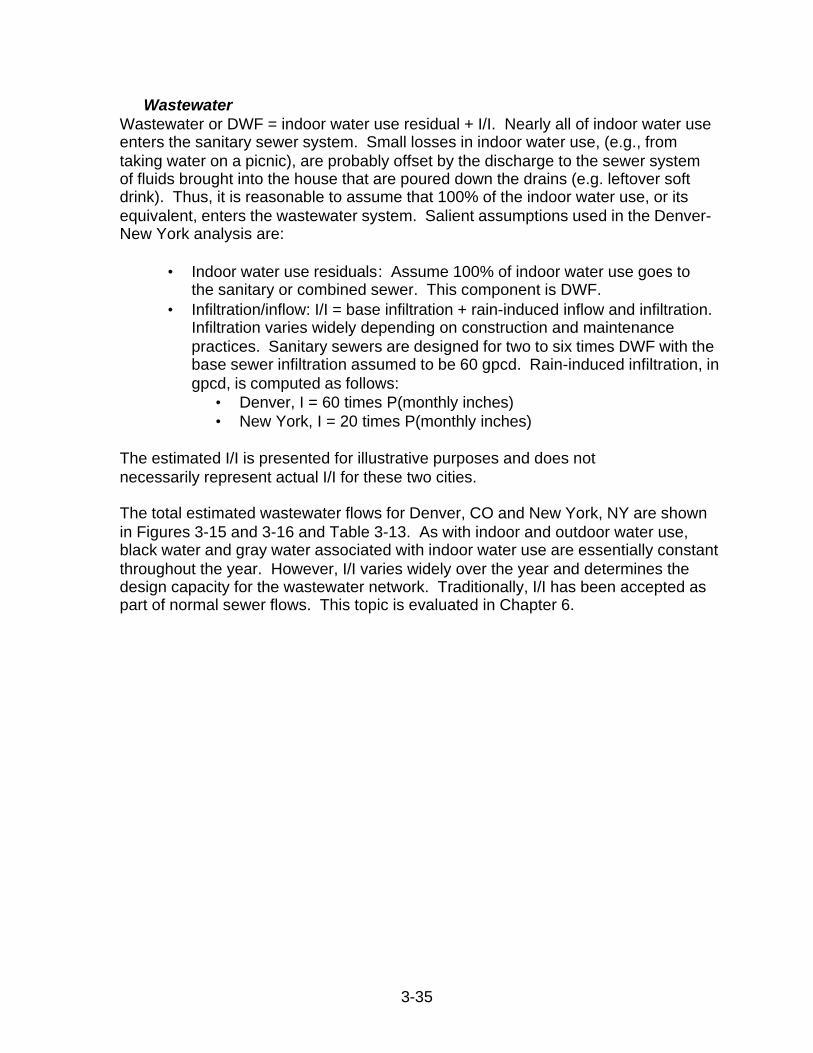
Outdoor Water UseThe estimated outdoor water use for the two cities is shown in Table 3-11.
Table 3-11. Estimated monthly outdoor water use in Denver, CO and New York, NY.
MonthDenver(gpcd)
New York(gpcd)
1 0 02 0 03 15 04 50 05 90 406 175 707 210 1008 175 709 70 3010 20 011 0 012 0 0
Mean 67 26
Inspection of Table 3-11 indicates that the per capita outdoor water use of 67 gpcdfor this prototype area in Denver exceeds the indoor water use of 60 gpcd whereasaverage annual outdoor water use on New York of 26 gpcd is less than one half ofthe indoor water use because New York receives more annual precipitation and haslower evapotranspiration needs than Denver. Peak water use occurs during thesummer in both locations and most of that peak is caused by lawn watering.Denver’s peak monthly outdoor water use of 210 gpcd is over three times the indoorwater use during July. Thus, urban lawn watering is the dominant component inpeak water use in most urban areas. Peak water use is an important factor in sizingwater infrastructure.
Total Water UseTotal water use (indoor plus outdoor) for Denver and New York is shown in Table 3-12.

3-33
Table 3-12. Total monthly water use for representative residential areas in Denver,CO and New York, NY.
Total Water Use for Denver
Month BlackWater(gpcd)
GrayWater(gpcd)
Total
(gpcd)
Outdoor
(gpcd)
Total
(gpcd)1 17 43 60 0 602 17 43 60 0 603 17 43 60 15 754 17 43 60 50 1105 17 43 60 90 1506 17 43 60 175 2357 17 43 60 210 2708 17 43 60 175 2359 17 43 60 70 13010 17 43 60 20 8011 17 43 60 0 6012 17 43 60 0 60
Mean 17 43 60 67 127
Total Water Use for New York
Month BlackWater(gpcd)
GrayWater(gpcd)
Total
(gpcd)
Outdoor
(gpcd)
Total
(gpcd)1 17 43 60 0 602 17 43 60 0 603 17 43 60 0 604 17 43 60 0 605 17 43 60 40 1006 17 43 60 70 1307 17 43 60 100 1608 17 43 60 70 1309 17 43 60 30 9010 17 43 60 0 6011 17 43 60 0 6012 17 43 60 0 60Mean 43 60 26 86
Histograms of monthly water use for Denver and New York are shown in Figures 3-13 and 3-14. Per capita indoor residential water use is the same for the two citieswith only 17 gpcd of the water use producing black water and 43 gpcd of gray water.There is very little monthly variability in indoor water use. On the other hand,outdoor water use varies widely over the year and is the predominant cause of peakwater use.

3-34
0
50
100
150
200
250
300
1 2 3 4 5 6 7 8 9 10 11 12
Months
Gp
cd
OutdoorGraywaterBlackwater
Figure 3-13. Average water use, Denver, CO.
0
20
40
60
80
100
120
140
160
180
1 2 3 4 5 6 7 8 9 10 11 12
Months
Gp
cd
OutdoorGraywaterBlackwater
Figure 3-14. Average water use, New York, NY.
3-35
WastewaterWastewater or DWF = indoor water use residual + I/I. Nearly all of indoor water useenters the sanitary sewer system. Small losses in indoor water use, (e.g., fromtaking water on a picnic), are probably offset by the discharge to the sewer systemof fluids brought into the house that are poured down the drains (e.g. leftover softdrink). Thus, it is reasonable to assume that 100% of the indoor water use, or itsequivalent, enters the wastewater system. Salient assumptions used in the Denver-New York analysis are:
• Indoor water use residuals: Assume 100% of indoor water use goes tothe sanitary or combined sewer. This component is DWF.
• Infiltration/inflow: I/I = base infiltration + rain-induced inflow and infiltration.Infiltration varies widely depending on construction and maintenancepractices. Sanitary sewers are designed for two to six times DWF with thebase sewer infiltration assumed to be 60 gpcd. Rain-induced infiltration, ingpcd, is computed as follows:
• Denver, I = 60 times P(monthly inches)• New York, I = 20 times P(monthly inches)
The estimated I/I is presented for illustrative purposes and does notnecessarily represent actual I/I for these two cities.
The total estimated wastewater flows for Denver, CO and New York, NY are shownin Figures 3-15 and 3-16 and Table 3-13. As with indoor and outdoor water use,black water and gray water associated with indoor water use are essentially constantthroughout the year. However, I/I varies widely over the year and determines thedesign capacity for the wastewater network. Traditionally, I/I has been accepted aspart of normal sewer flows. This topic is evaluated in Chapter 6.

3-36
0
50
100
150
200
250
1 2 3 4 5 6 7 8 9 10 11 12
Months
Gp
cdI/IGraywaterBlackwater
Figure 3-15. Monthly residential wastewater discharge, Denver, CO.
0
2 0
4 0
6 0
8 0
1 0 0
1 2 0
1 4 0
1 6 0
1 2 3 4 5 6 7 8 9 1 0 1 1 1 2
Months
Gp
cd
I / IGraywaterBlackwater
Figure 3-16. Monthly residential wastewater discharge, New York, NY.

3-37
Table 3-13. Total monthly wastewater flows for Denver, CO and New York, NY.
Denver
MonthPrecip.
(inches)
BlackWater(gpcd)
GrayWater(gpcd)
I/I
(gpcd)
Total
(gpcd)1 0.5 17 43 30 902 0.7 17 43 42 1023 1.3 17 43 78 1384 1.5 17 43 90 1505 2.0 17 43 120 1806 2.5 17 43 150 2107 2.4 17 43 144 2048 2.2 17 43 132 1929 1.2 17 43 72 13210 1.0 17 43 60 12011 0.7 17 43 42 10212 0.6 17 43 36 96
Total 17.0Mean 1.38 17 43 83 143
New York
MonthPrecip.
(inches)
BlackWater(gpcd)
GrayWater(gpcd)
I/I
(gpcd)
Total
(gpcd)1 3.0 17 43 60 1202 4.0 17 43 80 973 4.0 17 43 80 974 3.0 17 43 60 775 3.0 17 43 60 776 3.5 17 43 70 877 4.0 17 43 80 978 3.8 17 43 76 939 4.2 17 43 84 10110 4.0 17 43 80 9711 3.8 17 43 76 9312 3.0 17 43 60 77
Total 43.0Mean 3.61 17 43 72 93

3-38
Stormwater RunoffThe final component of the urban water budget to be estimated is the quantity ofstormwater runoff. General characteristics of the study areas were shown in Table3-9.
The runoff volume, R, from precipitation, P, is estimated as R = C*P where C =runoff coefficient. This coefficient is assumed to equal the directly connectedimperviousness, I. For this example, I = 0.25. The estimated monthly precipitationand runoff for Denver and New York are shown in Table 3-14.
Table 3-14. Monthly precipitation and runoff for Denver, CO and New York, NY.
Denver New YorkMonth
Precipitation(inches)
Runoff(inches)
Precipitation(inches)
Runoff(inches)
1 0.5 0.13 3.0 0.752 0.7 0.18 4.0 1.003 1.3 0.33 4.0 1.004 1.5 0.38 3.0 0.755 2.0 0.50 3.0 0.756 2.5 0.63 3.5 0.887 2.4 0.60 4.0 1.008 2.2 0.55 3.8 0.959 1.2 0.30 4.2 1.0510 1.0 0.25 4.0 1.0011 0.7 0.18 3.8 0.9512 0.6 0.15 3.0 0.75Total 16.6 4.15 43.3 10.83
Summary Water BudgetsWater use and wastewater flows are typically expressed in terms of gallons per day.Stormwater runoff is usually expressed in inches averaged over the entirecatchment. All flows were converted to inches averaged over the 100 acrecatchment with 1,000 residents. The common assumed values, presented earlier inthis analysis, are:
1. Population 1,0002. Area, acres 1003. Indoor water use, gpcd 604. Runoff coefficient 0.255. Conversion factors: 7.48 gallons = 1 cu ft
43,560 sq ft = 1 acre
The summary results for Denver, CO and New York, NY are presented in Tables 3-15 and 3-16. Denver results indicate a natural input from precipitation of 16.6inches per year and imported water of 17.15 inches per year, slightly more than thenatural input. The majority of the imported water is used for lawn watering. On theoutput side for Denver, I/I at 11.19 inches is the largest source of the 19.26 inches of

3-39
water going to the WWTP. Urban runoff contributes an additional 4.15 inches ofwater leaving the system. Nearly 40% of the urban runoff falls on roofs anddriveways. A good portion of that water could be retained on-site and infiltratedand/or used for lawn watering. Urban runoff alone is insufficient to provide sufficientwater for lawn watering. However, urban runoff and graywater do provide enoughwater to meet essentially all of the lawn watering needs.
New York results indicate a natural input from precipitation of 43.3 inches per yearand imported water of 11.57 inches per year, slightly more than a quarter of thenatural input. The majority of the imported water is used for indoor purposes. Onthe output side for New York, I/I at 9.69 inches is the largest source of the 17.76inches of water going to the WWTP. Urban runoff contributes an additional 10.83inches of water leaving the system. Nearly 40% of the urban runoff falls on roofsand driveways. A good portion of that water could be retained on-site and infiltratedand/or used for lawn watering. Urban runoff alone is sufficient to provide sufficientwater for lawn watering.
Future Urban Water ScenariosFuture scenarios for urban water use and wastewater discharges includecombinations of the following futures. Water use estimates in gallons per capita perday include the pro rata additional nonresidential use, which is included in the percapita figure.
• Status Quo: This scenario means continuing the current pattern of wateruse and wastewater disposal. The nationally mandated compulsory useof low flush toilets should reduce per capita consumption by 10-15 gpcd.Legitimate sewage quantities should be in the 75-90 gpcd range. This percapita figure includes the added water use of non-residential customersaveraged over the residential population. I/I would add another 50 to 400gpcd to these flows. Solids loading will remain the same; thus, DWFconcentrations will increase accordingly.
• Significant indoor water conservation: This scenario means replacingexisting plumbing systems with water conserving devices including low-flush toilets, low flow rate shower heads, lower water using appliances.Expected sewage quantities are in the 50-65 gpcd range. Some I/I controlis expected which reduces I/I to 25 to 300 gpcd. Increased DWFconcentrations are expected.
• Gray water systems with aggressive I/I control: This scenario is definedas the preceding scenario with on-site use of gray water for lawn wateringand toilet flushing. Expected sewage quantities are in the 30-45 gpcdrange. Also assumed is aggressive I/I control, which reduces I/I to 25 to100 gpcd. Much higher DWF concentrations will occur.
Thus, future water conservation and I/I control practices can be expected to have asignificant impact on wastewater discharges or dry-weather flow. Having to dealwith much lower volumes of water opens up opportunities for innovative stormwater

3-40
management. For example, Pruel (1996) suggests storing DWF on-site during wet-weather periods. If only black water has to be stored, then this option becomesmore attractive.

3-41
Table 3-15. Final monthly water budget for Denver, CO.
Monthly(All values are in inches)
Month Precip-itation
IndoorWaterUse
OutdoorWaterUse
Total DWF I/I Total UrbanRunoff
Days/month
1 0.5 0.69 0.00 0.69 0.69 0.34 1.03 0.13 312 0.7 0.62 0.00 0.62 0.62 0.43 1.05 0.18 283 1.3 0.69 0.17 0.86 0.69 0.89 1.58 0.33 314 1.5 0.66 0.55 1.22 0.66 0.99 1.66 0.38 305 2.0 0.69 1.03 1.71 0.69 1.37 2.06 0.50 316 2.5 0.66 1.93 2.60 0.66 1.66 2.32 0.63 307 2.4 0.69 2.40 3.08 0.69 1.64 2.33 0.60 318 2.2 0.69 2.00 2.68 0.69 1.51 2.19 0.55 319 1.2 0.66 0.77 1.44 0.66 0.80 1.46 0.30 3010 1.0 0.69 0.23 0.91 0.69 0.69 1.37 0.25 3111 0.7 0.66 0.00 0.66 0.66 0.46 1.13 0.18 3012 0.6 0.69 0.00 0.69 0.69 0.41 1.10 0.15 31
Total 16.6 8.07 9.08 17.15 8.07 11.19 19.26 4.15 365
Annual(All values are in inches)
Inputs: Quality AspectsPrecipitation 16.60 High qualityIndoor use 8.07 Black water 2.29 Could use low quality Gray water 5.78 Need high qualityOutdoor use 9.08 Need moderate quality Total 33.75Outputs:
Wastewater Legitimate 8.07 Requires high level of treatment I/I 11.19 Requires modest level of
treatmentUrban runoff 4.15 Requires little or no treatment Roofs 0.83 Requires little or no treatment Driveways 0.83 Requires little or no treatment Local streets 1.66 Requires little treatment Major streets 0.83 Requires moderate treatment Sub-total, outputs 23.41Recharge to localreceiving waters andgroundwater
10.34 Good quality because ofsubsurface infiltration
Total 33.74

3-42
Table 3-16. Final monthly water budget for New York, NY.
Monthly(All values are in inches)
Month Precip-itation
IndoorWaterUse
OutdoorWaterUse
Total DWF I/I Total UrbanRunoff
Days/month
1 3.0 0.69 0.00 0.69 0.69 0.69 1.37 0.75 312 4.0 0.62 0.00 0.62 0.62 0.82 1.44 1.00 283 4.0 0.69 0.00 0.69 0.69 0.91 1.60 1.00 314 3.0 0.66 0.00 0.66 0.66 0.66 1.33 0.75 305 3.0 0.69 0.46 1.14 0.69 0.69 1.37 0.75 316 3.5 0.66 0.77 1.44 0.66 0.77 1.44 0.88 307 4.0 0.69 1.14 1.83 0.69 0.91 1.60 1.00 318 3.8 0.69 0.80 1.48 0.69 0.87 1.55 0.95 319 4.2 0.66 0.33 0.99 0.66 0.93 1.59 1.05 3010 4.0 0.69 0.00 0.69 0.69 0.91 1.60 1.00 3111 3.8 0.66 0.00 0.66 0.66 0.84 1.50 0.95 3012 3.0 0.69 0.00 0.69 0.69 0.69 1.37 0.75 31
Total 43.3 8.07 3.5 11.57 8.07 9.69 17.76 10.83 365
Annual(All values are in inches)
Inputs: Quality AspectsPrecipitation 43.30 High qualityIndoor use 8.07 Black water 2.29 Could use low quality Gray water 5.78 Need high qualityOutdoor use 3.50 Need moderate quality Total 54.87Outputs:Wastewater Legitimate 8.07 Blackwater 2.29 Requires high level of treatment Graywater 5.78 Requires modest level of treatment I/I 9.69 Requires little or no treatmentUrban runoff 10.83 Roofs 2.17 Requires little or no treatment Driveways 2.17 Requires little or no treatment Local streets 4.33 Requires little treatment Major streets 2.17 Requires moderate treatment Sub-total, outputs 23.41Recharge to localreceiving waters andgroundwater
26.29 Good quality because ofsubsurface infiltration
Total 54.87
3-43
References
Basta, D.J. and B.T. Bower (Eds.) (1982). Analyzing Natural Systems: Analysis forRegional Residuals-Environmental Quality Management. Resources for the Future,Inc. Washington, D.C.
Cantor, K.P., R. Hoover, P. Hartage et al. (1987). Bladder cancer, drinking watersource, and tap water consumption. J. National Cancer Institute. 79(6): 1269-1279.
Clark, R., A. Perkins and S.E. Wood (1997). Water Sustainability in Urban Areas-AnAdelaide and Regions Case Study. Report One - An Exploration of the Concept.Dept. of Environment and Natural Resources. Adelaide, Australia. Draft.
Courtney, B.A. (1997). An Integrated Approach to Urban Irrigation: The Role ofShading, Scheduling, and Directly Connected Imperviousness. MS Thesis, Dept. ofCivil, Environmental, and Architectural Engineering. U. of Colorado. Boulder, CO.
Denver Water (1997). Comprehensive Annual Financial Report for the Year EndedDecember 31, 1996. Denver, CO.
DeOreo, W., J. Heaney and P. Mayer (1996). Flow Trace Analysis to Assess WaterUse. Journal of the American Water Works Association. Jan., p. 79-80.
Edwards, K. and L. Martin (1995). A Methodology for Surveying Domestic WaterConsumption. Journal of the Chartered Institution of Water and EnvironmentalManagement. Vol. 9, No. 5., p. 47-489.
Foster, K. E., M. M. Karpiscak and R. G. Brittain (1988a). Casa Del Agua: AResidential Water Conservation and Reuse Demonstration Project in Tucson, AZ.Water Resources Bulletin. 24(6):1201-1206.
Foster, K. E., M. M. Karpiscak and R. G. Brittain (1988b). Casa Del Agua: AResidential Water Conservation and Reuse Demonstration Project in Tucson, AZ.Water Resources Bulletin. 24(6), p. 1201-1206.
Friedler, E., D.M. Brown, and D. Butler (1996). A Study of WC Derived SewerSolids. Water Science and Technology. Vol. 33, No. 9, p. 17-24.
Fujita, S. (1996). Measures to promote stormwater infiltration. Proceedings of the7th International Conference on Urban Storm Drainage. Hannover, Germany. p.407-412.
Grimmond, C. S. B., T. R. Oke and D. G.Steyn (1986a). Urban Water Balance 1. AModel for Daily Totals. Water Resources Research. 22(10):1397-1403.
3-44
Grimmond, C. S. B. and T. R. Oke (1986b). Urban Water Balance 2. Results from aSuburb of Vancouver, British Columbia. Water Resources Research. 22(10):1404-1412.
Grotter, M., and R. Otterpohl (1996). Integrated Urban Water Concept. Proceedingsof the 7th International Conference on Urban Storm Drainage. Hannover, Germany.p. 1801-1806.
Harpring, J. S. (1997). Nature of Indoor Residential Water Use. MS Thesis, Dept. ofCivil, Environmental, and Architectural Engineering. U. of Colorado. Boulder, CO.
Heaney, J.P. (1994). Towards Integrated Urban Water System Management. Proc.HEC Workshop on Future Directions of Urban Hydrology. Davis, CA.
Heaney, J.P., L. Wright and Samsuhadi (1996). Risk Analysis in Urban StormwaterQuality Management. in Haimes, Y.Y., Moser, D.A., and E.Z. Stakhiv, (Eds.) Risk-Based Decision Making in Water Resources VII. ASCE. New York, NY. p. 219-248.
Henze, M., L. Somlyody, W. Schilling, and J. Tyson (Eds.) (1997). SustainableSanitation. Water Science and Technology. Vol. 35, No. 9.
Herrmann, T. and U. Klaus (1996). Fluxes of nutrients in urban drainage systems:assessment of sources, pathways and treatment technologies. Proceedings of the7th International Conference on Urban Storm Drainage. Hannover, Germany. p.761-766.
Imbe, M., T. Ohta and N. Takano (1996). Quantitative Assessment of Improvementin Hydrological Water Cycle in Urbanized River Basin. Proceedings of the 7thInternational Conference on Urban Storm Drainage. Hannover, Germany. p. 1085-1090.
Johnson, H., T.A. Stanstrom, J.S. Svensson, and A. Sandin (1997). Source-Separated Urine-Nutrient and Heavy Metal Contents Water Saving and FecalContamination. Water Science and Technology. Vol. 35, No. 9, p. 45-152.
Jones, D. E. (1971). Urban Water Resources Management Affects the Total UrbanPicture. Chapter 1F in Albertson, M.L., Tucker, L.S., and Taylor, D.C. (Eds.)Treatise on Urban Water Systems. Colorado State University. Ft. Collins, CO.
Joyce, J. (1995). Odor and Corrosion Control in Collection System: A GrowingProblem? Water Environment federation. Sewers of the Future. Alexandria, VA.P.9-1 to 9-12.
Karpiscak, M. M., K. E. Foster and N. Schmidt (1990). Residential WaterConservation: Casa Del Agua. Water Resources Research. 26(6):939-948.

3-45
Karpiscak, M.M., R.G Brittain and K.E. Foster (1994). Desert House: ADemonstration/Experiment in Efficient Domestic Water and Energy Use. WaterResources Bulletin. Vol. 30, No. 2, p. 329-334.
Law, I. (1997). Domestic Non-potable Reuse – Why Even Consider it? Water,May/June.
Kneese, A.V., R.U. Ayres and R.C. d'Arge (1970). Economics and the Environment-A Materials Balance Approach. The Johns Hopkins Press. Baltimore, MD.
Maddaus, W.O. (1987). Water Conservation. American Water Works Association.Denver, CO.
Mayer (1995). Residential Water Use and Conservation Effectiveness: A ProcessApproach. Master's Thesis, University of Colorado. Boulder, CO.
Mayer, P. W., W. B. De Oreo, J. O. Nelson, E. Opitz and R. Allen (1997). NorthAmerican Residential End Use Study Progress Report to American Water WorksAssociation Research Foundation. Denver, CO.
McPherson, M.B. (1973). Need for Metropolitan Water Balance Inventories. Jour. ofthe Hydraulics Div. ASCE. 99, HY10, p. 1837-1848.
McPherson, M.B. et al. (1968). Systematic Study and Development of Long-RangePrograms of Urban Water Resources Research. Report to Office of WaterResources Research. NTIS No. PB 184 318. Washington, D.C.
Mitchell, V.G., R.G. Mein and T.A. McMahon (1996). Evaluating the ResourcePotential of Stormwater and Wastewater: an Australian Perspective. Proceedings ofthe 7th International Conference on Urban Storm Drainage. Hannover, Germany. p.1293-1298.
Nelen, A.J.M., A.C. de Ridder and E.C. Hartman (1996b). Planning of a New UrbanArea in a Municipality of Ede. Using a New Approach to Environmental Protection.
Pruell, H.C. (1996). Combined Sewage Prevention System (CSPS) for DomesticWastewater Source Control. In Proceedings of the 7 th International Conference onUrban Storm Drainage. Hannover, Germany. P. 193-198.
Sakrison, R.G. (1996). New Urbanism, Growth Management and the Effect onMetropolitan Water demands. Proc. of Conserv 96, ASCE, AWRA, and AWWA.Orlando, FL. p. 19-26.
Sieker, F. and H-R. Verworn. (Eds.). Proceedings of the 7th InternationalConference on Urban Storm Drainage. Hannover, Germany. p. 259-264.

3-46
Stephenson, D. (1996). Evaluation of Effects of Urbanization on Storm Runoff.Proceedings of the 7th International Conference on Urban Storm Drainage.Hannover, Germany. p. 31-36.
Stadjuhar, L. (1997). Outdoor Residential Water Use. Master’s Thesis, Universityof Colorado. Boulder, CO.
US Environmental Protection Agency (USEPA) (1979). 1978 Needs Survey CostMethodology for Control of Combined Sewer Overflow and Stormwater Discharges.EPA-430/9-79-002. Washington, DC.