chapter 3. technology transfer
TRANSCRIPT

59
CHAPTER 3. TECHNOLOGY TRANSFER The technology transfer carried out in this project covered all the mapping processes except Aerial photography. The covered processes were:
1. Premarking of GCP (Setting of Aerial Signal) 2. GPS Survey 3. Leveling and Pricking 4. Field Identification 5. Field Completion 6. Aerial Triangulation 7. Digital Plotting 8. Digital Compilation 9. Data Structurization 10. Map Symbolization
Trainings of the former five processes were conducted in the field. The data acquired through these trainings were employed for the actual mapping in this project. Details of each process are reported in CHAPTER 2. Trainings of the latter five processes were conducted indoors at DCIG with computer systems. All the trainees are listed in APPENDIX 2.
Table 3.1 Technology transfer sessions
Subject Period Contents Number of participants (trainees)
Remarks
Premarking of GCP (Setting of Aerial signal)
1~11 May 2007
Explanation of purpose and method (materials, allocation, ground condition)Setting of aerial signals at 22 points
4 2-3 signals per day
GPS Survey 19 June ~2 July 2007
Explanation of purpose and method of GPS observation and leveling. Instruction of manipulation of GPS and leveling devices. Training of manipulation of GPS and leveling devices.
4 At CM01 & AZ001

60
Training of GPS observation GPS observation at 23 points
Leveling and Pricking
3 July ~ 16 Aug. 2007
Training of leveling (adjustment, observation) Leveling for 200km Pricking for 135 points
4 7 km per day
Field Identification
20Aug. ~26 Sept. 2007
Explanation of purpose and method of Field identification Field identification for 1,200km2
4
Filed Completion
8 Oct. ~ 17 Nov. 2008
Method of putting the results onto the symbolized map sheets Field completion for 1,200km2
11
Aerial Triangulation
30 Oct. ~ 17 Nov. 2008
Creation of camera files and data files of ground control points Inner orientation Observation of pass points and tie points Observation of control points Adjustment computation
2
Digital Plotting
1 Nov. ~ 3 Dec. 2009
Review of Aerial Triangulation Creation of Library Catalog Various settings for digital plotting
1
Digital Compilation
1 Nov. ~ 3 Dec. 2009
Training of MicroStation Feature creating Data cleaning Creating topology
2
13 Oct. ~ 16 Nov. 2008
2 Data
Structurization 15 Nov. ~ 21 Dec. 2009
Understanding the concept of GIS The operation of GIS software The methodology to prepare GIS data base from the complied plotting data. 5
Symbolization
1 Nov. ~ 3 Dec. 2009
Training of MicroStation for symbolization 2

61
3.1. Premarking of GCP (Setting of Aerial Signal) This work was performed by technical staff members of DTC under the instruction of the Team. During the work, they learned the purpose of premarking of ground control points (GCPs), proper distribution of GCPs, suitable materials, design and color of aerial signal and use of handy GPS. All the established signals were recognized on the aerial photographs which were taken later. The trainees have attained the target level to perform future practical works.
3.2. GPS Survey This work was performed by technical staff members of DTC under the supervision of the Team. As they did not have experience in GPS survey, they were briefly trained on operation of GPS equipment before GPS observation. Throughout the observation, they have acquired the skill. All the results of the observation were used for aerial triangulation which was done later in Japan. They have attained the target level to perform future practical works.
3.3. Leveling and Pricking This work was performed by technical staff members of DTC under the supervision of the Team. Digital leveling method was applied to this project. As they did not have experience in digital leveling, they were trained to learn operation of digital leveling equipment before the work. During the work, they have mastered the skill. All the results of the leveling were also used for aerial triangulation which was done later in Japan. It is evaluated that they have attained the target level to perform future practical works.
3.4. Field Identification This work was performed by technical staff members of DTC and others under the supervision of the Team. They learned stereoscopic viewing, photo-interpretation, on-site identification of topographic features comparing with aerial photographs, compilation of the results on the photographs. All of the results they made were used for digital plotting which was done later in Japan. It is evaluated that they have attained the target level to perform future practical works.
3.5. Field Completion This work was performed by technical staff members of DTC and others under the supervision of the Team. They learned on-site checking of topographic features which had been plotted on the map in Japan. They also learned map compilation of the features which they corrected on-site. All the results they made were used for digital compilation and map symbolization which were done later in Japan. It is evaluated that they have attained the target level to

62
perform future practical works.

63
3.6. Aerial Triangulation The training on aerial triangulation was conducted at DCIG in November 2008. Two (2) trainees from DCIG participated in this session. The trainees are listed in APPENDIX 2. The target level to attain is that they can do voluntary training. Before the start of training, the
Team investigated their skills and knowledge on the aerial triangulation with a questionnaire in order to meet their needs for the technology transfer. Their responses are attached as
APPENDIX 7.
3.6.1. Training session Training of the aerial triangulation was not given every day but every Monday morning and Wednesday morning, because these trainees also participated in the session of Data Structurization. The training session was conducted as shown in Table 3.2.
Table 3.2 Training session of the Aerial Triangulation (2008)
Date Contents
30-Oct Thu Explanation about the software
Weekend
2-Nov Sun
3-Nov Mon How to operate the software
4-Nov Tue
5-Nov Wed Aerial Triangulation Step 1 (Create New Block & Add Frame to the List)
6-Nov Thu
Weekend
9-Nov Sun
10-Nov Mon Aerial Triangulation Step 2 (Interior Orientation & Acquisition of Ground
Control Points)
11-Nov Tue
12-Nov Wed Aerial Triangulation Step 3 (Automatic Tie Points Generation & Block
Adjustment)
13-Nov Thu
Weekend
16-Nov Sun
17-Nov Mon Aerial Triangulation Step 4 (DEM Extraction & Orthorectification /
Mosaicking)

64
Create New Block File
Interior Orientation
Observation of Ground Control Points
Generation of Automatic Tie Points
Add image to the block file
Block Adjustment
DEM Extraction
Orthorectification / Mosaicking
3.6.2. Contents The training was carried out based on Figure 3.1. The software used was LPS (Lieca Photgrammetry Suite) version 9.2. Interface of this software is user-friendly and it is designed in order to understand easily and execute a sequence of work flow from aerial triangulation work to digital plotting. Modules of LPS used for training with regard to aerial triangulation are shown below.
①. LPS Core ②. LPS Stereo ③. LPS ATE (Automatic Terrain
Extraction) ④. LPS TE (Terrain Editor) ⑤. Mosaic Pro
Figure 3.1 Flow of the Aerial Triangulation in LPS

65
Figure 3.2 Interface of LPS
①. Add Images ②. Frame Editor (Interior Orientation) ③. Point Measurement (Observation of ground control points) ④. Auto Tie (Generation of automatic tie points) ⑤. Triangulation (Block adjustment) ⑥. DEM Extraction ⑦. DEM Editing ⑧. Ortho Resampling ⑨. Ortho Mosaicking ⑩. Feature Collection (This is an item on next year’s technology transfer)
Order of work flow
① ② ③ ④ ⑤ ⑥ ⑦ ⑧ ⑨ ⑩

66
Equipment used for the training Aspect of training
Figure 3.3 Aspect of technology transfer for the aerial triangulation
First, the Team prepared instruction materials for the trainees. The training material such as images was not from the aerial photos taken in this project. The photos used were prepared from other places because the photos taken in this project were unsuitable for trainees to look the ground relief by 3D visualization due to the flat landform of the Study area.
a) Crating a new block file
In this step, a new block file is created for the aerial triangulation. And information such as kind of camera used for photography, coordinate system and so on is set into the block file.
Sample of Setting windows for the block file
Trainees set the information under the instruction of the Team. And they could set without problems.

67
b) Adding image to the block file
In this step, images to be used for the aerial triangulation are registered into the block file.
Sample of Setting window
They could conduct this work without problems.
c) Interior Orientation
This is the process of defining the internal geometry of the camera used for photography. Fiducial marks are measured on the image and then compared to the calibrated positions of the camera to derive a solution.
Sample of Setting windows for the interior orientation
Trainees could conduct this process under the instruction of the Team. They, however, must conduct carefully this process which is including inputting camera information and observation of the fiducial marks.

68
d) Observation of Ground Control Points (GCPs)
In this step, GCPs are observed for the block adjustment (aerial triangulation) by operators. This work is very important for the block adjustment. If this is not conducted correctly, the result of the block adjustment shall be wrong. Therefore, capacity for map reading is required to operator for observing GCPs accurately.
Sample of Setting windows for the interior orientation
Although it took time, trainees could conduct this. They however must skill up the capacity of map reading.
e) Generation of Automatic Tie Points
This is the process of generation of automatic tie points using image matching technology of the software. In this software, both pass points and tie points are called tie points.
Sample of Setting windows for generation of automatic tie points
Although the image matching function is very useful for user, the result is not always accurate. Therefore, the result must be checked visually by operator one by one.

69
The trainees could conduct this process without problems because this step is only to set any parameters. They have tendency to trust the result by software. But, it is necessary to try to check the result by software carefully.
f) Block Adjustment
This is the process of defining the mathematical relationship between the images contained within a block, the camera model that obtained the images, and the ground.
Sample of Setting windows and the result for the block adjustment.
Trainees could conduct this process under the instruction of the Team. They, however, must understand theory of this process and each meaning of various parameters.
g) DEM Extraction
In this step, DEM is extracted automatically from stereo models which are established by the result of the block adjustment.
Sample of Setting windows for the DEM extraction.

70
Trainees could conduct this process under the instruction of the Team. They however must study further meaning of parameters and difference of the result by parameters.
h) Orthorectification / Mosaicking
In this step, the ortho image is generated by using DEM made in above step and the result of aerial triangulation. And the ortho image for large area is generated by mosaicking.
Sample of Setting windows for the Orthorectification / Mosaicking
Trainees could conduct this process under the instruction of the Team. They, however, must study further information about various parameters for the mosaicking. Because there are various options and techniques for color adjustment among neighboring images in the mosaicking process.
3.6.3. Evaluation of trainees and future tasks
a) Evaluation
The team evaluated trainees through the training and as the result of the training. The evaluation was done from the following aspects.
Table 3.3 The aspects of evaluation for the Aerial Triangulation
Aspects Contents
1 Basic Knowledge Basic knowledge about Photogrammetry, Cartography, Software and this project at start of this training.
2 Motivation Motivation to understand this training and to apply the result

71
Aspects Contents
of this training.
3 Understanding Understanding about the contents of the training
4 Mathematical theory Understanding about the mathematical theory of aerial triangulation.
5 LPS Well understanding and manipulation about LPS.
6 Improvement The improvement of understanding and motivation through this training.
7 Future The possibility for future application of this training and the data
b) Conclusion and future task
The training was planned in consideration of period, skills and knowledge of trainees. The Team decided that training should be started from software operation not theoretical explanation. The aim of the Team was that trainees studied the theory by themselves after they learned the work steps through the way of software operation. As current situation, the Team evaluated that the trainees can operate the software. On the other hand, it is expected that the trainees would study and practice more about 3D viewing and measuring by using the material of the training by themselves continuously.
The Team gives the following items for their future task.
Practicing using the material of training whenever they have a time. Trying to change the value of parameters in each step and understand their difference. Appreciating the theory of aerial triangulation and its mathematical theory. Having occasions to learn about ground control survey because its knowledge is
involved to the aerial triangulation. Improving capacity for map reading. Improving their English skill because language in software is English.

72
3.7. Digital Plotting The training on Digital Plotting was conducted at DCIG through November to the beginning of December 2009. One trainee from the Direction of Land Development and Regional Action (DATAR) participated in this session. The target level to attain is that he can do voluntary training. Before the start of training, the Team investigated his skills and knowledge on digital plotting with a questionnaire in order to meet his needs for the technology transfer. His response is attached as APPENDIX 7. In practical work, aerial triangulation must have been completed in order to perform the next process of digital plotting. Otherwise, digital plotting is impossible because stereo models established by aerial triangulation are indispensible for data acquisition in 3D visualization. The trainee did not take the session of Aerial Triangulation conducted in 2008. Therefore, a brief training of aerial triangulation was given to him before starting the session of Digital Plotting.
3.7.1. Training Session The training sessions are shown in Table 3.4.
Table 3.4 Training session of Digital Plotting (2009)
Date Contents
01-Nov Sun Instruction of Technology transfer
(Digital plotting, Digital Compilation, Symbolization)
02-Nov Mon Explanation of software used
03-Nov Tue Review of Aerial Triangulation
04-Nov Wed Review of Aerial Triangulation
05-Nov Thu Review of Aerial Triangulation
Weekend
08-Nov Sun Review of Aerial Triangulation
09-Nov Mon Preparation for Digital Plotting (Creation of Library Catalog)
10-Nov Tue Preparation for Digital Plotting (Creation of Library Catalog)
11-Nov Wed Preparation for Digital Plotting (Creation of Library Catalog)
12-Nov Thu Preparation for Digital Plotting (Creation of Library Catalog)
Weekend
15-Nov Sun Various settings for Digital Plotting
16-Nov Mon Various settings for Digital Plotting

73
Date Contents
17-Nov Tue Various settings for Digital Plotting
18-Nov Wed Various settings for Digital Plotting
19-Nov Thu Practice
Weekend
22-Nov Sun Practice
23-Nov Mon Practice
24-Nov Tue Practice
25-Nov Wed Practice
26-Nov Thu Practice
Weekend
29-Nov Sun Practice
30-Nov Mon Evaluation of trainees
1-Dec Tue Evaluation of trainees
2-Dec Wed Evaluation of trainees
3-Dec Thu Generalization
3.7.2. Contents The training was carried out based on Figure 3.4. The software used was LPS (Leica Photogrammetry Suite) version 9.2 and Bentley MicroStation XM edition (hereinafter MicroStation). Modules of LPS used for training with regard to plotting are shown below.
①. LPS Core ②. LPS Stereo ③. Pro600 (Pro600 runs on MicroStation platform)

74
Figure 3.4 Flow of Digital Plotting in LPS
Digital photogrammetric system used (LPS and MicroStation are installed)
Instruction
Figure 3.5 Aspect of technology transfer for digital plotting
Create a Project File
Create a Library Catalog
Setting of TopoMouse
Data acquisition

75
Aerial triangulation in the project was carried out for about 2,000 km2 using approximately 450 photos. However, the Team used only 3 photos in the training so that trainees could learn easily the contents of digital plotting and aerial triangulation. Figure 3.6 shows footprint of photos used in the training. Photos overlap to vertical direction because flight direction in the project was north – south direction. But, a stereo model is displayed right - left.
Figure 3.6 Footprint of images
a) Creating a Project File.
To conduct digital plotting using LPS and MicroStation, a Project File must be created in the Pro600 module, and various files and parameters must be set in it. Condition and circumstance of data acquisition are set in the Project File. The Team has lectured contents of the Project File and explained meaning of each parameter step by step.

76
Compendium of the Project File
b) Create a Library Catalog.
The Library Catalog must be created depending on the map specification. Therefore, the contents of maps specification must be understood while the Library Catalog is created. The contents of Library Catalog created must follow the map specification of the project as shown below. Left side in the following images is default setting. On the other hand, right side is the project setting. The code number of each feature has followed the map specification of the project. Otherwise, any features during data acquisition are not stored in appropriate layers and data quality shall be low. The Team has lectured how to create Catalog for each feature. To create Catalog for each feature correctly, character of each feature has been considered.

77
Default Library Library for the project
c) Setting of TopoMouse
The TopoMouse was installed in the project. In that connection, there are the TopoMouse, the Stealth 3D mouse, the system mouse, the Immersion SoftMouse, the handwheels and footdisk set, and the mouse-trak trackball for data acquisition by 3D visualization, generally. The TopoMouse has 16 buttons and a wheel as shown below. Moreover, 31 functions exist by combination of buttons. Therefore, it is not easy to learn all functions in short term. A lot of practice shall be necessary to master them.

78
d) Data acquisition
To acquire the accurate data, operator has to pay the attention to various points such as order of data acquisition, how to interpret features on photos, observation of feature’s height and so on. Therefore, it shall take a fair amount of time to master correctly all points for data acquisition and to become independent. It is necessary to practice at short intervals. In this section, the Team observed trainee’s aspect during data acquisition and gave him instruction. The aspect of stereo model is shown in Figure 3.7. In this report, stereo model is shown on anaglyph mode to show it visually. In practical work, stereo model is displayed on stereo display but anaglyph mode
Figure 3.7 Stereo Model in LPS

79
The following images are sample of order of data acquisition.
1. Line data which shall be bones. (road, railway, river, canal, lake, shore line, power line, pipe line and so on)
2. Data of buildings, small objects, land marks and plottage. (various buildings, fences, revetments, wells, various tanks, transformer stations, various towers, cemeteries and so on)
3. Vegetation data (rice field, crop field, orchard, various plantation, forest, bush and so on)
4. Terrain data (contour, cliff, spot height and so on)

80
3.7.3. Evaluation of trainee and future tasks
a) Evaluation
The Team evaluated trainees through the training and as the result of the training. The evaluation was done from the following aspects.
Table 3.5 The aspects of evaluation for the Digital Plotting
Aspects Contents
1 Basic Knowledge Basic knowledge about Photogrammetry, Cartography, Software and this project at start of this training.
2 Motivation Motivation to understand this training and to apply the result of this training.
3 Understanding Understanding about the contents of the trainning
4 LPS Well understanding and manipulation about LPS.
5 Pro600 Well understanding and manipulation about Pro600.
6 MicroStation Well understanding and manipulation about MicroStation.
7 TopoMouse Manipulation of TopoMouse
8 Data acquisition Well understanding and manipulation about Data acquisition.
9 Improvement The improvement of understanding and motivation through this training.
10 Future The possibility for future application of this training and the data
b) Conclusion and future task
This trainee had experienced in manipulating ERDAS IMAGINE, which is base software of LPS. Therefore, he could easily understand the manipulation of LPS and could operate it without trouble. He participated in the training session in a positive manner, precisely taking notes of explanations given by the Team. His level of skill in manipulation of TopoMouse is still low because this manipulation is rather complicated for a beginner. He will be able to make rapid progress in data acquisition of planimetric features if he continues a little more exercise, but, as for terrain features such as contour lines, he is required to do much more and intensive exercise in data acquisition with 3D view. The Team gives the following items as his future tasks to become independent.

81
Improving knowledge and skills of feature measurement on 3D view. Improving knowledge and skills of photo interpretation. Improving knowledge and skills of geographic features acquisition with 3D photo
viewing corresponding map scale.

82
3.8. Digital Compilation The training on Digital Compilation was conducted at DCIG through November to the beginning of December 2009. Two (2) trainees from the Société Nationale de l’Eau (SNDE) participated in this training session. They are listed in APPENDIX 2. The target level to attain is that they can do voluntary training. Before the start of training, the Team investigated their skills and knowledge on digital compilation with a questionnaire in order to meet his needs for the technology transfer. Their response is attached as APPENDIX 7. On the first day, the Team gave a lecture to the trainees to explain the purpose of Digital Compilation and its relation to Digital Plotting and Symbolization.
Figure 3.8 Explanation about the session
3.8.1. Training session The training session was conducted as shown in Table 3.6.
Table 3.6 Training sessions of the Digital Compilation (2009)
Date Contents
01-Nov Sun Explanation about technology transfer (Digital plotting, Digital Compilation, Symbolization)
02-Nov Mon Basic Training of MicroStation
03-Nov Tue Basic Training of MicroStation

83
Date Contents
04-Nov Wed Basic Training for Creation of Manuals
05-Nov Thu Basic Training of MicroStation for symbolization
Weekend
08-Nov Sun Basic Training of MicroStation for symbolization
09-Nov Mon Basic Training of MicroStation for symbolization
10-Nov Tue Lecture for Data-Type (Point, Line, Polygon) Summary of Digital Compilation (Data Cleaning, Create Topology) Explanation about Feature Catalog
11-Nov Wed Lecture for Data Cleaning (Tools for Data Cleaning, The kinds of errors)
12-Nov Thu Practice for Data Cleaning (Errors and Tolerance and their effects.)
Weekend
15-Nov Sun Practice for Data Cleaning
16-Nov Mon Summarization and documentation of Data Cleaning
17-Nov Tue Lecture for Creating Topology (Tools for Creating Topology)
18-Nov Wed Practice for Creating Topology
19-Nov Thu Summarization and documentation of Data Cleaning
Weekend
22-Nov Sun Practice1, Practice2
23-Nov Mon Practice3
24-Nov Tue Practice4
25-Nov Wed Practice4
26-Nov Thu The lecture for Quality Control of Digital Compilation
Weekend
29-Nov Sun Practice5
30-Nov Mon Practice5
1-Dec Tue Evaluation of trainees
2-Dec Wed Evaluation of trainees
3-Dec Thu Generalization
a) The basic manipulation of MicroStation
From the response to the Questionnaire (See APPENDIX 7), the situation that all trainees have never touched to any CAD software (MicroStation, AutoCAD, etc) was confirmed, therefore the Team planned the program to start from the basic manipulation of

84
MicroStation.
In this lecture, the Team lectured and practiced for the basic manipulation of MicroStation and the method of making manuals by themselves.
STEP1: Drawing
Lecture about tools and basic method for drawing of points, lines, polygons and texts.
STEP2: Modifying Lecture about tools and basic method for modifying points, lines, polygons and texts.
STEP3: View, Raster, Layer, File Control
Lecture about tools and basic method for view, raster, layer, and file control.
b) The objects which need to be modified in digital compilation
The Digital Compilation could be separated into 2 major parts, Data Cleaning and Creating Topology. To learn Data Cleaning and Creating Topology, it is very important to understand the Feature Catalogue which is used in this project is very important. Trainees learned about the Feature Catalogue and classified each objects.
Table 3.7 The objects and works concerning to Data Cleaning and Creating Topology
Objects Works in Data Cleaning Works in Creating Topology
All Remove Errors (Duplication, Short objects)
Lines for Network Analysis Remove Errors (Gaps, Dangles)
Lines for Creating Polygons Remove Errors (Gaps, Dangles) Creating Polygons

85
Table 3.8 The example of classification of objects in Feature Catalog
No Catėgorie Code Désignation Data Type ObservationsClassification pourcreer dePOLYGONE
40Hydrographie et dé
tails particuliers 5101 Lac, Etang, Mare Polygone La surfipercifie immergée interprétable sur les photos aériennesdont le côté le plus court est supérieur à 20m sera saisie. polygone
41 5102 Sebkha Polygone La sebkh dont le côté le plus court est supérieur à 100m serasaisi. polygone
42 5103 Oued Polygone La zone immergée au moment de pluie don’t le côté le plus courtest supérieur à 100m sera saisie. polygone
43 5104 Zone inondable Polygone La zone innondable dont le côté le plus court est supérieur à100m sera saisie. polygone
44 5105 Talweg(Lit de oueds) Ligne Le lit de oueds dont la longeur est en supérieure à 100m serasaisie. ×
45 5106 Marais salant Polygone Le marais salant don’t le côté le plus court est supérieur à 50msera saisi. polygone
46 5107 Trait de côte(Cordon littoral) Ligne Le trait de côte(cordon littoral) au moment de la prise de vueaérienne sera saisi. ○
47 5201 Wharf Ligne(Polygone) △
48 5202 Jetée Ligne(Polygone) △
49 5203 Brise-lames LignePolygone Les brise-lames seront encadrées et annotées. △
50 5204 Revêtement Ligne Le revêtement en béton don’t le côté le plus court est supérieurà 50m sera saisi. ×
51Végetation
6001 Limite de la Végétation Ligne ○
52 6002 Herbes Polygone Le terrain herbu dont le côté le plus court est supérieur à 100msera saisi. Symbol
53 6003 Buisson PointPolygone
Le terrain buissonneux dont le côté le plus court est supérieur à40m sera saisi.Si des buissons sont éparpillés dans d'autres zones devégétation, ils seront représentéés par des points.
Symbol
○:Utilizer comme linéament
△:Utilizer deponds de situation
×:Utilizer jamaisPolygone:Etre deja "polygone"Symbol: Pour soulement creation de "polygone"
c) Data cleaning
Tools, Errors and Tolerances The major tools in Data Cleaning are to find Gaps and find Dongles. To make the trainees understand well about the errors from each tools in Data Cleaning and the setting of tolerance, the Team advanced the training using following sample.

86
The sample for understanding Errors and Tolerances
d) About tools of finding gaps
In case of following setup of finding gaps, the errors (Red cursors) came as the following figure.
The setting The results of errors from finding gaps

87
e) About tools of finding dangles
In case of following setup of finding dangles, the errors (Red cursors) came as following figure.
The setting The results of errors from finding dangles
f) Creating Topology
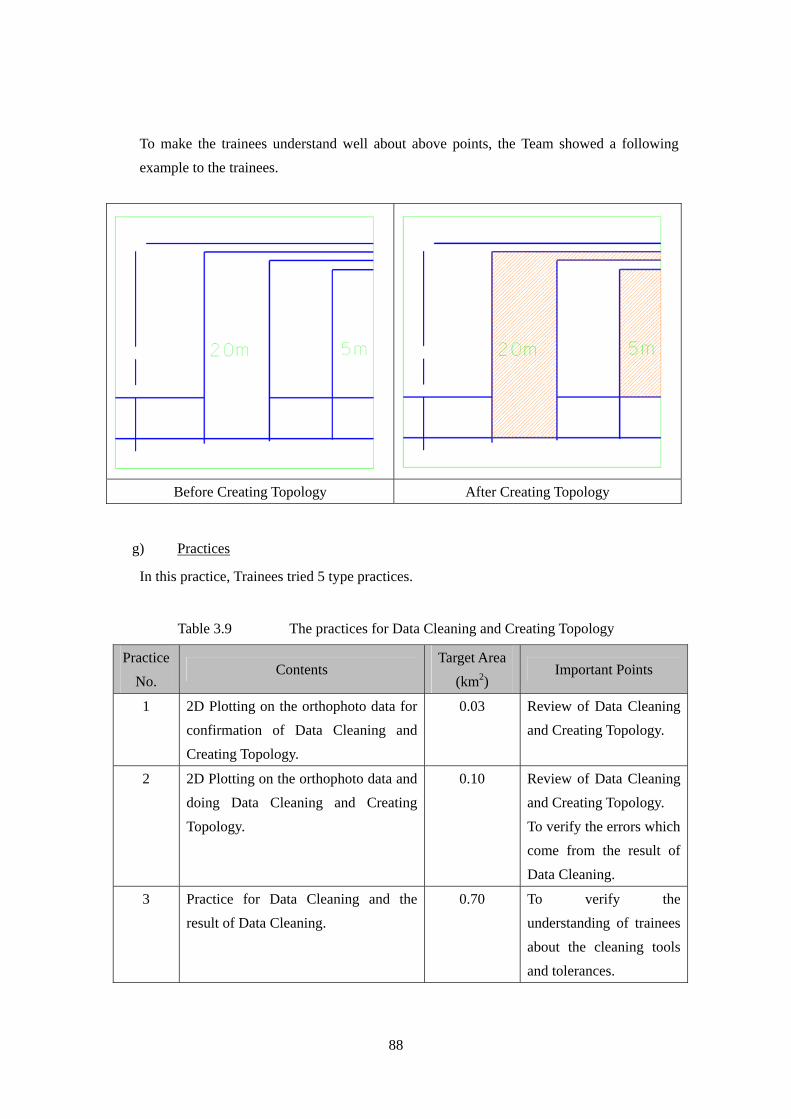
For creating polygons the main tool is Creating Topology. The team explained about the important points in the Creating Topology.
Before Created topology, all gaps and dangles must be fixed. The areas which have symbols in their range could be made polygon. The elements should be segmented at every cross points. The polygons are created into active layer.
And then the team explained about tools and manipulation for creating topology.
88
To make the trainees understand well about above points, the Team showed a following example to the trainees.
Before Creating Topology After Creating Topology
g) Practices
In this practice, Trainees tried 5 type practices.
Table 3.9 The practices for Data Cleaning and Creating Topology
Practice No.
Contents Target Area
(km2) Important Points
1 2D Plotting on the orthophoto data for confirmation of Data Cleaning and Creating Topology.
0.03 Review of Data Cleaning and Creating Topology.
2 2D Plotting on the orthophoto data and doing Data Cleaning and Creating Topology.
0.10 Review of Data Cleaning and Creating Topology. To verify the errors which come from the result of Data Cleaning.
3 Practice for Data Cleaning and the result of Data Cleaning.
0.70 To verify the understanding of trainees about the cleaning tools and tolerances.

89
4 Practice for Data Cleaning and Creating Topology in vegetation area. Quality check for the result of Creating Topology.
2.00 To edit lines concerning the polygons which are being created after the digital compilation.
5 Final practice for Data Cleaning and Creating Topology in urban area.
3.00 To define the lines which are necessary for Data Cleaning and Creating Topology.
Practice 1 The Team prepared a pilot area as first practice.
The result of 2D plotting on the image by trainee.
The result of Data cleaning and Creating Topology
90
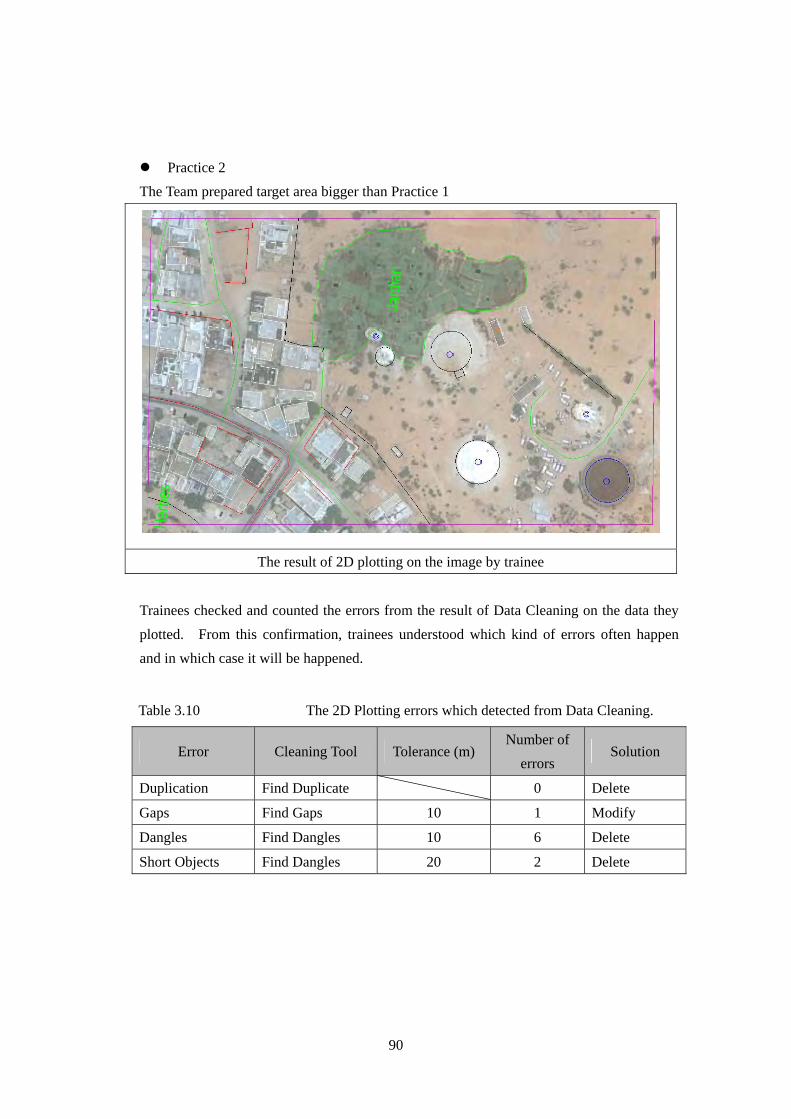
Practice 2
The Team prepared target area bigger than Practice 1
The result of 2D plotting on the image by trainee
Trainees checked and counted the errors from the result of Data Cleaning on the data they plotted. From this confirmation, trainees understood which kind of errors often happen and in which case it will be happened.
Table 3.10 The 2D Plotting errors which detected from Data Cleaning.
Error Cleaning Tool Tolerance (m) Number of
errors Solution
Duplication Find Duplicate 0 Delete
Gaps Find Gaps 10 1 Modify
Dangles Find Dangles 10 6 Delete
Short Objects Find Dangles 20 2 Delete

91
The 2D plotting errors which are detected by trainees
The result of Data Cleaning and Creating Topology
Practice 3 The Team prepared a data which has already contains some errors in it. Trainees executed Data Cleaning on the road network to find out these errors.
The data for Practice 3

92
Table 3.11 The prepared errors by the Team for Practice 3
Error Number of errors
Duplication 2
Gaps 7
Dangles 3
Short Objects 2
As the result from this Practice, trainees found and understood the difference between errors and each tools and tolerances.
Table 3.12 The errors of road network which detected from Data Cleaning
Errors Cleaning
Tool Tolerance
(m) Number of errors
Solution Remarks
Duplication Find Duplicate
2 Delete OK
Gaps Find Gaps 20 9 Modify
There are some small objects which occurred because of being cut by Neatline. However they are not to be modified.
Dangles Find Dangles 30 5 Delete
There are some overshoots because of the road stops suddenly or connects another kind of road (See Blue Circle). They are not to be modified.
Short Objects
Find Dangles 30 2 Delete OK

93
The errors which are detected by trainees
Practice 4
The team prepared following data as practice. The area covered mainly sea area, sandy area, and vegetation area.
The data for Practice 4

94
Table 3.13 The classification of layers for Creating Topology
Layer Object Use / No Use Remarks 2002 Voie Goudronnées Use 2004 Piste Use 2005 Sentier Use 2006 Piste aménagée Use 2102 La ligne central de Voie Goudronnées No Use 3001 Bâtiment No Use 3005 Habitat précaire No Use 3006 Bâtiment en chantier No Use 3007 Bâtiment en ruine No Use 4202 Clôture en haie Use Use some 4204 Autre limites Use 5101 Lac, Etang, Mare No Use 5104 Zone inondable Use 5107 Ligne côtière Use 6001 Limite de la Végetation Use 6002 Herbes Use Symbol 6004 Arbustes Use Symbol 7201 Zone sableuse Use Symbol 7204 Escarpement No Use 8302 Depôt Use Symbol
The result of Data cleaning and Creating Topology of Practice 4

95
Practice 5
The Team prepared following data as practice. The area covered mainly urban area. In urban area, there are much more layers than other area and there are a lot of mixed lines complicatedly, which are needed and not needed for Creating Topology. The points are to find the area should be created polygons and distinguish the necessary layer.
Table 3.14 The polygons which should be created in this Practice
Layer Polygons Number of appearance
2002 Voie Goudronnées 1
2010 Terre plein central 26
3103 Ecole 2
3107 Hopital 2
4117 Cimetière 2
5104 Zone inondable 2
6002 Herbes 5
6004 Arbustes 1
6007 Jardins 4
7201 Zone sableuse 5 Notice: Hospital and Schools are not necessary to be polygonized in this project, but there are targets in this practice.

96
Table 3.15 The result and evaluation of Practice 5
Layer Polygons Number of appearance
Result
2002 Voie Goudronnées 1 Good
2010 Terre plein central 26 Good
3103 Ecole 2 Good
3107 Hopital 2 Good
4117 Cimetière 2 A created area was not proper because the border was not enclosed (Gap)
5104 Zone inondable 2 Good
6002 Herbes 5 Good
6004 Arbustes 1 created area was not proper because the border was not enclosed
6007 Jardins 4 Some lines enclose an area ware not segmented so that an area was not polygoned successfully
7201 Zone sableuse 5 Created area was not proper (an area has duplication) because the border was not enclosed
The errors and the result of Practice 5 The result after modification of above errors of Practice 5

97
h) Quality Control
For the check on the result of created polygons (Practice 4), it is necessary to overlay the polygon layers on the original data, and compare the symbols and created polygons. The following cases are found from this check.
Table 3.16 The type of errors from Creating Topology
Case State Cause Solution
1 There is a polygon in an area which has no symbol.
The area was not enclosed. Data Cleaning
2 There is an area which has no polygon though there are some symbols in the area.
Creating Topology process was missed
Creating Topology on this area
3 There is no polygon in the area where a polygon should be created.
The miss of putting of symbol inside the area
Put a symbol inside the area.
Table 3.17 Examples of errors as a result from Create Topology
Case Cause Example
Case1 The Sea area is covered by “Sableuse”. The line was not connected, the Gap was not detected because the distance was more than “Tolerance” set.

98
Case2 The area between “Herbes” (actually road) was covered by “Zone Sableuse”. Because the area “Zone Sableuse” was not closed.
Case3 The “Polygon Creation” has skipped.

99
3.8.2. Evaluation of trainees and future tasks
a) Evaluation
The team evaluated trainees through the training and as the result of the training. The evaluation was done from the following aspects.
Table 3.18 The aspects of evaluation for the Digital Compilation
Aspects Contents
1 Basic Knowledge Basic knowledge about Photogrammetry, Cartography, Software and this project at start of this training.
2 Motivation Motivation to understand this training and to apply the result of this training.
3 Theory Well understanding and good motivation for the acquisition toward theory.
4 Manipulation Well understanding and good motivation for the acquisition toward manipulation of software.
5 MicroStation Well understanding and manipulation about MicroStation.
6 Data Cleaning Well understanding and manipulation about Data Cleaning.
7 Creating Topology Well understanding and manipulation about Creating Topology.
8 Improvement The improvement of understanding and motivation through this training.
9 Future The possibility for future application of this training and the data
b) Conclusion and future task
Ms. N’Dourouha had little experience in software except “Microsoft Office” at the start of this training, so that she needed to start from the training of a basic level. However, she tried hard to understand the manipulation of software making her own manuals, and showed remarkable improvement in some practices with slow and steady progress referring her manual. It is expected that the results (knowledge, technique) of this training and the data of this project would be utilized in some new fields (ex: The planning of water pipes, Land development) by the trainee.
Ms. Yemehelha has already had some experience in AutoCAD, although not so familiar, but her experience was sometimes helpful for understanding the theory and manipulation, and

100
for exercising the software by comparing with the same cases in AutoCAD throughout the training. It is expected that the results (knowledge, technique) of this training and the data of this project would be utilized in some new fields (ex: The planning of water pipes, Land development) by the trainee.

101
3.9. Data Structurization Overall objective of the training on data structurization was to transfer skills for creating GIS data from the compiled plotting data (CAD format) prepared under this project, and further creating some samples of GIS application using the converted data. This training was conducted at DCIG in both the second (2008) and third (2009) phases of the Study. It is expected that this technology transfer would encourage the related organizations for extensive use of data of this project in decision making process.
3.9.1. The Second Phase (2008)
a) Structure and Schedule
Two (2) trainees from the Direction of Cartography and Geographic Information (DCIG) participated in this training. Thus, the number of trainees was good enough to conduct person to person operation support. They are listed in APPENDIX 2. Before the start of training, the Team investigated their knowledge and experience of data structurization with a questionnaire in order to meet their needs for the technology transfer. Their responses are summarized in Table 3.19.
Table 3.19 Summary of questionnaire response of trainees in the second phase (2008)
SN TraineeName
AffiliatedOrganization
Kno
wle
dge
abou
t com
pute
r
Kno
wle
dge
of G
IS D
ata
Eve
r op
erat
ed G
IS S
oftw
are
Names of operatedGIS SoftWare
Und
erst
andi
ng o
f Coo
rdin
ates
Und
erst
andi
ng a
bout
Vec
tor
data
Top
olog
y
Eve
r cr
eate
d G
IS d
ata
from
CA
D fi
les
1 Mr. SowCheikh
AssistantDirector,Cartographyservice, Directionof Cartographyand GeographicInformation(DCIG)
Good Fair YesArcView (ArcGIS),ArcInfo (ArcGIS),MapInfo, Geoconcept
Yes Yes No
2 Mr. MaleckVall
Chief ofCartographyservice, Directionof Cartographyand GeographicInformation(DCIG)
Good Good Yes MapInfo Yes yes yes

102
The questionnaire survey revealed that, both of the trainees had Good to Fair knowledge of GIS data. They had working experience on MapInfo software and some experience on ArcGIS software, too. However, this was the first training on ArcGIS software for them. Thus, the training was focused mainly on operations of ArcGIS software. This training was conducted at DCIG from October to November 2008. Altogether 16 sessions (including two review sessions) were conducted. Refer to Table 3.20 below.
Table 3.20 Training session on Data Structurization in the second phase (2008)
Awadh K. SAH, JICA Study TeamOctober-November, 2008
SN Date Day Time Topic Description1 2008/10/13 Monday 10:30-11:30 Lecture: Introduction to GIS
15:00-15:30 Lecture: Introduction to ArcGIS15:30-16:00 Practice: Main menu of ArcCatalog10:00-10:30 Demo: Important functions in ArcCatalog10:30-12:00 Practice: Iimportant functions in ArcCatalog 10:00-10:30 Demo: Menu and important functions in ArcMap10:30-12:00 Practice: Main menu and important functions of ArcMap10:00-10:30 Demo: Menu and important functions in ArcMap (Continued)10:30-12:00 Practice: Main menu and important functions of ArcMap (Continued)10:00-10:30 Demo: Creating new Dataset (Line, Point)10:30-12:00 Practice: Creating new Dataset (Line, Point)10:00-10:30 Demo: Creating new Dataset (Polygon)10:30-12:00 Practice: Creating new Dataset (Polygon)10:00-10:30 Demo: Overviewing the menu and functions for Table10:30-12:00 Practice: Overviewing the menu and functions for Table 10:00-10:30 Demo: Data query and updating Table data10:30-12:00 Practice: querrying and manipulating the tabular data10:00-10:30 Lecture/Demo: Introduction to ArcToolBox10:30-12:00 Practice: Main functions of ArcToolBox10:00-10:30 Lecture/Demo: Some Main functions of ArcToolBox10:30-12:00 Practice: Some Main functions of ArcToolBox10:00-10:30 Demo: Logical operator and Map Overlays10:30-12:00 Practice: Logical operator and Map Overlays10:00-10:30 Lecture: Map composition10:30-12:00 Practice: Map composition
10:00-10:30 Lecture: Overviewing the layers of this Project and schema for GISdatabase
10:30-12:00 Practice: Creating schema for GIS database15 2008/11/13 Thursday 10:00-12:00 Review of previous sessions16 2008/11/16 Sunday 10:00-12:00 Review of previous sessions
7
8
9
14
10
11
12
13
2008/10/23 Thursday
2
3
4
5
6
2008/10/19 Sunday
2008/10/21 Tuesday
2008/11/11 Tuesday
2008/11/6
2008/10/30 Thursday
Thursday
2008/11/2 Sunday
2008/11/9 Sunday
2008/11/4 Tuesday
2008/10/14 Tuesday
2008/10/26 Sunday
2008/10/28 Tuesday
2008/10/16 Thursday
The training was designed to be practical as much as possible. Each session (except the first and review sessions) was divided into two parts: lecture/demonstration, and practice. The practices were designed for immediate practice for the trainees on personal computer.

103
Figure 3.9 shows the environment of a training session.
Figure 3.9 A session of training in the second phase
b) Content Description
As mentioned above, this training mainly concentrated on operations of ArcGIS software. Sample data covering a part of the Study area was used for the demonstration as well as for practices. The contents are summarized as follows:
Introduction of Components of ArcGIS software
ArcGIS is an integrated collection of GIS software products for building a complete GIS for an organization. As presented in Figure 3.10, this software has wide range of products and under this project; ArcInfo along with extensions like ArcGIS 3D Analyst, ArcGIS Spatial Analyst, and ArcGIS Network Analyst is being installed.

104
ArcGIS Family of Product
ArcGIS Family of Product
ArcIMSArcGIS ServerArcSDEGIS Portal Toolkit
ArcGIS Engine ArcPadMobile ArcGISDesktop Systems
ArcReaderArcviewArcEditorArcInfo
ArcGIS DesktopExtensions, e.g.:
ArcGIS DesktopApplications, e.g.:
- ArcCatalog- ArcMap- ArcToolbox
- ArcGIS3D Analyst- ArcGIS Spatial Analyst- ArcGIS Survey Analyst- ArcGIS Geostatistical Analyst- ArcGIS Network Analyst- ArcGIS Publisher- ArcScan for ArcGIS
Desktop GIS Embedded GIS Mobile GISServer GIS
ArcGIS Family of Product
ArcGIS Family of Product
ArcIMSArcGIS ServerArcSDEGIS Portal Toolkit
ArcGIS Engine ArcPadMobile ArcGISDesktop Systems
ArcReaderArcviewArcEditorArcInfo
ArcGIS DesktopExtensions, e.g.:
ArcGIS DesktopApplications, e.g.:
- ArcCatalog- ArcMap- ArcToolbox
- ArcGIS3D Analyst- ArcGIS Spatial Analyst- ArcGIS Survey Analyst- ArcGIS Geostatistical Analyst- ArcGIS Network Analyst- ArcGIS Publisher- ArcScan for ArcGIS
Desktop GIS Embedded GIS Mobile GISServer GIS
Figure 3.10 ArcGIS Software Family of Products
The components of ArcGIS; ArcCatalog, ArcMap, and ArcToolBox were introduced first by explaining their basic functions. Main points were as follows:
ArcCatalog:
- Familiarizing the various Menus (File, Edit, View, Tools, Window, Help). - Displaying GIS file and its Table - Displaying and Editing of Metadata - Creating New Shapefile. - Use of “conversion Tools”: practice of converting MIF file to Shape file.
Figure 3.11 Conversion Tools in ArcCatalog of ArcGIS Software

105
ArcMap:
- Familiarizing the Menu including adding a GIS file - Practicing functions included in the Layer Properties Window. - Displaying and setting up options in Data Frame Properties. - Displaying Various Toolbars and familiarizing the included functions. - Adding the XY data to create point data.
Figure 3.12 ArcMap, ArcToolBox, 3D Analyst, and Spatial Analyst of ArcGIS software
ArcToolBox
- Introducing the ToolBoxes, ToolSets, and Tools. - Practicing with functions under Projection and Transformation, Feature
Conversion, Extract, and others.
Arc Toolbox ArcMap-ArcView Main Menu
3D Analyst Main Menu Spatial Analyst Main Menu

106
Figure 3.13 Arrangement of ToolBoxes, ToolSets, and Tools in ArcToolBox
Creation and editing of new spatial dataset
This included creation of new Feature Datasets (Polygon, Line, and Point) using ArcCatalog and then inputting the features using ArcMap. The practices were carried out by assigning small area (about two blocks) within the Nouakchott city to input the features likes building as polygon, road as line, and isolated tree as point.
The inputting features (addition/editing) were carried out in ArcMap using ‘Editor’ Toolbar, that looks as follows:
Figure 3.14 Appearance of Editor Tool Bar
Overview of functions in Table
Along with introducing the menu, various functions in Table Window were practiced, such as how to:
- Select or de-select Rows or Columns (Fields). - Query data, Add and Delete field, add and edit data in Table, add Length/Area as
Sketch Tool

107
separate column. - Import table created in Excel software. - Export the selected Rows or whole to a separate file name.
Figure 3.15 Displaying the Table and menu under ‘Options’ Tab
Logical operator and spatial analysis
This included building of logics to select set of features based on defined criteria and then exporting these features as a new file. Also, the spatial analysis functions such as Clipping, Buffering the featured with defined criteria, Overlaying features of two files, and Generalizing were explained along with practice. An example of Clipping is presented in Figure 3.16.
Figure 3.16 An Example of Clipping to extract Data Covering Area of Interest
Map composition and layout
Steps for preparing layout and composing Map were shown. For this, the features, such

108
as; building, road, and isolated tree, created in sessions “Creating New Dataset” were used as sample data. During this practice, various options for selecting symbols that present in ArcGIS were presented. After inserting items such as Legends, Scale bar, and Text description, function for exporting the map to other formats such as .jpg, .pdf was also carried out. A sample of composed map is presented in Figure 3.17.
Figure 3.17 A Sample of Composed Map Prepared using ArcGIS
c) Challenges and Resolution
This training being conducted first time for the Trainees, there were some challenges, which were resolved with the optimum efforts. These are listed below:

109
Levels of Understanding of English Language: Challenge: The trainees’ level of English understating was not sufficient to quick grasping of
operations of ArcGIS software, which is in English. Resolutions: Communicating through translator; repeating the demonstration; watching their
practice activity intensively; promoting them to take note of operations.
Busy schedule: Challenge: In addition to attend this training course, the attended trainees had also to do their
regular task. Thus, despite the willingness, sometimes they remained unable to join some of the training sessions as scheduled.
Resolutions: Re-arranging the schedule, providing time even for individual trainee to make up the missed session.
d) Evaluation of Trainees
The trainees involved in the GIS Data Structurization in this phase were evaluated considering the aspects presented in Table 3.21.
Table 3.21 Aspects for evaluating trainees in the second phase (2008)
Aspects Contents
1 Basic Knowledge Basic knowledge about GIS data and ArcGIS at start of this training.
2 Motivation Motivation to understand this training and to apply the result of this training.
3 Improvement Overall improvement of understanding regarding operating ArcGIS, and structurization and analysis of GIS data through this Training.
4 Components of ArcGIS
Improvement of understanding of components of ArcGIS; ArcCatalog, ArcMap, Tables, and ArcToolBox and also about 3D and Spatial Analyst, etc.
5 Input and Edit GIS Data
Improvement of understanding regarding Input and Edit of GIS data.
6 GIS Data Analysis Improvement of understanding regarding Spatial Analysis of GIS data.
7 Map Composition Improvement of understanding regarding composing, and printing or exporting map.

110
Aspects Contents
8 Future The possibility of applying the acquired training knowledge in future.
The level of both trainees, with respect to various aspects mentioned in Table 3.21, was conducted. In conclusion, both trainees showed very good motivation to learn about contents of the training. Despite being busy in other works, they tried their best to attend the sessions. It is expected that they would continue to exercise the operations by themselves.
3.9.2. The Third Phase (2009)
a) Structure and Schedule
Considering that the last training (conducted in the second phase) focused on functions of ArcGIS Software, the training on the third phase emphasized on structurization of GIS data from the compiled plotting data (CAD format) and preparation of sample application using mainly the converted GIS data. However, out of 6 (six) trainees attended this time, 5 (five) had not attended the last training and also a trainee (Mr. Maleck Vall) who attended last time wished to repeat some of lessons carried out last time. Thus, this training composed of three main components with numbers of sessions for each one:
- Introduction of functions of ArcGIS software - Conversion of the project CAD data to GIS data base. - Creation of GIS application using mainly converted GIS data
Numbers of sessions were conducted for each of the above components. Refer to Table 3.24.
Trainees:
This training was attended by six (6) trainees as presented in Table 3.22 below and in APPENDIX 2. They were grouped into three in order to conduct individual training using a restricted number of equipment.

111
Table 3.22 List of Trainees in the Training of Data Structurization in the third phase (2009)
SN Traine e Name Affil iate d Organization DesignatedGroup
1 Mr. C heikhna O uld ElémineGIS chief of Service, MauritanianGeological Research Office (OMRG) Group 1
2 Mr. Moussa MamadouSaidou
Chief of Service, Direction ofDevelopment of Territory and theRegional Action (DATAR )
Group 2
3 Mr. Maleck VallChief of Cartogra phy service, Dir ect ionof Cartography and GeographicInformation (DCIG)
Group 3
4 Mr. Sy A bdoul Chief of Service of Urban Plan, Directionof Urbani sm
Group 3
5Mr. Cheikh Ti jani OuldCheikh Mohamédou
Technical advisor, Urban CommunityNouakchot t (CUN) Group 4
6 Ms. Aminetou Mint Mokhtar GIS Expert, Urban CommunityNouakchot t (CUN) Group 4
The trainee Mr. Sow Ceikh, who had attended training in the second phase, could not attend this time as he was transferred to other organization and was busy with his work schedule. In order to determine an effective means of technology transfer, questionnaire survey was conducted to understand the experiences and knowledge of trainees who attended for the first time in training of this Project. Their response has been summarized in Table 3.23. This revealed that, most of them had Good to Fair knowledge of GIS data and coordinate systems. Some of them had occasional experience of operating GIS software, too.
Figure 3.18 A Session of training in the third phase

112
Table 3.23 Summary of Questionnaire Response of Trainees in the third phase (2009)
SN Trainee Name
Kno
wle
dge
abou
t com
pute
r
Kno
wle
dge
of G
IS D
ata
Eve
r op
erat
ed G
IS S
oftw
are
Names of operatedGIS SoftWare
Und
erst
andi
ng o
fC
oord
inat
esU
nder
stan
ding
abo
ut V
ecto
rda
ta T
opol
ogy
Eve
r cr
eate
d G
IS d
ata
from
CA
D fi
les
1Mr. Cheikhna OuldElémine Fair Fair Yes
ArcView Ver. 3.X,ArcGIS (ArcView),ArcGIS (ArcInfo),MapInfo, ERDAS,GLOBAL-Mapper9,ENVI4.2
Yes Yes Yes
2 Mr. MoussaMamadou Saidou
Fair Fair Yes ArcGIS (ArcInfo) Yes Yes No
3 Mr. Sy Abdoul Fair Negligible No - Yes No No
4Mr. Cheikh TijaniOuld Cheikh Mohamédou
Good Good Yes ArcInfo(ArcGIS),MapInfo
Yes No Yes
5 Ms. Aminetou MintMokhtar
Good Fair Yes ArcView Ver. 3.X,MapInfo
Yes No Yes
This training was conducted at DCIG from November to December 2009 and considering the above questionnaire response, detail components of technology transfer were determined and arranged in 17 sessions (including one for review). Refer to Table 3.24.
The training sessions were designed to be practical as much as possible. For that purpose, sessions were divided into two parts: lectures/demonstrations, and practices. The demonstration was conducted including all trainees as one group while for practices, trainees were divided into 4 groups (with 1 or 2 trainees/ group) to conduct person to person operation support. Refer to Table 3.22. The practices were designed for immediate practice for the trainees on personal computer. Environment in one of a demonstration session is presented in Figure 3.18. Moreover, Mr. Cheikh Tijani Ould Cheikh Mohamédou and Ms. Aminetou Mint Mokhtar having joined the training from 1st December, additional discussions were arranged for them to cover the items of the previous sessions.

113
Table 3.24 Training sessions on Data Structurization in 3rd Phase (2009)
SN Date Day Time Topic Covered in the Session1 2009/11/15 Sunday 10:30-11:30 Lecture: Orientation about OJT-2; Introduction about GIS and ArcGIS
9:30-10:45 Demo: Menu and Functions in ArcCatalog11:00-12:00 Practice: Menu and Functions in ArcCatalog (Group 1)12:00-13:00 Practice: Menu and Functions in ArcCatalog (Group 2)15:00-17:00 Practice: Menu and Functions in ArcCatalog (Group 3)9:30-10:45 Demo: Menu and important functions in ArcMap11:00-12:00 Practice: Menu and Functions in ArcMap (Group 1)12:00-13:00 Practice: Menu and Functions in ArcMap (Group 2)15:00-17:00 Practice: Menu and Functions in ArcMap (Group3)9:30-10:45 Demo: Creating New Dataset (Line, Point, and Polygon)11:00-12:00 Practice: Creating New Dataset (Line, Point, and Polygon) (Group 1)12:00-13:00 Practice: Creating New Dataset (Line, Point, and Polygon) (Group 2)15:00-17:00 Practice: Creating New Dataset (Line, Point, and Polygon) (Group 3)9:30-10:45 Demo: Menu and functions for Table11:00-12:00 Practice: Menu and functions for Table (Group 1)12:00-13:00 Practice: Menu and functions for Table (Group 2)15:00-17:00 Practice: Menu and functions for Table (Group 3)9:30-10:45 Demo: Menu and important functions in ArcToolBox11:00-12:00 Practice: Menu and Functions in ArcToolBox (Group 1)12:00-13:00 Practice: Menu and Functions in ArcToolBox (Group 2)15:00-17:00 Practice: Menu and Functions in ArcToolBox (Group3)9:30-10:45 Demo: Map composition11:00-12:00 Practice: Map composition (Group 1)12:00-13:00 Practice: Map composition (Group 2)15:00-17:00 Practice: Map composition (Group 3)9:30-10:45 Demo: Overviewing the layers of this Project and creation schema for GIS Database11:00-12:00 Practice: Overviewing layers of this Project and creation schema for GIS Database (Group 1)12:00-13:00 Practice: Overviewing layers of this Project and creation schema for GIS Database (Group 2)15:00-17:00 Practice: Overviewing layers of this Project and creation schema for GIS Database (Group 3)9:30-10:45 Demo: Converting CAD data to Shape file11:00-12:00 Practice: Converting CAD data to Shape file (Group 1)12:00-13:00 Practice: Converting CAD data to Shape file (Group 2)15:00-17:00 Practice: Converting CAD data to Shape file (Group 3)
2009/12/2 Wednesday 11:00-13:00 Practice: Converting CAD data to Shape file (Group 4)9:30-10:45 Discussion: Converting CAD data to Shape file (continued )11:00-12:00 Practice: Converting CAD data to Shape file (continued) (Group 1)12:00-13:00 Practice: Converting CAD data to Shape file (continued) (Group 2)15:00-17:00 Practice: Converting CAD data to Shape file (continued) (Group 3 and Group 4)9:30-10:45 Demo: Checking and Processing the Converted Sheetwise data11:00-12:00 Practice: Checking and Processing the Converted Sheetwise data (Group 1)12:00-13:00 Practice: Checking and Processing the Converted Sheetwise data (Group 2)15:00-17:00 Practice: Checking and Processing the Converted Sheetwise data (Group 3)
2009/12/7 Monday 11:00-13:00 Practice: Checking and Processing the Converted Sheetwise data (Group 4)9:30-10:45 Demo: Logical operator and Map Overlays10:00-11:00 Practice: Logical operator and Map Overlays (Group 1)11:00-12:00 Practice: Logical operator and Map Overlays (Group 2)15:00-17:00 Practice: Logical operator and Map Overlays (Group 3)
2009/12/9 Wednesday 11:00-13:00 Practice: Logical operator and Map Overlays (Group 4)9:30-10:45 Demo: A sample of GIS Model11:00-12:00 Practice: A sample GIS Model (Group 1)12:00-13:00 Practice: A sample GIS Model (Group 2)15:00-17:00 Practice: A sample GIS Model (Group 3 and Group 4)9:30-10:45 Discussion: Regarding Formulation of a GIS Model11:00-12:00 Practice: Formulation of a GIS Model (Group 1)12:00-13:00 Practice: Formulation of a GIS Model (Group 2)15:00-17:00 Practice: Formulation of a GIS Model (Group 3 and Group 4)9:30-10:45 Discussion: Regarding Preparation of a GIS Model11:00-12:00 Practice: Preparation of a GIS Model (Group 1)12:00-13:00 Practice: Preparation of a GIS Model (Group 2)15:00-17:00 Practice: Preparation of a GIS Model (Group 3 and Group 4)9:30-10:45 Discussion: Regarding Progress of the GIS Model11:00-12:00 Practice: Finalization of the GIS Model (Group 1)12:00-13:00 Practice: Finalization of the GIS Model (Group 2)15:00-17:00 Practice: Finalization of the GIS Model (Group 3 and Group 4)
17 2009/12/21 Monday 9:30-11:00 Overview of Previous Sessions
Thursday
2009/11/22 Sunday
Monday
2009/11/24 Tuesday
2009/11/26 Thursday
2009/11/30
12
13 2009/12/10
2009/11/19
5
6
7
8
9 2009/12/1
4
Sunday
2009/12/8
14 2009/12/13 Sunday
2009/12/3 Thursday10
11
2 2009/11/16 Monday
3 2009/11/17 Tuesday
16 2009/12/20 Sunday
15
Tuesday
Tuesday
2009/12/15 Tuesday
Thursday
2009/12/6

114
b) Content Description
Introduction of functions in ArcGIS software This component being repetition of what was conducted in 2nd Phase, its contents were same as presented under sub-heading “(2) Content Description” of “i) Training in 2nd Phase”.
Conversion of the Project CAD data to GIS data base Over viewing the GIS Layers included in the Plotting data of this project.
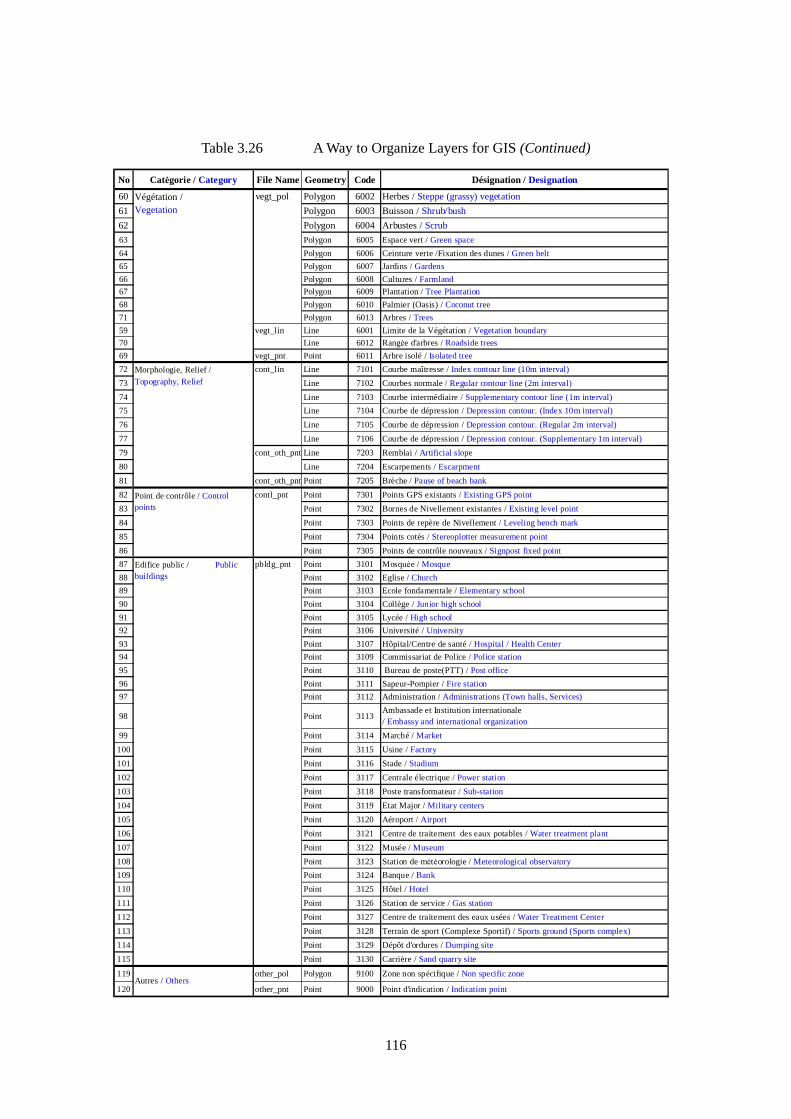
There are about 120 types of layers used to compile the topographic maps of this project. So, first these layers were gone through to determine about the way for their grouping and further to create the schema for GIS database. In general, there is not rigid rule for how many layers or which layers need to be included in a group (put in one Shapefile). However, grouping is done considering the similarity among layers, that is, a polygon layer can be grouped with polygon, and so on. Furthermore, the layers of similar categories would be better grouped together. For instance, polygon layer of vegetation category better be grouped with the polygon layers of same category. Contour layers having elevation information better be treated separately. Considering these points, Table 3.25 and Table 3.26 presents a possible way for grouping these 120 layers into 21 Shapefiles.

115
Table 3.25 A Way to Organize Layers for GIS
No Catėgorie / Category File Name Geometry Code Désignation / Designation
1 admin_lin Line 1002 Wilaya / Region
2 Line 1003 Moughataa / Department
3 Routes / Roads road_lin Line 2102 Axe de la Voie goudronnėe / Center line of Paved Motorway4 Line 2103 Axe de la Voie non-goudronnėe / Center line of un-paved Motorway5 Line 2004 Piste / Cart track6 Line 2005 Sentier / Foot path7 Line 2006 Piste amėnagėe / Garden road8 Line 2010 Terre plein central / Median strip9 Bâtiment / Building bldg_pol Polygon 3001 Bâtiment de moins de 3 niveaux / Building having less than 3 storey
10 Polygon 3002 Immeuble de plus de 3 niveaux / Building having 3 or more storey11 Polygon 3003 Hangar / Hanger13 Polygon 3006 Bâtiment en chantier / Building under construction14 Polygon 3007 Bâtiment en ruine / Ruined (deserted) building
12 bldg_pnt Point 3005 Habitat précaire / Small building22 infra_pol Polygon 4106 Rėservoir / Reservoir37 Polygon 4117 Cimetière / Cemetery38 Polygon 4118 Piscine / Swimming pool
40 Polygon 4220Piste d'envol et piste de guidage dans l'aéroport/ Runway and guidance lane in the airport
19 Polygon 4305 Cuve plus de 10 mètres / Curve more than 10m23 Polygon 4307 Silo plus de 10 mètres / Silo more than 10m30 Polygon 4312 Pylône plus de 5 mètres / Pylon more than 5m33 infra_lin Line 4113 Ligne à haute tension (Ligne ėlectrique) / High tension electric line34 Line 4114 Conduite d'eau / Water pipeline35 Line 4115 Pipeline / Pipe line39 Line 4119 Conduite souterraine / Underground pipeline15 infra_pnt Point 4101 Château d'eau / Water tower16 Point 4102 Potence / Water station (for tank lorry)17 Point 4103 Borne fontaine / Water station (for cart)18 Point 4104 Bassin d'eau / Watering place21 Point 4105 Cuve / Tank25 Point 4107 Silo / Silo
26 Point 4108Antenne de relais (Télévision, Radio, Télécommunication)/ Antenna (Television, Radio, Telecommunication)
27 Point 4109 Phare / Light house28 Point 4110 Grue / Crane29 Point 4111 Monument / Monument32 Point 4112 Pylône / Pylon36 Point 4116 Station de marégraphe / Tide guage station41 Clôture / Fence fence_lin Line 4201 Clôture en mur / Wall fence42 Line 4202 Clôture en fil de fer / Iron fence43 Line 4203 Clôture en haie / Hedge fence
44 Line 4204 Autres limites de parcelle ou de concession/ Other borders of plot or concession
45 hydro_pol Polygon 5101 Lac, Etang, Mare / Lake, Pond, Pool46 Polygon 5102 Sebkha / Sebkha (Salt pan)47 Polygon 5103 Oued / Wadi (Valley)48 Polygon 5104 Zone inondable / Zone prone to flooding50 Polygon 5106 Marais salant / Salty marsh52 Polygon 5108 Mer / Sea49 hydro_lin Line 5105 Thalweg (Lit de oueds) / Valley line51 Line 5107 Ligne côtière / Coastline53 Line 5201 Wharf / Wharf54 Line 5202 Jetée / Pier55 Line 5203 Brise-lames / Break-water56 Line 5204 Revêtement / Revetment58 Line 5206 Tétrapode / Tetrapod57 hydro_pnt Point 5205 Port d'eau Profonde / Harbor of deep water
Infrastructure et Equipement/ Infrastructure andequipment
Limites communales ouadministratives / Communityor administrative boundary
Hydrographie et détailsparticuliers / Hydrographyand its structures
116
Table 3.26 A Way to Organize Layers for GIS (Continued)
No Catėgorie / Category File Name Geometry Code Désignation / Designation
60 vegt_pol Polygon 6002 Herbes / Steppe (grassy) vegetation61 Polygon 6003 Buisson / Shrub/bush62 Polygon 6004 Arbustes / Scrub63 Polygon 6005 Espace vert / Green space64 Polygon 6006 Ceinture verte /Fixation des dunes / Green belt65 Polygon 6007 Jardins / Gardens66 Polygon 6008 Cultures / Farmland67 Polygon 6009 Plantation / Tree Plantation68 Polygon 6010 Palmier (Oasis) / Coconut tree71 Polygon 6013 Arbres / Trees59 vegt_lin Line 6001 Limite de la Végétation / Vegetation boundary70 Line 6012 Rangėe d'arbres / Roadside trees69 vegt_pnt Point 6011 Arbre isolé / Isolated tree72 cont_lin Line 7101 Courbe maîtresse / Index contour line (10m interval)73 Line 7102 Courbes normale / Regular contour line (2m interval)74 Line 7103 Courbe intermédiaire / Supplementary contour line (1m interval)75 Line 7104 Courbe de dépression / Depression contour. (Index 10m interval)76 Line 7105 Courbe de dépression / Depression contour. (Regular 2m interval)77 Line 7106 Courbe de dépression / Depression contour. (Supplementary 1m interval)79 cont_oth_pnt Line 7203 Remblai / Artificial slope80 Line 7204 Escarpements / Escarpment81 cont_oth_pnt Point 7205 Brèche / Pause of beach bank82 contl_pnt Point 7301 Points GPS existants / Existing GPS point83 Point 7302 Bornes de Nivellement existantes / Existing level point84 Point 7303 Points de repère de Nivellement / Leveling bench mark85 Point 7304 Points cotés / Stereoplotter measurement point86 Point 7305 Points de contrôle nouveaux / Signpost fixed point87 pbldg_pnt Point 3101 Mosquėe / Mosque88 Point 3102 Eglise / Church89 Point 3103 Ecole fondamentale / Elementary school90 Point 3104 Collège / Junior high school91 Point 3105 Lycée / High school92 Point 3106 Université / University93 Point 3107 Hôpital/Centre de santé / Hospital / Health Center94 Point 3109 Commissariat de Police / Police station95 Point 3110 Bureau de poste(PTT) / Post office96 Point 3111 Sapeur-Pompier / Fire station97 Point 3112 Administration / Administrations (Town halls, Services)
98 Point 3113Ambassade et Institution internationale/ Embassy and international organization
99 Point 3114 Marché / Market100 Point 3115 Usine / Factory101 Point 3116 Stade / Stadium102 Point 3117 Centrale électrique / Power station103 Point 3118 Poste transformateur / Sub-station104 Point 3119 Etat Major / Military centers105 Point 3120 Aéroport / Airport106 Point 3121 Centre de traitement des eaux potables / Water treatment plant107 Point 3122 Musée / Museum108 Point 3123 Station de mėtėorologie / Meteorological observatory109 Point 3124 Banque / Bank110 Point 3125 Hôtel / Hotel111 Point 3126 Station de service / Gas station112 Point 3127 Centre de traitement des eaux usées / Water Treatment Center113 Point 3128 Terrain de sport (Complexe Sportif) / Sports ground (Sports complex)114 Point 3129 Dépôt d'ordures / Dumping site115 Point 3130 Carrière / Sand quarry site
119 other_pol Polygon 9100 Zone non spécifique / Non specific zone
120 other_pnt Point 9000 Point d'indication / Indication pointAutres / Others
Végétation /Vegetation
Point de contrôle / Controlpoints
Morphologie, Relief /Topography, Relief
Edifice public / Publicbuildings

117
A Possible Way of Converting CAD to GIS Data For the conversion, each assigned group was provided with CAD data of one sheet from 4 map sheets; XV-1A-11, XV-1A-12, XV-1A-16, and XV-1A-17. Two ways of conversion were demonstrated and included in practice, the 2nd way being some modification of 1st with respect to steps. Followings are the steps included in the 1st Procedure:
1). Over viewing of the 120 GIS layer of this project 2). Formulation of Files and their structure considering following points:
- Arrangement of layers into shape files (for instance, as in Table 3.25 and Table 3.26)
- Naming of shape files (for instance, as in Table 3.25 and Table 3.26) - Creation of Folder/ File Structure, for instance as presented in Figure 3.19.
GIS_data
msh_XV1a_16 msh_XV1a_17
road_pol
road_lin
bldg_pol
admin_lin
road_pol
road_lin
bldg_pol
admin_lin
GIS_data
msh_XV1a_16 msh_XV1a_17
road_pol
road_lin
bldg_pol
admin_lin
road_pol
road_lin
bldg_pol
admin_lin
road_pol
road_lin
bldg_pol
admin_lin
road_pol
road_lin
bldg_pol
admin_lin
Figure 3.19 An Example of Folder/File Structure for Arranging GIS data
3). Creating Shape files with following schema:
For example: i) Shape file - road_pol.shp

118
ii) iFor shape file - road_lin.shp
iii) For Shape file - bldg_pnt.shp
iv) For Shape file - cont_lin.shp
v) For Shape file - contl_pnt.shp
- Create above five (5) shape files with columns other than FID and Shape similar to as mentioned.
- Define Projection as designated for this project. - Then copy the file to similar one and rename it as desired. - Thus, create whole set of shape files for one map sheet. - Copy the whole set of shape files to another map sheet.
4). Displaying CAD file and preparing it for conversion.
- Display CAD file.

119
- Check the layers off by displaying “Layer Properties” window and then clicking “Fields” menu.
Note: for contour or control points data, check on also to “elevation” field.
- Save the above file to a temporary shape file (for working purpose) by selecting “Data” and then “Data Export” in the “Data Frame Window”.
- Define projection of this Shape file. - Display this new shape file. Add the required columns as in schema of point 3)
in the same sequence.
- Transfer / calculate the attribute data in the created column.
5). Transferring data to required shape files:
- Display the required empty shape file. - Select the required layers in the temporary created shape file. - Start Editor and first copy the layers from temporary shape file. Then paste to
empty file.
- “Save edits” and then “Stop editing”. Thus required shape file will have data. - In the same way repeat this procedure to save other required layers to other
Shapefile.
It may be noted that as the 2nd way (procedure), the creation of empty shape files as mentioned in step 3) can be ignored. If so, the temporary (intermediate) Shapefile with all the required columns is created, and then the desired layers can be selected using ‘Definition Query’, which can be ‘Exported’ as new dataset with file naming as decided in step 2.

120
Checking and Processing the Converted Data
The converted GIS Data was displayed with orthophotos as background to look at the distribution of various layers. The function such as ‘Append’ was used to combine the GIS data of 4 separate map sheets into one file. Also, followings operations were included in the practice:
- Creating Logical Expression - Overlaying (such as ‘Union’) - Converting Polygon file to Line and Line file to Polygon
Creation of GIS application using mainly converted GIS data
A Sample of GIS model
To demonstrate the application use of GIS data of this project, a sample model based on the converted 4 map sheet GIS was included in the training using. The detail of this sample application is presented in Figure 3.20.

121
Figure 3.20 A Sample GIS Model
A Sample GIS Model Title: To find out the existing buildings (large and small) to be affected with the proposed development of
Industrial and Market complexes in the area and Road improvement as mentioned below:
Proposed Area to be developed
New road
Note: The width of road to be considered as 30m
Data to used:
- Project data:
Large Building as Polygon (bldg_pol.shp)
Small building as Point (bldg_pnt.shp and pbldg_pnt.shp)
Road Network
Road Polygon (road_pol.shp)
- Boundary of proposed Area to be developed.
- Others
Methodology Outline:
- Clipping, adding and Buffering road, statistics.
Result: No. of Buildings to be affected (large and small) in development of area and upgrading of Road.

122
Creation of GIS Model by Trainees After practice of the above sample GIS model, each trainee was asked to formulate and prepare a GIS model basically using the converted GIS data of this project. Five (5) trainees participated in formulating and preparing a GIS model. Mr. Cheikhna Ould Elémine did understand about GIS models, but he could not participate in this practice due to his busy time. Necessary one to one discussions were held during formulation step and supervision was carried out during the preparation state. Thus, this not only provided them opportunity to put their idea into practice, but also got first hand practice for application use of this project GIS data. Also, this provided to express their understanding about whatever they have learnt in this training. The Title of GIS model created by trainees is listed in Table 3.27.
Table 3.27 Title of GIS Model created by Trainees
SN Trainee's nameDesignated
groupTitle of GIS model
1Moussa MamadouSaidou
Group 2Suitable site for building the Central Bus Station inNouakchott
2 Maleck Vall Group 3Creation of a GIS model to identify inundated zonesin a districts of Nouakchott
3 Sy Abdoul Group 3The plan of restructuring of the precarious districtsof Dar Naim Commune
4Cheikh Tijani OuldCheikh Mohamédou
Group 4 Plan of installation of an esplanade
5Aminetou MintMokhtar
Group 4Identificaiton of suitable areas for building a newschool
The result of a GIS Model created by a trainee is presented in Figure 3.21.

123
Figure 3.21 A GIS Model Created by a Trainee
(Suitable Site for Building a Central Train Station in Nouakchott)

124
c) Challenges and Resolution
During this training also, there were some challenges, which were resolved with the optimum efforts. As in 2nd phase, the trainees attended in this phase had busy schedule, and different levels of understanding of English language. These two problems were resolved in same way as mentioned in sub-heading “Challenges and Resolution” of “Training on Data Structurization in 2nd Phase”; that is, by re-arranging their schedule and communicating through translator, respectively. Besides these, the 3rd one is listed below:
Different Fields and Levels of Understanding: Challenge: As mentioned in Table 3.22, six trainees were from four different
organizations. Also their level of understanding regarding GIS was different.
Resolutions: During demonstration, encouraging them to ask questions immediately if not understood, checking their understanding regarding particular covered point. During practices, encouraging one to one discussion and repeating wherever needed.
d) Evaluation of Trainees and Future Tasks
The trainees involved in the GIS Data Structurization were evaluated considering the aspects presented in Table 3.28.
Table 3.28 Aspects for Evaluating Trainees on Data Structurization in 3rd Phase
Aspects Contents
1 Basic Knowledge Basic knowledge about GIS data and ArcGIS at start of this training.
2 Motivation Motivation to understand this training and to apply the result of this training.
3 Improvement Overall improvement of understanding regarding operating ArcGIS, and structurization and analysis of GIS data through this Training.
4 Components of ArcGIS
Improvement of understanding of components of ArcGIS; ArcCatalog, ArcMap, Tables, and ArcToolBox and also about 3D and Spatial Analyst, etc.

125
Aspects Contents
5 Input and Edit GIS Data
Improvement of understanding regarding Input and Edit of GIS data.
6 GIS Data Analysis Improvement of understanding regarding Spatial Analysis of GIS data.
7 Map Composition Improvement of understanding regarding composing, and printing or exporting map.
8 Converting CAD to Shape
Improvement of understanding regarding converting CAD data to GIS Data.
9 Creating GIS Model
Improvement of understanding for using this Project data in creating GIS application Model and extracting information to be used by decision maker.
10 Future The possibility of applying the acquired training knowledge in future.
The same criteria used in evaluating trainees on Data Structurization in 2nd phase were used in this phase. In conclusion, all the trainees showed very good motivation to learn about contents of the training. Despite being busy in own works, they tried their best to attend the sessions. In case of missing some sessions, they tried to cover during the next sessions. With their level of improvement achieved through this training, it is strongly hoped that they will be able to increase it further with practice in future.

126
3.10. Map Symbolization The training on Symbolization was conducted at DCIG through November to the beginning of December 2009. Two (2) technical staffs from the Société Nationale de l’Eau (SNDE) participated in this session. They are listed in APPENDIX 2. The target level to attain is that they can do voluntary training. Before the start of training, the Team investigated on their knowledge and experience in map symbolization with a questionnaire in order to meet their needs for the technology transfer. Their responses are shown in APPENDIX 7. Then, the Team explained the purpose of Symbolization and the relation to Digital Plotting and Digital Compilation to the trainees.
Figure 3.22 Session of map symbolization
3.10.1. Training Session The training sessions were conducted as shown in Table 3.29.
Table 3.29 Training sessions on Symbolization (2009)
Date Contents
01- Nov Sun Instruction of the technology transfer
(Digital plotting, Digital Compilation, Symbolization)
02-Nov Mon Basic Training of MicroStation
03-Nov Tue Basic Training of MicroStation
04-Nov Wed Basic Training for Creation of Manuals

127
Date Contents
05-Nov Thu Basic Training of MicroStation for symbolization
Weekend
08-Nov Sun Basic Training of MicroStation for symbolization
09-Nov Mon Basic Training of MicroStation for symbolization
10-Nov Tue Lecture for Data-Type (Point, Line, Polygon)
Summary of symbolization (Cell, Line style and Topology)
11-Nov Wed Lecture and practice for Cells
12-Nov Thu Lecture and practice for Text Style
Weekend
15-Nov Sun Lecture and practice for Line Style
16-Nov Mon Lecture and practice for Topology Creation
17-Nov Tue Lecture and practice for Patterns
18-Nov Wed Lecture and practice for Text and Manipulate
19-Nov Thu Lecture and practice for Map preparation
Weekend
22-Nov Sun Lecture and practice for Creating Table (for Printing)
23-Nov Mon Practice
24-Nov Tue Practice
25-Nov Wed Practice for making feature catalog of the Waterworks Bureau
26-Nov Thu Practice for making feature catalog of the Waterworks Bureau
Weekend
29-Nov Sun Practice for making feature catalog of the Waterworks Bureau
30-Nov Mon Practice for making feature catalog of the Waterworks Bureau
1-Dec Tue Evaluation of trainees
2-Dec Wed Evaluation of trainees
3-Dec Thu Generalization
3.10.2. Contents The software used for the symbolization was MicroStation. Although the MicroStation is CAD software, it is possible to use for the symbolization in case of large scale map. In the case of small scale map, other software is normally used for the symbolization. Therefore, the contents of training were how to use MicroStation and lecture about symbolization and practice by them.

128
a) Cells
The symbol which is called in MicroStation as cell should be created in order to express and realize its attribute on the topographic map. The team explained about tools and manipulation of MicroStation for Cell Library and Cells.
Creating Cell Library Creating Cell Placing Active Cell Replacing Cells
Figure 3.23 shows samples of before placing Cell and after placing Cell.
Before After
Figure 3.23 A sample of placing Cell
b) Text Style
The size and font of text which express the attribute of object should be changed in order to understand its indication easily on the topographic map. The team explained about tools and manipulation of MicroStation for Text Style.
Placing Text Changing Text Attribute

129
Before changing the text attribute
Setting window After changing the text attribute
Figure 3.24 A sample of text style
c) Line Style
The pattern is given to line data such as road in order to classify and realize its attribute easily on the topographic map. The team explained about tools and manipulation of MicroStation for line style.
Creating Line Style Library Line Style Editor
Before giving style After giving style
Figure 3.25 A sample of line style

130
d) Creating Topology
The color and diagonal line are given to the shape data such as buildings in order to classify and realize its attribute on the topographic map. Therefore, the topology is created in this step.
The team explained about tools and manipulation of MicroStation for creating topology.
Creating Shapes Changing Active Fill Type Hatching Area
Before filling and hatching After filling and hatching
Figure 3.26 A sample of creating topology
e) Patterns
The pattern of symbol is given to area data such as forest in order to classify and realize its attribute easily on the topographic map. The team explained about tools and manipulation of MicroStation for “Patterns”.
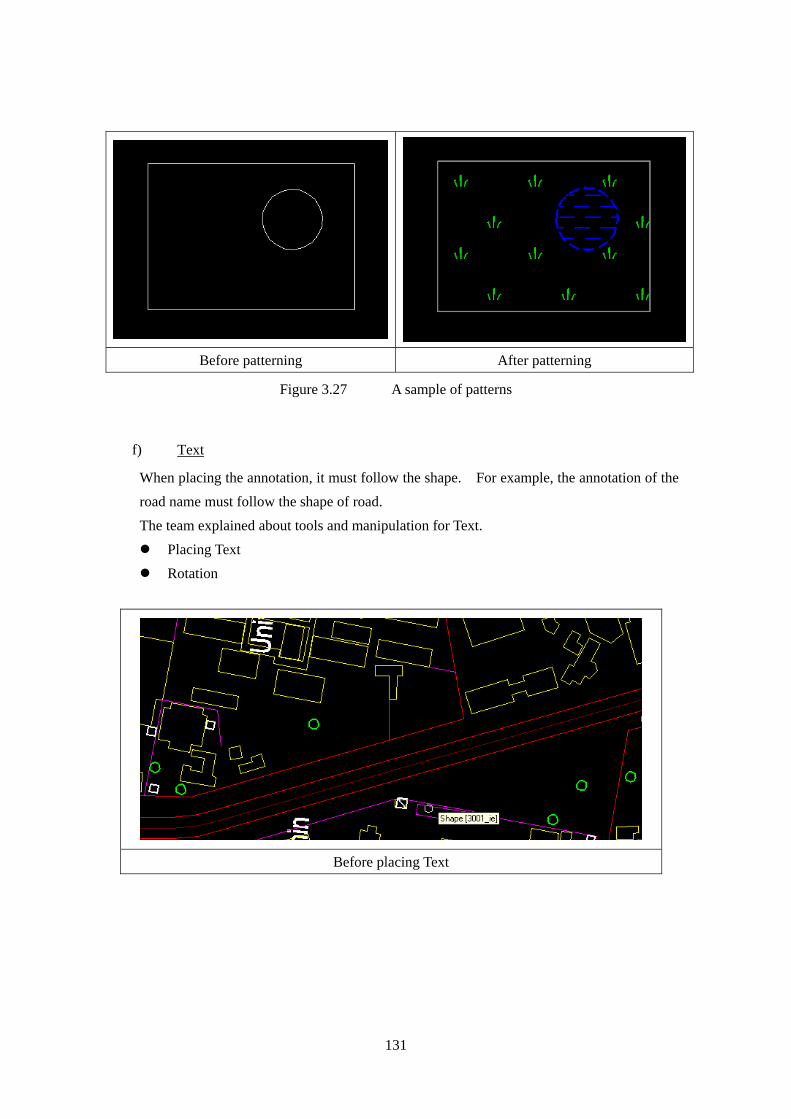
131
Before patterning After patterning
Figure 3.27 A sample of patterns
f) Text
When placing the annotation, it must follow the shape. For example, the annotation of the road name must follow the shape of road. The team explained about tools and manipulation for Text.
Placing Text Rotation
Before placing Text

132
After placing text and rotation
Figure 3.28 A sample of placing text
g) Map preparation
When some objects exist at a near by site and the symbol (cell) is given to the object, symbol will lap over with neighbor symbol. In that case, the symbols must be arranged their location. The team explained about tools and manipulation for Map preparation.
Moving cells and placing indication points.
Before arranging Cell After arranging Cell with placing indication points
Figure 3.29 A sample of moving cell and placing indication points

133
Deleting lines
Before deleting lines After deleting lines
Figure 3.30 A sample of deleting lines
h) Creating Table
Priority order are given to each layer in order to prevent hiding the symbol under the polygon when map printing. Moreover, color and line weight should be adjusted. The team explained about tools and manipulation of MicroStation for Creating Table (for
Printing).
Before giving priority order After giving priority order
Figure 3.31 A sample of giving priority order
Practice 1
The Team prepared the data of the project area of 5km2 for practice. The result of practice by trainees is shown in Figure 3.32.

134
Before symbolization (plotted data)
After symbolization
Figure 3.32 The result of symbolization by trainee

135
Practice 2
The Team prepared special practice for trainees. The trainees who work in SNDE requested the practice which relates their work to the Team. Practice was “Make feature catalog of SNDE”. They tried to make feature catalog for water supply networks.
Figure 3.33 shows the feature catalog which made by them
Figure 3.33 Feature catalog by trainee
3.10.3. Evaluation of trainees and future tasks
a) Evaluation
The Team evaluates the trainees through the training and from the result of the training. The evaluation was done from the following aspects.
Table 3.30 The aspects of evaluation for the Symbolization
Aspects Contents
1 Basic Knowledge Basic knowledge about Photogrammetry, Cartography, Software and this project at start of this training.
2 Motivation Motivation to understand this training and to apply the result of this training.
3 Theory Well understanding and good motivation for the acquisition toward theory.

136
4 Manipulation Well understanding and good motivation for the acquisition toward manipulation of software.
5 MicroStation Well understanding and manipulation about MicroStation.
6 Symbolization Well understanding and manipulation about symbolization.
7 Creating Table Well understanding and manipulation about Creating Table.
8 Improvement The improvement of understanding and motivation through this training.
9 Future The possibility for future application of this training and the data
b) Conclusion and future task
The trainees had some experiences of CAD software but poor knowledge about topographic maps. They, however, got interested in map symbolization during the sessions. It is normally difficult to realize and understand the attribute of each data in simple plotted data. But the attribute of the data can be realized and understood easily after symbolization. As they made their own symbol in the practice 2, whenever they have new idea of design for symbol, they should make their own symbol by themselves through a trial and error process. In spite of little knowledge about Symbolization, they were keen on this subject aiming to apply this technique to water supply designing. They are expected in future to apply their experience and the data supplied by this project to designing the water supply network and developing the land concerned to the network. It is expected that they would continue to exercise the operations themselves.
3.11. Conclusion All the planned subjects of technology transfer have been achieved in spite of some schedule modifications due to the political situation. At the beginning, most of the trainees had no experience in theses technologies. At present, they have acquired basic knowledge and skills. They need more exercise without instructors for acquiring the ability to perform practical works. In other words, they have attained the level from which they can start the exercises by themselves. The level of achievement varies from subject to subject. Concerning the five subjects of field work, they have acquired the ability to perform the practical works because they worked out as OJT and produced reliable data for this mapping project.

137
On the other hand, as for the indoor subjects, they need more voluntary exercises because these works need them to manipulate a variety of software and the software permits a variety of applications depending on their own purposes and original ideas. Among others, Aerial triangulation and Digital plotting require them to exercise intensively for a definite period, because these subjects require them to get a skill with 3D viewing and measuring as well as to be familiarized to the software. Each session of technology transfer was, however, given to a few of technical staffs. Therefore, it is expected that they would try to spread the technologies to other staffs.

138

139
CHAPTER 4. DIFFUSION OF THE USE OF DIGITAL MAP DATA For diffusing any digital map data, including the data produced under this Study project, a circulation mechanism shown in Figure below must be put into practice. This circulation includes three phases, that is, Data creation and maintenance, Data distribution, and Data application. In the first phase, the publisher creates his digital map data under a plan, rules and specifications, aiming to develop a spatial database. In this Study project, creation of the digital map data for the Nouakchott area has been done. After creation of data, the publisher establishes a distribution system for effective diffusion. This system must be effective so as to enable the end users easily to obtain the data they want. The publisher also prepares a user support system. Then, he announces the publication and necessary conditions. Through the distribution system, in the second phase, the publisher distributes the data to users. In the third phase, the users apply the data to anything to meet their purposes and intentions. For this, the users acquire necessary skill and human resources if necessary, and form an application system. They also collect or make additional data if necessary. On the other hand, the data must be maintained for sustainable use in another first phase. Data maintenance means not only data updating but also data improvement and development. Therefore, the maintenance must be done keeping up with the user’s demands. In order to make an appropriate maintenance, the publisher tries to collect the demands and opinions from the users who have applied the data.
Figure 4.1 Circulation mechanism of digital map data
The wider the field of data application is, the more effective and stable diffusion of the data is expected. These various applications of digital map data and more advanced ones need a
Creation
Maintenance
Digital Map Data GIS Application Data
Distribution Application
and

140
stable technical support.
4.1. The user of digital map and GIS Before a new development of digital map data, a demand analysis of the data needs to be conducted. The result will shows the type of user and the effective way how to distribute the data. The following conceptual diagram shows an example of structure of user group in digital map use. In addition to the three existing (or expected to be existence) user groups, it should be considered that there is a potential user group behind the group of light user. To realize diffusion of the use of digital map data, first of all the enhancement of function of existing user group to carry out their own role and then the development of new light-user from the potential user will be necessary.
Figure 4.2 Conceptual diagram of users of digital map and GIS
4.1.1. Digital map data and GIS user 1). Power User Group
This group is expected to play an important role in all-purpose services concerning GIS including IT support. In the case of Mauritania, the DCIG should be expected to take it. Enhancement of human resource, technical advancement, and better system environment will be necessary for DCIG to play the role.
Power User
Heavy User
Light User
Number of users Large Small
General
Specialized

141
2). Heavy User Group
This group is expected to play a role to deal with GIS including IT support for individual purpose. In the case of Mauritania, some of the existing GIS users should be supported so as to formulate this group which takes the role as advanced user of GIS, GIS analysis, etc.
3). Light User Group
Most of users who refer the digital map data mainly are generally classified in this group. In the case of Mauritania, most of the existing GIS users are included in this group.
4). Potential User Group
This group is placed behind the light user group waiting the chance to use GIS whenever the surrounding environment favors the use.
4.1.2. Digital Map Data & GIS User in Mauritania For the diffusion of digital map and GIS, the Study team and DCIG had some discussions about the current state of usage of digital map and GIS in Mauritania and listed up the existing and potential users. Then, the Team and DCIG visited the listed organizations and introduced the digital map data which were under preparation in this Study. Summaries of the meetings are shown in APPENDIX 8. 1). Current condition of potential users of digital map and GIS The following table shows the existing users and potential users of the digital map who were found through this Study and listed up.
Table 4.1 Potential users of digital map data
(Y: Yes, N: No)
Name of organ Relevant field Current status of map & GIS use
DCIG (Ministry of Habitat Urbanism and Development of Territory)
Development and distribution of cartographic map
Paper map: Y Digital map: N GIS: Stand-alone type
DU (Ministry of Habitat Urbanism and Development of Territory)
Urban planning, Urban development
Paper map: Y Digital map: Y GIS: Stand-alone type
DARTAR (Ministry of Habitat Land development, Paper map: N

142
Urbanism and Development of Territory)
Regional planning Digital map: N GIS: Stand-alone type
DIT (Ministry of Equipment and Transport)
Transportation planning, Highway construction
Paper map: Y Digital map: Y GIS: Stand-alone type
DP (Ministry of Hydraulic and Purification)
Water drainage, Main sewage process
Paper map: N Digital map: N GIS: N
OMRG (Ministry of Industry and Mines)
Natural resource and mine development
Paper map: Y Digital map: Y GIS: Stand-alone type
DGPC (Ministry of Interior and Decentralization)
Civil security, Fire-fighting, Logistic
Paper map: N Digital map: N GIS: N
Environment (Ministry Delegate Office of Prime Minister in Charge of Environment)
Environment preservation
Paper map: Y Digital map: Y GIS: Stand-alone type
DS (Ministry of Health) Healthcare plan and management
Paper map: N Digital map: N GIS: N
DFE (Ministry of Economic Affaires and Development)
Economic affaires and development
Paper map: N Digital map: N GIS: N
CUN Administration of Nouakchott
Paper map: Y Digital map: Y GIS: Stand-alone type
SNDE Water supply Paper map: Y Digital map: Y GIS: Stand-alone type
SOMELEC Power supply Paper map: Y Digital map: Y GIS: Stand-alone type
EU -
Paper map: N Digital map: N GIS: N

143
UNDP -
Paper map: N Digital map: N GIS: N
UNICEF -
Paper Map: N Digital Map: N GIS: N
WFP -
Paper Map: N Digital Map: N GIS: N
WHO -
Paper Map: N Digital Map: N GIS: N
FAO -
Paper Map: N Digital Map: N GIS: N
UNHCR -
Paper Map: N Digital Map: N GIS: N
World Bank -
Paper Map: N Digital Map: N GIS: N
AFD -
Paper Map: N Digital Map: N GIS: N
French Embassy -
Paper Map: N Digital Map: N GIS: N
U.S. Embassy -
Paper Map: N Digital Map: N GIS: N

144
2). Utilization Fields of Digital Map Data and Expected Role of Organizations in Mauritania As discussed above, an expected role to the DCIG for the diffusion of digital map data will be one of the “Power User Group” considering the official field of it in Mauritania government. Expected functions for DCIG as a “Power User Group” are development, publication and distribution of data, standardization and etc.
Table 4.2 Utilization field and expected role
Name of organ Utilization field of digital map data and GIS
User Group (Expected Role)
DCIG (Ministry of Habitat Urbanism and Development of Territory)
Data development, Publication and distribution, System administration, Standard of spatial data and technology, etc
Power User Group
DU (Ministry of Habitat Urbanism and Development of Territory)
Urban planning GIS system administrator and System User, etc
Heavy User Group
DARTAR (Ministry of Habitat Urbanism and Development of Territory)
Land development planning, Region planning, etc
Heavy User Group
DIT (Ministry of Equipment and Transport)
Transportation facility planning and management system, etc
Heavy User Group
DP (Ministry of Hydraulic and Purification)
Discharging water, Main sewer management system, etc
Heavy User Group
Ministry of Industry and Mines Natural resource management system, etc
Heavy User Group
DGPC (Ministry of Interior and Decentralization)
Fire protection system, Crime information system, etc
Heavy User Group
Environment (Ministry Delegate Office of Prime Minister in Charge of Environment)
Environment preservation system, Flood risk mitigation system, etc
Light User Group
DS (Ministry of Health) Healthcare facility service system, etc
Light User Group

145
CUN Nouakchott city information system, etc
Heavy User Group
SNDE Water supply management system, etc
Light User Group
SOMELEC Electric power service management system, etc
Light User Group
EU Community support activity, etc
Potential User
DFE (Ministry of Economic Affaires and Development)
Ditto Potential User
UNDP Ditto Potential User
UNICEF Ditto Potential User
WFP Ditto Potential User
WHO Ditto Potential User
FAO Ditto Potential User
UNHCR Ditto Potential User
World Bank Ditto Potential User
AFD Ditto Potential User
France Embassy Ditto Potential User
U.S. Embassy Ditto Potential User

146
4.2. Distribution of Digital Map Data The newly created digital topographic map data of scale 1:10,000 will expectedly contribute greatly to decision-making in administration plan on Nouakchott for all ministries. Thus, an effective and practical system for the optimum diffusion of geographic information including this and building a sharing system are very important. Data diffusion will include selling of spatial data and its promotion for extensive use to public. Similarly, the Data Sharing System shall include interactive use of spatial data among the governmental organizations, especially among the Ministries. To make these two components successful, it is recommended to establish a responsible organization named, for instance, Spatial Data Center (CDS) to act as a core for handling the spatial data.
Figure 4.3 Concept of diffusion and sharing of geographic information
Thus, along with the above description of CDS, this chapter describes the two (2) main components; Distribution of Geographic Information and Data Sharing Systems.
Mainly Governmental Organs Mainly public
Data Distribution
Data Sharing System
All Users (Citizen, Private
Sector, etc)
For instance, CDS under DCIG

147
4.2.1. Spatial Data Center For the efficient and timely distribution of topographic data of this project as well as other spatial data available or planned to be created within the Ministry to the data users, an organization for controlling the data would be essential. This organization will also be responsible for updating all the spatial data whenever required. Thus, this will help in bringing uniformity of spatial data and will promote their diffusion. Designated organization, for instance, can be named as “Spatial Data Center (CDS)”. Throughout the realization of this Project, DCIG has been involved as the counterpart of the Study team. And also, its official coverage is development of new spatial data, publication and distribution of data, updating of data, etc. Considering this, the Study Team’s proposal is to establish CDS under DCIG as shown below.
Figure 4.4 Spatial Data Center (CDS)
1). Systematizing Spatial Data Center
In order to systematize CDS, the followings need to be underlined: a) Specific role of this center in spatial data creation and maintaining. b) Formulation of system for updating map data. c) Feasible infrastructure to be prepared tentatively:
・ Raising the Project team ・ Composition of hardware to work practically ・ Software to be installed.
2). Functions of Spatial Data Center The major functions of CDS are underlined as follows:
DCIG
CDS
Users
Other governmental
organizations
< Data sharing system >

148
・ Promotion for data diffusion ・ Facilitating for data sharing systems ・ Creating, Maintaining and updating spatial data ・ Setting standards for spatial data ・ Others.
4.2.2. Diffusion of Topographic Data (including GIS Database) For the wider use of spatial data including this topographic data, an organization which runs all the circulation mechanism of data creating, data distributing and service providing would be required. And also, financial resource might be necessary for the organization to operate the circulation mechanism. For this, the Study Team proposes that the spatial data should be sold. Selling of spatial data should be opened to all related organizations which want to buy the data. However, the points like types of data to be sold and clear cut pricing policy need to be clarified in advance. Similarly, need appraisal should be conducted time to time to know the demand trend of spatial data users. Moreover, promotional activities such as presenting demonstrations using the model systems created under this Project will be necessary. These all efforts will also help to maintain and to carry out activities at the CDS effectively.
For selling spatial data, two (2) cases are basically discussed; direct management by DCIG, and consignment to an agency including private enterprise.
Figure 4.5 Cases of diffusion of topographic data
* MHUDT: Ministry of Habitat, Urbanism, and Development of Territory With the case of the direct management, DCIG performs maintenance of 1:10,000 topographical maps as well as GIS database produced by the Agency as a sole organization of unifying all the geographic information. In addition, DCIG distributes the topographic data free of charge or
Sales report and Payment of Royalty
Apply for purchase
User of topographic data
DCIG or MHUDT
Data supplied by CDS
Case of Consignment
User of topographic data
Internet, Fax, etc.
Delivery Window in DCIG
Visiting for purchase
Case of Direct Management
Data supplied by DCIG

149
with payment upon the requests by playing a central role of building a system by which DCIG shall conduct distribution of the mapping products. With the case of entrusting to the subordinate body like the agency on the other hand, the agency collectively performs data selling and supplying upon the order from a user. Then, the agency will have an obligation to submit a sales performance on a regular basis to DCIG or the Ministry. In addition, the consignee is to pay a copyright royalty, too.
Items to be sold: Even in this Project, there are different forms of data products; such as, printed maps, digital maps, GIS database, etc. And, with the concept of Spatial Data Center, various products will be piled in the future. Thus, it will be essential to decide about the product types to be diffused through selling.
4.2.3. Additional issues in the diffusion of digital map data 1). Geospatial information development plan In this study, it was clearly understood that there is a lot of demands for the detailed maps, for example 1:2,500, 1:5,000 of scales, in order to develop water supply and sewage facility, establishing plans for drainage and to repair urban infrastructure such as, highway, green belt, disposal center, etc in the Nouakchott City. Generally, it is expensive and time-consuming to develop a data for the new topographic maps especially at a large scale. If individual Directions of national government or local governments develop their own map data independently, overlaps of investment are likely to happen. In order to minimize the cost by avoiding the overlapping, it may be effective to set a total plan for developing a nationwide geospatial data to be named “national spatial data development plan”. 2). Collaboration of national and local governments for the development of geospatial
information There are twelve regions (wilaya) and one capital district in Mauritania. In this study, digital topographic map data (1:10,000) covering the capital district of Nouakchott was completed. As stated above, demands for the detailed map data will be grown in the local governments. Currently, it is not a realistic situation for the Mauritanian government to prepare all data sets required by the local governments. The digital map data prepared by local governments should be shared with the national government except some exceptional case.

150
3). Development of human resource For the diffusion of geospatial data including the digital map data (1:10,000) created in this study, development of human resource is one of the important elements to be considered.
4). Utilization of geospatial information in public administration The digital topographic map data should be utilized for public administrations in disaster mitigation, natural resource management, social security improvement, natural environment conservation, disclosure of information and others.
5). Standardization of geospatial information The standardization of digital map data makes it easier to exchange the data among different users, organizations, social groups and others. As a result of standardization, the diffusion of digital map data can be promoted by information interchange. 6). Updating of Digital Map Data Digital map data should be updated based on the established procedures. Without appropriate updating, the digital map data will lose connections with the spatial realities in the coming years and as a result the value of the data will be reduced. A drastic change is taking place especially in the central area of Nouakchott and rapid expansion of human settlement to suburban area is currently in progress due to a comparatively high pressure of urban development, which makes it more important to update the data at specific interval of time. There are forty seven map sheets (1,200 km2) of digital map data in total and the coverage of aerial photography is 2,000 km2. It would be recommended to update the whole digital map sheet set (47 sheets) at a single time every 3 to 5 years to preserve the freshness of the whole data set. If it is difficult to update in the above manner, it may be suggested to classify these map sheets into some classes of priority by current land use change. Moreover, map sheets which contain urban development plans or some other plans should be prioritized. The figure below shows an example of updating cycle proposed by the Team.

151
Figure 4.6 Updating cycle of digital map data (example)

152
Table 4.3 Updating cycle of digital map data (example)
No Map Sheet No Updating Cycle Remark
1 NE28-XIV-2d-15 As necessary Outskirts of Nouakchott
2 NE28-XV-1c-11 As necessary Outskirts of Nouakchott
3 NE28-XV-1c-12 As necessary Outskirts of Nouakchott
4 NE28-XIV-2d-10 As necessary Outskirts of Nouakchott
5 NE28-XV-1c-6 As necessary Outskirts of Nouakchott
6 NE28-XV-1c-7 As necessary Outskirts of Nouakchott
7 NE28-XIV-2d-5 As necessary Outskirts of Nouakchott
8 NE28-XV-1c-1 As necessary Outskirts of Nouakchott
9 NE28-XV-1c-2 As necessary Outskirts of Nouakchott
10 NE28-XIV-2b-25 As necessary Outskirts of Nouakchott
11 NE28-XV-1a-21 As necessary Outskirts of Nouakchott
12 NE28-XV-1a-22 As necessary Outskirts of Nouakchott
13 NE28-XV-1a-23 3-5 years Surroundings of built-up area
14 NE28-XIV-2b-20 As necessary Outskirts of Nouakchott
15 NE28-XV-1a-16 As necessary Outskirts of Nouakchott
16 NE28-XV-1a-17 3-5 years Surroundings of built-up area
17 NE28-XV-1a-18 3-5 years Surroundings of built-up area
18 NE28-XIV-2b-15 1-2 years Build-up area, Seacoast environment area
19 NE28-XV-1a-11 1-2 years Build-up area
20 NE28-XV-1a-12 1-2 years Build-up area
21 NE28-XV-1a-13 3-5 years Surroundings of built-up area
22 NE28-XIV-2b-10 1-2 years Build-up area, Seacoast environment area
23 NE28-XV-1a-6 1-2 years Arafat redevelopment plan area
24 NE28-XV-1a-7 1-2 years Arafat redevelopment plan area
25 NE28-XV-1a-8 1-2 years Build-up area
26 NE28-XV-1a-9 3-5 years Surroundings of built-up area
27 NE28-XV-1a-10 As necessary Outskirts of Nouakchott
28 NE28-XIV-2b-5 3-5 years Seacoast environment area
29 NE28-XV-1a-1 1-2 years Arafat redevelopment plan area
30 NE28-XV-1a-2 1-2 years Arafat redevelopment plan area
31 NE28-XV-1a-3 3-5 years Surroundings of built-up area
32 NE28-XV-1a-4 3-5 years Surroundings of built-up area
33 NE28-XV-1a-5 3-5 years Surroundings of built-up area

153
34 NE28-XV-1b-1 3-5 years Surroundings of built-up area
35 NE28-VIII-4d-25 3-5 years Seacoast environment area
36 NE28-IX-3c-21 1-2 years Build-up area
37 NE28-IX-3c-22 3-5 years Surroundings of built-up area
38 NE28-IX-3c-25 As necessary Outskirts of Nouakchott
39 NE28-VIII-4d-20 As necessary Outskirts of Nouakchott
40 NE28-IX-3c-16 3-5 years Surroundings of built-up area
41 NE28-IX-3c-17 As necessary Outskirts of Nouakchott
42 NE28-VIII-4d-15 As necessary Outskirts of Nouakchott
43 NE28-IX-3c-11 3-5 years Surroundings of built-up area
44 NE28-IX-3c-12 As necessary Outskirts of Nouakchott
45 NE28-VIII-4d-10 As necessary Outskirts of Nouakchott
46 NE28-IX-3c-6 3-5 years Surroundings of built-up area
47 NE28-VIII-4d-5 As necessary Outskirts of Nouakchott

154
4.3. GIS Model System The newly created digital topographic map at the scale of 1:10,000 covering whole the built-up area of Nouakchott and its surroundings is expected to contribute greatly to planners and decision makers in formulating plans for managing informal settlements, improving sanitation, conserving environment and so on. Demonstrating the usefulness of the dataset will undoubtedly help promoting their diffusion. Thus, the Team has made an attempt to prepare GIS models showing some of existing issues in Nouakchott.
4.3.1. Creation of GIS model system The model system was designed and developed taking the following respects into consideration.
• Practical performance • High-priority issue • General-purpose properties • Fast-acting properties
4.3.2. Software and hardware for GIS model systems The following system environment was adopted in order to have beneficial effects on GIS model systems. 1). Software
One set of ArcGIS with ArcInfo license has been installed for carrying out the priority issues.
2). Hardware
The specification of hardware installed with the GIS software (ArcGIS with ArcInfo license) and extensions of 3D analyst, Spatial analyst and Network analyst is as follows: Processor - Intel Xeon Processor 5160, 3.00GHz with 4MB L2 cache (Dual Capable) 1333MHz FSB or better.
4.3.3. GIS data and Model system For preparing the GIS data and model system, building data, address data set, DEM, elevation class, etc were extracted from the topographic map data Those data and GIS models are applicable to the current issues of Mauritania immediately.

155
1). General flow of GIS model system construction Its general flow-chart is presented below:
Discussions withRelated Agencies
Finalizing GIS Models Theme
Listing the Required GIS Data for each GIS Model
Preparation of GIS Data
Preparation of Display System Showing Theme of each GIS Model
- GIS and Inventory Data from other AgenciesData from this Project TOPO Maps
Discussions withRelated AgenciesDiscussions withRelated Agencies
Finalizing GIS Models Theme
Listing the Required GIS Data for each GIS Model
Preparation of GIS Data
Preparation of Display System Showing Theme of each GIS Model
Preparation of Display System Showing Theme of each GIS Model
- GIS and Inventory Data from other Agencies
- GIS and Inventory Data from other AgenciesData from this Project TOPO MapsData from this Project TOPO Maps
2). Themes for GIS Model Discussions were held with DCIG and other related governmental and non-governmental organs to explore details about issues in the central area of Nouakchott and its surroundings. Considering the points popped up during discussion, following four themes were selected for preparation of GIS models. Related organs to each theme are given below.
Table 4.4 Themes of model system
Theme Related organizations GIS data
used
1 GIS model for address search and display
City of Nouakchott (CUN) See 1. in the next table
2 GIS model for potential flood risk management
Direction General of Civil Protection (DGPC)
See 2. in the next table
3 GIS model for water supply facility management
National Society of Water (SNDE) See 3. in the next table
4 GIS model for facility management
Ministry of Health, Ministry of Fundamental Education
See 4. in the next table
The GIS data used in preparing the models for each theme were listed below.

156
Table 4.5 Data used in each theme
Data
From topographic map (1:10,000)
Buildings Theme
Roads
Large Small
Other
Other
1 Line data attribute of roads
Polygon data (Health center, school, Other public facilities)
Point data
Location of water point sources (as points)
Attribute data of roads, Attribute data of blocks
2 Line data Polygon data Point data Contour lines, Leveled point, Spot heights
3 Line data Polygon data Point data
Attribute data of water point sources, Photos of water point sources
Polygon data
4 Line data Schools (Junior high school, High school) (as points), Hospital, Health Center (as
points)
Orthophoto, Attribute data of roads, Attribute data of blocks
Then, after listing the required GIS data for each model, the Team prepared these data which include not only the data from topographic maps by this project but also those provided by other agencies. Then, the Team prepared the GIS model systems.
3). GIS Model System for Address Search / Map Display
Purpose There are two ways to indicate a position on the earth. The one is direct indication with a set of coordinates and the other is indirect indication with address. Address is used to indicate a location in human society in the most general way. For example, the location of buildings, facilities and parcels of land would be specified by their

157
address. Address data of this model system can be utilized for searching a place, telling a place, managing a facility, and so on.
Items and Methodology
Topographic Map(1:10,000)
Topographic Map(1:10,000)
Larger Buildings (Health Center, School, Public,
Others) (As Polygon)
Roads (Streets)
Smaller Buildings (As Point)
Smaller Buildings (As Point)
STEP 1:
Complete AddressComplete Address
Blocks with Address
Blocks with Address
STEP 3: RESULT
Streets NumberStreets Number
STEP 2:
Streets withNumber
STEP 4:
STEP 5: RESULT
Address forResidencesAddress forResidences
STEP 6: RESULT
The data of road number (street address) which had been provided by the counterpart, was added to the Road data extracted from 1:10,000 topographic maps. Then, they are displayed with Block having their own number. Altogether this consists of an address system of Nouakchott. Lastly, it is displayed with Buildings data (from 1:10,000 topographic map data) for address search and display. Besides, Health center, School, and Public, all other larger buildings (polygon data) included in the 1:10,000 topographic map are categorized as other buildings. These data along with smaller buildings (as point) are displayed as background.

158
Procedure of using (analysis or search) in the system
Examples of application Tools for address search consists of “Address Search by Street Address”, “Address Search by Block Address”, and “Address Search by Landmark”.
Figure 4.7 Tool-bar for address search
The following figure shows the way how to use the tools.
Figure 4.8 Address search tool by street address
Search
Automatic Calculation
Display the result (objective building or block)
Input “Address” or “Block Number”

159
• Address-search and map-display by street and bloc address for private use. • Address-search and map-display by street and bloc address for public use. • Address-search and map-display by street and bloc address for emergency use.
Figure 4.9 Street address in Nouakchott

160
4). GIS Model System for Potential Flood Risk Management
Purpose Nouakchott has suffered from a number of inundations in the past caused by heavy rainfall, flood of Senegal River, and beach erosion. Without protection measures, the risk of inundation by heavy rainfall will stay for the future. The risk of inundations of Senegal River-origin has been minimized. The risk of inundation caused by beach erosion will stay or increase without any countermeasures. This GIS Model was constructed by analyzing elevation around the Nouakchott for potential flooding on the built-up area, whose topography is nearly flat. This Model will greatly help in planning and implementing countermeasures in advance to minimize the damage caused by the disaster.
Items and Methodology
Buildings(from Topographic Map)
STEP 2
Roads(from Topographic Map)
Buildings(from Topographic Map)
Buildings(from Topographic Map)
STEP 2
Roads(from Topographic Map)
Roads(from Topographic Map)
STEP 3: RESULT
Potential FloodRisk in
Built-up Area
STEP 3: RESULT
Potential FloodRisk in
Built-up Area
Potential FloodRisk in
Built-up Area
Contour Line & Spot Height
(from Topographic Map)
STEP 1
DEMTINClassified Elevation Map (Vector Format)
(8 Elevation Classes)
Potential FloodRisk Map
Potential FloodRisk Map
(4 Level of Risk)
DEMDEM
The contour lines and point data containing height information were used to create TIN (Triangulated Irregular Network), which was used to create DEM (Digital Elevation Model). The DEM, being in Raster format, represents the real world with respect to elevation as a matrix of cells or pixels. In this model, the pixel size of DEM is 20m. Considering the elevation difference from the mean sea level and further its potentiality for inundation, the elevation map is created by dividing the elevation around Nouakchott into 8 classes. This map is further classified into four potential flood risk categories, as presented below:

161
Table 4.6 Criteria for Elevation Map and Potential Flood Risk Map
Elevation (m) Elevation
Class Potential Flood Risk
Level
≤ -1.50 1
-1.49 to 0.00 2 Serious potential risk
0.01 to 1.00 3
1.01 to 2.00 4 Moderate potential risk
2.01 to 3.00 5
3.01 to 5.00 6 Less potential risk
> 5.01 7 Low potential risk
The above Potential Flood Risk Map is displayed along with back ground data; Buildings
and Roads are urban facility to show its seriousness in the built-up area of Nouakchott.
Procedure of using (analysis or search) in the system
Examples of use application
• Analysis of inundation hazardous area • Hazard map • Analysis of site location • Disaster countermeasure planning • Damage prediction
Decide criteria
Automatic Calculation
Display the result (Hazard area, profile, etc)
Choose the concerning layers

162
Figure 4.10 Elevation map of Nouakchott

163
Section 1 of beach ridge Section 2 of beach ridge
Section 3 of beach ridge Section 4 of beach ridge
Section 5 of beach ridge
Figure 4.11 Section diagram of beach ridge

164
Figure 4.12 Potential flood risk of Nouakchott

165
5). GIS Model for Water Supply Facility Management
Purpose Water supply is one of critical issues in the whole area of Nouakchott. With this essence, this GIS model was created to present the existing status of water supply facilities in the area of point source such as well, water tank, etc. Thus, this would contribute in their timely and efficient management.
Items and Methodology
The main steps adopted for this Model are presented in the flowchart below.
STEP 3: RESULT
Overall Point SourceWater Facility in Built-up
Area of Nouakchott
Overall Point SourceWater Facility in Built-up
Area of Nouakchott
STEP 5: RESULT
Status of Water Point Source in Built-up Area of Nouakchott
STEP 5: RESULT
Status of Water Point Source in Built-up Area of Nouakchott
Attributes of WaterPoint Sources
Photo of WaterPoint Sources
STEP 2:
Attributes of WaterPoint Sources
Attributes of WaterPoint Sources
Photo of WaterPoint SourcesPhoto of WaterPoint Sources
STEP 2:
Functional Water Location data
Functional Water Location with Good and Normal Quality
Potential Cover Area of these Water Location Sources
STEP 4:
Functional Water Location data
Functional Water Location data
Functional Water Location with Good and Normal Quality
Functional Water Location with Good and Normal Quality
Potential Cover Area of these Water Location Sources
Potential Cover Area of these Water Location Sources
STEP 4:
Water Point Source DataWater Point
Source Data
STEP 1:
Topographic Map(1:10,000)
Buildings(Point and Polygon)
Roads
Buildings(Point and Polygon)
Buildings(Point and Polygon)
RoadsRoads
Out of the GIS data of topographic map (1:10,000) prepared under this Study project, the layers related to the water point sources, small buildings, large building and roads were selected and arranged to get separate data for water sources (as points), small buildings (as points), large buildings (as polygons), and roads (as lines). The attribute data related to the water point sources, which provided by the related agency (Nouakchott Urban Community), was combined with its spatial data. Also, the photograph

166
of these point sources (whatever could be taken) were linked, which can be displayed even in ArcGIS environment. After combining the attributes data and photographs, the water point source data is displayed along with buildings and roads to have better understanding of their distribution in the built-up area of Nouakchott. The attribute table of water point sources contains pretty large number of fields (Items). For instance, a field presents whether point source is functional or non-functional. Thus, among these water sources, many are currently not in function. Also, out of the functional ones, some have water quality as bad, which can not be used for drinking (normal and good water quality). Considering these, the functional water point sources, which have drinkable water quality, have been selected and further analyzed by buffering based on their water supply capacity with following criteria:
Finally, the status of water point sources with the above result is displayed along with background data (buildings and roads).
Procedure of using (analysis or search) in the system
Examples of use application
• Study current service • Water Supply / Demand Check • Water distribution plan
Criteria for buffering:
- Smaller supply capacity (approx. coverage < 50 households): buffer with 39m - Medium supply capacity (approx. coverage 51 – 200 households): buffer with 50m - Large supply capacity (approx. coverage > 200 households): buffer with 84m.
Automatic Calculation
Choose objective “Water supply facility”
Display the result (position, photos etc)
Choose the capacity

167
• New setting / replace / remove water facility • Water service / quality check
Figure 4.13 Status map of water supply facility
Distribution of Water Supply Facility

168
6). GIS Model System for Facility Management with Network
Purpose The GIS model system shows a typical example for analysis of public facility distribution, site location using buffering process. In this example, the location analysis of school, health care facilities is performed.
Items and Methodology
Topographic Map(1:10,000)
Hospital, Health Center
Larger Buildings(As Polygon)
Roads
STEP 2:
Orthophoto
STEP 1:
Orthophoto
STEP 1:
Orthophoto
STEP 1:
Schools (Junior High School, High School)
- Potential Coverage of Junior High School- Potential Coverage of High School- Shortest Route to Junior High School- Shortest Route to High School
- Potential Coverage for Hospital- Potential Coverage for Health Center- Shortest Route to Hospital- Shortest Route to Health Center
- Potential Coverage for Hospital- Potential Coverage for Health Center- Shortest Route to Hospital- Shortest Route to Health Center
Potential Coverage, Shortest RouteOrthophoto
STEP 1:
Orthophoto
STEP 1:
Orthophoto
STEP 1:
Orthophoto
STEP 1:
STEP 3: RESULT
Out of GIS layers of Topographic Map (1:10,000), Junior High School, High School, Hospital, Health Center is analyzed for its potential coverage of service by buffering with following criteria. Above analysis depicts the area which is out of coverage of any school or health facility, if there is any. Similarly, by taking few locations as sample in the built-up area, the shortest distance to reach to the school or health facility is analyzed to show its importance in case of
Criteria for buffering: - Junior High School: 500m - Hospital: 500m - High School: 1,500m - Health Center: 200m

169
emergency. All the above displays (coverage of School or health facility, shortest distance) include layers of Buildings and Roads as background.
Procedure of using (analysis or search) in the system
Chose the target area or points
Automatic calculation(Network analysis)
Display the result (Appropriate route)
Choose the concerning Facility

170
Figure 4.14 Distribution of public facility and optimum access route

171
CHAPTER 5. CONCLUSION The Study started in April 2007 and completed in May 2010 with the context given in Section 1.3, that is, rapid growth of population and land use change of Nouakchott and lack of updated maps in digital form. All the planned works were carried out without a skip and achieved digital geographic database of satisfactory quality, which enables the users to make various applications of GIS. In addition, technology transfer to the technical staffs of DCIG and other relevant organs was conducted in order to enable them to perform digital mapping, data updating and data usage. The targeted levels of technologies were attained. The geographic database of Nouakchott is a newborn national property, so it is essential for the Government of Mauritania to make every effort to promote application of the database to various fields of use and keep the database for sustainable use. In order to keep sustainable use of the database, it is recommended that the Government would build an appropriate system for data maintenance and distribution, where data maintenance includes data updating, data improvement and data development. DCIG, the national organ in charge of geographic information service, is required to perform its duty to maintain the database in good shape and to distribute the data to the users with efficiency. There are two approaches for building the system. One is that DCIG would directly manage the data service by equipping a laboratory exclusive for data maintenance and distribution inside of the Direction. The other is that DCIG or the Ministry would consign the data service to an agency or a private enterprise, which manages all data service under the supervision of DCIG. In any case, it is recommended that DCIG would be technically capable for managing the data service. Technology transfer was conducted under the project and the Mauritanian staffs have attained to a level to perform practical processes of field works, but as especially for the indoor processes, they are required to make more progress by continuing voluntary trainings. At the same time, they are required to spread the technologies to other staffs in order to maintain the technical level of DCIG. And also it is recommended that the database and the new equipment should be carefully maintained for sustainable data service. A governmental body for coordinating the needs of users and diffusing the applications should be organized from a viewpoint of sustainable use of the database, so it is suggested that the

172
National Commission of Geographic Information would be organized as soon as possible.