chapter 4: community facilities a. introduction
TRANSCRIPT

4-1
Chapter 4: Community Facilities
A. INTRODUCTION This chapter examines the Coney Island Rezoning’s potential effects on community facilities serving the rezoning area and surrounding area. The City Environmental Quality Review (CEQR) Technical Manual defines community facilities as public or publicly funded facilities, including public schools, libraries, day care, health care, and fire and police protection services. Direct effects may occur when a proposed project physically alters or displaces a community facility. Indirect effects may result from increases in residential, worker, or visitor population that place additional demands on community facility service delivery. Because the proposed rezoning would not directly displace existing community facilities, this chapter’s analyses focus on the potential for indirect effects.
The CEQR Technical Manual provides thresholds that can help make an initial determination of whether a detailed analysis is necessary to determine potential impacts. A preliminary analysis was conducted to determine if the development expected as a result of the proposed actions would exceed the established CEQR Technical Manual thresholds for these community facilities; detailed studies were prepared for public schools, libraries, day care, and health care facilities. The CEQR Technical Manual recommends performing an assessment of police and fire protection services when a proposed action will directly displace those facilities. Since the proposed actions would not displace police or fire facilities, the rezoning’s impacts on these services are not assessed. However, a description of the police and fire facilities that serve the rezoning area and a qualitative discussion of the proposed actions’ potential effects on those facilities are provided. Consistent with the guidance of the CEQR Technical Manual, the proposed actions’ effect on private facilities and services, such as private schools, is also not assessed.
B. SCREENING-LEVEL ASSESSMENT The analysis of community facilities has been conducted in accordance with the guidelines of the CEQR Technical Manual. The CEQR Technical Manual recommends a community facilities screening analysis for any proposed action that would add 100 or more residential units. Since the residential component of the RWCDS would exceed this initial threshold, an analysis has been undertaken.
Following the methodology of the CEQR Technical Manual, detailed assessments of community facilities are warranted if a proposed action may have an impact on the provision of public or publicly funded services available to the community. The CEQR Technical Manual provides preliminary screening thresholds that help make an initial determination of whether a detailed analysis is warranted to assess potential impacts. Table 4-1 outlines the thresholds for a detailed analysis associated with each type of community facility. If the proposed actions would exceed the threshold for a specific type of facility, a more detailed analysis is warranted.

Coney Island Rezoning
4-2
Table 4-1 Preliminary Screening Analysis Thresholds
Community Facility Threshold for Detailed Analysis
Proposed Actions: Need for Detailed Analysis
Public schools More than 50 elementary/intermediate school or 150 high school students
Yes
Libraries Greater than 5 percent increase in ratio of residential units to libraries in borough
Yes
Day care centers (publicly funded) More than 50 eligible children based on number of low- to moderate-income units
Yes
Health care facilities (outpatient) More than 600 low- to moderate-income units Yes Police protection Direct effect only No Fire protection and emergency services
Direct effect only No
Source: 2001 CEQR Technical Manual.
PUBLIC SCHOOLS
The CEQR Technical Manual recommends conducting a detailed analysis of public schools if a proposed project would generate more than 50 elementary/middle school and/or more than 150 high school students. Based on the number of residential units expected under the RWCDS, the proposed actions would generate approximately 1,324 total students—approximately 698 elementary school students, 289 middle school students, and 337 high school students. This number of students warrants a detailed analysis of the proposed actions’ effects on elementary, middle, and high schools. The methodology for this analysis, and the analysis itself, is provided in section C, “Public Schools.”
LIBRARIES
Potential impacts on libraries may result from an increased population. According to the CEQR Technical Manual, if a proposed project would increase by more than 5 percent the average number of residential units served by library branches in the borough in which it is located, the proposed project may cause significant impacts on library services and require further analysis. In Brooklyn, a project that adds 734 residential units exceeds this threshold. The RWCDS exceeds this threshold, and a detailed analysis of libraries is warranted. The methodology for this analysis, and the analysis itself, is provided in section D, “Libraries.”
DAY CARE FACILITIES
According to the CEQR Technical Manual, if a proposed project would add more than 50 eligible children to the study area’s publicly funded day care facilities, a detailed analysis of the proposed project’s impact on publicly funded day care facilities is warranted. This threshold is based on the number of affordable (low-income and low- to moderate-income units) within a proposed project and differs for each borough. In Brooklyn, 70 affordable housing units would yield 50 eligible children. Therefore, the RWCDS would exceed the preliminary screening threshold and a detailed day care analysis was conducted (see section E, “Day Care Facilities”).

Chapter 4: Community Facilities
4-3
HEALTH CARE FACILITIES
Health care facilities include public, proprietary, and nonprofit facilities that accept funds (usually in the form of Medicare and Medicaid reimbursements) and that are available to any member of the community. Examples of these types of facilities include hospitals, nursing homes, clinics and other facilities providing outpatient health services. Pursuant to CEQR Technical Manual guidelines, the health care assessment focuses on emergency and outpatient ambulatory services that could be affected by the introduction of a large low-income residential population that may rely heavily on nearby hospital emergency rooms and other public outpatient ambulatory services.
Potential significant adverse impacts on health care facilities could occur if a proposed project would cause health care facilities within the study area to exceed capacity, or if a proposed project would result in a population increase of 5 percent or more who would seek services at these facilities. According to the CEQR Technical Manual, if a proposed project would generate more than 600 low- to moderate-income units, there may be increased demand on local public health-care facilities, which may warrant further analysis. The development expected under the RWCDS would exceed this threshold and, therefore, a detailed analysis was conducted and is provided in section F.
POLICE AND FIRE PROTECTION
The Police and Fire Departments routinely evaluate the need for changes in personnel, equipment, or facilities based on population, response times, crime levels, or other local factors. Therefore a detailed assessment of service delivery is usually conducted only if a proposed action would directly affect the physical operations of a station house or precinct house. The proposed actions would not directly affect any existing police or fire protection facilities, and therefore a detailed analysis is not warranted. However, a description of the police and fire facilities that serve the rezoning area is provided for informational purposes (see sections G and H of this chapter).
C. PUBLIC SCHOOLS
METHODOLOGY
This chapter identifies public schools serving the study area for the proposed actions and assesses conditions in terms of enrollment and utilization during the current school year, noting any school capacity deficiencies. This analysis takes into consideration projected increases in future enrollment and plans to increase school capacity either through administrative actions on the part of the New York City Department of Education (NYCDOE) or as a result of the proposed actions, relative to available capacity that may exist in the future without the proposed actions.
According to the CEQR Technical Manual and guidance from the New York City Department of City Planning (DCP), the study area for an analysis of public schools generally consists of the catchment area for nearby elementary and intermediate schools that are most likely to be the schools serving students introduced by the proposed actions. Elementary and intermediate school students introduced by the proposed actions could be assigned to the primary and intermediate schools within an approximately ½-mile area from the rezoning area. Students generally attend the schools they are assigned to, but under certain conditions, they could opt to

Coney Island Rezoning
4-4
attend any of the schools within the Community School District (CSD) serving the rezoning area, CSD 21. As population shifts within a school district change over time, NYCDOE can adjust attendance zones within districts to improve the composition and utilization of the affected school(s). Therefore, the analysis in this Final Environmental Impact Statement (FEIS) uses a ½-mile study area around the rezoning area and also considers the larger area of CSD 21. The schools within or near the ½-mile study area are shown on Figure 4-1.
Following the methodology of the CEQR Technical Manual, the schools analysis considers the most recent capacity, enrollment, and utilization rates for elementary, middle/intermediate, and high schools in the study area. Future conditions are then predicted both without and with the proposed actions, using student generation rates provided by NYCDOE and taking into consideration any planned changes to schools in the study area.
Pursuant to the CEQR Technical Manual, if the detailed analysis finds that a proposed action would cause an increase of 5 percent or more in a deficiency of available seats in the affected schools (those within the study area), a significant adverse impact may result, requiring potential mitigation measures.
EXISTING CONDITIONS
ELEMENTARY SCHOOLS
As shown in Table 4-2, five elementary school and PS/IS schools are located within or near the ½-mile radius of the rezoning area. In the 2006-2007 academic year, these five elementary and PS/IS schools had a total capacity of 3,680 seats and an enrollment of 2,981 students, for a utilization of approximately 81 percent and a surplus of 699 seats. For CSD 21 as a whole, total capacity was 14,092 seats in the 2006-2007 academic year, and enrollment was 12,375, for a district-wide utilization of approximately 88 percent, with a surplus of 1,717 seats.
Table 4-2 Public Elementary School Utilization, Capacity, and Enrollment Figures: 2006-2007 School Year
Map No.1 Study Area Schools Address Enrollment Capacity
Available Seats
Utilization (Percent)
1 PS 90 Edna Cohen School
2840 West 12th St. 509 674 165 76
2 PS 100 Coney Island School
2951 West 3rd St. 671 666 -5 101
3 PS 2882 Shirley Tanyhill School
2950 West 25th St. 434 633 199 69
4 PS 329 Surfside PS 329 TCU
2929 West 30th St. 645
43
793
41
148
-2
81
105 5 PS 188
Michael E. Berdy School 3314 Neptune Ave. 679 873 194 78
½-MILE STUDY AREA TOTAL 2,981 3,680 699 81 CSD 21 TOTAL 12,375 14,092 1,717 88
Notes: 1 See Figure 4-1. 2 PS component of a PS/IS school Sources: 2006-2007 Enrollment, Capacity and Utilization Report, NYCDOE and School Construction Authority,
November, 2007. Target capacity method was used.

MERMAID AVE.
W. 1
5TH
ST.
W. 1
6TH
ST.
W. 1
7TH
ST.
SURF AVE.
LEIF ERICSON DR.
NEPTUNE AVE.
RIEGELMANN BOARDWALK
NEPTUNE AVE.
W. 1
9TH
ST.
W. 2
0TH
ST.
W. 2
1ST
ST.
W. 2
2ND
ST.
W. 2
3RD
ST.
W. 2
4TH
ST.
W. 2
5TH
ST.
STIL
LWEL
L AV
E.
W. 2
7TH
ST.
W. 2
8TH
ST.
W. 2
9TH
ST.
W. 3
0TH
ST.
W. 3
1ST
ST.
W.3
2ND
ST.
BAY 52ND ST.
BAY 53RD ST.
BAY 54TH ST.
BAY 56TH ST.BA
Y VI
EW A
VE.
HART P
L.
U.S. PIERHEAD AND BULKHEAD LINEU.S. PIERHEAD AND BULKHEAD LINE CO
NEY ISLAN
D C
REEK
W. 2
0TH
ST.
W. 2
2ND
ST.
AVE. Z
LEON S. KAISER PLAYGROUND
ATLANTIC OCEAN
W. 1
9TH
ST.
SIX DIAMONDS PARK
KEYSPANPARK
SEASIDE PARK
W. 8
TH S
T.
CO
LBY
CT.
WEST AVE.W 6
TH S
T.
ATWATER CT.
OCE
AN P
ARKW
AY
OCEANVIEW AVE.
BRIGHTON BEACH AVE.
SHELL RD.
W 2ND PL.
W 5
TH S
T.
W 3
RD S
T.
W 2
ND S
T.
SEA BREEZE AVE.
W 1
2TH
ST.
SHEEPSHEAD BAY RD.
W. 3
6TH
ST.
W. 3
5TH
ST.
W. 3
3RD
ST.
BOWERY ST.
AVE. Z
1.10.09
Public SchoolsFigure 4-1CONEY ISLAND REZONING
SCALE
0 1000 2000 FEET
N
Rezoning Area Boundary
West 25th Street Parking Site
Study Area Boundary (1/2-Mile Perimeter)
Public Schools (See Tables 4-2, 4-3 and 4-4)1
1
5
2
34
6
8
7

Chapter 4: Community Facilities
4-5
INTERMEDIATE SCHOOLS
One intermediate school, and the intermediate component of a PS/IS school, is located within the ½-mile study area. As shown in Table 4-3, intermediate school enrollment within the ½-mile study area is 1,045, and these schools are operating at 57 percent of capacity with a surplus of 762 seats. In CSD 21 as a whole, total enrollment is 8,533, with 922 available seats (74 percent of capacity).
Table 4-3 Public Intermediate School Utilization, Capacity, and Enrollment Figures: 2006-2007 School Year
Map No.1 Study Area Schools Address Enrollment Capacity
Available Seats
Utilization (Percent)
3 PS 2882 Shirley Tanyhill School
2950 West 25th St.
150 219 69 68
6 IS 303 Herbert S. Eisenberg
501 West Ave. 895 1,588 693 56
½-MILE STUDY AREA TOTAL 1,045 1,807 762 57 CSD 21 TOTAL 8,533 11,455 922 74
Notes: 1 See Figure 4-1. 2 IS component of a PS/IS school Sources: 2006-2007 Enrollment, Capacity and Utilization Report, NYCDOE and School Construction
Authority, November, 2007. Target capacity method was used.
HIGH SCHOOLS
NYCDOE does not require high school students to attend a specific high school in their neighborhood. Students have the ability to attend various schools within the borough or city, based on seating availability and admissions criteria, although there may be a tendency to attend a high school closer to home. According to the NYCDOE’s latest admissions guidelines, students who wish to attend their zoned school must rank that particular school among their 12 choices on their applications and would be given priority in admission. This means that when students are not matched with schools ranked above their zoned school, they would automatically be assigned to their zoned school. In cases where students are not accepted to one of their 12 choices and do not list their local zoned school as one of the choices, they would not be automatically assigned to their zoned school, but would need to complete a new High School Choice Form.
There are 10 public high schools located in CSD 21, two of which are located within the study area: Rachel Carson High School for Coastal Studies and Abraham Lincoln High School (see Table 4-4). Rachel Carson High School for Coastal Studies is located within the IS 303 building. This school provides a standard-based curriculum with a concentration in Marine Biology and Environmental Sciences. The school partners with the New York Aquarium, the Brooklyn Center for Environmental Studies, and other institutions to offer students opportunities for learning and experiences.1
1 http://schools.nyc.gov/ChoicesEnrollment/High/Directory/school/?sid=1604
The school had a utilization rate of 142 percent in the 2006-2007 academic year, with a deficit of 54 seats. Abraham Lincoln HS has been organized into several Small Learning Communities (SLC). Each of these SLC’s has a special focus. These include

Coney Island Rezoning
4-6
Veterinary Science and Animal Care; Science and Math; Professional Photography; and Humanities. In 2006-2007 the school had a utilization rate of 128 percent, with a deficit of 595 seats. Overall, Brooklyn’s high schools had a surplus of 2,688 seats, with a utilization rate of 97 percent.
Table 4-4 Public High School Utilization, Capacity,
and Enrollment Figures: 2006-2007 School Year Map No.1 Name Address Enrollment Capacity
Available Seats
Utilization (Percent)
7 Rachel Carson High School for Coastal Studies2
521 West Ave. 183 129 -54 142
8 Abraham Lincoln High School
2800 Ocean Parkway
2,688 2,093 -595 128
½-MILE STUDY AREA TOTAL 2,871 2,222 -649 129 BROOKLYN HIGH SCHOOL TOTAL 91,206 93,874 2,668 97
Notes: 1 See Figure 4-1. 2 Located in IS 303 building. Sources: 2006-2007 Enrollment, Capacity and Utilization Report, NYCDOE and School Construction
Authority, November, 2007. Target capacity method was used.
Throughout Brooklyn, total high school capacity was 93,874 in the 2006-2007 academic year, while enrollment was 91,206. Thus utilization was approximately 97 percent, with a surplus of 2,668 seats.
THE FUTURE WITHOUT THE PROPOSED ACTIONS
To assess future enrollment in the study area’s public schools for 2019, a future utilization rate for school facilities was calculated by adding the estimated enrollment from known future proposed residential developments to the projected enrollment for those schools available from NYCDOE, and then comparing that number with projected school capacity.
NYCDOE projects future school enrollment by district up to 10 years into the future using cohort survival methodology based on birth rates and grade-retention ratios. In applying these enrollment projections, it is important to note that school enrollment and utilization conditions in the City can change substantially over a long time span, such as up to 2019. For CSD 21, NYCDOE’s enrollment projections are through the year 2016. These projections were used to represent elementary and intermediate school enrollments for the 2019 analysis year.
In the future without the proposed actions, local school enrollment by 2019 could be affected by general demographic trends, as well as the addition of new housing units in the study area. As described in Chapter 2, “Land Use, Zoning, and Public Policy,” it is expected that approximately 1,567 new housing units will be developed within or near the ½-mile public school study area in the future without the proposed actions. Because 77 of those new units will be housing for senior citizens, they are not included in this analysis.
In November 2008, the School Construction Authority (SCA) and NYCDOE released updated public school generation rates for the projection of school children associated with new development, in conjunction with the release of SCA’s new five year (2010-2014) capital plan based on this information. The capital plan is based on student generation rates (i.e., the number of school age children per household) that differ from those used by SCA in the past and from

Chapter 4: Community Facilities
4-7
those presented in the 2001 CEQR Technical Manual. The new rates for Brooklyn are 0.29 elementary, 0.12 intermediate, and 0.14 high school students per household, regardless of income level. Table 4-5 lists the number of new students projected as a result of the new developments expected in the study area.
Table 4-5 RWCDS Future Without the Proposed Actions:
Projected New Housing Units and Estimated Number of Students School Level New Dwelling Units Generation Rate Total Students
Elementary (Age 4-10) 1,490 0.29 432 Middle (Age 11-13) 1,490 0.12 179 High (Age 14-17) 1,490 0.14 209
Total Number of New Students Introduced 820 Source: CEQR Technical Manual, Updated School Multipliers, Fall 2008.
ELEMENTARY AND IMTERMEDIATE SCHOOLS
As shown in Table 4-6, elementary and PS/IS schools within or near the ½-mile study area are expected to operate at 86 percent of capacity in 2019 in the future without the proposed actions. Total enrollment in the ½-mile study area will be approximately 3,167, with 513 available seats (86 percent utilization). The entire CSD 21 is expected to operate at 84 percent of capacity, with a total enrollment of 11,827 and a surplus of 2,265 seats.
In the future without the proposed actions, the intermediate schools in the ½-mile study area will have a total enrollment of 940 and will be operating at 52 percent of capacity, with 867 seats available. In CSD 21, intermediate school enrollment is expected to be 6,519 with a surplus of 4,936 seats (57 percent utilization). Therefore, neither the schools in the ½-mile study area nor CSD 21 as a whole will be operating above capacity in the future without the proposed actions.
Table 4-6 Projected Public Elementary/Intermediate School Enrollment,
Capacity, and Utilization: 2019 Future Without the Proposed Actions
Area
NYCDOE Projected
Enrollment
Students Introduced by
New Development Under No Action
Total Projected Enrollment in
2019 Capacity Available
Seats Utilization (percent)
Elementary ½- Mile Study Area 2,735 432 3,167 3,680 513 86 CSD 21 11,395 432 11,827 14,092 2,265 84
Intermediate ½- Mile Study Area 761 179 940 1,807 867 52 CSD 21 6,340 179 6,519 11,455 4,936 57 Notes: Per the NYCDOE 2005–2009 Five-Year Capital Plan, Proposed 2008 Amendment, February 2008, no new
seats or school buildings are proposed for CSD 21. To estimate student enrollment for elementary and intermediate schools in the study area in 2019, the total
number of students enrolled in those schools (NYCDOE Enrollment/Capacity/Utilization Report) in 2006-2007 was divided by the total number of elementary or intermediate students enrolled in CSD 21 in 2006-2007. The resulting percentages of 0.24 for elementary and 0.12 for intermediate was applied to CSD 21’s projected enrollment (elementary and intermediate were handled separately) in 2019 to estimate elementary and intermediate enrollment for the study area schools in 2019.
Sources: NYCDOE, Enrollment, Capacity, and Utilization Report, 2006-2007 School Year; New York City School Construction Authority, Statistical Forecasting Enrollment Projections 2007 to 2016.

Coney Island Rezoning
4-8
HIGH SCHOOLS
DCP and NYCDOE do not provide projections of high school students on a local basis. Additional high school students generated by demographic shifts and future development projects in the area would be able to choose from among the City’s high schools and are not likely to affect utilization at neighborhood schools. NYCDOE projects a decrease in high school enrollment borough wide by 2019, anticipating 25,581 fewer students, an approximately 28 percent decrease, from 2006-2007 conditions.
It is expected that development in the future without the proposed actions will introduce an additional 209 high school students into the study area by 2019. As shown in Table 4-7, this will increase Brooklyn high school enrollment to 61,354. There will be a surplus of 36,591 seats and Brooklyn high schools will operate at 63 percent of capacity.
Table 4-7 Projected Public High School Enrollment, Capacity, and Utilization:
2019 Future Without the Proposed Actions
Area
NYCDOE Projected
Enrollment
Students Introduced by
New Development in
Study Area
Total Projected
Enrollment in 2019 Capacity*
Available Seats
Utilization (Percent)
Brooklyn 61,145 209 61,354 97,945 36,591 63 Notes: * Five high schools are currently under construction and will increase capacity by 2018: Midwood HS
Addition (forecast capacity: 340 seats), Sunset Park HS (forecast capacity: 1,650 seats), Telecom Arts and Tech (forecast capacity: 466 seats), Family Court HS (forecast capacity: 1,173 seats), and New Utrecht HS (forecast capacity: 442 seats).
Sources: NYCDOE, Enrollment, Capacity, and Utilization Report, 2006-2007 School Year; The Grier Partnership and New York City School Construction Authority, Enrollment Projections 2007 to 2016, New York City Public Schools, Volume II: Narrative Report, January 2008.
PROBABLE IMPACTS OF THE PROPOSED ACTIONS
The RWCDS for the proposed actions would result in the construction of approximately 2,408 new dwelling units more than expected in the future without the proposed actions. Based on the new NYCDOE student generation rates, the proposed actions would introduce an estimated 698 elementary school children, 289 middle school children, and 337 high school students to the study area’s schools (see Table 4-8).
Table 4-8 RWCDS Future With the Proposed Actions:
Projected New Housing Units and Estimated Number of Students
School Level Incremental New Dwelling Units Generation Rate Total Students
Elementary (Age 4-10) 2,408 0.29 698 Middle (Age 11-13) 2,408 0.12 289 High (Age 14-17) 2,408 0.14 337
Total Number of Students Introduced by the Proposed Actions 1,324 Sources: NYCDOE Draft Updated School Multipliers, Fall 2008.

Chapter 4: Community Facilities
4-9
ELEMENTARY AND INTERMEDIATE SCHOOLS
As described earlier, in the future without the proposed actions, elementary and PS/IS schools within or near the ½-mile study area and CSD 21 will be operating at 86 and 84 percent of their capacity, respectively. As shown in Table 4-9, elementary and PS/IS schools within or near the ½-mile study area would be just over capacity in the future with the proposed actions. With the 698 students introduced by the RWCDS, elementary schools in the ½-mile study area would have a deficit of 185 seats (utilization rate of 105 percent), although CSD 21 as a whole would operate at 89 percent utilization with 1,567 available seats. According to the CEQR Technical Manual, if a proposed action would cause an increase of 5 percent or more in a deficiency of available seats in the affected schools (those within the study area), a significant adverse impact may result, warranting consideration of mitigation. The proposed actions would result in a 5 percent capacity deficiency at elementary schools within the ½-mile study area. However, this analysis conservatively includes the entire projected residential increment of the Brighton Beach Rezoning (115 units) in the future without the proposed actions, although none of the Brighton Beach Rezoning projected development sites fall within the ½-mile study area for the proposed actions. PS 225 and PS 253 are elementary schools that serve the Brighton Beach neighborhood. In 2006-2007, these schools had utilization rates of 92 percent and 75 percent, respectively, with a total of 188 available seats. Children generated by development of the Brighton Beach Rezoning projected development sites would likely go to these schools, which would be nearer to them than the schools serving the Coney Island neighborhood. The proposed actions would not result in any capacity deficiencies at elementary schools in CSD 21 as a whole where there is sufficient capacity to accommodate the elementary students generated by the proposed actions. Therefore, no significant adverse impacts to elementary schools are anticipated.
Table 4-9 Projected Public Elementary/Intermediate School Enrollment,
Capacity, and Utilization: 2019 Future With the Proposed Actions
Area
Projected Enrollment, Future
Without Actions
Students Introduced by
Proposed Actions
Total Enrollment with Proposed
Actions Capacity Available
Seats Utilization (percent)
Elementary ½-Mile Study Area 3,167 698 3,865 3,680 -185 105 CSD 21 11,827 698 12,525 14,092 1,567 89
Intermediate ½-Mile Study Area 940 289 1,229 1,807 578 68 CSD 21 6,519 289 6,808 11,455 4,647 59 Sources: NYCDOE, Enrollment, Capacity, and Utilization Report, 2006-2007 School Year; New York City School Construction
Authority, Statistical Forecasting Enrollment Projections 2007 to 2016.
Intermediate schools within the ½-mile study area and CSD 21 as a whole are also projected to be below capacity in 2019 in the future without the proposed actions. Intermediate schools in the ½-mile study area are expected to have a surplus of 867 seats without the proposed actions, and therefore would be able to accommodate the 289 new students introduced by the proposed actions. With the RWCDS, intermediate schools in the ½-mile study area would have 578 remaining available seats (68 percent capacity). CSD 21 as a whole is expected to have a surplus of 4,647 seats (59 percent capacity). Therefore, the proposed actions would not result in any capacity deficiencies at intermediate schools within the ½-mile study area or CSD 21 as a whole and no significant adverse impacts to intermediate school capacity are expected.

Coney Island Rezoning
4-10
HIGH SCHOOLS
The proposed actions would introduce an additional 337 high school students into the study area by 2019. As shown in Table 4-10, taking into account only the new students introduced in this study area in the future without and future with the proposed actions, this would increase high school enrollment in Brooklyn to 61,691. There would be a surplus of 36,254 seats and Brooklyn high schools would operate at 63 percent of capacity. Therefore, the proposed actions would not result in any significant adverse impacts to high school capacity.
Table 4-10 Projected Public High School Enrollment, Capacity, and Utilization:
2019 Future With the Proposed Actions
Projected Enrollment,
Future Without Proposed Actions
Students Introduced
by Proposed Actions
Total Enrollment
with Proposed Actions Capacity*
Available Seats
Utilization (Percent)
Brooklyn Total 61,354 337 61,691 97,945 36,254 63 Notes: * Five high schools are currently under construction and will increase capacity by 2018: Midwood HS
Addition (forecast capacity: 340 seats), Sunset Park HS (forecast capacity: 1,650 seats), Telecom Arts and Tech (forecast capacity: 466 seats), Family Court HS (forecast capacity: 1,173 seats), and New Utrecht HS (forecast capacity: 442 seats).
Sources: NYCDOE, Enrollment, Capacity, and Utilization Report, 2006-2007 School Year; The Grier Partnership and New York City School Construction Authority, Enrollment Projections 2007 to 2016, New York City Public Schools, Volume II: Narrative Report, January 2008.
D. LIBRARIES
METHODOLOGY
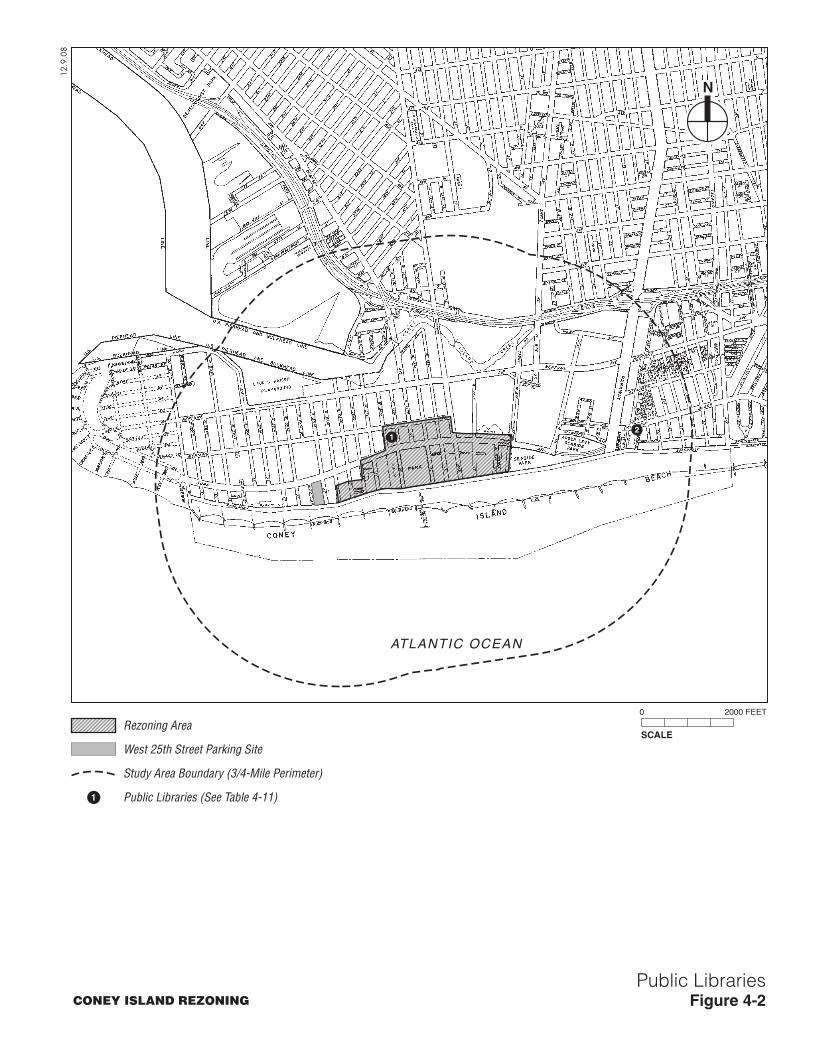
According to CEQR Technical Manual guidelines, catchment areas for library branches correspond to the distance that one might be expected to travel for such services, typically not more than ¾ of a mile. Thus, the library service area for this analysis is defined as ¾ mile from the rezoning area. As discussed below, two libraries are located within this radius of the rezoning area and were included in the assessment.
Consistent with the methodologies presented in the CEQR Technical Manual, the population served by the libraries in the study area was calculated. To determine the population of the library service area, 2000 U.S. Census data were assembled for all census tracts that fall primarily (at least 50 percent) within the ¾-mile catchment area for the libraries. Then, the future population expected in the future without the proposed actions was calculated, assuming an average household size of 2.44 persons per household. Finally, the new population introduced by the proposed actions was also calculated. Pursuant to the CEQR Technical Manual, if a proposed action would increase the study area population by 5 percent or more, and this increase would impair the delivery of library services in the study area, a significant adverse impact could occur.
EXISTING CONDITIONS
The Brooklyn Public Library (BPL) system serves all of Brooklyn and contains a central and a business library and 58 neighborhood branches throughout the borough. The Coney Island and

Chapter 4: Community Facilities
4-11
Brighton Beach neighborhood library branches (including the Coney Island Learning Center) are located within approximately ¾ mile of the rezoning area (see Table 4-11 and Figure 4-2).
Table 4-11 Libraries Within ¾ Mile of the Rezoning Area
Map No.1 Library Location Volumes
1 Coney Island Branch and Coney Island Learning Center 1901 Mermaid Avenue 56,185 2 Brighton Beach 16 Brighton First Road 52,887 Library Service Area2 109,072 Total BPL System3 4,420,614
Notes: 1 See Figure 4-2. 2 Includes all libraries within a ¾-mile radius of the rezoning area. 3 BPL System consists of the Brooklyn Central Library, Business Library, and 58 neighborhood branches in
Brooklyn. Source: BPL.
The two libraries in the ¾-mile study area have a combined total of 109,072 volumes. With a residential population of 57,615, the service area has a volumes-to-resident ratio of 1.89. Borough-wide, the BPL system has a collection of approximately 4,420,614 volumes or a volumes-to-resident ratio of 1.79 (based on the total population of Brooklyn reported in the 2000 Census of 2,465,326).
The 2-story Coney Island Branch Library was constructed in 1956 and renovated in 1997 - 2002. It seats 26 in the adult area, 8 in the young adult area, 40 in the children’s area, and has a 90-seat auditorium and 48-seat meeting room. Public internet is available, with six computers in the children’s room and eight in the adult room. The library contains multilingual materials in English, Spanish, and Russian. One of the Brooklyn Public Library’s five Learning Centers, which provide adult literacy services, is located at the Coney Island Library.1
The Brighton Beach Branch is located in a single-story building that was constructed in 1992. It seats 86 in the adult area, 41 in the children’s area, and has a 75-seat meeting room. Public internet is available, the children’s room has six computers and the adult room has eight. The library contains multilingual materials in Arabic, German, Spanish, Persian (Farsi), French, Hebrew, Korean, Polish, Russian, Turkish, Urdu, Yiddish, and Chinese.
2
THE FUTURE WITHOUT THE PROPOSED ACTIONS
This analysis assumes that the number of volumes in the library service area in the future without the proposed actions will remain the same as the number of volumes in the existing condition. However, it is likely that some of the libraries will increase the number of volumes in their collections by 2019. No changes to libraries within the ¾-mile library study area are expected.
New residential developments expected to be completed by 2019 will increase the population in the ¾-mile study area served by the two local libraries. In the future without the proposed
1 Source: http://www.brooklynpubliclibrary.org/branch_library_detail.jsp?branchpageid=160; letter from
Dionne Mack Harvin, Executive Director, Brooklyn Public Library, dated October 20, 2008. 2 http://www.brooklynpubliclibrary.org/branch_library_detail.jsp?branchpageid=151
ATLANTIC OCEAN
SCALE
0 2000 FEET
12.9
.08
Public LibrariesFigure 4-2CONEY ISLAND REZONING
N
12
Rezoning Area
West 25th Street Parking Site
Study Area Boundary (3/4-Mile Perimeter)
Public Libraries (See Table 4-11)1
Coney Island Rezoning
4-12
actions, the population is expected to increase in the study area by 4,455 residents due to new residential development projects expected to be completed by 2019 and a background growth rate of 0.5 percent, for a total of 62,070 residents. As a result, the volumes-to-resident ratio will decrease from 1.89 in the existing conditions to approximately 1.76 in 2019, slightly lower than the borough-wide ratio of 1.79.
PROBABLE IMPACTS OF THE PROPOSED ACTIONS
Pursuant to the CEQR Technical Manual, if a proposed action would increase the study area population by 5 percent or more, and this increase would impair the delivery of library services in the study area, a significant impact could occur.
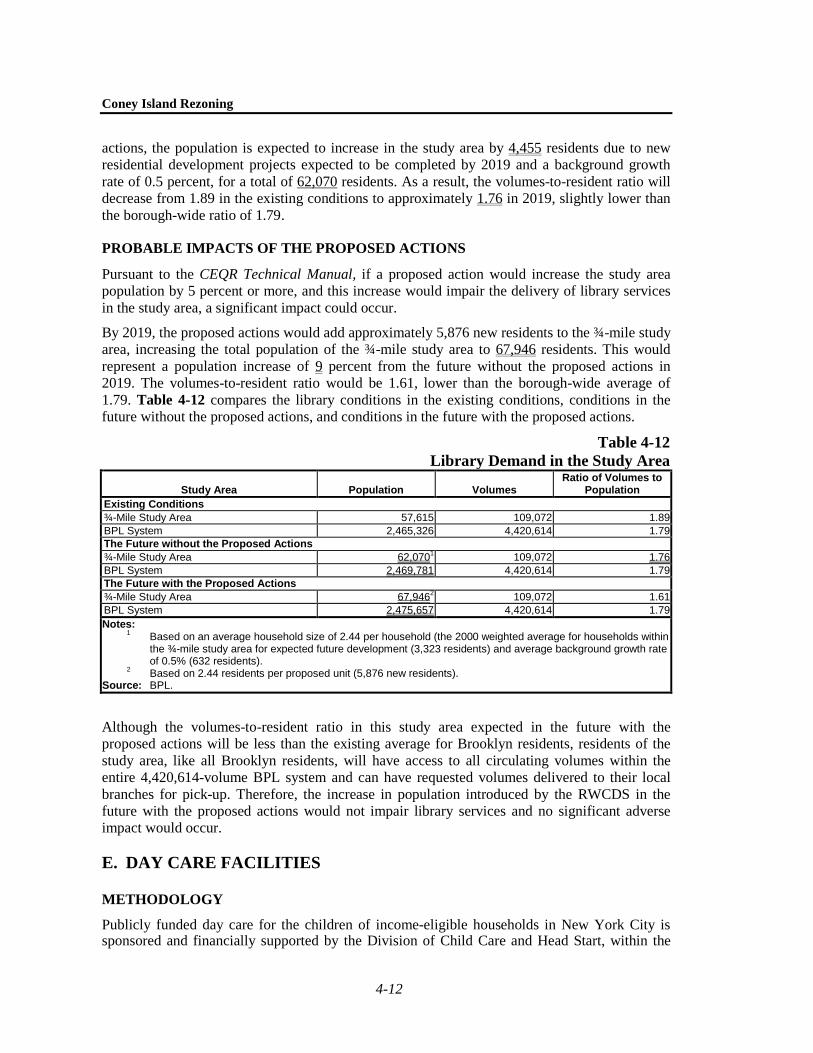
By 2019, the proposed actions would add approximately 5,876 new residents to the ¾-mile study area, increasing the total population of the ¾-mile study area to 67,946 residents. This would represent a population increase of 9 percent from the future without the proposed actions in 2019. The volumes-to-resident ratio would be 1.61, lower than the borough-wide average of 1.79. Table 4-12 compares the library conditions in the existing conditions, conditions in the future without the proposed actions, and conditions in the future with the proposed actions.
Table 4-12 Library Demand in the Study Area
Study Area Population Volumes Ratio of Volumes to
Population Existing Conditions ¾-Mile Study Area 57,615 109,072 1.89 BPL System 2,465,326 4,420,614 1.79 The Future without the Proposed Actions ¾-Mile Study Area 62,0701 109,072 1.76 BPL System 2,469,781 4,420,614 1.79 The Future with the Proposed Actions ¾-Mile Study Area 67,9462 109,072 1.61 BPL System 2,475,657 4,420,614 1.79 Notes: 1 Based on an average household size of 2.44 per household (the 2000 weighted average for households within
the ¾-mile study area for expected future development (3,323 residents) and average background growth rate of 0.5% (632 residents).
2 Based on 2.44 residents per proposed unit (5,876 new residents). Source: BPL.
Although the volumes-to-resident ratio in this study area expected in the future with the proposed actions will be less than the existing average for Brooklyn residents, residents of the study area, like all Brooklyn residents, will have access to all circulating volumes within the entire 4,420,614-volume BPL system and can have requested volumes delivered to their local branches for pick-up. Therefore, the increase in population introduced by the RWCDS in the future with the proposed actions would not impair library services and no significant adverse impact would occur.
E. DAY CARE FACILITIES
METHODOLOGY
Publicly funded day care for the children of income-eligible households in New York City is sponsored and financially supported by the Division of Child Care and Head Start, within the

Chapter 4: Community Facilities
4-13
New York City Administration for Children’s Services (ACS), and Head Start, federally funded early childhood education and family support programs. ACS contracts with hundreds of private, non-profit organizations to provide Child Care and Head Start programs in communities across the City that are licensed by the New York City Department of Health (DOH). ACS also issues vouchers to eligible families to provide financial assistance in accessing care from formal and informal providers in the City. To receive subsidized child care services, a family must meet specific financial and social eligibility criteria that are determined by federal, state, and local regulations. Eligibility is determined by a child’s age (0-13), and a family’s gross income, with consideration of family size. To meet the social eligibility for publicly funded day care, a family must also have an approved “reason for care,” such as involvement in a child welfare case or participation in a “welfare-to-work” program. According to the CEQR Technical Manual, a publicly funded day care facility analysis is warranted if a project would result in more than 50 children eligible for publicly funded day care facilities. The proposed actions would introduce approximately 607 new affordable housing units by 2019. As discussed below, based on the number of new affordable housing units, approximately 437 children under the age of 12 would be eligible for publicly funded day care in 2019.
Publicly funded day care facilities within one mile of the rezoning area are identified and examined; private day care facilities are not considered in the analysis. Current enrollment and capacity information for each day care facility within the study area was provided by ACS.
The day care enrollment in the future without the proposed actions was calculated by multiplying the number of new low-income and low- to moderate-income housing units expected in the 1-mile study area by the Fall 2008 updated CEQR Technical Manual multipliers provided by DCP for projecting day care enrollment (discussed below). This estimate of new day care enrollment was then added to the existing day care enrollment.
The day care-eligible population introduced by the proposed actions was then estimated using the Fall 2008 updated CEQR Technical Manual multipliers, and this population was then added to the day care enrollment calculated in the future without the proposed actions. According to the CEQR Technical Manual, if a proposed project would result in a demand for slots greater than remaining capacity of day care centers, and if that demand constitutes an increase of 5 percent or more of the collective capacity of the day care centers serving the area of the proposed actions, a significant adverse impact may result.
EXISTING CONDITIONS
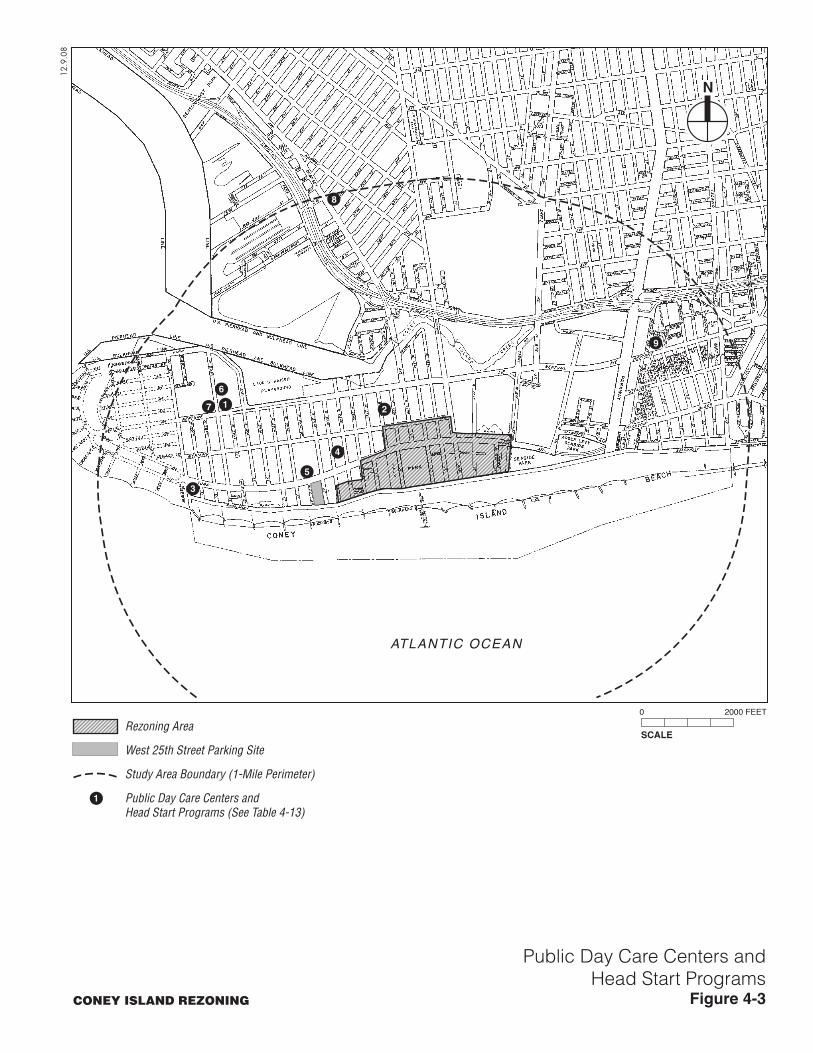
Publicly financed day care centers, under the auspices of the City’s Division for Child Care and Head Start (CCHS) within ACS, provide care for the children (up to age 12) of income-eligible households. Space for one child in such day care centers is termed a “slot.” These slots may be in group day care or Head Start centers, or they may be in the form of family day care in which 7 to 12 children are placed under the care of a licensed provider and an assistant in a home setting. There are nine public day care centers (five contracted child care programs and four Head Start programs) located within the 1-mile study area (see Figure 4-3 and Table 4-13). In total, the child care programs have capacity for 737 children and are currently operating with an enrollment of 702, at 95 percent of capacity. In addition to these day care facilities, other publicly financed day care options are available to residents of the study area. Given that there are no location requirements for enrollment in day care centers, some parents/guardians may choose a day care center closer to a location of
ATLANTIC OCEAN
SCALE
0 2000 FEET
12.9
.08
Public Day Care Centers andHead Start Programs
Figure 4-3CONEY ISLAND REZONING
N
1 2
3
4
5
6
7
8
9
Rezoning Area
West 25th Street Parking Site
Study Area Boundary (1-Mile Perimeter)
Public Day Care Centers andHead Start Programs (See Table 4-13)
1

Coney Island Rezoning
4-14
employment than their place of residence. Parents/guardians have the option of using ACS vouchers to access day care from public and private providers both within and outside the 1-mile study area, potentially in neighborhoods close to parents’ workplaces. The portability of ACS vouchers indicates that services beyond a 1-mile study area can be and are used by eligible parents. However, as discussed in the CEQR Technical Manual, the centers closest to a project site are more likely to be subject to increased demand.
Table 4-13 Public Day Care Centers within One Mile of the Rezoning Area
Map No. 1 Name Address Capacity Enrollment
Available Seats
Utilization (Percent)
Child Care Programs2 1 Coney Island CCC 2757 West 33rd St. 45 40 5 89
2 Police Athletic League La Puerta Abierta 2864 West 21st St. 70 70 0 100
3 Roberta Bright Early Learning Center 3001 West 37th St. 45 47 -2 104
4 Police Athletic League Carey Gardens DCC 2964 West 23rd St. 45 36 9 80
5 Coney Island Community DCC 2960 West 27th St. 80 64 16 80
Total Child Care Programs 285 257 28 90 Head Start Programs
6 Catholic Charities 2757 West 33rd St. 25 33 -8 132 7 Catholic Charities 3415 Neptune Ave. 74 74 0 100
8 National Association of Family Development Center 8885 26th Ave. 86 85 1 99
9 National Association of Family Development Center 293 Neptune Ave. 267 253 14 95
Total Head Start Programs 452 445 7 98 Total Publicly Funded Day Care Programs 737 702 35 95
Notes: 1 See Figure 4-3. 2 Fully funded group programs. Sources: ACS Division of Child Care and Head Start, 2008.
In addition to attending group day care centers, eligible children may also be cared for in the homes of family child care providers, also licensed by DOH. Family child care providers are professionals who provide care for three to seven children in their residences. Group family child care providers are professionals who care for 7 to 12 children, with the help of an assistant, in their homes. The majority of family and group family child care providers in New York City are registered with a child care network, which provides access to training and support services. According to ACS, these home-based facilities tend to absorb unmet demand at day care centers, and more host households are added to the system as demand increases. In 2007, the Brooklyn Family Day Care Networks had a collective capacity of 3,095 slots (see Table 4-13a).

Chapter 4: Community Facilities
4-15
Table 4-13a ACS Funded Family Day Care Networks in Brooklyn
Network Name Network Address Capacity/
Slots Zip Codes Served Bedford Avenue Family Day Care 40 Brevoort Place 292 11203, 06, 10, 13, 16, 2125,
33, 38 Brooklyn Bureau of Community
Service 285 Myrtle Avenue 208 11201, 05, 17
East New York Family Day Care 477 Vermont Avenue 174 11203, 06, 07, 08, 10, 1316, 24, 26, 33, 34, 37
Faith, Hope & Charity Family Day Care
668 Logan Avenue 215 11203, 07, 08, 10, 13, 1618, 24, 26, 33, 34, 36
Friends of Crown Heights Family Day Care
671 Prospect Place 387 11203, 06, 07, 08, 10, 1213, 16, 21, 23, 25, 26, 38
Graham Family Day Care 222 Graham Avenue 206 11206, 11 Graham Windham Family Day Care 540 Atlantic Avenue 400 11203, 07, 10, 11, 12, 1316,
21, 25, 26, 30, 33, 37, 38 Jewish Child Care Association 97-45 Queens Blvd 123 11204, 10, 14, 18, 19, 2324,
29, 30, 34, 35, 39 Nuestros Niños Family Day Care 384 South 4th Street 356 11206, 07, 11, 21
Park Slope Family Day Care 333 14th Street 160 11215, 17, 20, 32 Putnam Family Day Care 706 Quincy Street 5 11221
Salvation Army Brownsville 365 Thatford Avenue 354 11207, 12, 13, 33, 36, 37 Sunset Park Family Day Care 4222 Fourth Avenue 215 11201, 05, 07, 08, 15, 1617,
25, 32, 36, 37 Total Slots 3,095
Source: Source: http://www.dc37.net/about/services/pdfs/ACSFamilyDayCareZipcodeList7_2007.pdf
THE FUTURE WITHOUT THE PROPOSED ACTIONS
In November 2008, DCP released updated CEQR Technical Manual generation rates for the projection of children from affordable housing units who would be eligible for publicly funded day care facilities. These rates differ from those provided in Table 3C-4 of the CEQR Technical Manual. The updated generation rates differentiate between the projected number of children under age 6 who are eligible for publicly funded day care programs and the projected number of children ages 6 to 12 who are eligible for publicly funded after school day care programs.
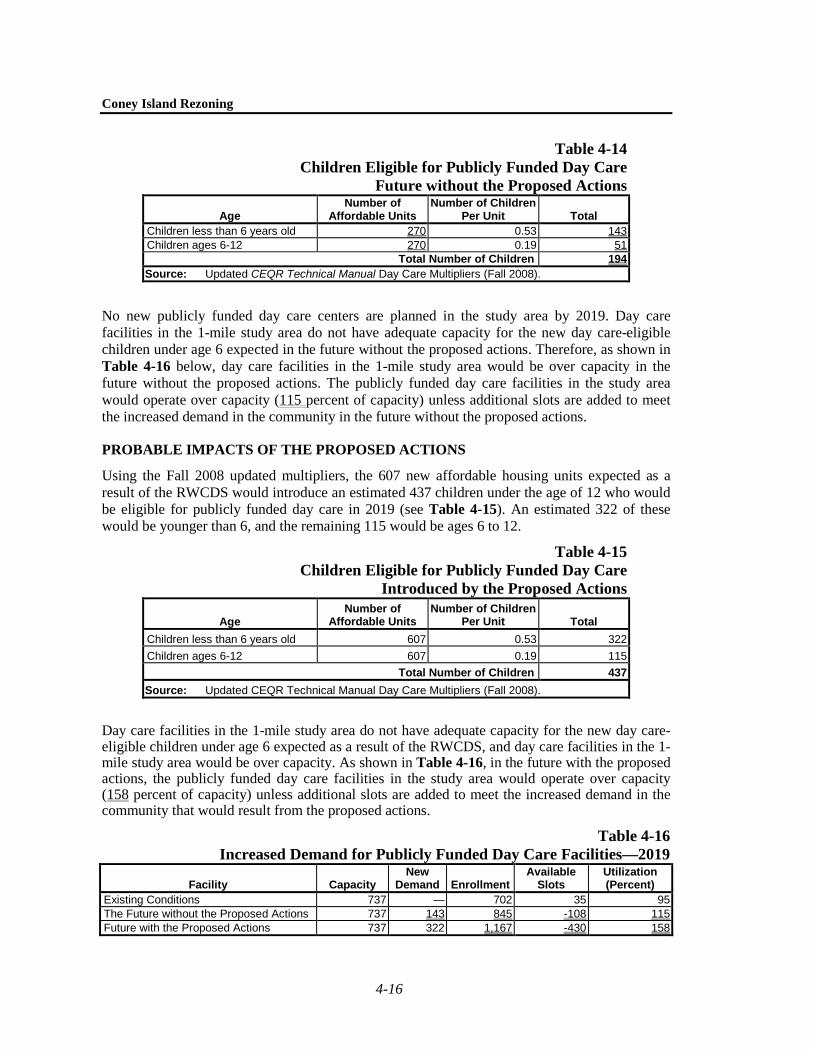
Using the Fall 2008 updated multipliers, 270 new affordable housing units expected in the future without the proposed actions would introduce an estimated 194 children under the age of 12 who would be eligible for publicly funded day care in 2019 (see Table 4-14).1
1 There are a total of 347 affordable housing units expected in the future without the proposed actions, but
77 of those units will be for senior citizen housing and are not included in this analysis of day care facilities.
An estimated 143 of these would be younger than 6, and the remaining 51 would be ages 6 to 12.
Coney Island Rezoning
4-16
Table 4-14 Children Eligible for Publicly Funded Day Care
Future without the Proposed Actions
Age Number of
Affordable Units Number of Children
Per Unit Total Children less than 6 years old 270 0.53 143 Children ages 6-12 270 0.19 51
Total Number of Children 194 Source: Updated CEQR Technical Manual Day Care Multipliers (Fall 2008).
No new publicly funded day care centers are planned in the study area by 2019. Day care facilities in the 1-mile study area do not have adequate capacity for the new day care-eligible children under age 6 expected in the future without the proposed actions. Therefore, as shown in Table 4-16 below, day care facilities in the 1-mile study area would be over capacity in the future without the proposed actions. The publicly funded day care facilities in the study area would operate over capacity (115 percent of capacity) unless additional slots are added to meet the increased demand in the community in the future without the proposed actions.
PROBABLE IMPACTS OF THE PROPOSED ACTIONS
Using the Fall 2008 updated multipliers, the 607 new affordable housing units expected as a result of the RWCDS would introduce an estimated 437 children under the age of 12 who would be eligible for publicly funded day care in 2019 (see Table 4-15). An estimated 322 of these would be younger than 6, and the remaining 115 would be ages 6 to 12.
Table 4-15 Children Eligible for Publicly Funded Day Care
Introduced by the Proposed Actions
Age Number of
Affordable Units Number of Children
Per Unit Total Children less than 6 years old 607 0.53 322 Children ages 6-12 607 0.19 115
Total Number of Children 437 Source: Updated CEQR Technical Manual Day Care Multipliers (Fall 2008).
Day care facilities in the 1-mile study area do not have adequate capacity for the new day care-eligible children under age 6 expected as a result of the RWCDS, and day care facilities in the 1-mile study area would be over capacity. As shown in Table 4-16, in the future with the proposed actions, the publicly funded day care facilities in the study area would operate over capacity (158 percent of capacity) unless additional slots are added to meet the increased demand in the community that would result from the proposed actions.
Table 4-16 Increased Demand for Publicly Funded Day Care Facilities—2019
Facility Capacity New
Demand Enrollment Available
Slots Utilization (Percent)
Existing Conditions 737 — 702 35 95 The Future without the Proposed Actions 737 143 845 -108 115 Future with the Proposed Actions 737 322 1,167 -430 158

Chapter 4: Community Facilities
4-17
The proposed actions would also introduce older children (ages 6 to 12) who would be eligible for publicly funded day care services. Because these children are expected to be attending school during most of the day, their need would be for after-school care. Eligible children who qualify for ACS vouchers or other programming for after school care could be served by family child care providers or school-age slots in the ACS contracted day care facilities, Department of Youth and Community Development (DYCD) Out-of-School Time programs, and/or NYCDOE-approved after school programs. According to CEQR Technical Manual guidelines, a significant adverse impact on publicly funded day care services may result if a proposed action would result in: (1) a demand for day care slots greater than remaining capacity of day care centers; and (2) demand that constitutes an increase of 5 percent or more of the collective capacity of the day care centers serving the study area. As shown in Table 4-16, the introduction of day care eligible children associated with the RWCDS would cause a 43.7 percent increase in demand over the existing capacity of day care facilities in the study area. Therefore, the proposed actions would result in a significant adverse impact on publicly funded day care facilities warranting consideration of mitigation.
This potential increase in demand could be offset by a number of factors. Private day care facilities and day care centers outside of the study area (e.g., closer to parent’s place of work) are not included in this analysis. Some of the increased day care demand would likely be offset by parents who choose to take their children to day care centers outside of the study area (e.g., closer to work). Some of the Family Day Care Networks serve children residing in the study area and could potentially absorb some of the demand. This new demand would also be considered in future Request for Proposal planning for contracted services. Finally, new capacity could potentially be developed as part of ACS’s public-private partnership initiatives. However, if none of these measures are taken, then the proposed actions would result in an unmitigated adverse day care impact (see Chapter 24, “Unavoidable Significant Adverse Impacts”).
F. HEALTH CARE FACILITIES According to the CEQR Technical Manual, an analysis of outpatient health care facilities is warranted if a project would result in more than 600 low- to moderate-income housing units. The proposed actions would introduce approximately 607 new low- to moderate-income units by 2019. While the CEQR Technical Manual indicates that there is no specific study area designated for health care resources, it suggests that such facilities be mapped within approximately a 1-mile radius from a project site.
In accordance with the methodologies of the CEQR Technical Manual, the assessment focuses on emergency and outpatient services, since these services could be most affected by the introduction of a large low- to moderate-income population, which could rely heavily on nearby hospital emergency rooms and other public outpatient services for health care. The focus of this analysis is on those facilities that accept public funds (usually in the form of Medicare and Medicaid reimbursements) that are available to any community member, and that could be most affected by the introduction of a large low- to moderate-income residential population. Inpatient hospital facilities and private medical offices and other similar resources are not evaluated.
Coney Island Rezoning
4-18
EXISTING CONDITIONS
HOSPITALS AND EMERGENCY ROOMS
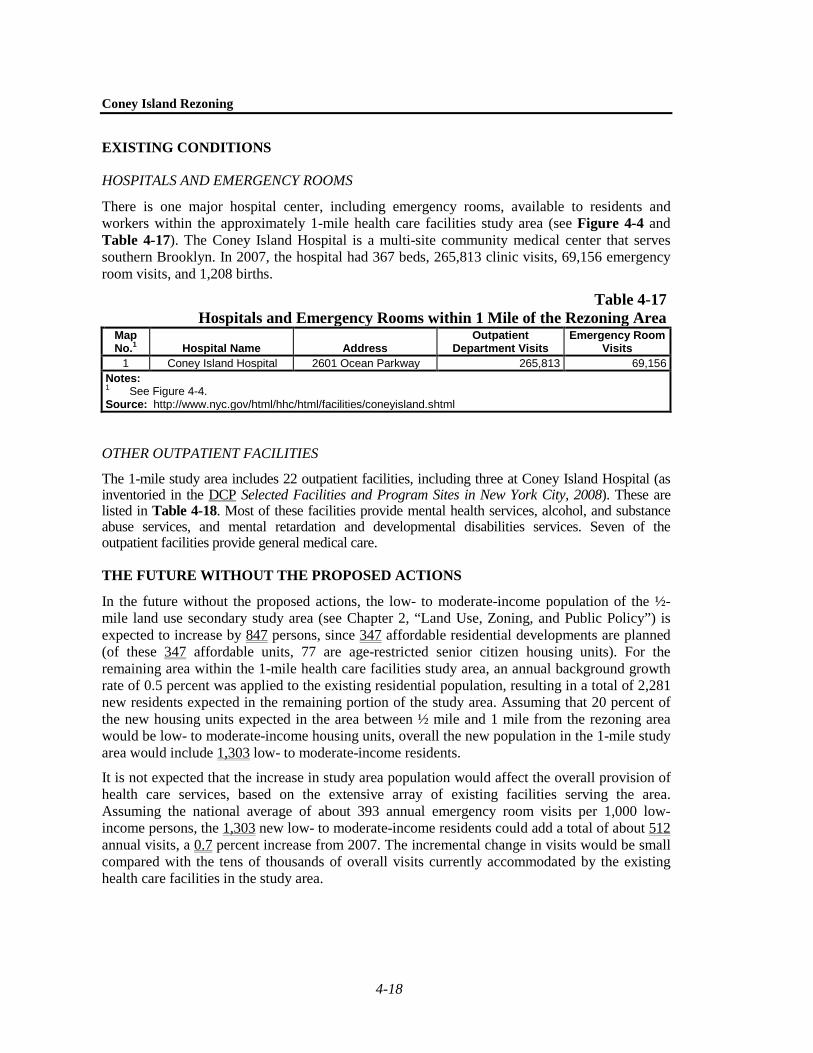
There is one major hospital center, including emergency rooms, available to residents and workers within the approximately 1-mile health care facilities study area (see Figure 4-4 and Table 4-17). The Coney Island Hospital is a multi-site community medical center that serves southern Brooklyn. In 2007, the hospital had 367 beds, 265,813 clinic visits, 69,156 emergency room visits, and 1,208 births.
Table 4-17 Hospitals and Emergency Rooms within 1 Mile of the Rezoning Area
Map No.1 Hospital Name Address
Outpatient Department Visits
Emergency Room Visits
1 Coney Island Hospital 2601 Ocean Parkway 265,813 69,156 Notes: 1 See Figure 4-4. Source: http://www.nyc.gov/html/hhc/html/facilities/coneyisland.shtml
OTHER OUTPATIENT FACILITIES
The 1-mile study area includes 22 outpatient facilities, including three at Coney Island Hospital (as inventoried in the DCP Selected Facilities and Program Sites in New York City, 2008). These are listed in Table 4-18. Most of these facilities provide mental health services, alcohol, and substance abuse services, and mental retardation and developmental disabilities services. Seven of the outpatient facilities provide general medical care.
THE FUTURE WITHOUT THE PROPOSED ACTIONS
In the future without the proposed actions, the low- to moderate-income population of the ½-mile land use secondary study area (see Chapter 2, “Land Use, Zoning, and Public Policy”) is expected to increase by 847 persons, since 347 affordable residential developments are planned (of these 347 affordable units, 77 are age-restricted senior citizen housing units). For the remaining area within the 1-mile health care facilities study area, an annual background growth rate of 0.5 percent was applied to the existing residential population, resulting in a total of 2,281 new residents expected in the remaining portion of the study area. Assuming that 20 percent of the new housing units expected in the area between ½ mile and 1 mile from the rezoning area would be low- to moderate-income housing units, overall the new population in the 1-mile study area would include 1,303 low- to moderate-income residents.
It is not expected that the increase in study area population would affect the overall provision of health care services, based on the extensive array of existing facilities serving the area. Assuming the national average of about 393 annual emergency room visits per 1,000 low-income persons, the 1,303 new low- to moderate-income residents could add a total of about 512 annual visits, a 0.7 percent increase from 2007. The incremental change in visits would be small compared with the tens of thousands of overall visits currently accommodated by the existing health care facilities in the study area.

ATLANTIC OCEAN
SCALE
0 2000 FEET
12.1
9.08
Hospitals and Health Care FacilitiesFigure 4-4CONEY ISLAND REZONING
N
1
11
21
2
12
22
3
13
23
4
14
5
15
6
16
7
17
8
18
9
19
10
20
Rezoning Area
West 25th Street Parking Site
Study Area Boundary (1-Mile Perimeter)
Hospitals and Health Care Facilities ( See Tables 4-17 and 4-18)1

Chapter 4: Community Facilities
4-19
PROBABLE IMPACTS OF THE PROPOSED ACTIONS
Following the guidance of the CEQR Technical Manual, a significant adverse impact on health care facilities can occur when a proposed action would result in an increase of 5 percent or more over the no action condition in the demand for services (e.g., number of visits) and when that demand would exceed capacity at affected facilities.
Table 4-18 Outpatient Health Care Facilities within 1 Mile of the Rezoning Area
Map No.1 Facility Name Address Facility Type
2 Ida G. Israel Community Health Center 2201-03 Neptune Ave. Hospital Affiliated Health Center 3 Victory Memorial Hospital at Brighton Beach
Family Health Center 3049 Brighton 6th St. Hospital Affiliated Health Center
4 Comprehensive Care Management D&TC, Inc.
1519 Mermaid Ave. Outpatient Health Center
5 Century Medical and Dental Center, Inc. 260 Avenue X Outpatient Health Center 6 Mermaid Health Center 1704-06 Mermaid Ave. Outpatient Health Center 7 Comprehensive Care Mgmt D&TC 2301-31 Stillwell Ave. Outpatient Health Center 8 Coney Island Hospital – CD OP Clinic 2201 Neptune Ave. Chemical Dependency 9 Bridge Back To Life Center Inc – CD OP 2857 West 8th St. Chemical Dependency
10 JBFCS Coney Island CSS CDT Program 3312-30 Surf Ave. Mental Health Facility 11 JBFCS Infants' Home Of Brooklyn 87 Bay 49th St. Mental Health Facility 12 Garden Of Eden Adult Home CDT 3312-30 Surf Ave. Mental Health Facility 13 JBFCS Coney Island CSS Clinic Program 3312-30 Surf Ave. Mental Health Facility 14 SBPC Coney Island/Sheepshead Bay Clinic 532 Neptune Ave. Mental Health Facility 15 FEGS Brooklyn Continuing Day Treatment
Program 3312-30 Surf Ave. Mental Health Facility
16 Coney Island Hospital Act II 2601 Ocean Parkway Mental Health Facility 17 Coney Island Hospital Act I 2601 Ocean Parkway Mental Health Facility 18 Coney Island Hospital Child And Adult
Outpatient Clinic Program 2601 Ocean Parkway Mental Health Facility
19 Block Institute 376 Bay 44th St. Mental Retardation and Developmental Disabilities
20 Goodwill Industries of Greater New York and Northern New Jersey, Inc.
2559-69 West 13th St. Mental Health Facility
21 Federation Employment and Guidance Service
3312-30 Surf Ave. Mental Retardation and Developmental Disabilities
22 Otsar 2302 West 13th St. Mental Retardation and Developmental Disabilities
23 Heavens Hands Community Services, Inc. 64 Avenue X Mental Retardation and Developmental Disabilities
Notes: 1 See Figure 4-4. Acronyms: CD – Chemical Dependency; CDT – Continuing Day Treatment; CSS – Community Support Services or
System; D&TC – Diagnostic & Treatment Center; FEGS -- Federation Employment and Guidance Service, Inc.; JBFCS – Jewish Board of Family and Children’s Services; OP – Out Patient; and SBPC – South Beach Psychiatric Center.
Source: http://www.nyc.gov/html/hhc/html/facilities/coneyisland.shtml
The proposed actions would introduce an estimated 1,481 new low- to moderate-income residents to the study area by 2019. Based on the national average of 393 annual emergency room visits per 1,000 low-income persons, the addition of approximately 1,481 low- to moderate-income residents could add an estimated 582 annual visits to study area emergency rooms. Given the tens of thousands of such visits in the study area currently, this additional low- to moderate-income population would generate a minimal change in demand over no action
Coney Island Rezoning
4-20
conditions (approximately 1 percent). Therefore, no significant adverse impacts to outpatient health care services are expected.
G. POLICE PROTECTION
METHODOLOGY
The CEQR Technical Manual recommends detailed analyses of impacts on police protection only in cases where a direct impact would occur to a police facility (i.e., a station house). For informational purposes, this section provides a description of existing police facilities that serve the rezoning area.
EXISTING CONDITIONS
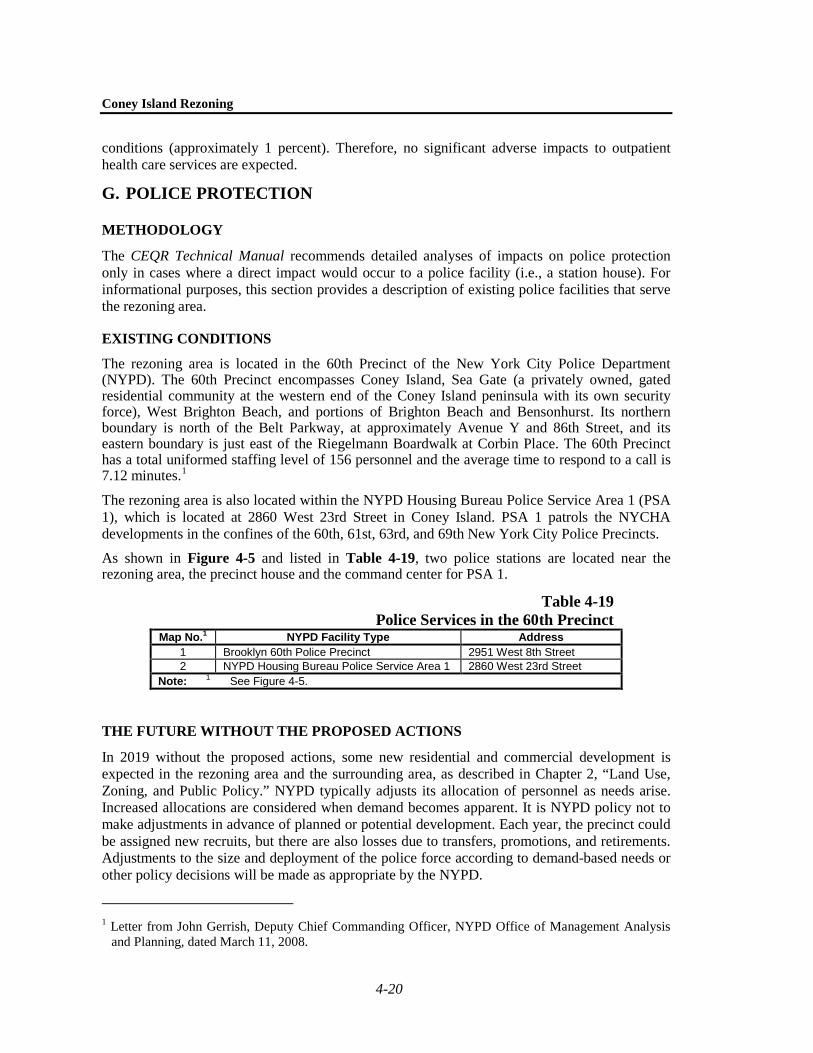
The rezoning area is located in the 60th Precinct of the New York City Police Department (NYPD). The 60th Precinct encompasses Coney Island, Sea Gate (a privately owned, gated residential community at the western end of the Coney Island peninsula with its own security force), West Brighton Beach, and portions of Brighton Beach and Bensonhurst. Its northern boundary is north of the Belt Parkway, at approximately Avenue Y and 86th Street, and its eastern boundary is just east of the Riegelmann Boardwalk at Corbin Place. The 60th Precinct has a total uniformed staffing level of 156 personnel and the average time to respond to a call is 7.12 minutes.1
The rezoning area is also located within the NYPD Housing Bureau Police Service Area 1 (PSA 1), which is located at 2860 West 23rd Street in Coney Island. PSA 1 patrols the NYCHA developments in the confines of the 60th, 61st, 63rd, and 69th New York City Police Precincts.
As shown in Figure 4-5 and listed in Table 4-19, two police stations are located near the rezoning area, the precinct house and the command center for PSA 1.
Table 4-19 Police Services in the 60th Precinct
Map No.1 NYPD Facility Type Address
1 Brooklyn 60th Police Precinct 2951 West 8th Street
2 NYPD Housing Bureau Police Service Area 1 2860 West 23rd Street Note: 1 See Figure 4-5.
THE FUTURE WITHOUT THE PROPOSED ACTIONS
In 2019 without the proposed actions, some new residential and commercial development is expected in the rezoning area and the surrounding area, as described in Chapter 2, “Land Use, Zoning, and Public Policy.” NYPD typically adjusts its allocation of personnel as needs arise. Increased allocations are considered when demand becomes apparent. It is NYPD policy not to make adjustments in advance of planned or potential development. Each year, the precinct could be assigned new recruits, but there are also losses due to transfers, promotions, and retirements. Adjustments to the size and deployment of the police force according to demand-based needs or other policy decisions will be made as appropriate by the NYPD.
1 Letter from John Gerrish, Deputy Chief Commanding Officer, NYPD Office of Management Analysis
and Planning, dated March 11, 2008.

MERMAID AVE.
W. 1
5TH
ST.
W. 1
6TH
ST.
W. 1
7TH
ST.
SURF AVE.
LEIF ERICSON DR.
NEPTUNE AVE.
RIEGELMANN BOARDWALK
NEPTUNE AVE.
W. 1
9TH
ST.
W. 2
0TH
ST.
W. 2
1ST
ST.
W. 2
2ND
ST.
W. 2
3RD
ST.
W. 2
4TH
ST.
W. 2
5TH
ST.
STIL
LWEL
L AV
E.
W. 2
7TH
ST.
W. 2
8TH
ST.
W. 2
9TH
ST.
W. 3
0TH
ST.
W. 3
1ST
ST.
W.3
2ND
ST.
BAY 52ND ST.
BAY 53RD ST.
BAY 54TH ST.
BAY 56TH ST.BA
Y VI
EW A
VE.
HART P
L.
U.S. PIERHEAD AND BULKHEAD LINEU.S. PIERHEAD AND BULKHEAD LINE CO
NEY ISLAN
D C
REEK
W. 2
0TH
ST.
W. 2
2ND
ST.
AVE. Z
LEON S. KAISER PLAYGROUND
ATLANTIC OCEAN
W. 1
9TH
ST.
SIX DIAMONDS PARK
KEYSPANPARK
SEASIDE PARK
W. 8
TH S
T.
CO
LBY
CT.
WEST AVE.W 6
TH S
T.
ATWATER CT.
OCE
AN P
ARKW
AY
OCEANVIEW AVE.
BRIGHTON BEACH AVE.
SHELL RD.
W 2ND PL.
W 5
TH S
T.
W 3
RD S
T.
W 2
ND S
T.
SEA BREEZE AVE.
W 1
2TH
ST.
SHEEPSHEAD BAY RD.
W. 3
6TH
ST.
W. 3
5TH
ST.
W. 3
3RD
ST.
BOWERY ST.
AVE. Z
1.10.09
Emergency ServicesFigure 4-5CONEY ISLAND REZONING
SCALE
0 1000 2000 FEET
N
6
Rezoning Area Boundary
West 25th Street Parking Site
Study Area Boundary (1/2-Mile Perimeter)
Police and Fire Services (See Tables 4-19 and 4-20)
5
1
4
2
3

Chapter 4: Community Facilities
4-21
PROBABLE IMPACTS OF THE PROPOSED ACTIONS
The proposed actions would not directly affect any NYPD facilities. By 2019, the new worker, residential, and visitor population associated with the proposed actions could increase the demand for police protection in the study area. NYPD would continue to evaluate its staffing needs and assign personnel based on a variety of factors, including demographics, calls for service, and crime conditions. Therefore, no significant adverse impacts to NYPD services or facilities are expected.
H. FIRE PROTECTION AND EMERGENCY SERVICES
METHODOLOGY
The CEQR Technical Manual recommends detailed analyses of impacts on fire protection only in cases where a direct impact would occur to a fire protection facility (i.e., firehouse). For informational purposes, this section provides a description of existing fire protection facilities and Emergency Medical Service (EMS) that serve the rezoning area. This discussion does not include private emergency medical response units that could provide services for the rezoning area or the surrounding study area.
EXISTING CONDITIONS
The New York City Fire Department (FDNY) provides fire protection with engine companies, which carry hoses; ladder companies, which provide search, rescue, and building ventilation functions; and rescue companies, which specifically respond to fires or emergencies in high-rise buildings. In addition, the FDNY operates the City’s EMS system.
The study area for fire protection services falls within the administrative and response district of FDNY’s Division 8 and Battalion 43. As shown in Figure 4-5 and Table 4-20, there are three Engine companies with Certified First Responder – Defibrillator capability and three Ladder companies that serve the study area. According to Patrick McNally, Chief of Operations for FDNY, the average response times for these companies is between 4 and 5 minutes.1
Table 4-20 Fire Protection Services
Map No.1 Unit Location Fire-fighters EMTs/ Paramedics
3 Engine 245 2929 West 8th Street 5 0 Ladder 161 5 0
4 Engine 318 2510 Neptune Avenue 4 3 EMT Ladder 166 5 1 EMT
5 Engine 246 2732 East 11th Street 4 1 EMT Ladder 169 5 0
Note: 1 See Figure 4-5. Sources: Letter from Salvatore J Cassano, FDNY Chief of Department, Office of the Chief of Department,
dated 2/8/08; and letter from Patrick McNally, FDNY Chief of Operations, Bureau of Operations, dated 5/6/08.
The EMS units that serve the rezoning area operate from EMS Station 43, which is located at Coney Island Hospital. According to the FDNY, this station is currently overcrowded, but there
1 Letter from Patrick McNally, Chief of Operations, FDNY, dated May 6, 2008.

Coney Island Rezoning
4-22
are presently no plans for modification and/or relocation of the facility.1
FDNY currently provides additional EMS resources to the Coney Island area during the period of May 31 to September 3, as call volume and traffic density historically increase during the summer season.
During 2007 the ambulance response times for life-threatening assignments for the rezoning area were 5 minutes 45 seconds, approximately 1 minute better than the City-wide average.
THE FUTURE WITHOUT THE PROPOSED ACTIONS
Like NYPD, FDNY does not allocate personnel based on planned development, but responds to demonstrated need. FDNY has no immediate plans to make any changes in stations or equipment in the area. In the future without the proposed actions, FDNY will continue to evaluate the need for personnel and equipment and make necessary adjustments to adequately serve the area.
FDNY expects further reduction in ambulance response times with the City’s implementation of an automatic vehicle location (AVL) system in all ambulances and FDNY apparatus (all FDNY ambulances were outfitted with AVL by the end of 2006). AVL provides real-time updates on unit locations, which allows for more efficient dispatching.
PROBABLE IMPACTS OF THE PROPOSED ACTIONS
The proposed actions would not result in the direct displacement of any FDNY facilities and therefore would not result in significant adverse impacts to fire protection and emergency services. According to a letter from FDNY dated May 6, 2008, FDNY would have no problem in supporting the expected new development. In the future with the proposed actions, FDNY would evaluate the need for personnel and equipment and make necessary adjustments to adequately serve the area.
The FDNY has noted that the new residential units and increased visitor population resulting from the proposed actions would likely increase the call volume for both life-threatening emergencies and non-life threatening assignments, particularly during the summer months. In addition, the FDNY noted that increased traffic and pedestrian flow could affect the ability of EMS ambulance units to respond quickly through traffic. Therefore, the FDNY anticipates that allocation of additional EMS tours and fire resources may be necessary.2
However, FDNY response times are not expected to be significantly affected by the projected increases in traffic generated by the proposed actions. Access to and from the study area’s FDNY facilities would not be directly affected by the RWCDS. Further, FDNY and emergency service vehicles can maneuver around and through congested areas, because they are not bound by standard traffic controls. Response times have decreased citywide and are expected to decrease further despite the increasingly congested traffic conditions in many areas of the City. Service to surrounding areas would continue to be provided by FDNY facilities that have a broad geographic distribution. Therefore, incremental traffic volumes projected to occur with the proposed actions are not expected to significantly affect FDNY response times.
1 Letter from Salvatore J. Cassano, FDNY Chief of Department, dated February 8, 2008. 2 Letter from Salvatore J Cassano, FDNY Chief of Department, Office of the Chief of Department, dated
2/8/08

Chapter 4: Community Facilities
4-23
I. CONCLUSIONS The increase in residents, workers, and visitors to the rezoning area as a result of the RWCDS would increase demands on community facilities serving the area. Other than day care facilities, these increases would not result in significant adverse impacts. The conclusions of the analyses are as follows:
• Public Schools: Although elementary schools serving the ½-mile study area would be 5 percent over capacity with the new students generated by the proposed actions, there is adequate capacity in CSD 21 as a whole to serve the new students. Further, this analysis conservatively includes the entire projected residential increment (115 units) of the Brighton Beach Rezoning in the future without the proposed actions, although none of the Brighton Beach Rezoning projected development sites fall within the ½-mile study area for the proposed actions and children generated by development of those sites would likely go to PS 225 and PS 253, elementary schools that serve the Brighton Beach neighborhood. Intermediate schools serving the ½-mile study area have adequate capacity to serve the new students. Therefore, no significant adverse impacts on public elementary or intermediate schools would occur as a result of the proposed actions. The new high school students introduced also would not adversely affect high schools serving Brooklyn.
• Libraries: The new population associated with the RWCDS would increase demand on the Coney Island Branch and Brighton Beach Branch of the Brooklyn Public Library. However, residents of the study area, like all Brooklyn residents, will have access to all circulating volumes within the entire Brooklyn Public Library system and, therefore, the increase in population would not impair library services and no significant adverse impact would occur.
• Day Care Facilities: The introduction of day care eligible children associated with the affordable housing units included in the RWCDS would bring the day care facilities in the study area above their capacity. In addition, the increase in demand resulting from the proposed actions (322 children under age 6) would constitute an increase of 43.7 percent over the existing capacity of day care facilities in the study area. Therefore, the proposed actions would result in a significant adverse impact on publicly funded day care facilities warranting mitigation.
• Health Care Facilities: The residents of the affordable housing units introduced by the proposed actions may increase demand on emergency rooms and outpatient health care services. However, given the tens of thousands of such visits in the study area currently, this additional low- to moderate-income population would generate a minimal change in demand over no action conditions (approximately 1 percent). Therefore, no significant adverse impacts to outpatient health care services are expected.
• Police and Fire Protection: The proposed actions would not affect the physical operations of, or access to and from, a fire station or police precinct house, and therefore the proposed actions would not have a significant adverse impact on police and fire services. It is the practice of the Police and Fire Departments to conduct ongoing evaluations of the need for personnel and equipment and make necessary adjustments to adequately serve the area. The FDNY has indicated that it would have no problem in supporting the expected development, but that the new residential units and increased visitor population resulting from the proposed actions would likely require allocation of additional EMS tours and fire resources.