chapter 4 experimental investigations on self...
TRANSCRIPT

54
CHAPTER 4
EXPERIMENTAL INVESTIGATIONS ON SELF COMPACTING CONCRETE
4.0 GENERAL
In this chapter, the mechanical behaviour of Fibre Reinforced
Self-Compacting Concrete Wall Panels of M30 grade made with Steel
Fibres, Glass Fibres and Hybrid Fibres with a mixture of glass and
steel fibres is examined. For this, experimental investigations were
carried out on the fresh and hardened properties of fibre reinforced
self compacting concrete of M30 grade. Then wall panels were cast
and investigations were conducted to study the behaviour of wall
panels of plain SCC, Steel Fibre Reinforced SCC (SFRSCC), Glass
Fibre Reinforced SCC (GFRSCC) and Hybrid Fibre Reinforced SCC
(HFRSCC) under Axial and Eccentric Loads. The experimental
programme was taken up in various steps to achieve the following
objectives:
1. to develop plain SCC of M30 grade and obtain its fresh and
hardened properties.
2. to develop Steel and Glass Fibre Reinforced SCC of M30 grade
separately and study their fresh and hardened properties.
3. to develop Hybrid Fibre Reinforced SCC with a combination of
glass and steel fibres and study its fresh and hardened
properties.
4. to study the Stress–Strain behaviour of SCC, SFRSCC,
GFRSCC and HFRSCC and develop mathematical models.
55
5. to study the behaviour of wall panels cast with plain SCC,
GFRSCC, SFRSCC and HFRSCC under axial and eccentric
loads.
4.1 Materials
4.1.1 Cement
Ordinary Portland cement of 53 grade available in the local
market was used in the present investigations. Tests were conducted
to establish various properties in accordance with IS: 4031–1988 and
found to conform to IS: 12269–1987.
4.1.2 Coarse Aggregate
Crushed angular granite available from a local market was used
in the investigations. The aggregate was tested as per IS: 2386–1963
and found to be conforming to the specifications.
4.1.3 Fine Aggregate
River sand available in the local market was used as fine
aggregate. The fine aggregate was tested for its properties as per IS:
2386–1963 and found to be conforming to specifications.
4.1.4 Fly Ash
Fly ash from a thermal power station in Andhra Pradesh was
used in the investigations. The physical and chemical properties of the
fly ash as used in the investigations conform to grade I fly ash of IS
3812–2003.

56
4.1.5 Super Plasticizer
Super plasticizer with Sulphonated Naphthalene based
Formaldehyde (SNF) conforming to IS: 9103–1999 was used in the
present investigations.
4.1.6 Viscosity Modifying Admixture (VMA)
Viscosity modifying agent from a standard agency conforming to
standard specifications was also used.
4.1.7 Water
Potable water conforming to IS: 3025–1986 part 22 & 23 and IS:
456–2000 was used in the investigations.
4.1.8 Glass Fibres
Anti Crack High Dispersion Fibres having a Modulus of
Elasticity (E) of 72 GPa and 857 Aspect Ratio were used.
Fig. 4.1.1: Glass Fibres
4.1.9 Steel Fibres
Plain steel fibres of 0.4 mm dia and Aspect Ratio of 30, cut from
steel wire were used in the investigations.
Fig. 4.1.2: Steel Fibres

57
4.2. PHASE I: DEVELOPMENT OF PLAIN SCC AND INVESTIGATIONS ON ITS FRESH AND HARDENED PROPERTIES In this phase of investigations, M30 grade SCC mix is developed
using mineral and chemical admixtures to study its fresh and
hardened properties. For developing SCC of M30 grade, the mix
proportions were designed based on the method suggested by Nan-Su
et al(2001) and SV Rao et. Al(2010) using fly ash as mineral admixture
and chemical admixtures like Super Plasticizers (SP) and Viscosity
Modifying Agents (VMA). Finally, SCC mixes which have given required
compressive strength with satisfactory fresh properties were taken for
the next phase of investigations. This is explained in detail as given
below.
4.2.1 Mix Design and Trial Mix Proportions of Self Compacting Concrete An SCC mix of M30 standard grade was aimed and the initial
mix proportion was obtained using the mix design methods as
mentioned above. The mix proportion thus obtained was fine-tuned by
incorporating different guidelines available and making various trial
mixes to obtain the mix which satisfies the required fresh and
hardened properties. The detailed mix design calculations are given in
Appendix I. The final mass of ingredients for 1m3 of SCC are as
follows:
Mass of Cement = 330.0 kg
Mass of filler (Fly Ash) = 150.0 kg
Mass of water = 186.0 kg

58
Mass of Coarse Aggregate (CA) = 794.4 kg
Mass of Fine Aggregate(FA) = 860.6 kg
Super plasticizer dosage = 1.5% by weight of cement (bwc)
VMA dosage = 0.6% by weight of cement (bwc)
4.2.2 Mixing of Ingredients
The mixing of ingredients was carried out in a power operated
pan type concrete mixer. Initially coarse aggregate, fine aggregate,
cement and fly ash were put in the pan mixer and mixed in the dry
state for a few seconds. Then Superplasticizer (SP) was added to the
water, thoroughly mixed and added to the material in the concrete
mixer. The required amount of VMA was added and further mixed till
a mix of required uniform consistency was achieved.
To obtain the Glass Fibre Reinforced SCC, anti-crack high
dispersion glass fibre dosage was added to the already developed mix,
maintaining the fresh SCC requirements. Similarly, Steel Fibre
Reinforced SCC was made by adding suitable dosage of steel fibres
Fig. 4.2.1: Pan Mixer Fig. 4.2.2: Developed SCC Mix
maintaining the fresh SCC requirements. The Hybrid Fibre Reinforced
SCC was prepared by adding glass and steel fibres in different
proportions till fresh SCC properties were satisfied.

59
4.2.3 Methods of Evaluation of Workability of SCC
Workability test methods available for conventional concrete
mixes are not adequate for evaluation of workability of Self-
Compacting Concrete mixes as they are not sensitive to ascertain all
the requirements of Self-Compacting Concrete mixes. Different test
methodologies were developed to characterize the fresh properties of
SCC mixes. No single method was available till date, to assess relevant
workability requirements. Hence, the SCC mixes have to be tested
using more than one test for measuring different workability
parameters. The following are the test methods available to
characterize the desired workability requirements and for the
finalization of fresh Self-Compacting Concrete mixes.
4.2.3.1 Slump Flow Test and T 50 cm Test
The slump flow test is used to ascertain the free flow of Self
Compacting Concrete without obstructions.
Fig. 4.2.3: Slump Flow Test
� About six litres of SCC is required to perform this test.
� First moisten the base plate and the inside surface of slump
cone. Place base plate on level stable ground and the slump
cone centrally on the base plate and hold down firmly.
60
� Fill the slump cone with SCC using a scoop. Do not tamp the
concrete. Strike off the concrete surface with the top level of the
cone with a trowel.
� Any surplus concrete in and around the base of the slump cone
has to be removed.
� Lift the cone vertically and allow the SCC to flow freely.
� Start the stopwatch simultaneously, and record the time taken
for concrete to spread upto the 500mm circle marked. (This is
called T50 cm test).
� Afterwards, measure the final diameter of the concrete spread in
two or more perpendicular directions.
� Then calculate the average of the measured diameters which is
termed as the slump flow.
Interpretation of the results:
Higher slump flow value indicates greater ability to fill the
formwork under its own weight. A minimum value of 650mm is
recommended for SCC. The T50 time is also an indication of SCC flow.
A lower time means greater flowability. The research suggested a time
range of 3-7 seconds for general civil engineering applications and 2-5
seconds for general housing applications (T.Suresh Babu,2008).

61
4.2.3.2 V-Funnel Test
This test is performed to determine the filling ability (flowability)
of the Self-Compacting Concrete.
Fig. 4.2.4: V-Funnel Test
Procedure for V-Funnel Test :
� Take about 12 litres of concrete to perform this test.
� Keep the V-funnel on level ground.
� Moist the inside surface of the V-funnel
� Open the trap door to drain out any surplus water.
� Now close the trap door and keep a bucket underneath the V-
funnel.
� Now fill the V-funnel apparatus completely with the SCC
without any compaction or tamping. Then strike off the excess
concrete and level the top with the help of a trowel.
� Open the trap door within 10 seconds after filling the funnel.
� Now allow the concrete to flow out of the funnel under gravity.
� Start a stopwatch immediately after the trap door of the funnel
is opened. Record the flow time taken for the concrete to
62
discharge completely from the funnel. This is recorded when
light is seen from the top through the funnel.
� The test is to be completed within 5 minutes time.
4.2.3.2.1 Procedure for flow time at T5 minutes
� Take the same setup as above of V-Funnel test and do not clean
the inside of the funnel again.
� Close the trap door and fill the V-Funnel apparatus completely
with concrete, again without compaction. Strike off the excess
concrete on top and level the top surface with a trowel.
� Place a tub underneath the funnel.
� Open the funnel door after 5 minutes after the filling of the
funnel the second time and allow the concrete to flow freely
under gravity.
� Start the stopwatch simultaneously when the door is opened,
and record the time taken for the concrete to completely come
out. This is the flow time at T5 minutes. This time is to be
recorded when the light is seen from the top of the funnel.
Interpretation of results:
The above test measures the ease of flow of the SCC; shorter
flow times indicate greater flow ability. For SCC, 10 seconds flow time
is considered appropriate. Five minutes after settling, segregation of
concrete indicates a lesser flow with an increase in the flow time.
4.2.3.3 L Box Test
The test is for assessing the flow of the SCC and the blocking
resistance.
63
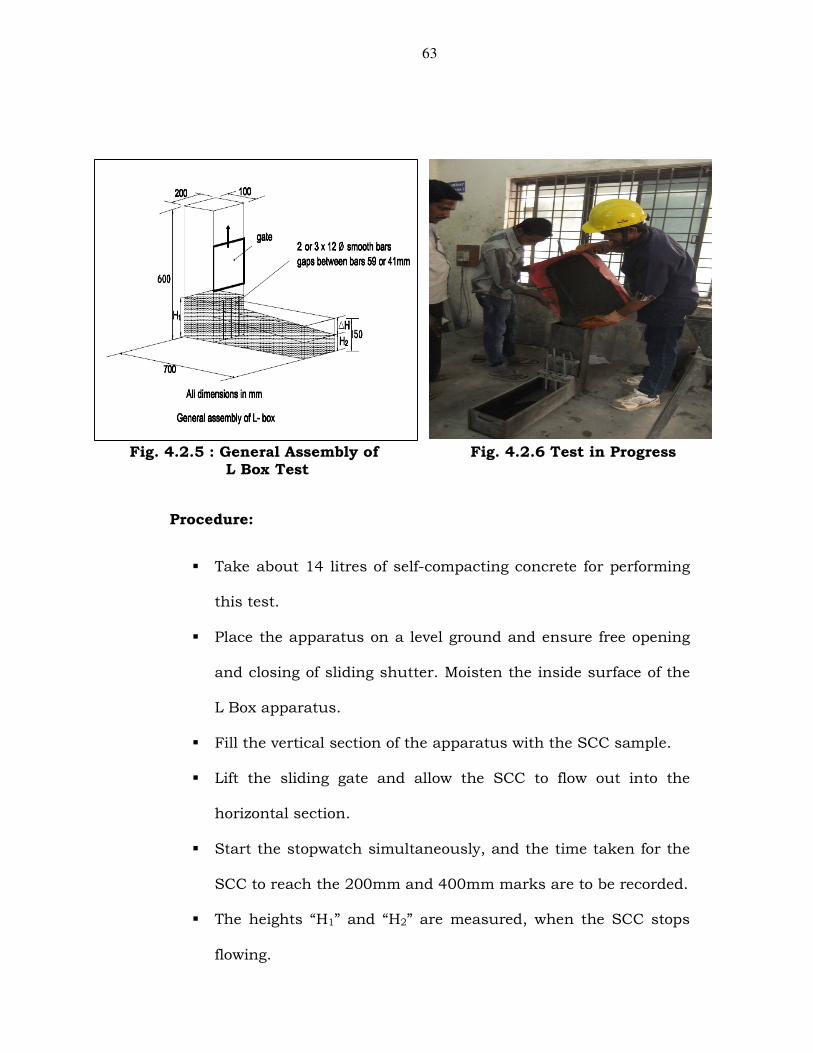
Fig. 4.2.5 : General Assembly of Fig. 4.2.6 Test in Progress L Box Test
Procedure:
� Take about 14 litres of self-compacting concrete for performing
this test.
� Place the apparatus on a level ground and ensure free opening
and closing of sliding shutter. Moisten the inside surface of the
L Box apparatus.
� Fill the vertical section of the apparatus with the SCC sample.
� Lift the sliding gate and allow the SCC to flow out into the
horizontal section.
� Start the stopwatch simultaneously, and the time taken for the
SCC to reach the 200mm and 400mm marks are to be recorded.
� The heights “H1” and “H2” are measured, when the SCC stops
flowing.

64
� Calculate the ratio H2/H1, which is the blocking ratio.
� The complete test is to be performed within a time of 5 minutes.
Interpretation of results:
If the concrete flows freely without any resistance, H2/H1 will be
unity. Therefore the nearer the ‘blocking ratio’ to unity, the better the
flow of the SCC. The European Guidelines[84] suggests a minimum
value of 0.8.
4.2.3.4 Testing of SCC in Fresh State
The SCC mix in fresh state was tested to get fresh properties
like filling ability, passing ability and segregation resistance by
performing Slump cone, V-funnel, and L-box tests as explained above.
4.2.4 Casting of Specimens
After satisfying the requirements of SCC in fresh state, the mix
was placed in moulds and allowed to flow and settle by itself. Any
excess SCC on the top of the moulds was removed with a trowel.
Fig. 4.2.7: Casting of SCC Cubes

65
4.2.5 Curing of SCC Specimens
The SCC specimens were kept undisturbed at room temperature
for 24 hours after casting. Then the specimens were removed from the
moulds and transferred to curing ponds containing fresh potable
water as shown below.
Fig. 4.2.8: Curing pond
4.2.6 Testing of Hardened SCC
A proper time schedule for testing of hardened SCC specimens
was maintained in order to ensure proper testing on the due date. The
specimens were tested using standard testing procedures as per
IS : 516 – 1959.
4.2.6.1 Compression Test
After the required curing period, the SCC cubes were taken out
of the curing tanks and the moisture was wiped off to make the
surface dry. They were placed in the Compression Testing Machine
(CTM) in such a way that the face perpendicular to the direction of
pouring of SCC mix was on the bearing surfaces and the load was
66
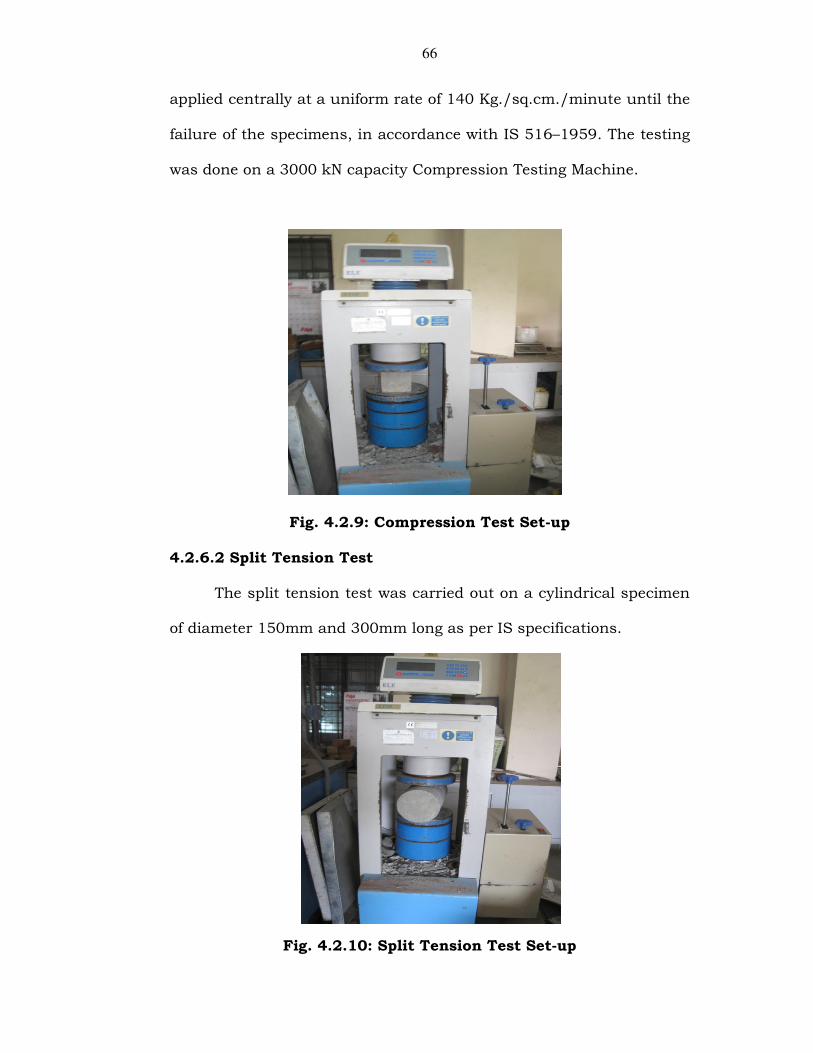
applied centrally at a uniform rate of 140 Kg./sq.cm./minute until the
failure of the specimens, in accordance with IS 516–1959. The testing
was done on a 3000 kN capacity Compression Testing Machine.
Fig. 4.2.9: Compression Test Set-up
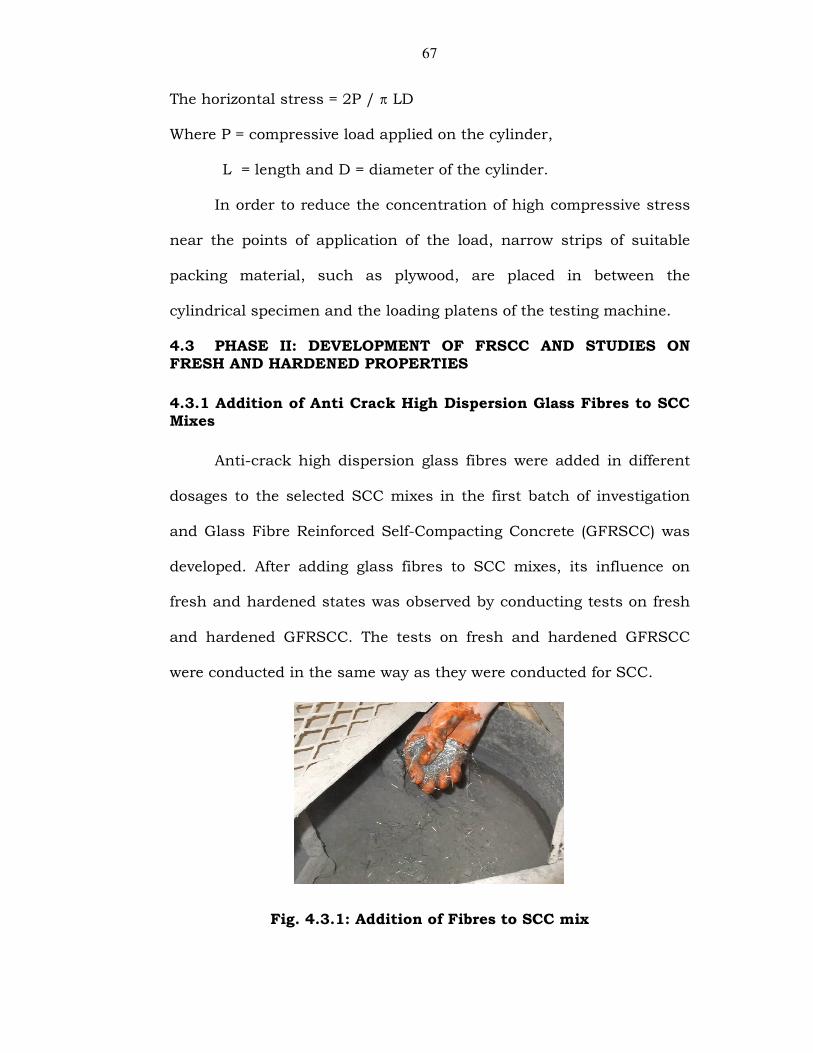
4.2.6.2 Split Tension Test
The split tension test was carried out on a cylindrical specimen
of diameter 150mm and 300mm long as per IS specifications.
Fig. 4.2.10: Split Tension Test Set-up
67
The horizontal stress = 2P / ̟ LD
Where P = compressive load applied on the cylinder,
L = length and D = diameter of the cylinder.
In order to reduce the concentration of high compressive stress
near the points of application of the load, narrow strips of suitable
packing material, such as plywood, are placed in between the
cylindrical specimen and the loading platens of the testing machine.
4.3 PHASE II: DEVELOPMENT OF FRSCC AND STUDIES ON FRESH AND HARDENED PROPERTIES
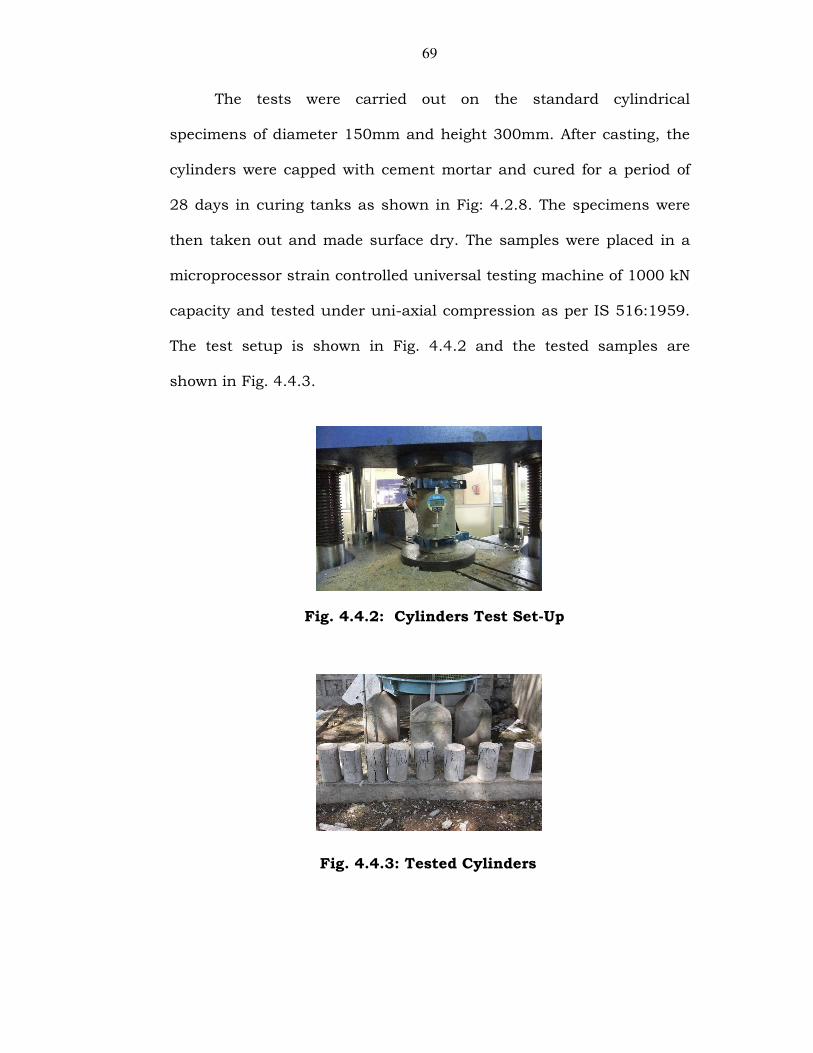
4.3.1 Addition of Anti Crack High Dispersion Glass Fibres to SCC Mixes
Anti-crack high dispersion glass fibres were added in different
dosages to the selected SCC mixes in the first batch of investigation
and Glass Fibre Reinforced Self-Compacting Concrete (GFRSCC) was
developed. After adding glass fibres to SCC mixes, its influence on
fresh and hardened states was observed by conducting tests on fresh
and hardened GFRSCC. The tests on fresh and hardened GFRSCC
were conducted in the same way as they were conducted for SCC.
Fig. 4.3.1: Addition of Fibres to SCC mix

68
4.3.2 Development of Steel Fibre Reinforced Self-Compacting Concrete and Hybrid Fibre Reinforced Self-Compacting Concrete Mix Proportions
The GFRSCC mix with an optimum dosage of glass fibres,
satisfying the fresh and the hardened properties, was considered for
the next phase of investigation. Similarly, the dosages of steel fibres in
Steel Fibre Reinforced Self-Compacting Concrete (SFRSCC) with a
fixed aspect ratio and Hybrid Fibre Reinforced Self-Compacting
Concrete (HFRSCC) consisting of a mixture of glass and steel fibres,
were developed by trial mixes. The ratio of steel fibres to glass fibres
was determined in the laboratory by trial mixes satisfying the fresh
and the hardened properties.
4.4 PHASE III: STUDIES ON STRESS- STRAIN BEHAVIOUR OF SCC AND FIBRE REINFORCED SCC MIXES IN UNCONFINED AND CONFINED STATES
In this phase of investigations, the stress-stain behavior of SCC
and FRSCC were taken up. The stress-strain behaviour was studied
for the SCC and FRSCC mixes in unconfined and confined states. The
confinement was given in the form of steel hoops in the cylinders, 3
hoops (0.798%), 4 hoops (1.062%), 5 hoops (1.327%) and 6 hoops
(1.591%) as shown in Fig 4.4.1 (a) and (b).
Fig. 4.4.1 a: Steel Hoops Fig. 4.4.1 b
69
The tests were carried out on the standard cylindrical
specimens of diameter 150mm and height 300mm. After casting, the
cylinders were capped with cement mortar and cured for a period of
28 days in curing tanks as shown in Fig: 4.2.8. The specimens were
then taken out and made surface dry. The samples were placed in a
microprocessor strain controlled universal testing machine of 1000 kN
capacity and tested under uni-axial compression as per IS 516:1959.
The test setup is shown in Fig. 4.4.2 and the tested samples are
shown in Fig. 4.4.3.
Fig. 4.4.2: Cylinders Test Set-Up
Fig. 4.4.3: Tested Cylinders

70
The stress–strain behaviour as obtained was plotted. The values
of secant modulus, initial tangent modulus, plasticity indices and
ductility factors for different SCC and FRSCC mixes were determined
from the stress-strain curves.
After determining the stress-strain behaviour of SCC and
FRSCC, empirical equations were developed based on the relevant
simplified models proposed by (1) Derivated Saenz model based on
Madrid parabola as adopted by the European Concrete Committee,
(2) Modified Saenz model(1964), and (3) model of Mansur et al(1997).
to present uni-axial stress-strain behaviour of SCC and FRSCC mixes
and these models were compared with experimental stress-strain
behaviour.

71
Fig 4.4.4 Cylinder without Confinement
Fig 4.4.5: Cylinders with different Confinements

73
4.4.2 Non-Dimensional Stress-Strain Curves
A general examination of the stress-strain behaviour of SCC
indicates that the behaviour is almost similar for all the SCC mixes
with and without fibres. The only difference that is observed is that
the FRSCC mixes have shown higher stress values for the same strain
levels compared to those of plain SCC mixes. This leads to the
conclusion that the stress-strain curve as a unique shape, if
expressed in non-dimensional form. This can be obtained by dividing
the stress at different levels by peak stress and the strain at different
levels by strain at peak stress. Thus the stress-strain curves have the
same point (1,1) at the peak stress. By the non- dimensionalisation of
the stresses and strains, the behaviour can be generalized.
The stress- strain data obtained experimentally for SCC and
FRSCC mixes were normalized as explained above and normalized
stress-strains values were calculated for different SCC and FRSCC
mixes in unconfined and confined states.
4.5 PHASE IV: STUDIES ON FRSCC WALL PANELS
In this phase of investigations, the studies were extended to
investigate the behaviour of Fiber Reinforced wall panels of size
1500mm × 1000mm × 75mm thick made with plain SCC, GFRSCC,
SFRSCC and HFRSCC. Standard moulds were prepared for casting
the above panels maintaining exact dimensions as shown in Fig.4.5.1

74
Fig. 4.5.1 Casting Frame of FRSCC Wall Panels
The panels were cast with pouring concrete with horizontal spread.
They are provided with single grid of 6mm mild steel bars at the centre
of the specimen to maintain a minimum of 0.12% of steel as per IS:
456:2000 specifications as shown in Fig.4.5.2.
Fig. 4.5.2 Reinforcement Details in FRSCC Wall Panels

75
The samples cast were cured as per BIS specifications and tested for
load carrying capacities under axial load and minimum eccentric load
with a minimum eccentricity of t/6 i.e 12.5mm. The test setup is
shown in Fig. 4.5.3.
Fig. 4.5.3 Experimental Test Set-up for FRSCC Wall Panels
76
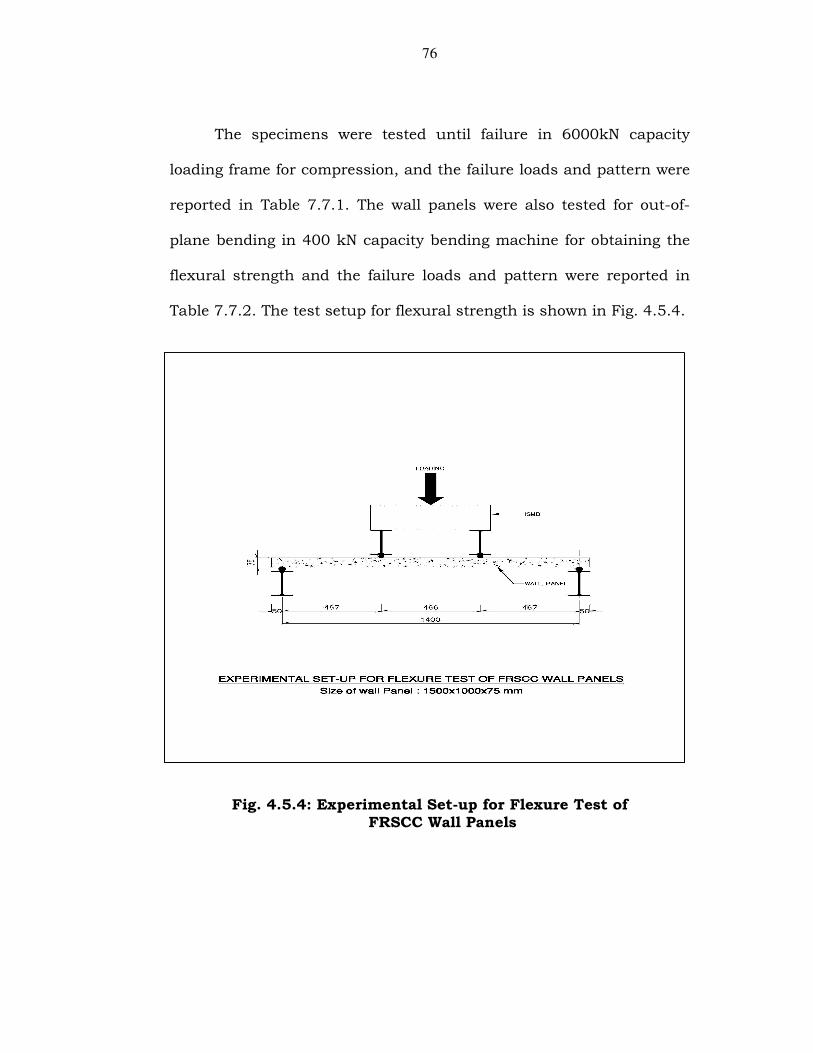
The specimens were tested until failure in 6000kN capacity
loading frame for compression, and the failure loads and pattern were
reported in Table 7.7.1. The wall panels were also tested for out-of-
plane bending in 400 kN capacity bending machine for obtaining the
flexural strength and the failure loads and pattern were reported in
Table 7.7.2. The test setup for flexural strength is shown in Fig. 4.5.4.
Fig. 4.5.4: Experimental Set-up for Flexure Test of FRSCC Wall Panels

72
4.4.1 MATHEMATICAL MODELING FOR STRESS-STRAIN BEHAVIOUR OF SCC AND FRSCC
After obtaining the stress-strain behaviour of SCC and FRSCC
mixes experimentally, an attempt was made to get the analytical
stress-strain curves for SCC and FRSCC mixes.
A good number of empirical equations were proposed to
represent stress-strain behaviour of conventional concrete. Most of the
equations can be used for the ascending portion of the curve only. In
1997 Mansur et al. have adopted Carriera and Chu(1985) model,
which was based on the model proposed by Popovics(1973). As such,
model proposed by Mansur et al includes both ascending and
descending portions of the stress-strain curve for the confined
concrete with introduction of two constants for the desending portion
of the curve. Several researchers proposed various empirical equations
for stress-strain behaviour as briefly reported in the previous chapter.
Most of the equations proposed are for conventional concrete
with or without fibres, but limited literature is available on the
mathematical modeling of stress-strain behaviour of SCC and FRSCC.
An attempt has been made in this study to develop mathematical
models for SCC and FRSCC mixes of GFRSCC,SFRSCC and HFRSCC
in unconfined and confined states.

77
The test results obtained for the load carrying capacities of
different types of wall panels were validated using the principles of
structural mechanics. The procedure adopted for validation of the
results is shown in Annexure II. Using the experimental values,
principles of structural mechanics and model analysis, the load
carrying capacities of prototype wall panels of 3000mm ×1000mm ×
150mm thick, and 3000mm × 1000mm × 200mm thick, are arrived at.
The two thicknesses of 150mm and 200mm are based on different
applications and codal provisions. The analysis part of arriving at
prototype load is shown in Annexure II.