chapter 4 study area chennai metropolitan area...
TRANSCRIPT

60
CHAPTER 4
STUDY AREA
CHENNAI METROPOLITAN AREA (CMA)
In this Chapter, a general profile of Chennai Metropolitan Area in terms of
geographical location, population growth, its characteristics, physical form of
development, land use, and infrastructure available have been focused, after
making a study of the Second Master plan for CMA prepared by the Chennai
Metropolitan Development Authority (CMDA) which is the nodal planning
body in CMA.
Map 4.1 Location of Tamil Nadu in India
4.1 TAMIL NADU
Tamil Nadu lies in the southernmost part of the Indian Peninsula and is
bordered by the union territory of Puducherry, and the states of Kerala,
Karnataka, and Andhra Pradesh. It is bound by the Eastern Ghats in the north,
the Nilgiri, the Anamalai Hills, and Kerala on the west, by the Bay of Bengal

61
in the east, the Gulf of Mannar, the Palk Strait in the south east, and by the
Indian Ocean in the south. Map 4.1 shows the location of Tamil Nadu in India.
Tamil Nadu is the eleventh largest state in India by area and the seventh
most populous state. It is the second largest state economy in India as of 2012.
The state ranked 6th among states in India according to the Human
Development Index as of 2011. Tamil Nadu is one of the most urbanized
states in India with 48.3% of its population living in urban areas. (Wikipedia)
4.1.1 Urbanization in Tamil Nadu
Tamil Nadu state has experienced unique changes in its urban scenario during
the last census decade of 1991-2001. 363 towns have been added to the
existing urban settlements at the 2001 census. Thus, this state recorded the
highest percentage of urban population in 2001 (44% as compared to 28% at
the national level). The number of towns in Tamil Nadu from 469 in 1991 to
832 in 2001, which is unprecedented in any state. Due to this development, the
lower order settlements (that is Class IV to Class VI) experienced a spurt in
their contribution to total urban population.
Together, this class (that is class IV to VI) contributed only 7.64% in
1991, which increased to 19.8% of the total population in 2001. Though this
has been triggered by political and administrative decisions of upgrading the
civic status of many village panchayats to town panchayats and municipalities
(especially after the post-74th Constitutional Amendment Act period), it has
serious spatial, functional, financial and social implications. Some of these
issues have been captured by Sebastian Oliveau in his paper titled “Peri
Urbanization in Tamil Nadu: a quantitative approach”. Starting with ‘distance
from the urban centre’ as an important variable, Oliveau attempts to identify
the influence zone of the various population size class urban centres on their
periphery. By using multiple factors such as size, economic base, the extent of
modernization, civic status, and distance from road and rail head, Oliveau

concludes
and near
surroundi
settlemen
substantia
concerned
Table 4.1
In
Coimbato
State in 2
inhabitan
This pol
morpholo
in Tamil
June 201
challenge
of rural
percentag
s that the l
rness to ro
ing villag
nts with pu
al implicat
d.
1 Urbaniza
Tamil Nad
ore togethe
2001. Of t
nts) accoun
arization o
ogy of the s
Nadu from
13, a rapi
es going by
to urban
ge terms at
larger popu
oad and ra
ges more
urely agricu
tions for T
ation in Tam
du, the thre
er accommo
this Chenn
nted for 23
of populat
surroundin
m 1971 to 2
dly urban
y the indica
populatio
51.6 in vil
ulation size
ail head m
than sett
ulture or in
Tamil Nadu
mil Nadu f
ee metropo
odated 33.
nai urban a
3.6% of th
tion has i
ng urban sp
2001. Acco
izing Tam
ators in the
on has ne
llages and
e, service s
makes the
lements w
ndustrial ba
u as far as
from 1971 t
olitan centr
3% of the
agglomerat
he total urb
its spillov
pace. Table
ording to a
mil Nadu
e 2011 cens
early reach
48.4 in citi
sector base
urban cen
with less
ase. These
s the settle
to 2001
res of Chen
total urban
tion alone
ban popula
ver effect
e 4.1 depict
report in T
faces soci
sus abstrac
hed parity
ies.
e, municipa
ntre influe
population
findings w
ement stru
nnai, Madu
n populatio
(with 6.4
ation of th
and chan
ts the urban
The Hindu
ial and ec
ct report. T
y and sta
62
al status
ence its
n, and,
will have
ucture is
urai and
on of the
million
he state.
ges the
nization
dated 1
conomic
The ratio
ands, in

63
4.2 ABOUT CHENNAI METROPOLITAN AREA (CMA)
Chennai is the capital of Tamil Nadu. It is one of the four metropolises and
fifth most populated city in India. Map 4.2 shows the location of Chennai in
Tamil Nadu. CMA comprises the area covered by Chennai City Corporation
(Chennai District), 16 Municipalities, 20 Town Panchayats and 214 villages
forming part of 10 Panchayat Unions in Tiruvallur and Kanchipuram Districts.
It extends over 1189 sq. kms., and has a population of 7.04 million as per 2001
census. It’s older name 'Madras' was officially changed to 'Chennai' in 1996.
Map 4.3 shows the Administrative Units of CMA.
Chennai is a major transportation hub for road, rail, air and sea
transport connecting major cities inland and abroad. Chennai is one of the
major educational centres in India with a number of colleges and research
institutions. Recently it has also been emerging as an important health city
with a large number of super specialty hospitals. Chennai is thus emerging as
an important metropolis in the South Asian region.
Map 4.2 Location of Chennai in Tamil Nadu

64
Map 4.3 Administrative units in Chennai Metropolitan Area
4.2.1 Geographical Location of CMA
Chennai Metropolis [with latitude between 12_50'49" and 13_17'24", and
longitude between 79_59'53" and 80_20'12"] is located on the Coramandal

65
coast in southern India and the land is a flat coastal plain. Three rivers viz.
Kosasthalaiyar, Cooum and Adyar pass through Chennai Metropolitan Area.
These rivers are placid and meander on their way to the sea. Buckingham
Canal, a man made canal, is another large waterway which runs north south
through this Metropolis. Sholavaram Lake, Red Hills Lake and
Chembarambakkam Lake are the three large lakes in the Area. Chennai lies
close to the equator and most of the year it is hot and humid.
Highest temperature attained in May-June is usually about 40°C for a
few days. The coldest time of the year is early January when the temperature
is about 20°C. Predominant wind direction is from South East to North West.
4.2.2 Heritage
Chennai is famous for its classical dance called Bharathanatyam and the
carnatic music season' event held every year during December and January is
one of the world’s longest cultural events attracting people not only from
various places in India but also from foreign countries. Chennai has a very
heterogeneous mix of architectural style ranging from ancient temples to
British colonial era buildings to the latest modern buildings. Most of the
buildings constructed during colonial era are of Indo-Saracenic style.
4.2.3 History
The site on which Madras is situated has a long history. Settlements existed in
the area of which Mylapore, Triplicane and Santhome were well known. The
geographer Ptolemy had recorded it in the second century AD that the port of
Mylapore was known to the Greeks and the Romans. The Port had a
flourishing trade with the Roman Empire and received considerable quantities
of gold in exchange for products like pepper and fine cloth. Mention has been
made of the early settlement of Santhome by Arab travelers and merchants of
the 9th and 10th centuries. Marcopolo visited this place in the late 13th

66
Century and the Portuguese settled around Santhome in the early 16th
Century. According to a traditional account it was at Mylapore that
Thiruvalluvar, author of the famous Tirukkural-the universal Code of human
conductlived. Both Mylapore and Triplicane were important Hindu religious
centres and inscriptions dating back to the eighth century have been found in
the Triplicane Temple. The name of Madras is said to be derived from
Madraspatnam, a village that existed here prior to the settlement of the
English.
4.2.3.1 Madras in 1600
Madras in 1600 was formed of scattered settlements separated by long
distances. Each settlement grew around a nucleus of a temple and has its own
history. The most important area at that time was Mylapore. In Santhome, the
Portuguese, having originally arrived in 1522, constructed a fort and
settlement. Mylapore was an adjacent settlement with a newly constructed
temple. Triplicane on the north was a separate village.
There were small settlements in Purasawalkam,
Thiruvatteeswaranpetta, Egmore, Nungambakkam, and Saidapet. Among the
suburbs, Tiruvottiyur, Velachery, Tiruneermalai, Mangadu, Padi,
Poonamallee, Kunnathur, Ayanavarum, Vyasarpadi, Villivakkam, Ambattur,
Koyambedu etc. already existed. Each of these villages was self contained and
had its own agricultural production and household industries. The changing
rulers in the region never interfered with them; with the result that life in the
villages continued to exist without much change.
Important lines of communication linked these settlements. Egmore,
Purasawalkam and Aminjikarai lie along Poonamallee High Road. Triplicane
and Mylapore lie along a road leading to Tiruvanmiyur. These roads were just
earthen cart tracks. Within a few years of the founding of the British
settlement and the construction of a Fort at the site, the New Town, which had

67
grown up around it, came to be known as Chennapatnam in honour of the
father of the local chieftain. This name was later applied to the whole city. The
population, which was 19,000 in 1646, expanded to 40,000 in 1669.
4.2.3.2 Madras in 1700
The Cooum River and the Elambore River or North River which flows into the
Cooum at its mouth were running very close to each other. A bridge was
constructed in 1710 across the cut between the two rivers.
Due to congestion inside the Fort, the British constructed some garden
houses in what is known as Peddanaickenpet. In 1733 there was a lot of
congestion in George Town and the weaving Community started settling in
Chintadripet area and Collepetta near Tiruvottiyur since abundant open space
was available for weaving. The washer men who were in the Mint area then
moved towards the west. The Potters from this area moved outside the Fort on
the north side and formed a new colony (Kosapet).
Because of the construction of a bridge in 1710 to connect Egmore,
people moved towards the present Moore Market area and settled. During this
time, the British found that Triplicane was a good area for settlement and a
large number of people moved there. The presence of the Nawab of Arcot
increased the economic prosperity of the area and more and more Muslims
settled in Triplicane. So from that time onwards, it grew in importance, second
only, to George Town. St. Thomas Mount gained religious importance and
Mount Road became prominent with the construction of Marmalong Bridge in
1724.
4.2.3.3 Madras in 1800
After the founding of the Corporation, conservancy and improvement of the
City were begun. The City was divided into 8 Divisions and the Government
selected 4 Commissioners from residents. The broad-gauge line from

68
Royapuram to Arcot was laid in 1864. Central station was formed in 1872 and
linked to the main line. By 1861 the British authorities realised the necessity
of a harbour. A pier was constructed in 1862 and further development took
place from 1868 onwards.
The formation of Royapuram station in 1862 induced people to move
northwards and settle in Royapuram. This gave rise to the establishment of
some timber saw mills and depots in Royapuram after a few years. Further the
railway line passed through the present Perambur area, which had so far been
lying as swampy waste because of its low level. The introduction of the
railway line gave development potential to the hitherto uninhabited place.
From 1850 onwards, the necessity of providing recreational facilities was
perceived. Many parks such as the Peoples Park, Napier Park and Richardson
Park were created in this period. A Museum and a Zoo were also established.
Before 1800, the roads were in a radial pattern, but after 1810 ring
roads were developed inside the City. Mount Road was important and access
to it was given from Triplicane High Road, Chamiers Road, Edwards Elliot's
Road and Royapettah High Road. To the North of Mount Road, Pantheon
Road, Halls Road, Marshalls Road, Spur tank Road and Nungambakkam High
Road were formed to serve the new residential areas. Later Brick kiln Road
and Perambur Barracks Road connected Poonamallee High Road with Konnur
Road, which was extended towards the Railway. To facilitate trade the
harbour was completed in 1896 just to the east of George Town.
The city extended over an area of about 70 sq.kms. and had a
population of 5.40 lakhs in 1901. The demographic growth rates during the
previous two decades were 5 per cent and 6 per cent. Important buildings and
structures which are the land marks of the city such as the Fort, the Marina-the
road parallel to the sea-and the fronting public buildings, the High Court, the
Moore Market, the Connemara Public Library and other public buildings

69
around it already existed. George Town was the main business centre but
substantial parts of it were used for residential purposes also.
The main residential areas however were Chintadripet, Triplicane,
Egmore, Mylapore, Purasawalkam, Vepery and Royapuram. Most of the areas
outside these settlements were covered by gardens and agricultural lands
interspersed with bungalows of the elite. Nungambakkam, Chetpet and
Kilpauk were some of the areas, which developed in this manner; Saidapet in
the southwest was a separate small settlement. Both sides of Mount Road to a
distance of 5 to 6 kms. from Fort St.George were occupied by large business
houses, clubs and hotels; industries were few and were located in George
Town or Perambur area. The three railway lines served the city from the north,
west and southwest.
4.2.3.4 The City in 1941
The population of the City increased to 8.6 lakhs by 1941. The city occupied
an area of about 80 sq.km. and its boundaries having been extended in 1923.
The important developments during the period 1901 and 1941 were the
commissioning of the electrified suburban metre-gauge railway between
Beach and Tambaram in 1931 which gave a fillip for the development of the
outlying suburban areas as far as Tambaram, and the development of the area
occupied by the long tank at Nungambakkam as a planned residential
neighbourhood by the Corporation. There were also considerable in filling
within the developed areas. The city had a good water supply system and most
of the areas were sewered. It had quick and cheap modes of transport by trams
and electric trains. The main roads were wide enough for the road traffic and
passed through shady avenues. By 1941 Madras had developed into a
provincial metropolis enjoying the best of both worlds -urban amenity and
rural atmosphere. It was still primarily an administrative and commercial
centre.
70
4.2.3.5 The City in 1971
The thirty years between 1941 and 1971 saw tremendous growth in population
and economic activity in and around the City. The population first passed the
million marks around 1943 and then doubled itself in a short span of about
twenty years to cross, the two million mark. This happened in spite of two
adverse events, viz., the threat of Japanese invasion to Madras in 1944 and the
reconstitution of Madras Presidency on a linguistic basis in the fifties, when
Andhra, Mysore and Kerala states were formed. In 1950 the boundary of the
City was extended to cover 129 sq.kms. by the inclusion of Saidapet and
Sembium. This period also saw the growth of new residential as well as
industrial suburbs particularly on the west and south.
The main reasons for this fast growth can be attributed to the forces of
economic activity released after the country obtained independence. The five-
year plans and the impetus given by the industrial activity in the public sector
brought about the transformation of the City from that of a purely
administrative and commercial centre into a metropolis of national
importance. The major developments in the industrial field during the post
independence era have been, the location of a number of public sector
undertakings. This was followed by many private sector undertakings.
Concurrently this period saw the deterioration in water supply and drainage
services and mushrooming of many slum areas all over the city. The setting up
of the Tamil Nadu State Housing Board (TNHB) however, helped in the
creation of large residential areas like Anna Nagar on the west and Sastri
Nagar on the south.
The City’s boundary no longer remained well defined. The
developments extended into the adjoining areas, particularly, on the north up
to Ennore, west up to Avadi and south up to Vandalur. This growth did not
take place in a regulated manner nor did it correspond to the available

71
infrastructure facilities. This fact coupled with the rapid growth of population
on the one hand and the increase in number of motor vehicles on the other has
given rise to the many problems faced by the Metropolis today.
4.2.4 Structure of the Metropolis in 2006
The Master Plan for CMA approved in 1976 proposed the structure of the
Metropolis taking into account various factors. The structure proposed was of
radial pattern with City as hub. The main elements of the strategy were:
(a) Restriction of density and population growth in the city
(b) Restriction of industrial and commercial developments within CMA
(c) Encouragement of growth along the major transport corridors and
development of urban nodes at Manali, Minjur, Ambattur, Avadi,
Alandur and Tambaram
(d) Dispersal of certain activities from Central Business District (CBD).
(e) Development of satellite towns, beyond CMA at Maraimalai Nagar,
Gumidipoondi and Thiruvallur.
The Master Plan included spatial plans for CMA with land use zoning
and set the urban form during the Plan period. TNHB has played a major role
in development of large scale neighbourhood schemes; Anna Nagar (about 5
Sq.km.), Ashok Nagar and K.K. Nagar (about 7 sq.km.), South Madras
Neighbourhood scheme comprising Indra Nagar, Sastri Nagar and Besant
Nagar (about 4 Sq.km.), etc. had come up with plots/flats meeting the
requirements of all sections of the society from HIG to EWS. Under MUDP-I
(1977-92), MUDP-II (1983-87) and TNUDP (1988-95) Neighbourhoods at
Arumbakkam, Mogappair, Villivakkam, Velachery, Kodungaiyur, Ambattur,
Avadi, and Madhavaram etc. were developed within the City and its suburbs.
These large-scale neighbourhood developments of TNHB with full
infrastructure acted as catalyst for private developments for residential use
around.

72
A number of medium and small-scale industrial developments came up
in the areas zoned for industrial developments at Madhavaram, Vyasarpadi,
Kodungaiyur, Ambattur, Noombal and adjoining areas Pammal and
Perungudi. Industrial estates at Villivakkam, Thirumazhisai and Industrial
estate for women enterpreneurs were developed at Morai near Avadi.
Considering the demand, infrastructure availability, potential for industrial
developments, the lands along the Poonamallee bye-pass road near
Poonamallee Town in the west and Old Mamallapuram Road (from City limit
to Sholinganallur) in the south were comprehensively reclassified for
industrial use where a number of medium scale and small scale industries had
come up.
Though Vallalar Nagar (George Town) and Anna Salai area have
continued as CBD, Mylapore, Thyagaraya Nagar, Nungambakkam, and
Purasawalkam have developed as Regional Commercial Centres and Adyar,
Anna Nagar and Perambur have developed as Regional Commercial Sub-
Centres. Relocation of wholesale activities in Vegetable, Fruit and Flower
from CBD to Koyambedu and City bus stand from CBD to Koyambedu have
been carried out; Iron and Steel Market at Sathangadu was developed. Truck
terminal at Madhavaram was made operational. Major higher educational
institutions are located in the central part and southern part of the City and
they continued to expand within its premises. After 1980, a number of private
engineering and medical institutions have come up dotting the Metropolis.
4.2.5 Current Scenario
Chennai has become one of the preferred destinations for IT / ITES
companies. Tamilnadu is the second largest software exporter in the country,
and 90% of the export is from Chennai alone. A large number of IT / ITES
developments are located along the Rajiv Gandhi Salai (OMR), the area
popularly known as IT Corridor. TIDEL PARK, a self contained IT Park

73
developed with a total floor area of 2.5 million sq.ft. at Taramani houses all
the major players in IT Sector. These developments are spilling over in the
areas in the west along the 200ft. wide Pallavaram - Thoraipakkam Road, and
also along Velachery – Tambaram Road. In the large I.T Park (layout with all
required infrastructures, developed by government agency over an area of 868
acres) at Siruseri, a number of I.T.Parks are being located and will be fully
functional by 2007. Bio-tech Park at Taramani was developed by TICEL, and
a major bio-tech park came up at Sirucheri. These employment-generating
developments resulted in fast development of the areas in the west of the
corridor such as Medavakkam, Jalidampet, Perumbakkam, Vengai vasal,
Gowrivakkam, Rajakilpakkam etc. as residential areas.
Chennai is emerging as a major export hub in the South East Asia.
International car manufacturers such as Ford, Hyundai, and General Motor etc.
have established around Chennai their manufacturing bases to cater to
domestic and international markets. New testing and homologation centre for
automobile sector with an investment over Rs. 1000 cr. is being established in
this region. Saint Gobain glass factory, Nokia cell phone manufacturing
industry at Sriperumbudur, and Mahindra Industrial Park developed over 1700
acres, near Maraimalai Nagar new town are some of the major developments
around Chennai. All these developments made considerable impact on the
structure of this Metropolis.
Dynamism of the peripheral areas has been captured by Pushpa
Arabindoo by comparing the changes that have occurred over a period of time
in terms of socio-spatial transformations in two peri-urban neighbourhoods –
Valmiki Nagar and Neelangarai. She emphatically proves that global
capitalism in association with local authorities has dictated the changes in
these two neighbourhoods that are characterized by the post-modern features
of pluralism, segmentation and multiplicity. By embarking on a comparative
analysis of pre- and post-1978 periods, Arabindoo has evidenced two kinds of

74
peripheral developments: one in which posh peripheral settlements gave way
to heterogeneous periphery neighbourhoods; and in the second, where the
lower middle class and migrant housing gave way to the show of global
capitalistic features, such as seaside resorts, expatriate housing, etc. Arabindoo
emphasizes that these spatial and social changes have made the peri-urban
areas ‘pawns’, in the hands of the predatory metropolitan planning authorities
who like to gamble this space for real estate ventures in partnership with
privatized and globalized agents/actors leaving behind the lower middle class
and also the Panchayat unions as silent spectators for this new form of
invasion.
Map 4.4 Growth of Chennai since 1633
75
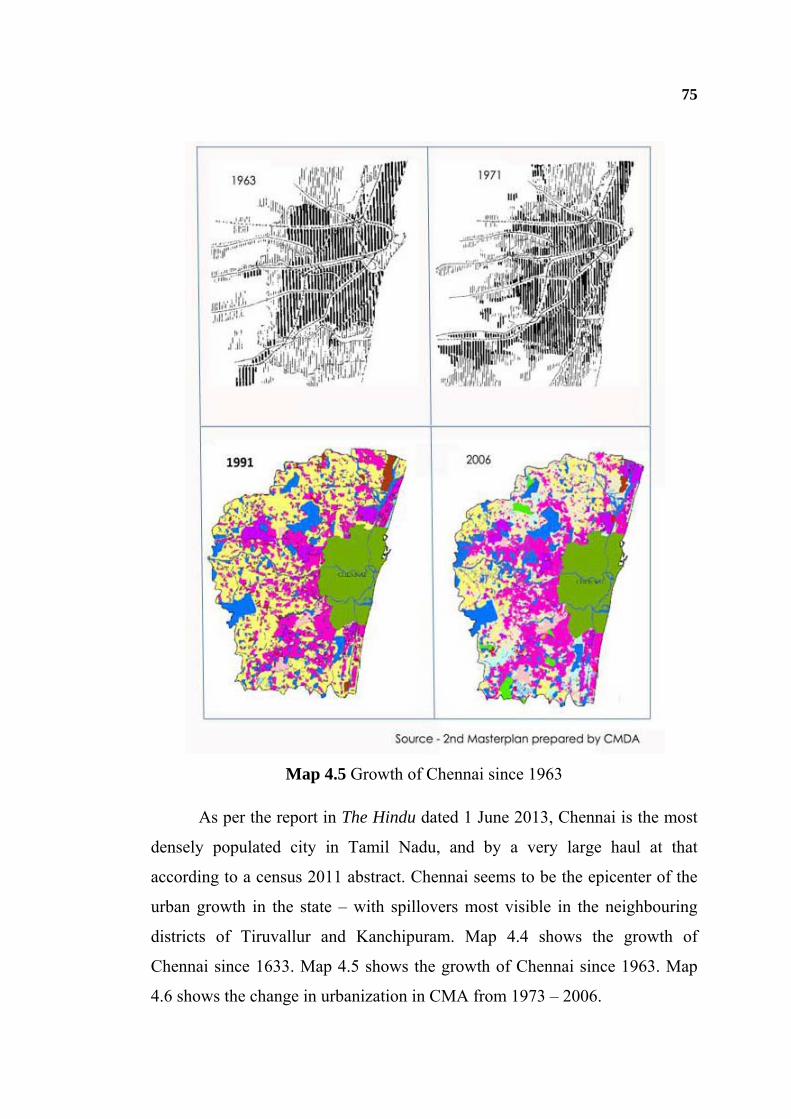
Map 4.5 Growth of Chennai since 1963
As per the report in The Hindu dated 1 June 2013, Chennai is the most
densely populated city in Tamil Nadu, and by a very large haul at that
according to a census 2011 abstract. Chennai seems to be the epicenter of the
urban growth in the state – with spillovers most visible in the neighbouring
districts of Tiruvallur and Kanchipuram. Map 4.4 shows the growth of
Chennai since 1633. Map 4.5 shows the growth of Chennai since 1963. Map
4.6 shows the change in urbanization in CMA from 1973 – 2006.

76
Map 4.6 Changes in urbanization in CMA from 1973 to 2006
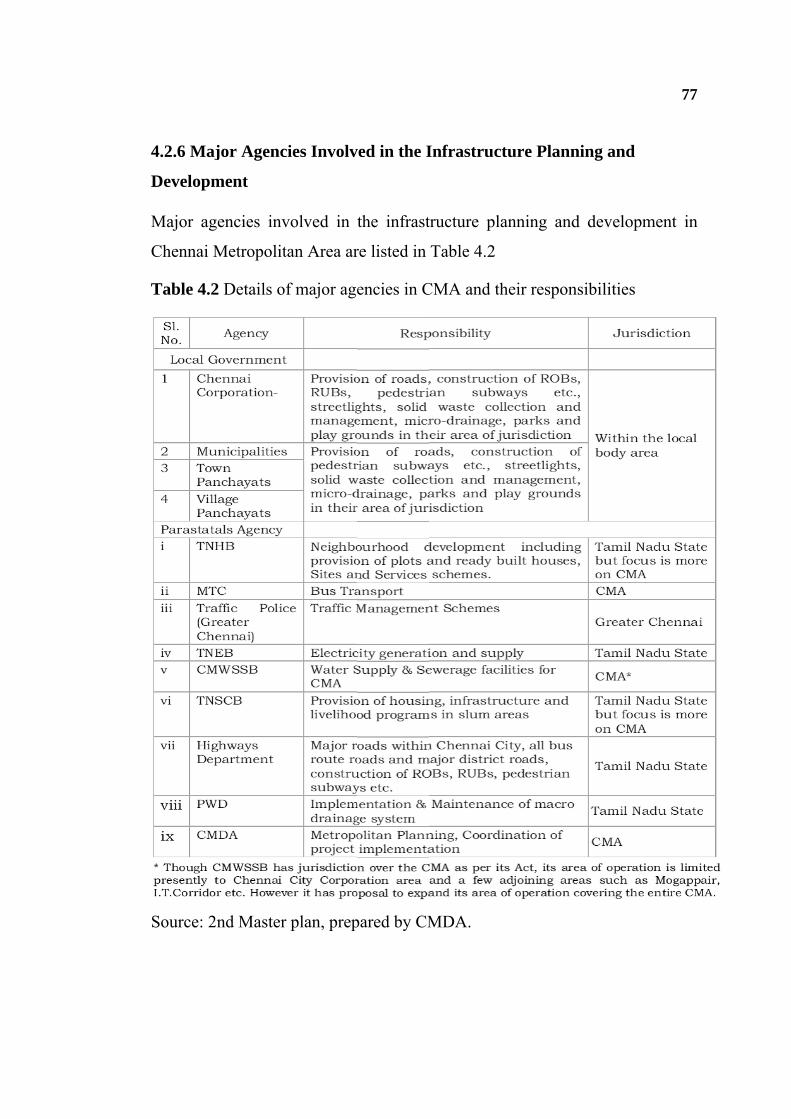
4.2.6 Maj
Developm
Major ag
Chennai M
Table 4.2
Source: 2
jor Agenc
ment
gencies inv
Metropolit
2 Details o
2nd Master
cies Involv
volved in t
tan Area ar
f major age
r plan, prep
ved in the I
the infrast
re listed in
encies in C
pared by CM
Infrastruc
tructure pl
Table 4.2
CMA and th
MDA.
cture Plann
anning and
heir respon
ning and
d developm
nsibilities
77
ment in

4.2.7 Pop
4.2.7.1 C
Chennai
constitute
populatio
32.85 lak
2001 resp
bodies wi
Table 4.3
It
experienc
indicates
the avera
most of th
these are
residentia
pulation
urrent Sce
has a long
ed in 1798
on of 5.40
khs, 38.43
pectively.
ithin CMA
3 Growth o
is observ
ced higher
that the ci
age gross d
he municip
eas offer
al nodes in
enario
g history
8. City exte
lakhs. Sin
lakhs and
The growt
A is given in
of populatio
ved that th
r growth r
ty has the
density in C
pal areas a
high poten
future.
since 1639
ending ove
nce 1941,
43.43 lak
th of popu
n Table 4.3
on in CMA
he munici
rate than t
highest gro
CMA is on
and Town P
ntial for g
9. The Ch
er an area
it had gro
khs in the y
ulation in C
3.
A
ipalities an
that of the
oss density
nly 59 pers
Panchayats
growth an
hennai city
of 68 sq.k
own rapidl
years 1971
Chennai cit
nd Town
e city. Th
y of 247 pe
ons/ha. Th
s is very lo
nd would
y corporati
km in 190
ly to 26.42
1, 1981, 19
ty and oth
Panchayat
he density
ersons/ha, w
he gross de
ow, indicat
be the re
78
ion was
1 had a
2 lakhs,
991 and
her local
ts have
pattern
whereas
ensity in
ting that
eceiving

4.2.7.2 Po
Populatio
trends. It
2026, of
populatio
Table 4.4
4.2.8 Mig
The cosm
groups fr
surroundi
northern
distinctiv
this Chen
An
Chennai
City in 19
natural in
increase w
migration
opulation
on projecti
t is estimat
f which C
on projectio
4 Projected
gration
mopolitan n
rom all ov
ing Tamil
India. Th
ve mark on
nnai Metrop
n interestin
City to its
991 was 38
ncrease of
works out
n of 10 lak
Projection
ions have
ted that CM
Chennai ci
on of CMA
d populatio
nature of C
er India. M
and Telug
hese migra
n the patter
polis.
ng and im
s suburbs a
8.43 lakhs
f 6.40 lakh
to only 5.
khs (30.4%
n
been carr
MA would
ity alone
A is given i
on for CMA
Chennai is
Migrants ca
gu speakin
ant groups
rns of resid
mportant f
and other
which inc
h (for 198
.59 lakhs w
% of 1981
ried out fo
d house a
would ac
n Table 4.4
A and Chen
a result of
ame not o
ng areas, b
s from oth
dential and
fact found
areas. The
clude 9.18 l
81-91) pop
which show
population
or CMA b
population
ccount for
4.
nnai city
f its attracti
nly predom
but also fr
her states
d social org
is the ou
e populatio
lakh migra
pulation; th
ws that the
n) from C
based on t
n of 126 la
r 58 Lakh
iveness to
minantly fr
rom southe
have mad
ganisations
ut-migratio
on of the C
ant populat
he net pop
ere was a n
City (during
79
the past
akhs by
hs. The
migrant
from the
ern and
de their
s within
on from
Chennai
tion and
pulation
net out-
g 1981-
80
1991). Similarly, an out-migration of 10.19 lakhs (26.5% of the 1991
population) is noted during 1991-2001. Though there were large-scale
building construction activities noted during the above periods, the out-
migration of resident population from Chennai City proves that considerable
conversion of residential premises into non-residential mostly for office,
shopping, hotels and other commercial purposes took place; this trend will
continue in this metropolis.
4.2.9 Economy
Chennai City alone accounts for 10.94 percent of the State income. The
income in the areas of Kancheepuram and Thiruvallur District, which fall
within CMA, based on proportion of population, roughly, has been estimated
at 2.8 percent and 2.5 percent respectively. These show that CMA accounts for
16.21 percent of the State income from all sectors.
Chennai and Kancheepuram together contribute about 26% of
employment in organized sector to the State total in 2002-03. Of the total
public sector employment, the employment opportunity in Chennai and
Kancheepuram Districts are 20% and 7% respectively in 2002-03. The
percentage of the same in private sector in Chennai and Kancheepuram
Districts are 7.8 and 15.9
Major industries in CMA are automobile and transport equipment
manufacture and their ancillary industries, railway coach building, petro
chemicals and fertilizers, automotive tyres, bicycles, electrical and other
machinery, and leather products. Some of the large units are located at Ennore,
Thiruvottiyur, Manali, Sembiam, Padi, Ambattur, and Porur and along GST
Road apart from the Integral Coach Factory at Perambur, and Heavy Vehicles
Factory at Avadi. Many small and medium scale industries are located at
Vyasarpadi, Ambattur, Villivakkam, Guindy and Thirumazhisai and industrial
estates at Madhavaram, Kodungaiyur, Poonamallee, Noombal, Perungudi,

81
Seevaram and Sholinganallur. Simpson, Addison and TVS industries are
located in the heart of the City along Anna Salai. MEPZ spreading over an
area of 261 acres is functioning at Tambaram. Leather tanneries and leather
based industries are located at Pammal and Madhavaram. Thermal Power
Plants are located at Basin Bridge and Ennore. Many of the smaller units are
scattered in various parts of the Chennai City and the rest of CMA. Industrial
estate for leather goods is being developed at Thirumudivakkam.
Chennai is perhaps the only city in India to have all the top 10 IT
Indian multinational companies and the 3 IT majors viz. Infosys, Tata
Consultancy Services Ltd and Wipro which have acquired lands in and around
Chennai to meet their expansion plans. The Tidal Park I and the IT Park at
Siruseri have already been developed in Chennai and its environs. The Tidel
Park I is fully functional. The private IT developers have been enthused to
build enough IT space and the Government is certain of creating 2.5 million
sq.ft of IT space in private as well as in public sectors in the coming years to
meet the growing requirements of national and international clients. The first
phase of Knowledge Industrial Township is being planned by a special
purpose vehicle viz. ELCOT Infrastructure Ltd. in Sholinganallur along the IT
Corridor.
Industries have also been developed along important transport corridors
in all directions, north, west and south. In the north, large industrial units are
located at Ennore, Thiruvottiyur and Manali. Industrial estates are located at
Madhavaram, Kodungaiyur and Gummipoondi. Important industrial locations
in the west include Ambattur, Padi and Sembiam. Integral coach factory at
Perambur and heavy vehicles factory at Avadi are important industries under
public sector. Many small and medium scale industries are located at
Ambattur, Villivakkam, Thirumazhisai, Poonamallee and Noombal. Thermal
power plant is located at Basin bridge. Hyundai car factory at Sriperumbudur,
Hindustan Earth Movers at Thiruvallur and automobile industries at

82
Irugattukottai are other important industries. In the south most of the industries
are located along the G.S.T Road (NH45). Simpson, Addison and TVS
industries are located in the heart of the City along Anna Salai. Madras Export
Processing Zone (MEPZ) spread over an area of 105 hectares is located at
Tambaram. Leather tanneries and leather-based industries are located near
Tambaram. Industrial estate for leather goods is being developed at
Thirumudivakkam.
4.2.10 Traffic and Transportation
While the urban rail network development is carried out by the Southern
Railway, the major arterial & sub-arterial road corridors and other roads are
developed and maintained by Highways Department and the local bodies
concerned respectively. The roads within the local body areas are improved
and maintained by the Directorate of Municipal Administration, Directorate of
Town Panchayats and Directorate of Rural Development through the local
bodies concerned. As regards traffic management and enforcement, the same
is looked after by the City Traffic Police in respect of Greater Chennai Area
and District Police for the rest of the CMA. The public bus transport is with
Metropolitan Transport Corporation (MTC)
4.2.10.1 Road Network
The road network of Chennai is dominated by a radial pattern converging at
George Town, which is the main Central Business District (CBD) of the
CMA. The road network is primarily based on the four National Highways,
leading to Calcutta (NH5), Bangalore (NH4), Thiruvallur (NH 205) and
Trichy (NH 45). In addition to these, Arcot Road, Kamarajar Salai,
Thiruvottiyur High Road, Rajiv Gandhi Salai (Old Mahabalipurm Road) and
East Coast Road are the other important radial roads in CMA.

83
4.2.10.2 Rail Network
The commuter rail system in CMA operated by the Southern Railways
consists of 3 lines:
• Chennai Beach - Tambaram BG line running south-west
• Chennai Central - Thiruvallur BG line running west and
• Chennai Central - Gummidipoondi BG line running north
These lines radiate from the city-centre. These 3 lines together account
for 300,000 commuter trips per day. While the first two corridors carry
intercity passengers on separate dedicated lines, the third corridor carries both
commuters and intercity passengers on the same lines. In addition, the Phase 1
& Phase 2 of MRTS are currently in operation traversing a length of more than
15 km covering the residential and IT corridor on the south eastern side of the
city. Also, The Metro Rail Project, which would be a landmark in the city’s
transportation is under progress
4.2.10.3 Bus Transport
The bus transport is being operated by Metropolitan Transport Corporation
(MTC), which had a fleet strength of 2,773 buses in 2004. They operate 537
routes and carry 36 lakhs trips/day.
There is acute overcrowding in buses during peak hours. The
overloading is as high as 150% in certain routes as the supply is inadequate.
As a result, overcrowding at the bus stops and spillover on the carriageways
has become common. The waiting time at the bus stops has also increased.
Map 4.7 shows the major road network in CMA.

84
Map 4.7 Major road network in CMA
4.2.11 Shelter
The gap between households and housing units in 2001 was of the order of
36,000 units in the Chennai Metropolitan Area while in the City it was much
less. 75% of the houses are with roof made up of brick, stone, concrete and

85
other materials of pucca nature, about 15% are with semi-pucca roofing
materials such as tiles, slate, G.I. metal sheets and asbestos cement sheets, and
about 10% are with ‘Kutcha’ materials such as thatched, bamboo etc.
According to Census, 2001, about 71% of households live in less than
three roomed housing units
Chennai City has a slum population of 819,872, which constitutes about
19% of the City Population.
The principal stakeholders in providing housing in Chennai area are
TNHB and TNSCB in the public sector. In the private sector builders
including corporate builders and individuals are the chief contributors. Only
the public sector has been involved in the housing of EWS and Low Income
Groups, which constitute nearly 65% of the households.
4.2.12 Infrastructure
4.2.12.1 Water Supply
In Chennai City, Chennai Municipal Corporation was responsible for
construction, operation and maintenance of water supply system till August
1978. It was transferred to the (then newly formed) CMWSSB with all assets
and liabilities. The major supply sources viz. Poondi reservoir, Cholavaram
lake and Redhills lake are under the control of the State PWD (Irrigation);
further the PWD (Ground Water Cell) is responsible for the investigation of
ground water resources within CMA to augment supplies.
In the rest of the CMA, construction and water supply schemes were
undertaken mostly by TWAD Board at the cost of the local body concerned
and after completion, transferred to the local body for future operation and
maintenance. CMWSSB is now planning to cover these areas with water
supply and sewerage services. Potable water supply system exists almost in all
the municipalities with CMA. Alandur, Pallavaram, Tambaram, Anakaputhur
and Pammal Municipalities have water from Palar River as source, and other

86
municipalities have CMWSSB bulk supply or the ground water as source.
Water supply in Panchayat areas are concerned, it is by local wells and public
taps.
4.2.12.2 Rain Water Harvesting
The importance for conservation of water and rainwater harvesting was
understood and due consideration and thrust were given from early 90's itself
in Chennai. While issuing Planning Permission for construction of major
developments such as flats, residential developments, office, shopping and
other commercial complexes, the condition to provide rain water-harvesting
structures within the premises was imposed and ensured to be provided before
issue of Completion Certificates. Provision of rainwater structures in all types
of developments, irrespective of size or use was made mandatory by amending
DCR and Building Byelaws in the year 2001, not only for the buildings
proposed to be constructed but also for all the existing buildings. After
implementation of this scheme widely in CMA, a significant increase in the
ground water levels and also quality of ground water was noted.
In 2001, it was also made mandatory that all centrally air-conditioned
buildings shall have their own wastewater reclamation plant and shall use
reclaimed wastewater for cooling purposes.
4.2.12.3 Sewerage
Chennai City Sewerage System was designed in 1910 for an estimated 1961
population of 6.6 lakhs at the rate of 114 lpcd, as a separate system. The
system then allowed for admission of storm water from house courtyards and
roofs through gullies. The city was divided as north, west and south drainage
areas and sewage from each area was collected by relay pumping and
conveyed to the pumping stations at Napier Park, Purasawalkam and
Royapuram, and finally discharged into the sea at Kasimedu out-fall.

87
Kodungaiyur sewage farm was developed in 1956 and a portion of the sewage
collected at Purasawalkam pumping station was discharged through force
mains to Kodungaiyur farm.
A comprehensive improvements to the city sewerage system was
designed in 1958 for an estimated 1976 population of 25.5 lakhs and 1991
population of 27.2 lakhs at a sewage flow rate of 110 lpcd in 1976 and 180
lpcd in 1991; the City was also divided into five zones with proposals for five
independent disposal works. It was planned to isolate the system of collection,
transmission and disposal of sewage in each zone in order to obviate the
difficulties of the relay system.
In the present Chennai City Corporation area of 176 sq.km., the
sewerage system now covers 99% of the city area. There are 5,15,560 sewer
connections as on date to serve the population of Chennai City through a
network of 2,663 kms of sewer and 180 sewage pumping stations. For the
purpose of planning Sewage System, the Metro Water has divided the CMA
into four categories as Chennai City, adjoining urbanized areas classified as
Adjacent Urban Areas (AUA), Distant Urbanized Areas (DUA) and Rural
Areas
4.2.13 Social Facilities
4.2.13.1 Education
In Chennai, being the State capital, the educational facilities available are of
high and specialized when comparing the rest of the State. In CMA, most of
the middle schools include primary classes, high schools include middle and
primary classes and the higher secondary schools include primary, middle and
high school classes. It is provided both by private and public (State and
Central Governments, local bodies). A primary school for about 5000
population (370 school going children of that group), a high school for 7000
population (732 school going children of that age group) and a higher

88
secondary school for10,000 population (210 school going children of that age
group) is available as per 2001 Census. Collegiate, technical and other
professional higher educational institutions in CMA are concerned, it serves
not only the CMA region, but also the state level apart from the national level
for certain specialized fields.
4.2.13.2 Health
Chennai has established itself as the health Capital of the country and is fast
becoming the health destination of choice for people all over the world with its
excellent facility, competent specialist and good nursing care.
In Chennai there are 3 major Government Hospitals. Government
agencies involved in provision of health infrastructure are Directorate of
Medical Education, Directorate of Public health and Preventive Medicine,
Directorate of Medical and Rural Health Services, Directorate of Family
Welfare, Directorate of Drugs Control, Commissionarate of Indian Medicine
and Homeopathy, Tamil Nadu State Health Transport Dept.
A large number of private hospitals deliver health care in CMA, Apollo
Hospitals, Sri Ramachandra Medical College Hospital, Malar Hospital, Vijaya
Hospital, Devaki hospital, CSI Rainy Hospital, CSI Kalyani Hospital etc. are
the major hospitals. According to the approved Government list, there are 130
private hospitals function in the City area itself.
In the rest of CMA, there are 10 primary health centers functioning at
Minjur, Naravarikuppam, Avadi, Medavakkam, Porur, Poonamallee, Manali
New Town, Madhavaram, Pozhichalur and Pudur. The existing facilities
particularly the specialized & higher order ones are concerned, it serves not
only the CMA population, but also the rest of Tamil Nadu and the adjoining
states population; as regards private sector, it attracts patients from all over
India and also some of the foreign countries.

89
4.2.13.3 Recreation
Chennai is endowed with the second longest straight sandy breach in the
world, called Marina. Elliots Beach, another major beach in Chennai attracts
large number of people. Thiruvanmiyur Beach, Kottivakkam Beach,
Neelankarai Beach and small beaches at Thiruvottiyur are also being used by
people in those areas. These beaches are used by the people throughout the
year and the Marina & Elliots Beaches attract thousands of people every day.
In Chennai City, there are about 195 parks with extent varying from
150 sq.m. to 3.5 hectares and totaling to more than 60 hectares. Playgrounds
maintained by the Chennai Municipal Corporation is concerned, it is more
than 200 nos., with a total extent exceeding 50 hectares. In the rest of CMA,
unlike the City, the parks & playfields are a very few.
CMA also boasts a number of Theme Parks developed commercially in
and around CMA, which attracts not only the local population but also
tourists. CMA is dotted with a number of lakes (with minimum water spread
in non monsoon seasons), which may be developed as recreational spaces in a
planned way taking into account its environmental aspects also. It will not
only help in conserving these water bodies but also preventing encroachments
and pollution.
4.2.14 Solid Waste Management
Chennai Corporation is the responsible agency for solid waste management in
the City Corporation area. Chennai Corporation area is divided into 10 zones
and each zone is further sub-divided into about 15 Divisions totaling to 155
Divisions. Conservancy responsibility has been delegated to Zonal officials in
City Corporation. According to Census 2001, the population of the City was
43.43 lakhs and the average per capita solid waste generated within the City is
estimated to be about 585 grams. It has been estimated that 3000 tonnes of

90
solid waste is generated in these 10 zones in the City area daily and in addition
Chennai Corporation also handles about 500 tonnes of debris.
NGO's in cooperation with Municipal Corporation are assisting
communities to collect solid waste through community based arrangement in
some areas of the City. Municipal Corporation provides street sweepings and
scientific collections throughout the City.Solid waste from the Chennai
Corporation area is taken to the transfer stations and from there it is finally
disposed off at two designated disposal sites viz. Kodungaiyur located at
northern part of City and Perungudi an adjoining village in the south. Both the
sites are located in low lying areas and are adjacent to the Metro Water
Sewage Treatment Works. The extent of the Kodungaiyur landfill site is 182
hectares and the Perungudi land site is 142 hectares. In the Rest of Chennai
Metropolitan Area, All solid waste management functions are the
responsibility of the executive authorities of the local bodies namely
municipalities, town panchayats, and village panchayats.
4.2.15 Land Use & Spatial Strategy
The urban form of Chennai Metropolitan Area has been dictated by
developments along the major roads and rail links radiating from the center of
Chennai.
The urban form has developed in the shape of a half star with
interspersed green wedges. These green wedges are getting filled up due to
improved accessibility created through construction of ring roads during the
last decade.
The development actions in an around the city are expected to modify
the form from the half star mentioned earlier to concentric half circles
engulfing the green wedges that had been left undeveloped earlier. The urban
structure beyond the City limits is also expected to shift from a predominantly
91
low-density low-rise development to medium density developments
interspersed with high-rise buildings.
The Master Plan for Chennai Metropolitan Area came into force from
5.8.75 from the date of notification of the Government consent for the plan.
The Master Plan laid down policies and programmes for the overall
development of the CMA. The land use plan designated the use to which every
parcel of land in CMA could be put to. The land use plan was enforced
through a set of regulations under Development Control Rules, which formed
part of the master plan.
Chennai is one of the high-density cities in India. Its density varies
from 180 persons per hec. in Saidapet and Mylapore Corporation zones and
368 persons per hec. in Kodambakkam zone within the Corporation limits and
the gross density for Chennai City is 247 persons per hec. FSI is the main tool
used in urban planning to regulate the densities of population with reference to
infrastructure provision. The existing developments in Chennai can be
categorized as high dense medium raised developments mostly of buildings up
to 15 m. heights. FSI allowed for such development up to 15 m. height
presently is maximum 1.5.
Density of population needs to be regulated for various reasons
including carrying capacity of infrastructure (existing as well as proposed),
sociological reasons such as crime rate etc and other physical factors. Map 4.8
shows the land use planning for 1973 for CMA. Map 4.9 shows the land use
planning for 2006 for CMA.

92
Map 4.8 Chennai Metropolitan Area – Land use 1973

93
Map 4.9 Chennai Metropolitan Area – Existing land use 2006

94
4.3 FINDINGS FROM THE STUDY
The urbanization in CMA is taking place at a faster pace. Development is
taking place in the city and outside the city. Concerned regulatory authorities
are trying their best to control and regularize the urban growth. The study
helped in understanding the development trends, particularly in recent years
and the reasons for the same. It also helped in identifying the potential areas
for future development and also plan for the future directions of growth taking
into account of all the relevant planning aspects. The Second master plan for
CMA gives elaborate information on the different physical, social and
economic aspects like shelter, infrastructure, land use, transportation, etc.
However, most of the data given in depth focus on the Chennai City and not
much focus is given to the rest of CMA.
As already mentioned in Chapter three, urbanization is taking place in
Indian cities in par with what is happening worldwide. It is happening at a
faster pace and the urban expansion is taking place toward the outward city
limits i.e to PUAs as an effect of it. The data in Second Master Plan for CMA
did not cover much about the peri urban areas of CMA, the researcher
proceeded further to in depth study of the peri urban areas in Chennai.
After understanding the administrative units of CMA, the PUAs of
CMA have been delimited for further study based on the secondary data
collected from Census of India for four decades (1971, 1981, 1991, 2001).
This process is elaborated in the latter half of this chapter.
4.4 PERI-URBANIZATION IN CHENNAI
Even though the population growth of Chennai has been declining, it is
increasing in the suburban area rapidly. As a result, the inhabitants’ demand is
higher and higher. At present, not every domestic consumer has access to
drinking water during the entire year: this is especially true in the slums and

95
informal settlements which represent about 30% of the population in Chennai
(Joel et al.).
Kamala Marius – in her study a ‘new economic activities and
metropolitan restructuring the case of southern periphery of Chennai’ proved
in the study that process of current globalisation affecting the metropolis of the
south, the implementation of new economic activities or reorganization of
established activities on the periphery favoured by local and national
authorities, has a direct impact on metropolitan restructuring.
A study on Process of Peri Urban Formulation In Chennai Metropolitan
Area at Anna University, Chennai (2004) reveals the following:
• The level of infrastructure available in a settlement is responsible for
the rate of growth of a rural settlement to get transformed in to a
Periurban area. Particularly, higher education facilities, health facilities,
banking and shopping facility attract more developments and the
Periurban transformation is quicker. This is further evidenced in the
literacy level and the general income level prevailing in the settlement.
• Establishment of farm houses in large pieces of land was the trend a
few years back. However with the increasing pressure on land for
development, many farm houses have vanished in the Periurban
settlements
• The interdependence among the rural Periurban and urban settlements
is highly pronounced. Rural settlements depend on the immediate
Periurban settlements and the Periurban settlements depend on major
urban settlements for work, education and health facilities. For higher
levels of activity involving specialized jobs, higher education,
specialized health services and shopping of valuable items. The city
continues to attract work trips, education trips and shopping trips.
• Periurban settlements are often not self contained development. They
continue to depend on the main city for jobs and specialized purposes.

96
The traffic generated towards the city form a telescoping pattern along
the available few major transportation corridors. The flow increased
from the periphery of the city where Periurban settlements are
predominant towards the city. As the city roads are already clogged, the
traffic from the Periurban and urban settlements further aggravate the
situation. The primary reason is while the transportation corridors were
instrumental for development, the same corridors are stressed beyond
the handling capacity at reasonable speed. This means that Periurban
transformation has increased the distance of travel and not the change
in the direction of travel. This has become a major challenge for the
transportation planners.
Census 2011 data confirms that population growth within Chennai
District has slowed, while in the adjacent districts of Kanchipuram and
Tiruvallur, it has increased. (The Hindu – 17 April 2013)
Areas outside the CMA are witnessing rapid development and there is a
need to integrate these developments with Chennai (Thiru R. Vaithilingam,
Minister for housing and urban development, 2011)
4.5 DETAILS OF ADMINISTRATIVE UNITS IN CMA
The Chennai Metropolitan Area includes 1189 sq. km.:
• Chennai city, “municipal corporation” (Chennai Municipal
Corporation), 176sq.km.
• 16 “municipalities” which don’t have the same level of infrastructure as
the town, but which remain classified as cities, 240 sq.km.
• 20 town panchayat, 156 sq.km.
• 214 village panchayat include 10 Panchayat Unions, 617 sq.km.
The metropolitan area (CMA) therefore includes the Chennai district,
which corresponds to Chennai city (CMC), as well as parts of the districts of
Thiruvallur (58% of this population) and of Kancheepuram (38.6% of this

97
population). Map 4.10 shows the administrative units in Chennai Metropolitan
Area. Out of the ten Panchayat Unions, 6 Panchayat Unions come under
Tiruvallur District and are covered in Taluks Ambattur (2 Panchayat unions),
Ponneri (2 Panchayat unions), Tiruvallur (1 Panchayat union), Poonamallee (1
Panchayat union). The other four Panchayat unions come under Kanchipuram
district and are covered under Taluks Sriperumbudur (2 Panchayat unions),
Tambaram (1 Panchayat unions) and Chengelpet (1 Panchayat unions).
Figure 4.1 Administrative units of Chennai Metropolitan Area
Figure 4.1 shows the administrative units in Chennai metropolitan units
in Chennai Metropolitan Area (CMA). Tables 4.5 to 4.16 give the details of
administrative units in Chennai Metropolitan Area (CMA)

98
Map 4.10 Administrative units in Chennai Metropolitan Area

99
Table 4.5 List of municipalities and town panchayats in CMA
Municipalities Town panchayats
1. Kathivakkam 1. Minjur
2. Thiruvottiyur 2. Chinnasekkadu
3. Madhavaram 3. Puzhal
4. Ambattur 4. Naravarikuppam
5. Avadi 5. Tirunindravur
6. Poonamalle 6. Porur
7. Tiruverkadu 7. Thirumazhisai
8. Maduravoyal 8. Mangadu
9. Valasaravakkam 9. Nandambakkam
10. Alandur 10. Meenambakkam
11. Ullagaram-Puzhithivakkam 11. Kundrathur
12. Anakaputhur 12. Thiruneermalai
13. Pammal 13. Perungulathur
14. Pallavaram 14. Peerkankaranai
15. Tambaram 15. Chitlapakkam
16. Manali 16. Sembakkam
17. Madambakkam
18. Perungudi
19. Pallikkaranai
20. Sholinganallur
Table 4.6 List of Panchayat Unions in CMA
Panchayat Unions No. of Villages Taluk District
Minjur 4 Ponneri
Tiruvallur Sholavaram 41
Puzhal 28 Ambattur

100
Villivakkam 25
Thiruvallur 1 Tiruvallur
Poonamallee 42 Poonamallee
Kundrathur 30 Sriperumbudur
Kanchipuram Sriperumbudur 4
St.Thomas Mount 33 Tambaram
. Kattankulathur 6 Chengalpattu
Tables 4.7 to 4.16 show the villages coming under CMA.
Table 4.7 Villages in the Panchayat Union of Minjur in Ponneri Taluk
1. Vallur 3. Ennor
2. Athipattu 4. Nandiyambakkam
Table 4.8 Villages in the Panchayat Union of Sholavaram in Ponneri Taluk
1. Alamadi 21.Sholavaram
2.Attanthangal 22.Palayaerumaivettipalayam
3.Vijayanallur 23.Erumaivettipalayam
4.Sembilivaram 24.Athur
5.Siruniyam 25.Karanodai
6.Pannivakkam 26.Sothuperumbedu
7.Padiyanallur 27.Orakkadu
8.Southapakkam 28.Surapattu
9.Melsingilimedu 29.Sekkanjeri
10.Perungavur 30.Nerkundram
11.Edayanchavadi 31.Girudalapuram
12.Vichoor 32.Pudur
13.Vellivoyal 33.Nayar
14.Thirunilai 34.Mahfuskhanpettai

101
15.Kodipallam 35.Pudupakkam
16.Arumandai 36.Periyamulaivoyal
17.Kandigai 37.Chinnamulaivoyal
18.Marambedu 38.Valuthugaimedu
19.Kummanur 39.Madaiyur
20.Angadu 40.Seemapuram
41.Nallur
Table 4.9 Villages in the Panchayat Union of Puzhal (Ambattur Taluk)
1.Sadayankuppam 15. Alinjivakkam
2.Kadapakkam 16. Payasambakkam
3.Ariyalur 17. Chettimedu
4.Thiyambakkam 18.Vadaperumbakkam
5.Sandrambakkam 19.Kosapur
6.Sirugavoor 20. Elanthancheri
7.Vilangadupakkam 21. Mathur
8.Palavoyal 22. Manjambakkam
9.Thiruthakiriyampattu 23.Vittakkupatti
10.Layon Pullion 24.Surapattu
11.Athivakkam 25. Kathirvedu
12.Vadagari 26. Puthagaram
13.Tundakalani
14.Layon Grant
Table 4.10 Villages in the Panchayat Union of Villivakkam in Ambattur
Taluk
1. Pammadukularm 14. Velacheri
2. Pottur 15. Palavedu
3. Vellanur 16. Nolambur

102
4. Morai 17. Adayalampattu
5. Pulikutti 18. Sivabudam
6. Tenambakkam 19. Chettiyaragaram
7. Melpakkam 20. Thadalam
8.Arakkambakkam 21. Vanagaram
9.Pandeswaram 22. Karambakkam
10.Kadavur 23. Ayapakkam
11.Karlapakkam 24. Nerkundram
12.Keelakandaiyur 25. Ramapuram
13.Alathur
Table 4.11 Villages in the Panchayat Union of Tiruvallur in Tiruvallur Taluk
1.Pakkam
Table 4.12 Villages in the Panchayat Union of Poonamallee in Poonamallee
Taluk
1. Sorancheri 22. Neman
2.Ayalcheri 23. Thirumalarajapuram
3.Anaikattucheri 24. Kuttambakkam
4.Kannapalayam 25. Palanjur
5.Melpakkam 26. Parvatharajapuram
6.Parivakkam 27. Narasingapuram
7.Panaveduthottam 28. Vellavedu
8.Pidarithangal 29. Melmanambedu
9.Kolappancheri 30. Mothirambedu
10.Chookanallur 31. Thirukovilpattu
11.Vayalanallur 32. Kilmanambedu
12.Thirumanam 33. Kavalcheri
13.Amudurmedu 34. Ariyappancheri

103
14.Karunakaracheri 35. Nazarathpettai
15.Nemilicheri 36. Varadharajapuram
16.Nadukuttagai 37. Mel Agaram
17.Annambedu 38. Meppur
18.Agraharam 39. Chembarambakkam
19.Sittukadu
20.Korattur
21.Nochimedu
Table 4.13 Villages in the Panchayat Union of Kunrathur in Sriperumbudur
Taluk
1. Chinnapanicheri 17.Chikkarayapuram
2. Paranipputhur 18.Kulamanivakkam
3.Kulathuvancheri 19.Malayambakam
4.Srinivasapuram 20.Kollaicheri
5.Kattupakkam 21.Thandalam
6.Goparasanallur 22.Tharapakkam
7.Ayyappanthangal 23.Rentankattalai
8.Thelliyaragaram 24.Kavanur
9.Moulivakkam 25.Sirkulathur
10.Madanandapuram 26.Nandambakkam
11.Mugalivakkam 27.Poonthandalam
12.Manaoakkam 28.Palanthandalam
13.Alapakkam 29.Thirumudivakkam
14.Gerugambakkam 30.Erumaiyur
15.Periyapanicheri 31.Varadharajapuram
16.Kovur 32.Naduveerapattu

104
Table 4.14 Villages in the Panchayat Union of Sriperumbudur in
Sriperumbudur Taluk
1. Chembarambakkam (Tank Portion) 3. Kattirambakkam (Tank Portion)
2. Daravur 4. Chettipattu
Table 4.15 Villages in the Panchayat Union of St. Thomas Mount in
Tambaram Taluk
1. Cowl Bazaar 17. Meppedu
2. Polichalur 18. Thiruvanjeri
3. Tirusulam 19. Vengavasal
4. Kottivakkam 20. Kasapapuram
5. Palavakkam 21. Vengambakkam
6. Neelangarai 22. Agaramten
7. Injambakkam 23. Kovilancheri
8. Karapakkam 24. Chittalapakkam
9. Okkiyamthuraipakkam 25. Maduraipakkam
10. Medavakkam 26. Mulacheri
11. Nenmangalam 27. Ottiyampakkam
12. Kulathur 28. Arasankalani
13. Mdipakkam (excluding
Puzhithivakkam) 29. Perumbakkam
14. Perundavakkam 30. Perumbakkam
15. Muvarasampatti 31. Jalladampettai
16. Mudichur 32. Semmancheri
33. Uthandi

105
Table 4.16 Villages in the Panchayat Union of Kattankolathur in Chengelpet
Taluk
1. Mannivakkam 4.Nedunkundram
2.Vandalur 5.Puthur
3.Kilambakkam 6.Kulapakkam
4.6 DELIMITING THE STUDY AREA
Since the focus are of the research is in Peri Urban Areas of CMA, the
researcher wanted to identify PUAs of CMA based on which the study area
can be delimited. The census data pertaining to the village which falls under
CMA has been collected for four decades (1971, 1981, 1991, 2001) from
Census of India from their office at Rajaji Bhavan. While going through the
census data, it was observed that some villages in CMA had upgraded into
census towns as per the census of India. A few others had merged into other
neighbouring villages for administrative purposes while some others merged
with upgraded town Panchayats and few have merged with municipalities.
When the new city limit was drawn, a few other villages, had fallen into the
new city limit. Hence, there rose a need to delimit the study areas.
The study area has been delimited based on the justification given
below:
Settlements which are fully urbanized in CMA are not taken into
consideration while delineating the PUAs for the study purpose. Chennai city,
which is fully urbanized, is not taken for the study. Municipalities like Avadi,
Ambattur and Town panchayats like Sholinganallur, Mangadu, and Porur
coming under CMA were not considered, since these areas are also fully
urbanized. Also, areas which are classified as towns as per Census 2001 are
not considered. Also, the settlements which are still having the characteristics
of only rural (village) are not considered for the study purpose, since there are
not many changes in the decennial population growth, employment and

106
infrastructure facilities for them. After omitting the above, The Peri Urban
Areas of CMA has been delimited.
Map 4.11 shows the delimited PUAs of CMA considered for study
purpose.
Map 4.11 Delimited PUAs in CMA

107
The data collected from the census with regard to the delimited areas
has been closely observed. While going through the census data, it was
observed that physical, social and economical changes taken place are not
uniform in these areas. These characters are varying in these areas from lower
to higher. Therefore, there was a need to categorise these PUAs based on their
growth as fast/medium/slow. They were classified as fast growing, medium
growing and slow growing. The criteria considered for categorization has been
listed in the Table 4.17.
Table 4.17 Parameters considered for delimiting the study area
Criteria Fast growth Medium
growth Slow growth
Population growth 100% 50-100% 0-50%
Density High
(>2000/sq.km)
Medium
(1000-2000/sq.
km)
Low
(<1000/sq.km)
Health Available Not available Not available
Education HSS/College HSS/Secondary Primary
Literacy >75% 60-75% <60%
Workers (Non-
agricultural) >75% 60 - 75% <75%
Land use change Major changes Moderate
changes Not much
The delimited Peri Urban Areas are shown in Map 4.11. The delimited
peri urban areas in CMA categorized as fast/slow/medium growing are shown
in Map 4.12 and Table 4.18.

108
Map 4.12 Chennai Metropolitan Area (delimited PUAs categorized as
slow/medium/fast growing)

109
Table 4.18 Delimited Peri Urban Areas in CMA with categorization as
fast/medium/slow growing
Fast Growing Medium Growing Slow Growing Panchayat
Union
Mannivakkam
Puthur Kilambakkam Kulapakkam Nedungundram
Kilambakkam Kulappakam
Kattankolathur
Perumbakkam Medavakkam
Nenmangalam Arasan Kalani
Vengambakkam Mulacheri
St. Thomas Mount
Adayalampattu Vanagaram Ayapakkam
Palavedu
Morai Melpakkam Arakkambakkam Pandeshwaram Karlapakkam Keelakondaiyur Velachari
Villivakkam
Katupakkam Ayyappanthangal Gerugambakkam Kovur
Chinnapanicheri Nandambakkam Erumaiyur
Kulathuvancheri Mayambakkam Palamthandalam Naduveerampattu
Kunrathur
Puthagaram Layon Grant Sirugavoor
Vilangadupakkam Layonpullion Athivakkam Vadagari Palavayal
Puzhal
Vallur Nandiyambakkam
Minjur
Pakkam Tiruvallur

110
Alamathi Attanthangal Vijayanallur Sembilivakkam Vellivoyal Karanodai
Vichur Thirunilai Kodippallam Arumandai Marambedu Kummanur Sholavaram Erumaivettipalayam Sothuperumbedu Orakkadu Nayiar Mafuskhanpettai Pudhuppakkam Periyamullavayal Seemapuram Nallur Athur
Sholavaram
4.7 FINDINGS
After understanding about Chennai Metropolitan Area (CMA), which is the
study area, the PUAs in CMA have been delimited for the study purpose.
From the secondary data, PUAs have been further classified into fast
growing/medium growing/slow growing.
The delimited PUAs are further studied using primary data to prove the
aims, objectives and to test the hypothesis in chapter five.