chapter 5 human settlements - department of · pdf filechapter 5. human settlements. ......
TRANSCRIPT

Human settlements | 62 Human settlements | 62
Chapter 5
Human settlements
On the most basic level, the interaction of human settlements on the environment is that they extract non-renewable natural resources on the one hand and on the other, produce waste products and pollution that has to be absorbed by the natural environment.

Human settlements | 63 Human settlements | 63
Chapter 5
Contents
5.1 INTRODUCTION 5.2 THE RELATIONSHIP BETWEEN HUMAN SETTLEMENTS AND THE NATURAL ENVIRONMENT 5.3 POPULATION GROWTH AND DISTRIBUTION 5.3.1 Population growth 5.3.2 Urbanization 5.3.3 Population distribution and settlement typology 5.3.4 Rural settlements 5.3.5 Settlement distribution as a driver of environmental change 5.4 SETTLEMENT STRUCTURE 5.4.1 Sustainable settlement structure 5.4.2 Low-density sprawl 5.4.3 Housing as a driver of urban sprawl 5.4.4 From housing to sustainable human settlements 5.4.5 Transport 5.4.6 Impact of settlement structure on the state of the environment5.5 INFRASTRUCTURE 5.5.1 Infrastructure 5.5.2 The impact of the delivery and consumption of basic services on the environment 5.6 VULNERABILITY AND FOOD INSECURITY 5.7 RESPONSES 5.7.1 Breaking New Ground 5.7.2 Spatial Planning and Land Use Management Act 5.7.3 Comprehensive Rural Development and Development Programme 5.7.4 Climate Change Adaptation Plan for Rural Human Settlement 5.7.5 The National Greening Framework for Events Management and the Built Environment 5.7.6 Policy on Non-motorised Transport 5.7.7 Rapid Public Transport Networks5.8 CONCLUSION5.9 REFERENCES
5.1 INTRODUCTIONThis chapter deals with the state of South African human settlements and their impact on the natural environment. It focuses on the material conditions of the entire spectrum of human settlements from large metropoles or city regions to villages, and addresses a range of settlement elements.
On the most basic level, the interaction of human settlements on the environment is that they extract non-renewable natural resources on the one hand and, on the other, produce waste products and pollution that has to be absorbed by the

Human settlements | 64 Human settlements | 64
natural environment. As the population grows, urbanizes and consumes more, the impact of human settlements on the natural environment increases. In South Africa, as in the rest of the world, these processes present a considerable challenge to governments and much effort is placed on creating sustainable human settlements.
Urban and rural sprawl, housing demand, modes and character of transportation and basic service infrastructure, are the physical elements of human settlements that have the most noticeable impact on the natural environment and are the focus for the creation of more sustainable human settlements with a reduced ecological footprint.
The challenge is even greater in South Africa where the apartheid legacy left us with a distorted settlement form that amplifies unsustainability and to change the inherent settlement form remains one of the most challenging issues facing the government. The often conflicting demands of social and economic needs on the one hand, and environmental needs on the other, needs to be balanced. South African settlements are in a unique situation due to historical patterns, driven by a political ideology of separate development, selected under-development and restricted urbanization, which have created a legacy of unsustainable, inefficient, inequitable and wasteful settlements (DHS 2009; Financial and Fiscal Commission 2011). The challenge presented to government is to find a balance between ecological unsustainability and socio-economic inequalities.
Much has been done to redress apartheid settlement patterns and form towards greater equity and sustainability since 1994, especially on the policy front. However much still remains to be done.
5.2 THE RELATIONSHIP BETWEEN HUMAN SETTLEMENTS AND THE NATURAL ENVIRONMENTHuman settlements are of extreme social and economic importance. In South Africa, they generate more than 90 per cent of all economic activity and house over 70 per cent of the total population (CSIR 2011). Although they cover only seven per cent of the total area of the country, their environmental impact is huge.
The relationship between human settlements and the natural environment or ecological systems is complex, iterative and continually changing. The natural environment provides the basic elements that human beings need to survive such as food, water and shelter (Box 5.1). In the process of harvesting the natural resources, human beings impact on the environment by overuse or exploitation of non-renewable resources and through the production of waste materials and pollution e.g. greenhouse gasses, ozone-depleting substances and hazardous materials. This leads to a degradation of the very environment that human beings depend on.
The impact of human settlements on the environment increases with population growth, settlement expansion, economic growth and increased consumption. All indications are that the impact of human settlements on environmental
resources is increasing. The ecological footprint1 of South Africa for instance, has increased from 2.32 ha worth of natural resources per person in 2010 to 2.59 ha in 2012 (WWF 2012). This is however still lower than the world average of 2.70 ha (Chapter 2: Sustainability in South Africa).
Box 5. 1: Settlements and the water cycle
An example of the impact of human settlements on the environment can be found in the water cycle. Human settlements reduce evaporation from 40% to 30%, reduce infiltration of water to underground aquifers from 50% to 15%, and increase run-off from 10% to 55%. The implications of these figures for replenishment of underground water (an important source of drinking water for humans) and for increased flooding is evident.
5.3 POPULATION GROWTH AND DISTRIBUTION
5.3.1 Population growthThe population size of South Africa has increased from 40.6 million in 1996 to 51.8 million in 2011 (28 per cent), just over 11 million people. It is the 24th largest country in the world as far as population numbers are concerned, but only the 169th biggest in the world for density (41.4 people/km2) illustrating the country’s sparseness of population distribution. The population is expected to grow to over 70 million by 2050 (World Population Review 2013).
The average annual per cent change in the population, results from a surplus (or deficit) of births over deaths and the balance of migrants entering and leaving the country. The growth rate is a factor in determining how great a burden would be imposed on a country by the changing needs of its people for infrastructure (e.g. schools, hospitals, housing and roads), resources (e.g. food, water and electricity) and jobs.
The annual population growth rate in South Africa declined between 2003 and 2007, but increased rapidly in 2008 to 0.83 per cent. In 2012, the growth rate was -0.41 per cent (IndexMundi 2016) (Figure 5.1).
1 An ecological footprint is a measure of how much biologically productive land and water a person needs in order to produce everything he or she consumes, and absorb his or her waste.

Human settlements | 65 Human settlements | 65
Figure 5. 1: Population growth over timeSource: IndexMundi (2016)
Table 5. 1: Distribution of population per province
Province Census 2011 Per cent of total population
Per cent population change 2001-2011
Western Cape 5,822,734 11.3 29
Eastern Cape 6,562,053 12.7 5
Northern Cape 1,145,861 2.2 16
Free State 2,745,590 5.3 1
KwaZulu-Natal 10,267,300 19.8 7
North West 3,509,953 6.8 18
Gauteng 12,272,263 23.7 31
Mpumalanga 4,039,939 7.8 20
Limpopo 5,404,868 10.4 8
South Africa 51,770,560 100.0 16
Source: StatsSA (2012a)
The South African population is not only growing through natural growth but also immigration. Although no clear figures are available, there is an indication that the rate of immigration is increasing; in 2008 over 200,000 refugees applied for asylum in South Africa, more than four times the number declared the year before.
Population growth differs markedly between the different provinces. The highest growth rate between 2001 and 2011 was in Gauteng and the Western Cape, and the lowest in the Free State, the Eastern Cape and KwaZulu-Natal (Table 5.1).
The two provinces most affected by out-migration in terms of inter-provincial migration are Limpopo and the Eastern Cape.
The highest inflow of immigrants is to the North West and Mpumalanga. Of those that were born outside North West, 20 per cent were born outside South Africa. In Mpumalanga 19 per cent were born outside the country.
5.3.2 UrbanizationIn line with international standards, the South African population is increasingly becoming urbanized. According to the World Bank (2013), two-thirds of South Africa’s population now lives in urban areas and the proportion of people living in urban areas increased from 52 per cent in 1990 to 62 per cent in 2011. Urbanization rates increased rapidly after 1994 as restrictions on the movement of the population were abolished.

Human settlements | 66 Human settlements | 66
The urban population growth rate was 2.13 per cent in 2012 and the rural rate was 0.11 per cent. Rural areas had a negative population growth rate between 2005 and 2009 (Trading Economics 2013).
5.3.3 Population distribution and settlement typologySouth African settlement typology consists of a range of urban and rural settlements and the lines between these are often obscured.
The distribution of settlements reflect the distribution of natural resources, levels of accessibility and apartheid spatial policies, that limited free movement of people. Apartheid policies prevented normal urbanization processes from taking place and which has left a profoundly uneven landscape
(DEA 2011a). The impact of the designation of ‘townships’ and ‘homelands’ are still some of the main features of South African settlements as these spatial patterns have become entrenched over time.
The largest settlements are located in Gauteng and along the coast. The Eastern Cape (specifically the eastern coast and inland areas) and KwaZulu-Natal (specifically the northern areas) are characterized by large numbers of dense rural settlements and a number of towns that are fulfilling a limited regional service role. In Limpopo, North-West and Mpumalanga there is a network of towns, regional access corridors, as well as clustered and dispersed settlements, in many instances related to mineral resources. The Northern Cape has the lowest number of settlements due to inhospitable conditions (NPC 2011a) (Map 5.1).
Map 5. 1: Distribution of human settlements in South AfricaSource: NPC (2011b)
There is a trend towards increased spatial concentration and agglomeration, meaning that urban areas, especially the larger towns and cities, are growing and the smaller towns are declining in population as people are migrating in search of jobs and access to services and facilities.
Urban settlements accommodate the bulk of the population (68 per cent2) and make the biggest contribution to national economic activity (86 per cent) on the smallest land area (seven per cent). In contrast, rural settlements accommodate 25 per cent of the population, occupying more than eight
2 Figures differ from that of the World Bank due to different categorizations of what constitutes urban and rural.
per cent of land area, but make the smallest contribution to the national economy (six per cent). Farms and other land uses make up the bulk of land area (85 per cent), house only seven per cent of the population and contribute 8.3 per cent of national economic activity. Based on these figures, urban areas are seen as the engines of growth and are critical to economic progress in the country (Table 5.2 and Map 5.2).

Human settlements | 67 Human settlements | 67
Table 5. 2: Distribution of population, economic activity for urban and rural settlements
SA Settlement types Per cent of national population
Per cent of national economic activity
Per cent of national land area
Urban settlements 68.10 85.80 6.80
Rural settlements 25.20 5.90 8.40
Farms/rest of South Africa 6.70 8.30 84.80
TOTAL 100.00 100.00 100.00
Source: NPC (2011a)
Map 5. 2: Population density in South AfricaSource: Nation Master (2013)
5.3.3.1 Urban settlements
A typology of settlements particular to the unique South African circumstances has been developed and forms the basis for the interventions of the NDP. The typology includes a range of settlements from urban to rural.
Urban settlements are divided into ‘city-regions and cities’ and ‘towns’. Towns are further differentiated as regional service centres, service towns or local niche towns (CSIR 2011) (Table 5.3).
Table 5. 3: Distribution of population, economic activity and area for urban settlements
Per cent of total Population Economy Area
City-regions and cities 40.0% 62.0% 2.0%
Regional service centres 14.8% 13.9% 1.7%
Source: NPC (2011a)
5.3.3.2 City-regions and cities
A city is defined as being home to more than 400,000 people, comprising significant and multi-nodal economies, and also significant economic and public service functions. A city-
region usually consists of a conurbation of settlements with multiple administrative districts, but sharing resources such as a central business district, labour market or transport network.
Nine city-regions and cities have been identified: the city-regions are Gauteng, the City of Cape Town, eThekwini and Nelson Mandela Bay, and the cities are Mbombela (Nelspruit), Buffalo City (East London), Polokwane, Mangaung (Bloemfontein) and Msunduzi (Pietermaritzburg). They accommodate the bulk of the national economy (62 per cent) on a minimal portion of land.
The populations and size of cities and city-regions have been growing rapidly due to natural growth and in-migration and urbanization. Migrants move to these settlements mostly in search of jobs but also in search of housing and social facilities. The growth and in-migration of mostly poor and young people have created a contradiction where cities have high employment rates and household income but also large numbers of people living in poverty, the so-called urbanization of poverty. This contradiction can also be observed for service provision where a large per centage of the population has access to services but large backlogs exist, especially in absolute numbers (CSIR 2008).
5.3.3.3 Regional service centres
Regional service centres are medium and higher-order settlements that are prominent service centres within particular hinterlands (CSIR 2008).
Regional service centres include:• Large (in terms of population) towns in former ‘homelands’
with a large number of dispersed rural settlements surrounding them (e.g. Mthatha in the Eastern Cape and Thohoyandou in Limpopo). Their economies are mostly based on government and community services and they resultantly have high dependency ratios and levels of poverty;
• Towns in resource rich areas (e.g. Rustenburg in the North-West Province, Middelburg and Secunda in Mpumalanga); and,
• Towns playing key service roles within more isolated areas (such as Upington and Springbok in the Northern Cape) (CSIR 2008).

Human settlements | 68 Human settlements | 68
The most rapid growth has taken place in South Africa’s smaller cities, mostly due to small initial populations and increasing economic activity. Polokwane (Pietersburg), Rustenburg, Vanderbijlpark, and Mbombela (Nelspruit) are some of the fastest-growing urban areas, with average annual population growth rates of between 1.6 per cent and 2.9 per cent over the last decade, compared to Cape Town with a rate of 1.4 per cent.
Large towns (the first-category towns) continue to grow mostly due to natural population growth but also from inflow of population from their rural hinterlands. Resources also play a role in growth: where resources are depleting, the towns are rapidly depopulating, whereas in areas of growing resource exploitation populations are growing exponentially.Furthermore, settlements regional service centres located on key regional access routes and corridors are typically marked by higher rates of growth, both in terms of population and economic opportunities (CSIR 2008).
5.3.3.4 Service towns and local niche towns
Service towns and local niche towns are smaller towns that are mostly fulfilling the role of service centres within a local area or region. They fulfil a function or service:• Within their direct vicinity (e.g. Giyani in Limpopo);• For a broader community on particular corridor/access
routes (e.g. Estcourt in KwaZulu-Natal or Malmesbury in the Western Cape); or,
• Of a particular niche role such as tourism (i.e. Clarens in the Free State).
The fortunes of these settlements vary from high economic growth rates (typically tourist niche towns such as Prince Albert in the Western Cape), or high population growth (typically places on access routes such as Alice in the Eastern Cape) to decline mostly associated with economic stagnation/population decline in the surrounding area, such as Koppies in the Free State province (CSIR 2011).
5.3.4 Rural settlementsClustered and dispersed settlements include rural nodes and clusters, which are typically clusters of settlements with very limited service roles and densely settled rural areas/dispersed rural settlements which characterize the former ‘homeland’ areas and are often under traditional land ownership (CSIR 2008). The economy of many of these settlements is based on remittances, grants and subsidies.
5.3.5 Settlement distribution as a driver of environmental changeThe South African population is growing and urbanising. They are concentrating in large cities and towns looking for work, housing and basic services and access to health and education facilities. A large portion of the population growth is focused in towns experiencing economic growth (often through resource exploitation) and those located on main access roads. Many of the migrants are poor and unemployed, creating marked inequalities and presenting service delivery challenges.
Although urbanization is generally seen as a positive process as it is associated with economies of scale, economic growth,
higher incomes and higher educational levels, large growing settlements can also negatively impact on the environment (Box 5.2). For example:• Large cities and towns use extensive land areas, which
alter the natural state of land, degrade environmental integrity, fragment ecosystems and threaten biodiversity. Outward sprawl also destroys valuable agricultural land;
• They place high demands on non-renewable resources and have high water and energy needs. As a case in point, the Gauteng State of the Environment Report states that many of the water resources within Gauteng are under stress from an increased demand for human and commercial water consumption, coupled with poor management of water quality and degradation of river and wetland ecosystems;
• They produce large amounts of solid waste, air pollution and water pollution and contribute to greenhouse gasses; and,
• They alter natural water cycles due to high per centages of impenetrable surfaces. This also increases stormwater run-off and downstream flooding.

Human settlements | 69 Human settlements | 69
Continued population growth is putting pressure on the natural environment not only in the largest cities and towns but also in the densely populated rural areas, a remnant of the homeland policy. According to the Council for Scientific and Industrial (CSIR) (2008), sprawling rural settlements have a serious impact on water dependency, biodiversity, carbon emissions, waste and energy. Land degradation is caused by a combination of unemployment, poverty, and an absence or failure of land use regulation.
The resultant land degradation threatens the local resource base upon which rural communal livelihoods depend.
These large sprawling settlements do not only impact on the environment but as their size increases they also become more vulnerable due to their dependency on natural resources and risk for disaster.
The negative impact of settlements on the environment is however not a foregone conclusion and can be mitigated by timeous planning, on-going management and a move towards alternative, more sustainable solutions to basic services. Several pieces of legislation and strategies have been put in place to address these issues as is discussed in Section 7 of this chapter.
5.4 SETTLEMENT STRUCTURESettlement structure refers to the physical size of settlements, their density profile, the intensity and mix of activities and transport patterns.
According to the Financial and Fiscal Commission (FFC 2011), “by international standards South African cities are inefficient due to low-density development, high travel costs, long distances to and from places of work and high carbon footprints.” They recommended that “the government pursue development of a spatially compact urban form.”
This inefficient settlement form can be ascribed to:• Apartheid planning that aimed to separate different race
groups spatially thus creating large buffer areas within settlements; and,
• Modernist planning approaches that favour introverted suburban type development with single houses on single stands planned around private transport.
5.4.1 Sustainable settlement structureSettlement structure is a driver of environmental change as it influences the amount of natural land that is converted into human habitation, the demand for non-renewable natural resources and the production of pollution and waste.
Low-density, mono-functional and sprawling settlements are seen as unsustainable from an environmental perspective as they:• Consume large amounts of land, often land that is
ecologically important or high-potential agricultural land;• Generate multiple and long travelling distances, often by
private car, which increases pollution, specifically carbon dioxide emissions;
• Make travelling by public transport or non-motorized transport difficult or impossible; and,
• Are also perceived as contributing to high fiscal costs for the provision of infrastructure and services.
In contrast, compact cities that have high population densities and a mix of land uses, and where land use and public transportation are integrated, are seen as sustainable as they are more resource efficient, offer opportunities for developing economies of scale to reduce resource consumption and consume less land.
A transition to higher levels of residential density within cities is viewed as a means of achieving a number of key environmental objectives and greater functional efficiencies. According to Newton (2006), higher densities of urban development are associated with:• Reductions in per capita demand for land;• Reductions in the rate of loss of biodiversity as a result
of lower rates of conversion of green space to residential use;
• Fifty per cent reductions in levels of operating energy in housing; also significant reductions in lifecycle energy use and greenhouse gas emissions;
• Reductions in water consumption due to less outdoor water use (such as for gardens and swimming pools);
• Reductions in the volume of building materials consumed (medium-density housing has two-thirds the material intensity of detached single family housing);
• Reductions in solid and municipal waste generation;• Improved human health as a result of decreased car use
and greater pedestrian activity; and,• Reduction in the amounts of energy consumed and
greenhouse gases emitted through travel.
The move from low-density, fragmented, mono-functional human settlements to more compact and sustainable settlements that are integrated on all levels is proposed in all planning legislation. An example of how this is being done is presented in Box 5.3.

Human settlements | 70 Human settlements | 70
Box 5. 3: Protection and sustainable management of Durban’s natural resource base
Durban is located in an area of significant biodiversity on the east coast of the African continent and the eThekwini Municipal Area contains examples of four of the country’s nine terrestrial biomes, namely Savannah, Forest and Grassland and Indian Ocean Coastal Belt. While the aquatic environment includes both freshwater and marine habitats (18 river catchments and 97 km of coastline), Durban is also the largest port and urban area on the east coast of Africa, and has a population of just over 3 million.
Durban recognized the contribution that open spaces can make to sustainable urban development, and that Durban’s varied ecosystems provide important life-sustaining environmental services. The city authorities identified and conducted an economic valuation of those environmental services which helped inform the appropriate management and resourcing of Durban’s urban open space system.
From the research undertaken by the Environmental Management Department, it is clear that natural ecosystems provide a broad range of environmental goods and services to the city of Durban, including climate regulation, water regulation, gas regulation, water supply, erosion control, soil formation, nutrient cycling, waste treatment, biological control, food production, natural products and genetic resources. Durban’s ecosystems are also of social, recreational, aesthetic and economic value, and contribute towards human well-being.
Challenges to the conservation of ecosystems and biodiversity in Durban include land transformation (around 60% of the city’s 2,291 km2 has been transformed by urban and rural development), invasive alien plants, pollution and unlicensed and uncontrolled mining, especially in rivers and surrounds for sand for building, and the over-harvesting of fauna and flora.
eThekwini Municipality has reacted with creative and innovative strategies to address these environmental challenges, and in so doing has enhanced social and economic benefits. Resource economics used to ensure long-term ecological viability in the city and eThekwini municipality has pioneered the use of resource economics in designing its open space system. The natural resource base is regarded as ‘platform infrastructure’ i.e. providing a range of environmental goods and services critical in meeting the basic needs and quality of life aspirations of the city’s residents. The design of the eThekwini Environmental Services Management Plan (EESMP) was therefore influenced by the need to secure a sustained supply of these environmental goods and services. Resource economics was used as a tool to value Durban’s open spaces and this information was then used to determine which portions of the city’s natural-resource base should be incorporated into the EESMP to ensure long-term ecological viability and the sustained delivery of environmental goods and services. Dr Roberts reported that the replacement value (as calculated in 2003) of the environmental services delivered by the resulting open
space system is conservatively estimated at R3.1 billion per annum (or approximately 440 million US dollars). This case highlights the significance of environmental goods and services in ensuring the city‘s financial and environmental sustainability.
The municipality is also pioneering the use of a broad range of tools in implementing the EESMP, including a dedicated land acquisition budget, the use of environmental servitudes to regulate development, the use of green by-laws which are currently being drafted, and a green Special Rating Area is being worked on to protect and sustainably manage what will be Durban’s largest protected natural area.
Source: UNEP (2007)
In the following section, low-density sprawl and transportation patterns as elements of South African settlement structure are discussed.
5.4.2 Low-density sprawlSouth African settlements are characterized by extreme low densities and sprawl. The densest settlement in South Africa is Johannesburg, which has a population density of 20.9 people per hectare (ha), followed by eThekwini, with 14 people per hectare (FFC 2011). Examples of international settlement densities are London at 62 people per hectare, Rio de Janeiro at 101 people per hectare and Moscow at 182 people per hectare.
Map 5. 3: Distribution of densities in the City of JohannesburgSource: GCRO (2011)

Human settlements | 71 Human settlements | 71
Low-density sprawl is not limited to urban settlements but also prevalent in rural settlements. For example, in uMkhanyakude District in KwaZulu-Natal the population density is less than one person per hectare despite hardly any of the population being involved in agriculture (uMkhanyakude District Municipality 2011).
It is, however, not only the low densities per se that are problematic, but also the distribution of densities. South
African settlements are characterized by higher densities located on the outskirts of the settlement (due to factors discussed in the following section). In the Johannesburg city region for example, the highest densities are located some 30 km outside of the city centre (Bertaud 2004). This increases the inefficiency of settlements as distances from dormitory suburbs to places of employment increase, as well as the number of people that have to commute over long distances (Map 5.3 and 5.4).
Map 5. 4: Distribution of densities in GautengSource: GCRO (2013)
Figure 5. 2: Housing typeSource: StatsSA (2012b)

Human settlements | 72 Human settlements | 72
5.4.3 Housing as a driver of urban sprawlHousing is one of the key drivers of sprawl and low densities as it is the predominant land use in human settlements.
Housing demand is driven by population growth, migration, household formation and income. The average household size in South Africa decreased from 4.5 in 1996 to 3.6 in 2011. A decrease in household size coupled with an increase in population size indicates a growth in household formation and thus an increase in the demand for housing (StatsSA 2012a).The situation with regards to housing has improved steadily over the past few decades. There has been a steady increase in the per centage of households living in formal dwellings over time from 65.1 per cent to 77.6 per cent; the per centage of households living in traditional dwellings halved, while the per centage of households living in informal dwellings has decreased from 16.2 per cent in 1996 to 13.6 per cent in 2011 (Figure 5.2).
5.4.3.1 Medium to high income housing
Since the 1990s, South African cities expanded rapidly with medium to higher income housing development by the private sector. Whereas higher income housing traditionally consisted mostly of single houses on relatively large stands, often in excess of 1,000 m2, there is currently a definite trend towards more compact and dense living. Between 2003 and 2008 the proportion of flats and townhouses increased with the proportion of single houses declining. The proportion of units larger than 80 m2 decreased over the same time (SAIRR 2009).
Although the densification of middle-income housing is a positive trend towards potentially more compact settlements and greater sustainability, the type of development and its locality remains problematic.
Higher densities are mostly in the form of walled cluster developments on the periphery of the settlement. These developments have a very high land coverage creating hard surfaces with almost no open space in between as can be seen in the example of a development on the eastern edge of the City of Tshwane (Figure 5.3). This prevents the recharge of aquifers, increases the run-off of polluted water and potential flooding down-stream, amongst others.
Figure 5. 3: Example of the high coverage of medium income housingSource: Google Earth (2012)
Also problematic is the trend towards lifestyle estates. These are often located in pristine natural contexts due to the aesthetic appeal of the natural environment on the periphery of the city, contributing to sprawl. Despite relatively low population densities, ecological damage occurs especially where essential or scarce environmental resources, such as prime agricultural land or water, are in short supply or under pressure (Pelser & Redelinghuys 2009). These estates, especially when coupled with golf courses, have been described as green deserts, due to their lack of environmental value despite the seemingly natural environment. Large volumes of water and fertilizers are needed to maintain the sought after green environment.
The locality of medium to higher income housing developments on the periphery of the settlement generates large amounts of private transport trips linked with increased use of non-renewable resources and pollution, and places strain on basic service provisioning.
5.4.3.2 Subsidized housing
The change to a democratic government in 1994 brought a subsidized housing programme to address housing demand. According to the Constitution, Chapter 2: Bill of Rights, Section 26, everyone has the right to have access to adequate housing and the state must take reasonable legislative and other measures within its available resources, to achieve the progressive realization of this right.
The output has been remarkable with an average of 250,000 subsidized housing units being delivered annually since 2004, while private housing delivery was only about 70,000 units per year (SAIRR 2009). By 2010, almost 20 per cent of South African households were living in a subsidized dwelling, while a further 13 per cent had at least one household member on a waiting list for subsidized housing (StatsSA 2010a).
The typology of subsidized housing is mostly one-house-on-a-plot development and most likely located on the urban periphery far from job opportunities and further contributed to sprawled settlements (Smit et al. 2011). The early-generation policy merely replicated apartheid-style housing as is illustrated in Figure 5.4 (Ndaba 2008). However, the focus has changed from building houses to the developing of integrated settlements (e.g. the Breaking New Ground Policy) based on an acknowledgment that, while subsidized houses were the first step towards housing millions of South Africans who had been left without adequate shelter, the outcomes were flawed.
Figure 5. 4: Example of subsidized housingSource: Google Earth (2012)

Human settlements | 73 Human settlements | 73
5.4.3.3 Informal housing
Informal housing has become a feature of most South African settlements as the population migrates in search of housing, jobs, and education and health facilities. Two of the provinces that have among the highest per centage of informal dwellings are Gauteng and the Western Cape, both of which have high in-migration rates. Although the national per centage of informal dwellings decreased from 14.9 per cent in 2007 to 13.6 per cent in 2011 (Table 5.4), by 2013, 232,229 households have been provided with services; 58 per cent of the 2014 target (The Presidency 2013).
Table 5. 4: Per centage of households living in informal type of dwellings by province
Year
Province
WC EC NC FS KZN NW GP MP LP RSA
1996 16.7 11.2 12.8 26.2 11.1 23.4 24.1 14 5.3 16.2
2001 16.2 11.2 11.3 26.1 10.7 22.9 23.9 14.5 7.1 16.4
2007 14.3 8.1 10.9 19.5 8.9 24.8 23.6 12.1 5.7 14.9
2011 18.2 7.7 13.1 15.7 8.3 21.2 18.9 10.9 5.2 13.6
Source: StatsSA (2012a)
Informal settlements are often located in the least desirable or environmentally compromised areas such as within floodlines, on dolomitic land and next to mine dumps as the Gauteng examples in Figure 5.5 shows. This is often the only available land in relatively well-located areas.
Up to 50 per cent of all informal dwellings in South Africa can be classified as Vulnerable to environmental factors (DEAT 2007). Not only are the lives and possessions of the residents threatened by environmental factors, but the informal settlements also contribute to environmental degradation. Environmental impacts are mostly due to the sensitivity of the areas that are occupied as well as the lack of infrastructure which leads to tree felling and the pollution of ground water due to untreated sewage and dumping (Pelser & Redelinghuys 2009). Fires are also a risk to informal dwellings due to high densities, the use of flammable substances for cooking and heating and the makeshift materials used for shelter.
Figure 5. 5: Informal settlement next to a mine dumpSource: Design Observer Group (2012)
A growing trend is the development of informal and illegal backyard rental units. This is manifested in well-located formal areas such as inner cities as well as in low-income areas. According to the 2006 General Household Survey, of the 2.4 million households who rent their primary dwellings, almost 520,000 of them (21 per cent) live in informal units. The 2007 Community Survey estimates a total of 420,000 households who rent informal units, making up 18 per cent of the total rental market. As shown in Figure 5.6, in Johannesburg alone an estimated 74,000 households lived in informal rented units in 2008 (SHF 2008).
Figure 5. 6: Number of rented informal units in large municipalities in 2008Source: SHF (2008)
Data sources differ on the extent of growth of the backyard rental market. The Social Housing Foundation (SHF 2008) found that the growth between 2002 and 2006 can be anything between three per cent and 20 per cent, depending on the data source used. The discrepancy is perhaps to be expected given the informal nature of these dwellings and the difficulties in identifying them given their location in backyards. Despite the difficulty with data collection, it is clear that this sector is large and growing.
5.4.4 From housing to sustainable human settlementsThe challenge for the creation of sustainable settlements goes further than only the provision of housing. This is recognized by Government. Following President Jacob Zuma’s proclamation in 2009 to change the Department of Housing to the Department of Human Settlements, the focus shifted from “housing being just a roof over people’s heads, to providing sustainable and integrated human settlements where people can work, pray, play and have access to amenities required for their day-to-day living.”
The mission of the Department of Human Settlements is therefore to facilitate the creation of sustainable human settlement and improve the quality of household life (DHS 2012).
The relatively small town of Verkykerskop (Box 5.4) demonstrates how efforts have been made to achieve this goal.

Human settlements | 74 Human settlements | 74
Box 5. 4: Verkykerskop: Small-scale agricultural town
The Verkykerskop Master Plan was commended for its sustainable approach. The Verkykerskop site is located at the crossroads between a historic livestock route and a new tar road on the Free State provincial tourism thoroughfare, the Moloto tourist corridor. The scenic natural topography with its ancient rock formations, ancestral rock paintings and prominent farming history is now nestled between areas of commercial and small-scale subsistence farming.
Rather than spreading the proposed town along the north-south livestock route or east-west vehicle thoroughfare, careful insertions between farmland, existing buildings with dormant infrastructure, livestock and horse holding areas, historic gravesites, look-out points and watersheds were made. The ’uitspanning’, a local word meaning ‘a space of assembly after a long migration with livestock’, is proposed as the main node and public space. Lying at the centre of the 43 ha site, it is destined to be the main congregation, cultural and economic activity space for an anticipated 1,500 people. The development’s noble program of 300 mixed-income residences, most with their own intensive home farming opportunities, and the peripheral 35 ha farm/conservation land is matched by a broad complement of civic uses, including two small farm schools with a digital library, a day clinic, meeting halls and pension pay-points, shops, artist’s residences, recreational facilities, farm facilities, police station, retirement cluster and boutique hotel. Adaptive reuse of existing buildings and structures allows the area to re-emerge and once again participate in the regional economy. Capitalizing on the location and its sizable farm labour force, while using the crossroad of activities to revitalize employment opportunities, this vision helps to organize and increase efficiency at the scale of a small town in the African hinterland.
The balance of built and open space at Verkykerskop does more than facilitate pleasant communal living; it integrates human development with sustainable agriculture, energy farms and environmental management in a part of Africa where informal and unplanned communities deplete natural resources and destroy the cultural/natural landscape, all with dramatic regional and national consequences. The plan allows built structures, many of them clustered around courtyards for climatic reasons, as well as fabric between open spaces suggested by the natural and cultural landscape. The master plan sets in motion the essential creation of public opportunities to live, work/farm, learn and play in direct response to the natural cues of the location – land, local vegetation and prominent views.
The master plan allows for a host of transportation options, from private automobiles and public busses to more common farm tractors, bicycles, push-and-pull carts and horses. Verkykerskop will feature a hierarchy of roads, paths and a livestock route to accommodate this diversity, from feeder vehicle roads to pedestrian corridors between the node and other smaller places of cultural and site significance. One prominent spine/visual axis with green
open space will link neighbourhoods with one another and with the natural landscape, facilitating public congregation and social engagement. Best of all, the spine/visual axis is already achieving success. Private investment has been secured to add recreational facilities such as a gymkhana track, the planting of indigenous trees, and the renewal of existing buildings to enhance commuter movement and activity along this prominent line. The newly established community forum, formed by local leaders, provincial government and stakeholders, has secured the property and development will begin shortly.
Source: CNU (2012)
5.4.5 TransportTransport is an important element in the sustainability of human settlements. It imposes a cost on the environment through carbon dioxide emissions and water pollution. It also consumes large amounts of energy. Transport is the second highest sectoral consumer of energy (27 per cent) (Figure 5.7). This energy consumption has a direct impact on the local and global natural resource base, predominantly through the ‘waste’ products: greenhouse gas emissions, local air pollution and radioactive waste. According to Sustainable Energy Africa (SEA 2006), the six South African metropolitan areas have an average carbon emissions level of 6.5 tonnes per person per year.
Figure 5. 7: Energy demand by economic sector for 2006Source: DoE (2010)
Human settlements | 75 Human settlements | 75
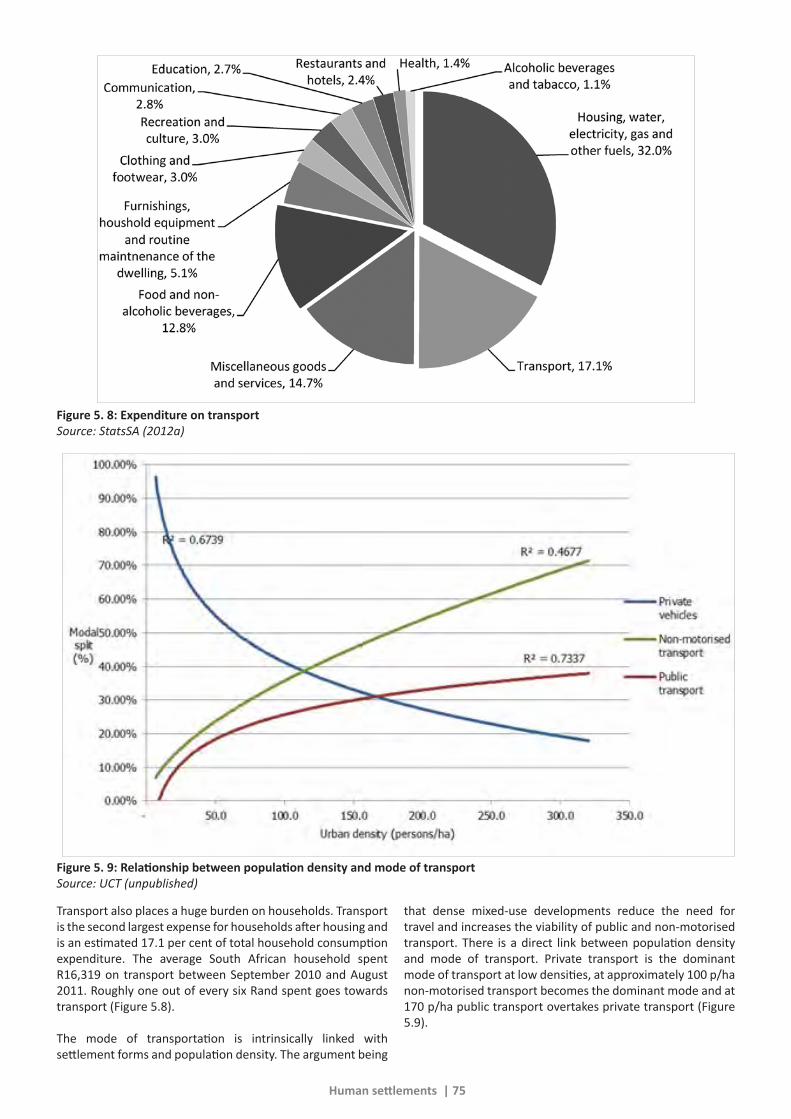
Figure 5. 8: Expenditure on transportSource: StatsSA (2012a)
Figure 5. 9: Relationship between population density and mode of transportSource: UCT (unpublished)
Transport also places a huge burden on households. Transport is the second largest expense for households after housing and is an estimated 17.1 per cent of total household consumption expenditure. The average South African household spent R16,319 on transport between September 2010 and August 2011. Roughly one out of every six Rand spent goes towards transport (Figure 5.8).
The mode of transportation is intrinsically linked with settlement forms and population density. The argument being
that dense mixed-use developments reduce the need for travel and increases the viability of public and non-motorised transport. There is a direct link between population density and mode of transport. Private transport is the dominant mode of transport at low densities, at approximately 100 p/ha non-motorised transport becomes the dominant mode and at 170 p/ha public transport overtakes private transport (Figure 5.9).

Human settlements | 76 Human settlements | 76
For local scale transport, non-motorized transport (e.g. walking and cycling) is the most sustainable as it does not consume non-renewable resources and does not pollute. This is followed by rail and road-based public transport, with road-based private transport being the least sustainable and most polluting.
The average density for the urban areas of the five largest metros in South Africa is 37 p/ha, significantly lower than optimal densities for public transport usage. Modal split is 37.5 per cent private vehicles, 38.4 per cent public transport and 24.1 per cent non-motorised transport (Table 5.5).There is a move in South Africa from public transport to private transport and from train and bus to taxi. This is highly problematic in terms of resource use and emissions.
Table 5. 5: Population density vs. modal split for metros
City
Joha
nnes
burg
eThe
kwin
i (D
urba
n)
Cape
Tow
n
Tshw
ane
(Pre
toria
)
Nel
son
Man
dela
Ba
y
Aver
age
Popu
latio
n de
nsity
(p/h
a) Entire Metro 27.0 15.0 15.2 13.4 5.9 15.3
Urban area 42.7 38.9 46.6 34.6 22.8 37.1
Mod
al sp
lit
Train 5.3 2.7 24.1 6.5 1.1 7.9
Bus 2.4 10.4 7.9 9.5 14.1 8.9
Taxi 24.6 27.0 13.3 15.3 27.8 21.6
Car 36.7 32.4 29.3 33.7 55.2 37.5
Walk 31.0 27.5 25.3 35.0 1.8 24.1
Source: UCT (unpublished)
There is a strong correlation between income and mode of transport, with a move from non-motorized to public, and finally private vehicle transport, as income increases. Only 29.5 per cent of households owned a car in 2011. The number of passengers transported decreased by 0.2 per cent in November 2012 compared with November 2011. The corresponding income increased by 14.3 per cent over the same period.
In addition to the low densities and the inverse density profile of South African settlements, as discussed previously, the increasing decentralization of jobs means that the central business districts, that are well-served by public transport, commonly are no longer the dominant core (Pillay et al. 2006). The suburbanization of jobs has taken place in areas not well-served by public transport and there is now a greater dispersion of trip origins and destinations. A lack of integration between employment and residential location has resulted in
unacceptably high commuting times and high carbon dioxide emissions. The inefficiencies of the public transport system in South Africa is reflected in the average traveling time which is 50 minutes, making public transport an inconvenient and undesirable option.
Growth in the volume of freight that is transported by road is another issue impacting on the environment. The CSIR’s 7th Annual State of Logistics Survey (CSIR 2010) shows that 88.7 per cent of all land freight tonnage is carried by road, with the remainder carried by rail. Generally, road transport costs anything between 30 per cent and 50 per cent more than rail transport. The cost to the environment is significant with 23 million tonnes of greenhouse gasses emitted in 2009 due to land freight transport activities. This amounts to 49 per cent of transport emissions and just under five per cent of total emissions for the country. Road freight contributed 20.3 million tonnes and rail 2.7 million. Therefore, growing rail’s portion of freight transport will not only make economic sense, but will also be beneficial to the environment (CSIR 2010).
The form and layout of South African cities have major implications for mobility patterns and the provision of sustainable transport infrastructure. Public transport, especially over the long distances between cities and their hinterlands has been maintained by large public transport subsidies introduced to sustain apartheid urban form.
The solution to this is integrated land use and transport planning. However, the challenges are not easily addressed and such interventions have long lead times. Several programmes and policies have been introduced in South Africa to address the improvement of public transport as an efficient and sustainable alternative for private transport. The focus is on improved public and non-motorised transport. One project has been the development of Bus Rapid Transit (BRT) systems that greatly enhance the comfort and speed of busses. The City of Johannesburg has already constructed 42.5 km of their system, the City of Cape Town 39 km, and Nelson Mandela Bay Municipality 10 km.
5.4.6 Impact of settlement structure on the state of the environmentThere are several advantages to urbanization and urban development and it is an inevitable process link to the economic growth of the country. International experience shows that residents in urban settlements generally have a higher level of education, higher income and higher levels of access to services. The negative impacts of the settlements however have to be managed and addressed by integrated planning.
South African settlement structure specifically has a marked impact on the natural environment, mostly due to low-density sprawl, reliance on private motorized transport, and large informal settlements. Impacts on the environment include:• Destruction of ecologically important land and
high potential agricultural land due to expansion of settlements;
• Threatening of biodiversity due to the destruction or fragmentation of important habitats;

Human settlements | 77 Human settlements | 77
• Increased pollution from motor vehicles:o Nitrous dioxide and VOC which damages respiratory
systems and injures plants; and,o Greenhouse gases, which contributes to global
warming; and,• Increased run-off of polluted water, reduced recharge
of aquifers and increased downstream flooding due to impervious surfaces.
Negative impacts are not a foregone conclusion though. The 2009 State of the Environment Report for Cape Town for instance, indicated that there were improvements in air quality and solid waste amongst others, but no change in water use and a decline in biodiversity, the carbon dioxide footprint, freshwater quality and wastewater quality. It states that some of the paramount challenges are the pollution of water resources, largely as a result of unsatisfactorily treated wastewater and polluted urban stormwater runoff. This in itself is symptomatic of a larger problem, the rapid expansion of the urban environment without an associated expansion of critical city infrastructure, and the lack of access to critical sanitation services due to widespread poverty.
The Gauteng State of the Environment Report 2011 indicates that people become more reliant on the natural environment as poverty levels increase and that their vulnerability and lack of resilience has consequences leading to environmental degradation and increases in pollution. However, positive progress on a number of environmental indicators have been made, most notable is the dramatic reduction in lead concentrations from vehicle emissions due to tighter fuel regulation. According to the report, poor air quality remains a serious issue for the province as household fossil fuel, vehicle emissions, and industrial processes cause high concentrations for air pollutants.
5.5 INFRASTRUCTURE
5.5.1 InfrastructureChapter 1 of the Municipal Systems Act defines basic municipal services as a service that is necessary to ensure an acceptable and reasonable quality of life and which, if not provided, would endanger public health, safety and the environment.
The government has also committed to providing a basic amount of free services to the indigent.
Basic services impact on the natural environment, firstly by extracting non-renewable resources and secondly by dispensing waste products into natural systems.
This section deals only with household access to basic services. It should be read with Chapter 8: Inland Water and Chapter 12: Energy.
5.5.1.1 Electricity
Access to electricity has improved steadily since 1996. The advances made with access to electricity can generally be ascribed to focused government intervention as is evident in the success of the 2004 drive for universal access to electricity by 2012. In 1993, only 36 per cent of the population had access to electricity in their homes, while by 2011 84.7 per cent of South Africans had access to electricity (StatsSA 2012a).
Since July 2003, government introduced free basic electricity. The levels of service are currently set at 50 kWh per household per month for a grid-based system for qualifying domestic consumers, and 50 W per non-grid connected supply system for all households connected to the official non-grid systems (DoE 2012). Although the free basic-allocation of electricity is insufficient to meet all the demands of the typically large sizes of low-income urban household, about 20 per cent of households who now receive electricity rely primarily on this allowance. Consequently, the major impact of the free basic-allocation is in terms of improved lighting rather than in terms of cooking and heating (Pelser & Redelinghuys 2009).
Households using electricity for lighting increased from 58.2 per cent in 1996 to 84.7 per cent in 2011, while those using paraffin and candles decreased over the same period from 12.7 per cent to 3.0 per cent and from 28.7 per cent to 11.4 per cent in 1996 and 2011 respectively. The proportion of households using electricity for lighting purposes has increased across all provinces: the Western Cape has the highest proportion of households with electricity for lighting (93.4 per cent) and the Eastern Cape the lowest (75 per cent) although it improved the most from 25 per cent (Figure 5.10).
Figure 5. 10: Per centage of households using electricity for lighting by province for the period 2001 to 2011Source: StatsSA (2012a)

Human settlements | 78 Human settlements | 78
Electricity has become more common in South Africa as a source of energy for cooking since Census 1996. The proportion of households using electricity for cooking increased from 47.5 per cent to 73.9 per cent in 1996 to 2011 respectively. The proportion of households using paraffin, wood and coal as sources of energy for cooking decreased from 21.6 per cent, 23.0 per cent and 3.6 per cent to 8.5 per cent, 12.5 per cent and 0.7 per cent respectively.
The proportion of households using electricity for heating has increased since 1996. The proportion of households using wood for heating increased sharply between 1996 and 2001 and gradually decreased thereafter. There is an increase in the proportion of households using electricity for heating since 1996 in all provinces. The highest proportions were recorded in Gauteng (74.7 per cent).
Despite the high average electricity consumption, it is expected that a large part of the South African society still has to make the transition from traditional fuels (wood, dung and bagasse) through transitional fuels (coal, paraffin and liquefied petroleum gas (LPG) to electricity (StatsSA 2012c).
The generation of electricity is problematic due to South Africa’s reliance on carbon fuels such as coal for electricity which is the largest contributor to our ecological footprint. However, according to the Presidency, most Department of Energy policy imperatives have been acted upon and items such as Integrated Resource Plan have been completed. Progress is evident on electrification and solar heater rollout, but these have been constrained by funding and the need for more bulk transmission and municipal grid infrastructure to enable more connections.
5.5.1.2 Water
South Africa is a water-stressed country and different economic sectors are competing for shares of a diminishing water supply.
The proportion of households that have access to piped water has significantly increased since 1996 and there has been a constant decrease in the number of households without access to piped water.
With regard to basic water supply, South Africa achieved its MDG of halving the backlog in 2005. The present backlog eradication is impressive, as access to a basic service has increased from 59 per cent in 1994 to 95 per cent in 2013. The latter varies from 70 per cent in rural areas to 99 per cent in urban areas (DWA 2013).
The Census 2011 shows that the number of households without any access to piped water has decreased from 15.6 per cent to 8.8 per cent (StatsSA 2012a). The combination of piped water inside the dwelling and outside the yard is high in all provinces apart from Eastern Cape and Limpopo which have the lowest proportions. The highest proportion of those with piped water inside the dwelling or yard is found in Gauteng with 89.4 per cent followed closely by Free State with 89.1 per cent. Western Cape is the third highest at 88.4 per cent of households in this category.
The households that reported to have no access to piped water are highest in Eastern Cape (22.2 per cent), followed by 14.1 per cent in KwaZulu-Natal and Limpopo with 14.0 per cent. However, there are only 1.8 per cent households in Gauteng with no access to piped water, followed by Free State and Northern Cape at 2.2 per cent and 2.6 per cent respectively (Table 5.6).
Table 5. 6: Per centage of households that have access to piped water per province for the period 2001 to 2011
Pipe
d w
ater
insi
de d
wel
ling
Pipe
d w
ater
insi
de y
ard
Pipe
d w
ater
on
com
mun
ity
stan
d: d
istan
ce le
ss th
an 2
00
m fr
om d
wel
ling
Pipe
d w
ater
on
com
mun
ity
stan
d: d
istan
ce g
reat
er th
an
200
m fr
om d
wel
ling
No
acce
ss to
pip
ed w
ater
Cens
us 2
001
Cens
us 2
011
Cens
us 2
001
Cens
us 2
011
Cens
us 2
001
Cens
us 2
011
Cens
us 2
001
Cens
us 2
011
Cens
us 2
001
Cens
us 2
011
Western Cape 67.5 75.1 17.7 13.3 6.3 8.3 6.8 2.4 1.7 0.9
Eastern Cape 18.3 32.8 19.5 16.6 11.9 18.6 13.5 9.9 36.8 22.2
Northern Cape 34.3 45.8 37.7 32.3 10.9 12.8 11.1 6.6 6 2.6
Free State 22.8 44.8 47.7 44.3 13.7 6.2 11.4 2.6 4.4 2.2
KwaZulu-Natal 29.1 40 19.6 23.6 10.5 14.8 13.3 7.6 27.5 14.1
North West 18.7 29.3 35.5 40 16 14.3 16.4 8 13.4 8.4
Gauteng 46.4 62.1 36.4 27.3 7 6 7.3 2.8 2.9 1.8
Mpumalanga 19.8 35.7 36.7 36 12.8 9.2 16.4 6.6 14.3 12.6
Limpopo 9.7 18.4 29.2 33.9 16.1 20.5 23.1 13.2 21.9 14
South Africa 32.3 46.3 29 27.1 10.7 11.7 12.4 6.2 15.6 8.8Source: StatsSA (2012a)

Human settlements | 79 Human settlements | 79
Linked with these figures there has been a general decrease in the per centage of households who draw water from natural water sources such as streams, rivers, dams, wells and springs, and who now have access to tapped water.
As important as general access to piped water, is the reliability of the service. There are still challenges related to supply security in that at least ten per cent of provided infrastructure is currently dysfunctional and a further 20 to 24 per cent of infrastructure is experiencing serious water security problems. This situation is province specific, being less of an issue in the Western Cape and Gauteng and more so in Limpopo and Mpumalanga (up to 60 per cent). Urgent intervention is underway to minimize the risk (DWA 2013).
Extensive effort and commitment is being applied to backlogs through both the Rural Development Programme, (including the Interim Service Programme), and the housing related Informal Settlement Programme. In terms of informal households, 74 per cent have basic services and 93 per cent have access to functional infrastructure. Challenges are experienced in terms of timely implementation and funding, but major attention is being given to funding models, an investment framework, system optimization and improved, sustainable management.
Extensive work has also been done to ensure water security through proactive planning and governance, such as the revised National Water Resource Strategy, water resource reconciliation studies with associated interventions, all towns studies (mainly rural areas) and an extensive rural development programme (basic services).
In terms of human settlements and municipalities, special attention is being given to the optimization and enablement of institutions, as well as skill/capacity development and improved regulation of the water sector.
There is an extensive monitoring programme with the associated Blue Drop programme to ensure quality drinking water.
For a detailed discussion on water quality problems, please refer to Chapter 8: Inland Water.
5.5.1.3 Sanitation
Access to sanitation services is important, not only for human dignity, but also because of its direct link with disease control and the potential impact on water resources (Table 5.7).
Access to sanitation generally improved between 2006 and 2011. Households that have access to flush toilets connected to a public sewerage system increased from 51.9 per cent in 2001 to 60.1 per cent in 2011. The highest provision is in the Western Cape (89.6 per cent) and Gauteng (85.4 per cent) and the lowest is in Limpopo Province (21.9 per cent).
The use of chemical toilets increased from 1.9 per cent to 2.5 per cent between 2001 and 2011, the use of pit latrines with ventilation from 5.7 per cent to 8.8 per cent and the use of pita latrines without ventilation decreased from 22.8 per cent to 19.3 per cent.
Households with no access toilet facilities decreased from 13.6 per cent in 2001 to 5.2 per cent in 2011. Even though the use of bucket toilets is limited, and has halved from 4.1 per cent to 2.1 per cent between 2001 and 2011, it has not yet been completely eliminated (StatsSA 2010b & 2012a). The highest per centages are in the Free State (5.5 per cent) and the Western Cape (3.7 per cent).
According to the Presidency (2013), based on information from the then DWA, 26 per cent of households are affected by sanitation services that are not fully functional.
Table 5. 7: Per centage distribution of households by type of toilet facilities and province for the period 2001 to 2011
Flus
h to
ilet
Chem
ical
toile
t
Pit l
atrin
e w
ith
venti
latio
n
Pit l
atrin
e w
ithou
t ve
ntila
tion
Buck
et la
trin
e
Non
e
2001 2011 2001 2011 2001 2011 2001 2011 2001 2011 2001 2011
Western Cape 86.2 89.6 0.3 0.9 0.8 0.6 1.3 0.6 3.7 3.7 7.7 3.1
Eastern Cape 33.1 43.0 2.0 3.0 5.6 13.9 21.8 20.2 5.7 2.3 31.3 12.7
Northern Cape 57.8 66.0 0.8 0.6 7.6 9.1 10.8 10.7 10.0 4.0 13.1 8.0
Free State 46.3 67.1 0.8 0.6 6.2 8.7 16.5 13.5 20.5 5.5 9.7 3.1
KwaZulu-Natal 40.8 45.0 5.3 8.2 9.0 14.4 27.7 20.7 1.2 1.7 16.0 6.3
North West 36.7 45.4 1.0 0.8 11.0 11.3 36.6 34.2 5.1 1.0 9.6 5.8
Gauteng 80.2 85.4 1.1 1.1 1.4 2.4 11.5 7.4 2.2 1.8 3.6 1.1
Mpumalanga 36.4 43.8 1.5 1.4 9.0 12.1 39.4 33.9 2.6 0.9 12.1 6.3
Limpopo 16.8 21.9 1.3 0.9 7.9 15.1 50.4 52.9 0.6 0.6 22.8 7.2
South Africa 51.9 60.1 1.9 2.5 5.7 8.8 22.8 19.3 4.1 2.1 13.6 5.2Source: StatsSA (2012a)

Human settlements | 80 Human settlements | 80
5.5.1.4 Solid waste
The proportion of households that have refuse disposal service where the refuse is removed by local authorities weekly has increased consistently from 52.1 per cent in 1996 to 62.1 per cent in 2011 while those removed less often declined from 2.2 per cent in 1996 to 1.5 per cent in 2011. The households depending on communal refuse dumps decreased slightly to 1.9 per cent in Census 2011 from 2.2 per cent in Census 2007. There is a minor decrease of those owning refuse dumps at 28.2 per cent in Census 2011 from 28.8 per cent in Census 2007. The proportion of households without refuse disposal declined significantly from 9.7 per cent to 5.4 per cent in 1996 and 2011 respectively.
For a detailed discussion on water quality problems, please refer to Chapter 13: Waste Management.
5.5.2 The impact of the delivery and consumption of basic services on the environmentIt is evident that in general there has been a marked improvement in the access to basic services. Such improvements provide direct benefits to households in terms of better living conditions, environmental and health standards.
Improved access to basic services has a positive impact on the environment: sewage is treated instead of being discharged directly into rivers and streams; the use of combustible fuels for heating, lighting and cooking is lessened, thereby reducing the destruction of natural environments; and, solid waste is collected and managed to minimize its impact on the environment.
However, as demand increases, so does the impact on the environment, for instance more water extraction and higher amounts of fossil fuel used to generate that electricity. It is not increased access to basic services per se that is problematic, but also increased consumption which is driven by growing affluence. An analysis of energy consumption shows that the richest 30 per cent of households consume more than 70 per cent of domestic energy demand (EnerKey 2011).
5.6 VULNERABILITY AND FOOD INSECURITYCompared to other middle income countries, South Africa has extremely high levels of absolute poverty. The South African government has committed to halving poverty between 2004 and 2014. Achieving household food security is a critical component in meeting that objective (HSRC 2009). Food security plays an important role in improving the resilience of communities and individuals, especially in the face of climate change induced stresses on livelihoods.
According to the Constitution, Chapter 2: Bill of Rights, Section 27 every citizen has the right to have access to sufficient food and water, and that the State must by legislation and other measures within its available resources, avail to the progressive realization of the right to sufficient food (DepAgri 2002). South Africa’s Integrated Food Security Strategy of 2002
defines food security as “physical, social, and economic access to sufficient, safe, and nutritious food by all South Africans at all times to meet their dietary and food preferences for an active and healthy life.”
In South Africa the cause of hunger and malnutrition is not due to a shortage of food but rather an inadequate access to food by certain categories of individuals and households in the population. StatsSA has shown that food insecurity is not an exceptional short-term event, but is rather a continuous threat for more than a third of the population (HSRC 2004) (Table 5.8).
Food security cannot be understood in isolation from other developmental questions such as social protection, sources of income, rural and urban development, changing household structures, health, access to land, water and inputs, retail markets, or education and nutritional knowledge. Livelihood patterns and sustainable asset accumulation along with structural dynamics are increasingly important determinants. The multiple factors that influence access to food are not well understood, and this impacts negatively on the ability to identify appropriate policies to improve individual and household access (HSRC 2009). Other thematic chapters, such as Chapter 6: Land, Chapter 7: Biodiversity and Ecosystem Health and Chapter 8: Inland Water in Part 2 of this report, will provide more detail relating to the impact on livelihoods, food security and poverty.

Human settlements | 81 Human settlements | 81
Table 5. 8: Poverty headcount by year
Poverty line
IES
2000
IES
2005
/200
6 [1
]
LCS
2008
/200
9[2]
IES
2005
/200
6[3]
LCS
2008
/200
9[4]
LCS
2008
/200
9[5]
LCS
2008
/200
9[6]
Food poverty line R 148 R 209 R 305 R 209 R 305 R 305 R 305
Poverty headcount 28.50% 24.80% 36.90% 21.70% 29.90% 26.30% 32.40%
Lower-bound poverty line R 219 R 298 R 416 R 298 R 416 R 416 R 416
Poverty headcount 44% 40% 49% 37% 43% 39% 45%
Upper-bound poverty line R 323 R 428 R 577 R 428 R 577 R 577 R 577
Poverty headcount 57% 55% 60% 52% 56% 52% 57%Source: StatsSA (2012d)________________________________1. Unadjusted for food based on actual rentals2. Unadjusted for food based on actual rentals3. Adjusted for food based on actual rentals4. Adjusted for food based on actual rentals5. Adjusted for food based on value of dwelling unit6. Unadjusted for food based on value of dwelling unit
With or without adjustments, Table 5.8 shows that poverty levels in South Africa decreased between 2000 and 2006, but increased between 2006 and 2009. The relationship between poverty and environmental degradation has been highly contested by many. For the most part, it is believed that poverty impacts negatively on the environment as poor people do not have access to basic services. This leads to the use of fossil fuels and the pollution of water sources due to lack of sanitation facilities.
5.7 RESPONSESThe challenges posed by human settlements to the environment are comprehensive, as is the case in the rest of the world. Population growth, urbanization and migration, consumption, and sprawl have all contributed to the creation of unsustainable human settlements that impact negatively on the environment.
South Africa is in an especially precarious situation due to past, present and projected future development trends. Government is very aware of this and together with private sector are tackling these challenges head on.
In 2002/03 a number of planning practitioners radically rethought the changing nature of South African cities in its new democratic and non-racial context. Urban development trends and policies were, for example, reconsidered against the new spatial and economic realities and ideals of the South African city (Swilling 2004).
Very importantly, there was a process of rethinking cities in terms of their dependence on constrained natural resources
and shrinking sinks for wastes (Satterthwaite 1999); an idea greatly influenced by the ecological footprint concept (Swilling 2004; Wackernagel & Rees 1995). There is an attempt to address the South African planning paradigm, with settlements as its main manifestation, which was characterized by a lack of understanding and integration of ecological sustainability and resource base implications of planning, as well as address the recognition of the voice of communities and the poor in the urban planning debate.
The South African Government has since proactively included climate change and particularly the issue of sustainable settlements in legislation, policy directives and programmes.
Responses involve all spheres of government. National government’s role is primarily that of establishing a coherent and effective framework whereas local government exercises land use decision-making powers. Therefore, municipalities are playing the most direct role in spatial planning, land use management, and land development.
With reference to creating sustainable human settlements, the legislation outlined below is pertinent. The NEMA, Municipal Systems Act and the NSSD are also particularly relevant in the quest for sustainable human settlements but are not repeated here (see Chapter 2: Sustainability in South Africa and Chapter 4: Governance for more details).
5.7.1 Breaking new groundBreaking New Ground is a crucial piece of legislation as it provides guidance to all housing development and housing is the largest land use in any settlement. Its impact is self-evident.

Human settlements | 82 Human settlements | 82
Breaking New Ground, subtitled: “A comprehensive plan for the development of sustainable human settlements” was formulated by the (then) National Department of Housing during 2004. Breaking New Ground defines sustainable human settlements as “... well-managed entities in which economic growth and social development are in balance with the carrying capacity of the natural systems on which they depend for their existence and result in sustainable development, wealth creation, poverty alleviation and equity” (DoH 2004). This forms the blueprint for a sustainable approach to housing and settlement planning, with one of its seven main objectives stated as: “Utilizing housing as an instrument for the development of sustainable human settlements, in support of spatial restructuring” (DoH 2004).
Breaking New Ground shifts the strategic focus of housing policy from the simple delivery of low-cost housing, to the delivery of low-cost housing in settlements that are both sustainable and habitable. This policy shift means:• Emphasizing the development of social housing options;• Implementing inclusive housing policy requirements;• Promoting the upgrading of informal settlements; and,• Simplifying the administration of the housing subsidy
programme and extending the reach of this programme.
Some of the transformative aspects of the Breaking New Ground policy on informal settlements include:• In situ upgrading of informal settlements;• Making funding for land rehabilitation available;• Encouraging local municipalities to purchase well-located
land that is occupied or unoccupied;• Making provision for household support in the case of
relocation;• Creating provision of social and economic facilities and
infrastructure development;• Funding the provision of basic infrastructure; and,• Encouraging permit/permission to occupy forms of
tenure.
5.7.2 Spatial Planning and Land Use Management ActSPLUMA positions the country to systematically reverse its apartheid legacy and redress spatial inequalities. It proposes wall-to-wall land use schemes for all municipalities.
SPLUMA quotes the South African Constitution, Section 24, wherein our obligation to protect the environment is noted, and Secti on 26, wherein the right of citizens to sustainable settlement are declared. Furthermore, it states, “...sustainable development of land requires the integration of social, economic and environmental considerations in both forward planning and ongoing land use management to ensure that development of land serves present and future generations” (DRDLR 2012). The Act brings us closer to sustainable development, but it can be argued that it does not provide enough guidance. One can hope that, because the norms are compulsory, when they are formulated, sustainability metrics will be included.
5.7.3 Comprehensive Rural Development and Development ProgrammeThe Comprehensive Rural Development Programme (CRDP) is focused on enabling rural people to take control of their destiny with the support from government, and thereby dealing effectively with rural poverty through the optimal use and management of natural resources. This will be achieved through a co-ordinated and integrated broad-based agrarian transformation as well as the strategic investment in economic and social infrastructure that will benefit the entire rural community. The programme will be successful when it becomes apparent that ’sustainable and vibrant rural communities‘ are succeeding throughout South Africa. A three pronged strategy to ensure that the Department achieves its objective is as follows:• Agrarian transformation;• Rural development; and,• Land reform.
5.7.4 Climate Change Adaptation Plan for Rural Human SettlementThe Department of Rural Development and Land Reform is compiling the Climate Change Adaptation Plan for Rural Human Settlement. The objectives of the Plan are to:• Identify any interventions needed to ensure effective
mainstreaming of climate change considerations into the policy, regulatory, institutional and communications framework of the Department;
• Develop a strategy for mobilizing the resources and developing the capacities required for implementation of the plan;
• Identify and prioritize adaptation responses in terms of climate change risks;
• Identify adaptation options that provide opportunities for job creation and alignment with existing programmes, projects, and institutional arrangements;
• Provide a strategy for management of land that builds the resilience of the most vulnerable rural households to the impacts of climate change;
• Identify areas of interdepartmental collaboration; and,• Develop a monitoring and evaluation framework for the
adaptation plan.
5.7.5 The National Greening Framework for Events Management and the Built EnvironmentThe DEA published the National Greening Framework (NGF) for Events Management and the Built Environment document in 2011 as a guide towards sustainability. The purpose of the NGF “...is to promote the application of sustainable development principles and practices to the built environment and events management” (DEA 2011b).
It addresses issues such as saving and local generation of energy, water saving and local harvesting measures, indigenous landscaping for water saving and to increase biodiversity, non-motorized transport modes, responsible waste management and the utilization of waste as resource. Therefore, the NGF supports all green practices, including passive building, air quality management and green procurement. The NGF also applies these practices to events management. Quite rightly,

Human settlements | 83 Human settlements | 83
it holds the view that events take place within the built environment and that local authorities have important roles to play to determine the greenness of events within their jurisdictions.
5.7.6 Policy on non-motorised transportThe promotion of non-motorised transport (NMT) is mainly aimed at increasing transport mobility and accessibility, mainly in rural areas.The Department of Transport (DoT) has broadened its Shova Kalula (‘Pedal Easy’) Project into a more comprehensive NMT project that incorporates, among other things, cycling and animal drawn carts. The Project was first launched in 2001 and introduced in Limpopo in 2010.
The Project forms part of government’s action programme and is expected to contribute to its anti-poverty strategy and second economy interventions. It is believed that these initiatives will improve the mobility of, and access to, economic opportunities by rural communities.
The Department aims to distribute a million bicycles countrywide by 2015, in line with the resolution and action plan of the African Ministers’ Transport Summit held in Addis Ababa, Ethiopia, in 2005.
The DoT has expressed interest in establishing a local bicycle-manufacturing plant to produce bicycles for the project. The Shova Kalula Project also incorporates micro-businesses, which sell, repair and maintain bicycles to ensure the sustainability of the project.
5.7.7 Rapid Public Transport NetworksTwelve cities in South Africa are involved in the implementation of rapid public transport networks. Polokwane, Rustenburg, Mbombela and Pietermaritzburg are some of the cities, in addition to the metros that are involved in the rollout of the rapid public transport infrastructure.
About R5 billion was allocated in the 2012/13 financial year for this project. Stimulated by the transport needs arising from the 2010 Soccer World CupTM, South Africa started to introduce BRT systems in Johannesburg, Cape Town, Mangaung (Bloemfontein), Nelson Mandela Bay and the City of Tshwane.
The City of Cape Town refers to its system as Integrated Rapid Transit, to emphasize its role in a broader system of public transport that involves more than just buses.
Rustenburg in the North West is the latest city to establish the system. The Rustenburg Rapid Transport Project was launched in 2011 to manage mobility and congestion within this medium-sized-city, and aims to satisfy the needs of all road users, including pedestrians, cyclists, public transport users and motorists.
South Africa decided to introduce BRT systems rather than other systems, such as light rail, because of the enormous infrastructure costs associated with such systems, and their lack of flexibility.
All the South African BRT systems will expand in phases over the next decade. A particularly important dynamic in South Africa is how the system will integrate and include the minibus industry, since by law, public transport interventions need to involve existing operators.The BRT systems are not seen as the final solution to public transport in South Africa, but will form part of an integrated system of different modes and linked to cycle ways and walkways as part of the NMT system that should also be developed.
Due to reasons both environmental and economic, South Africa’s metropolitan municipalities are increasingly implementing public transport solutions such as the much-publicized Gautrain Rapid Rail link and the BRT systems in Johannesburg, Durban, Mangaung (Bloemfontein), Nelson Mandela Bay, Tshwane (Pretoria) and Cape Town. The National Strategy for Sustainable Development and Action Plan (DEA 2011a) supports this shifting of passengers towards public transport, but also proposes a shift to NMT.
5.8 CONCLUSIONGreat strides have been made in the creation of more sustainable human settlements that would limit the potentially negative impacts on the environment. The most significant intervention has been the shift in settlement planning legislation and policy to a normative approach, the development of environmental legislation and the inclusion of environmental and sustainability considerations into planning legislation. Significant planning legislation include SPLUMA and Breaking New Ground and key strategies include the NDP.
The shift from sprawling, mono-functional, low-density and car-dependent settlements to higher-density, integrated, low-carbon and sustainable settlements is a difficult due to the entrenchment of past urban patterns and investment. Progress has mostly been made in:• Settlement structure: higher density, integrated (fully
developed with social facilities etc.) settlements that are well-located in term of access to jobs and facilities;
• Urban transport: the introduction of a number of BRT systems in various cities as well as policies for NMT; and,
• Protection of environmentally sensitive areas and ecological corridors: hardly any formal settlement development still takes place within ecologically sensitive areas due to stringent environment legislation that is integrated into planning processes. Of specific importance are the NEMA regulations, that have completely changed planning approaches and processes. This has probably been the most successful Act to integrate environmental issues with development actions.
Furthermore, access of all communities to engineering services such as water, electricity, sanitation, and solid waste collection, was improved dramatically thereby lessening the direct impact of settlements on the environment through the treatment of raw sewage.
The challenge we face to limit the impact on the environment of a growing population that is concentrating in a number of large settlements and whose demands and consumption patterns are increasing, is daunting. It does not only concern

Human settlements | 84 Human settlements | 84
technical issues such as residential densities and transport options, but is intrinsically linked to demographic, economic and cultural factors. In order to save the environment we also need to address issues such as poverty, mass consumption, investment models and preconceived ideasThe most important actions that should be taken from a human settlement planning perspective to contribute to a healthy environment are:• The role-players need to be informed and educated
about the substance and processes of low-carbon, sustainable city building: the responsibility for this lies on the shoulders of the universities who train planners and on the shoulders of the Council for Planners who should enforce a programme of continual education (as is required of the other built-environment professions);
• National government (being the agency with the most capacity) should coordinate and integrate planning legislation with the objectives of sustainable development;
• Institutional weaknesses which prevent compliance and monitoring, remain the main stumbling block to implementation of sustainability measures (the NSSD proposals aim to address these weaknesses);
• A shift in values and attitudes needs to take place but the opportunities for change have to be created (this is being proposed by the NSSD); and,
• Incentives to promote the application of renewables, water saving measures, passive building design and other sustainability metrics must be initiated at local authority level. Municipal by-laws that require and reward this, must be enacted.
5.9 REFERENCES1. Bertaud, A. (2004). The spatial organization of cities:
Deliberate outcome or unforeseen consequence. http://alain-bertaud.com/images/AB_The_spatial_organization_of_cities_Version_3.pdf. Viewed 20 July 2012.
2. CSIR (2008). A National Overview of Spatial Trends and Settlement Characteristics. Unpublished report prepared for the South African Cities Network (SACN), the Department of Local and Provincial Government (DLPG) and The Presidency, Policy Coordination and Advisory Services (PCAS). http://www.sacities.net/images/stories/pdfs/national_overview_spatialtrends.pdf. Viewed 25 July 2012.
3. CSIR (Council for Scientific and Industrial Research), (2011). Settlements typology. PowerPoint presentation prepared for the National Planning Commission.
4. CSIR (2010.) 7th Annual State of Logistics Survey for South Africa. Council for Scientific and Industrial Research (CSIR), Imperial Logistics and University of Stellenbosch. http://www.csir.co.za/sol/docs/7th_SoL_2010_March.pdf. Viewed 19 June 2012.
5. DepAgri (Department of Agriculture), (2002). The Integrated Food Security Strategy for South Africa. Department of Agriculture, Pretoria.
6. DoE (2010). South African Energy Synopsis 2010. Department of Energy. http://www.energy.gov.za/files/media/explained/2010/South_African_Energy_Synopsis_2010.pdf. Viewed 25 July 2012.
7. DoE (2012). Frequently Asked Questions: Free Basic Education. Department of Energy. http://www.energy.gov.za/files/faqs/faqs_freebasic.html. Viewed 25 July 2012.
8. DEA (2011a). National Strategy for Sustainable Development and Action Plan (NSSD) 2011-2014. Department of Environmental Affairs. http://www.environment.gov.za/?q=content/documents/strategic_docs/national_strategy_sustainable_development/ Viewed 20 June 2012.
9. DEA (Department of Environmental Affairs). (2011b). National Greening Framework for Events Management and the Built Environment. Department of Environmental Affairs, Pretoria.
10. DEAT (Department of Environmental Affairs and Tourism), (2007). South Africa Environment Outlook: A report on the state of the environment. Department of Environmental Affairs and Tourism, Pretoria.
11. Design Department Group (2012). Design Observer Group. www.designobersver.com
12. DoH (2004). “Breaking New Ground”: A comprehensive plan for the development of sustainable human settlements. Department of Housing. http://www.nwpg.gov.za/DDLG&TA/acts/Breaking%20New%20Grounds.pdf. Viewed 25 May 2012.
13. DHS (2009). Sustainable Human Settlements: Investment Potential Atlas 2009. Department of Human Settlements. http://www.dhs.gov.za/Content/Housing%20Atlas%202009/human_settlements_investment_pot.htm. Viewed 23 May 2012.
14. DRDLR (Department of Rural Development and Land Reform). (2012). Spatial Planning and Land Use Management Bill. Department of Rural Development and Land Reform, Pretoria.
15. DWAF (Department of Water Affairs and Forestry), (2013). 2012 South Africa Environment Outlook - Director. WS: P&I Comments and Input on Chapter 5, Department of Water Affairs and Forestry, Pretoria.
16. EnerKey (2011). Benchmark Housing Project for the poor: The integrated Energy Environment Empowerment Cost optimised (iEEECo) Human Settlement Project. Presentation. EnerKey for COP 17. http://www.enerkey.info/images/stories/intern/module1/enerkey-for-cop17_final.pdf. Viewed 20 May 2012.
17. FFC (Financial and Fiscal Commission), (2011). The economic and fiscal costs of inefficient land use patterns in South Africa. Unpublished research report.

Human settlements | 85 Human settlements | 85
18. GCRO (2011). Oct 2011 - 2010 Population in the City of Joburg. Gauteng City Region Observatory. http://www.gcro.ac.za/map/oct-2011-2010-population-city-joburg. Viewed 8 November 2013.
19. GCRO (2013). Population Density per km2. Gauteng City Region Observatory. http://www.gcro.ac.za/sites/default/files/images/maps/census2011_sal_gcr_pop_sgcrv3_low_res_0.jpg. Viewed 5 November 2013.
20. Google Earth (2012). United States Department of State Geographer. http://www.google.com/earth/index.html. Viewed 20 May 2012.
21. HSRC (2004). Food security in South Africa: key policy issues for the medium term. Human Sciences Research Council. http://webcache.googleusercontent.com/search?q=cache:vytojXwbOZMJ:www.hsrc.ac.za/en/research-data/ktree-doc/1199+&cd=2&hl=en&ct=clnk&gl=za. Viewed 18 May 2012.
22. HSRC (Human Sciences Research Council), (2009). Food security in South Africa. Human Sciences Research Council, Pretoria.
23. IndexMundi (2016). Historical data graphs per year. IndexMundi. http://www.indexmundi.com/g/g.aspx?v=24&c=sf&c=xx&l=en. Viewed 8 January 2016.
24. Nation Master (2013). Maps of South Africa. Nation Master. http://maps.nationmaster.com/country/sf/1. Viewed 6 November 2013.
25. NPC (2011a). Diagnostic report on material conditions. Unpublished report. National Planning Commission. http://www.npconline.co.za/MediaLib/Downloads/Home/Tabs/Diagnostic/Diagnostic_Material_Conditions.pdf. Viewed 20 May 2012.
26. NPC (2011b). National Development Plan 2030. National Planning Commission. http://www.npconline.co.za/medialib/downloads/home/NPC%20National%20Development%20Plan%20Vision%202030%20-lo-res.pdf. Viewed 20 June 2012.
27. Ndaba, D. (2008). South Africa’s affordable-housing programme is maturing, but the delivery pressures are mounting. Engineering News. 11 July 2008. http://www.engineeringnews.co.za/article/south-africas-affordablehousing-programme-is-maturing-but-the-delivery-pressures-are-mounting-2008-07-11. Viewed 19 June 2012.
28. Newton, P.W. (2006). Human settlements’, theme commentary prepared for the 2006 Australian State of the Environment Committee. Department of the Environment and Heritage, Canberra. http://www.environment.gov.au/soe/2006/publications/commentaries/settlements/settlement-pressures.html. Viewed 20 May 2012.
29. Pelser, A. and Redelinghuys, N. (2009). Population, environment and development. Towards a 10-year review of the population policy implementation in South Africa
(1998 – 2008). Department of Social Development. http://www.populat ion.gov.za/pop_dev/index.php/Population-Policy-+-10-Review/View-category.html?dir=DESC&limit=5&limitstart=5&order=name. Viewed 21 May 2012.
30. The Presidency: Department of Performance Monitoring and Evaluation. (2013). Progress towards the targets in the delivery agreement for the priority outcomes, Viewed 6 November 2013.
31. Satterthwaite, D. (1999). The Earthscan reader in sustainable cities. (Ed.). Earthscan, London.
32. Smit, W., Pieterse, E., Palmer, I. and Parnell, S. (2011). Human Settlements Growth Path. African Centre for Cities - University of Cape Town, Cape Town
33. SHF (2008). Shack Rentals in South Africa. http://www.urbanlandmark.org.za/downloads/rep_shack_rent.pdf. Social Housing Foundation. Viewed 21 May 2012.
34. SAIRR (South African Institute of Race Relations), (2009). South Africa Survey 2009/2010. South African Institute of Race Relations, Johannesburg.
35. StatsSA (2010a). General Household Survey 2010. Statistics South Africa. http://www.statssa.gov.za/publications/P0318/P0318June2010.pdf. Viewed 19 June 2012.
36. StatsSA (2010b). GHS Series Volume III Water and sanitation 2002–2010 In-depth analysis of the General Household Survey data. Statistics South Africa, Pretoria. http://www.statssa.gov.za/publications/Report-03-18-02/Report-03-18-022010.pdf. Viewed 25 July 2012.
37. StatsSA (Statistics South Africa. (2012c). Census 2011. Statistics South Africa, Pretoria.
38. StatsSA (2012a). General Household Survey 2011. Statistics South Africa, Pretoria. http://www.statssa.gov.za/publications/P0318/P0318June2010.pdf. Viewed 19 June 2012.
39. StatsSA (2012b). Energy Accounts for South Africa: 2002–2009. Discussion document D0405.1.1. Statistics South Africa, Pretoria. https://www.statssa.gov.za/publications/D04051.1/D04051.12009.pdf. Viewed 19 June 2012.
40. StatsSA (Statistics South Africa), (2012d). Subjective Poverty in South Africa: findings of the living conditions survey 2008/2009. Statistics South Africa, Pretoria.
41. SEA (2006). State of Energy in South African Cities 2006; Setting a Baseline. Sustainable Energy Africa (SEA), Cape Town. http://www.npconline.co.za/Med i aL i b / D own l o ad s / Ho me/ Tabs / D i agn o st i c /MaterialConditions2/State%20of%20Energy%20in%20South%20African%20Cities%202006.pdf. Viewed 19 June 2012.

Human settlements | 86 Human settlements | 86
42. Swilling, M. (2004). Rethinking the Sustainability of the South African City. Development Update 5(1).
43. Todes, A. (2004) Regional Planning and Sustainability: Limits and potentials of South Africa’s Integrated Development Plans. Journal of Environmental Planning and Management, 47(6): 843-861.
44. Trading Economics (2013). Rural population growth (annual %) in South Africa. Trading Economics. http://www.tradingeconomics.com/south-africa/rural-population-growth-annual-per cent-wb-data.html. Viewed 19 October 2013.
45. Umkhanyakude District Municipality. (2011). Umkhanyakude District Municipality Integrated Development Plan (IDP) Annual Review for 2011/12 Final. Office of the Municipal Manager: IDP/PMS Unit. http://mfma.treasury.gov.za/Documents/01.%20Integrated%20Development%20Plans/2011-12/03.%20District%20Municipalities/DC27%20Umkhanyakude/DC27%20Umkhanyakude%20-%20IDP%20-%202012.pdf. Viewed 25 July 2012.
46. UNEP (2007). Viumbe Hai: African Cities, Ecosystems and Biodiversity. UN-Habitat and International Council for Local Environmental Initiatives (ICLEI). http://www.unep.org/urban_environment/PDFs/biodiversity-brochure.pdf. Viewed 30 July 2012.
47. Wackernagel, M. & Rees, W. (1995). Our Ecological Footprint: Reducing Human Impact on the Earth. Gabriola Island, BC and Philadelphia, PA: New Society Publishers.
48. WWF (World Wide Fund for Nature), (2012). Living Planet Report 2012: Biodiversity, biocapacity and better choices. World Wide Fund for Nature, Gland.