chapter 6 financial forecasting copyright¸ 2003 john wiley & sons, inc. all rights reserved....
TRANSCRIPT

Chapter 6
Financial Forecasting
Copyright¸ 2003 John Wiley & Sons, Inc. All rights reserved. Reproduction or translation of this work beyond that permitted in Section 117 of the 1976 United States Copyright Act without the express written permission of the copyright owner is unlawful. Request for further information should be addressed to the Permissions Department, John Wiley & Sons, Inc. Instructors may make copies of the PowerPoint Presentations contained herein for classroom distribution only. The Publisher assumes no responsibility for errors, omissions, or damages, caused by the use of these programs or from the use of the information contained herein.

©2003, Entrepreneurial Finance, Smith and Kiholm Smith Chapter 6
Learning Objectives • Learn the elements of the cash flow cycle. • Understand the four critical determinants of a firms
financial needs: minimum efficient scale, profitability, cash flow, and sales growth.
• Learn how to prepare a sales forecast for an established firm.
• Learn how to prepare a sales forecast for a new venture.
• Develop a financial model of a venture using pro forma analysis to integrate income statement, balance sheet, and cash flow.
• Identify publicly available data sources to provide an objective basis for underlying assumptions of the financial model.

©2003, Entrepreneurial Finance, Smith and Kiholm Smith Chapter 6
Benefits of Financial Forecasting
• A disciplined means of evaluating the cash need of a venture.
• An aid to determining whether a proposed venture deserves the entrepreneur’s investment of capital and effort.
• A means of comparing the expected values of strategic alternatives.
• Demonstrate to potential investors the project merits and negotiate appropriate ownership.
• Provide a benchmark for assessing project development.
©2003, Entrepreneurial Finance, Smith and Kiholm Smith Chapter 6
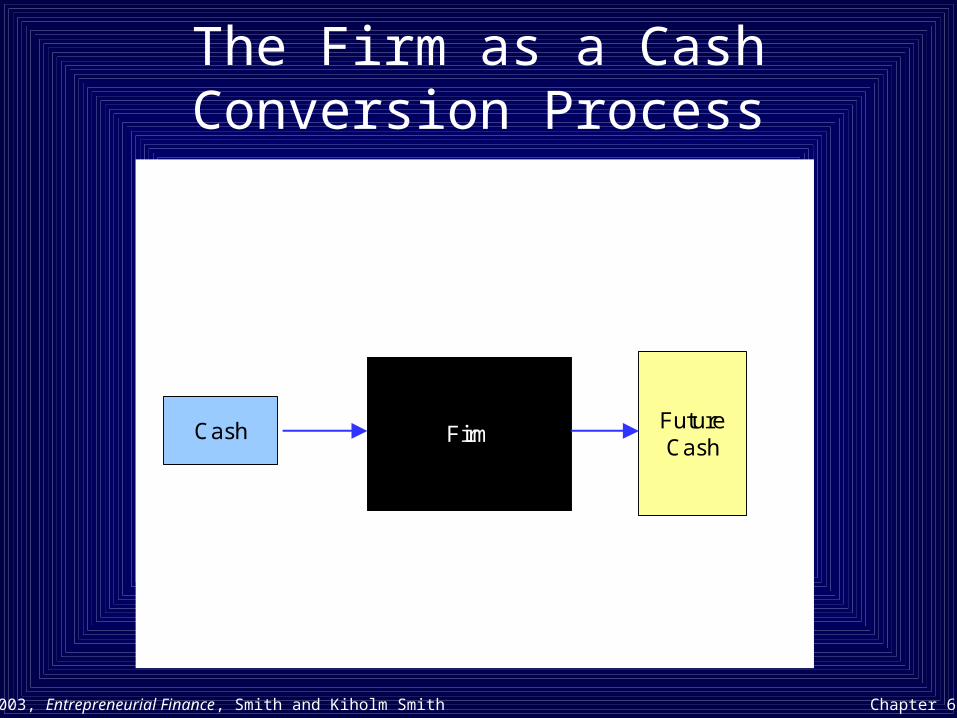
The Firm as a Cash Conversion Process
FirmCash FutureCash

©2003, Entrepreneurial Finance, Smith and Kiholm Smith Chapter 6
The Cash Flow of a Business Venture

©2003, Entrepreneurial Finance, Smith and Kiholm Smith Chapter 6
4 Key Determinants of Financial Needs
• Minimum efficient scale and capital intensity• Profitability• Cash flow• Sales growth

©2003, Entrepreneurial Finance, Smith and Kiholm Smith Chapter 6
Manufacturer’s Long Run Per Unit Cost (LRAC)

©2003, Entrepreneurial Finance, Smith and Kiholm Smith Chapter 6
Factors That Increase a Firm’s Cash Needs
• Competition in markets where the minimum efficient scale (MES) is large.
• Low profit margins.• High rates of sales growth.• Increased reliance on depreciation of assets and less
on expensing.• Expectation of low cash flow levels.• Increased trade credit offered (accounts receivable
as a fraction of assets is high).• Decreased trade credit used (accounts payable as a
fraction of assets is high).

©2003, Entrepreneurial Finance, Smith and Kiholm Smith Chapter 6
Introduction to Pro Forma Analysis
Assumptions for a simple asset-driven business model:• Sales = 2 x Beginning Assets• Net Income = Sales x 0.1• Retained Earnings = Beginning Assets x 0.06• Dividends = Net Income - Retained Earnings• Ending Assets = Beginning Assets + Retained
Earnings

©2003, Entrepreneurial Finance, Smith and Kiholm Smith Chapter 6
Asset-driven Pro Forma Model

©2003, Entrepreneurial Finance, Smith and Kiholm Smith Chapter 6
Five Year Pro Forma Analysis for a Simple Business Venture

©2003, Entrepreneurial Finance, Smith and Kiholm Smith Chapter 6
Integrating Pro Forma Financial Statements
• Basic Pro Forma Financial Statements (and some others)– Sales Forecast– Income Statement– Cash Flow Statement– Balance Sheet Net Income = Sales x 0.1

©2003, Entrepreneurial Finance, Smith and Kiholm Smith Chapter 6
Integrating Pro Forma Financial Statements
The statements are interdependent• Income Statement changes affect Balance Sheet
and Cash Flow (e.g., higher profit may lead to increased cash balances).
• Balance Sheet changes affect Income Statement and Cash Flow (e.g., borrowing leads to interest expense and reduces taxes).
An financial model should integrate the statements

©2003, Entrepreneurial Finance, Smith and Kiholm Smith Chapter 6
Key Questions to be Answered in a Sales Forecast• When will the venture begin to generate revenue? • How rapidly will revenue grow?• Over what span of time (3 years, 5 years, 10 years,
etc.) should the forecast be made?• What is an appropriate forecasting interval (weekly,
monthly, annually, etc.)?

©2003, Entrepreneurial Finance, Smith and Kiholm Smith Chapter 6
Forecasting the Sales of an Existing Business
The forecast can be based on the existing track record of the business
Some considerations• Forecasting in levels or changes• Forecasting in real or nominal terms• Weighting of historical data• Forecasting based on underlying factors for which
forecasts exist

©2003, Entrepreneurial Finance, Smith and Kiholm Smith Chapter 6
Combining Growth Rates and Current Sales Levels to Forecast the Sales of an
Existing Business

©2003, Entrepreneurial Finance, Smith and Kiholm Smith Chapter 6
Forecasting in Real Terms

©2003, Entrepreneurial Finance, Smith and Kiholm Smith Chapter 6
Using Weighting to Improve a Forecast

©2003, Entrepreneurial Finance, Smith and Kiholm Smith Chapter 6
Using Regression Analysis to Forecast

©2003, Entrepreneurial Finance, Smith and Kiholm Smith Chapter 6
Forecasting for a New VentureNo track record to rely on
Yardstick approach• Comparable firms in relevant dimensions• IPO prospectuses• Other data sources

©2003, Entrepreneurial Finance, Smith and Kiholm Smith Chapter 6
Forecasting for a New Venture (Cont’d)
Fundamental analysis• Market and market share• Engineering cost estimates• Demand-side approach - How much customers
would buy• Supply-side approach - How fast the venture can
grow• Credibility and support for assumptions
Mixed approach

©2003, Entrepreneurial Finance, Smith and Kiholm Smith Chapter 6
Principles of Financial Forecasting
Part 1• Build and support a schedule of assumptions.• Begin with a forecast of sales.• If sales growth is expected to track inflation, consider
forecasting sales in real terms.• When using historical data to forecast, consider a
weighting scheme that focuses on the firm’s most recent experiences.
• For new ventures, choose several “yardstick” firms to use in developing underlying assumptions regarding expected performance.
• Integrate the pro forma balance sheet and income statement variables through a financial model.

©2003, Entrepreneurial Finance, Smith and Kiholm Smith Chapter 6
General Rules of Financial Forecasting
Part 2• Consider time span. To assess financial need, project
at least until the firm expects follow-on financing. To determine venture value, extrapolate to the point of harvest.
• Determine the planning horizon of the venture to establish forecasting intervals.
• Test the model’s rationality by tracing line items across financial statements.
• Apply sample scenarios and compare outcomes to estimates.
• Try a basic sensitivity analysis to ensure that the model yields reasonable results when magnitudes and growth rates of key variables change.

©2003, Entrepreneurial Finance, Smith and Kiholm Smith Chapter 6
New Company AssumptionsFigure 6-5:
1) Development will require 18 months, during which no sales will be made.
2) Initial sales of $10,000 in the 19th month.
3) Sales will grow 8% per month in real terms for three years and at the inflation rate thereafter.
4) Cash operating expenses during the development period of $15,000 per month, plus inflation.
5) Inflation at 9 percent per year.

©2003, Entrepreneurial Finance, Smith and Kiholm Smith Chapter 6
New Company AssumptionsFigure 6-5: (Continued)
6) A $200,000 production facility will come on line at the end of month 18. The facility is to be leased by the company for the first 5 years of operation, with monthly payments of $3,000.
7) Gross profit of 60% of sales revenue on materials costs with trade discounts.
8) Selling expenses of 15% of sales.
9) Administrative expenses of $2,000 per month beginning in month 19, growing at the inflation rate, plus 15 percent of sales (Included in development period operating expense total).

©2003, Entrepreneurial Finance, Smith and Kiholm Smith Chapter 6
New Company AssumptionsFigure 6-5 (Continued)
10)Entrepreneur’s salary of $3,000 per month through the first full year of sales. (included in initial operating expenses), increasing thereafter by $500 per month.
11)Corporate tax rate of 45%. No loss carry forward.
12)All sales are for credit. The average collection period is 45 days. No discount for prompt payment.
13)The inventory turnover rate is 5 times per year, measured against ending inventory.

©2003, Entrepreneurial Finance, Smith and Kiholm Smith Chapter 6
New Company AssumptionsFigure 6-5 (Continued)
14)The company desires to maintain the greater of 30 days’ sales in cash or $10,000.
15)All materials are purchased on credit, with terms of 2/10 net 30. The company anticipates paying in time to receive the discount. The payables period is 10 days.
16)The entrepreneur will borrow any funds necessary at a rate of 1% per month.
17)Initial investment by the entrepreneur of $200,000. Additional financing as needed by borrowing on a line of credit.

©2003, Entrepreneurial Finance, Smith and Kiholm Smith Chapter 6
Figure 6-6
New Company - Pro Forma Balance Sheet
Month 0 1 10 11 18 19 20 39 40 54 55
Cash $200,000 $182,000 $14,835 $10,000 $10,000 $10,000 $10,000 $49,740 $54,122 $176,498 $192,047Accounts Receivable $0 $0 $0 $0 $0 $10,000 $15,881 $78,992 $85,952 $280,296 $289,511Inventory $0 $0 $0 $0 $24,000 $26,114 $28,415 $141,337 $153,789 $464,371 $467,853Total Current Assets $200,000 $182,000 $14,835 $10,000 $34,000 $46,114 $54,296 $270,070 $293,863 $921,165 $949,412
Other Assets $0 $0 $0 $0 $0 $0 $0 $0 $0 $0 $0Total Assets $200,000 $182,000 $14,835 $10,000 $34,000 $46,114 $54,296 $270,070 $293,863 $921,165 $949,412
Accounts Payable $0 $0 $0 $0 $8,000 $24,705 $26,881 $133,708 $145,488 $462,066 $465,531Short Term Debt $0 $0 $0 $0 $0 $0 $0 $0 $0 $0 $0Total Current Liabilities $0 $0 $0 $0 $8,000 $24,705 $26,881 $133,708 $145,488 $462,066 $465,531
Long Term Debt (Credit Line) $0 $0 $0 $14,329 $173,116 $175,257 $187,765 $365,133 $376,775 $585,187 $592,877Total Liabilities $0 $0 $0 $14,329 $181,116 $199,961 $214,646 $498,841 $522,263 $1,047,253 $1,058,408
Equity $200,000 $182,000 $14,835 ($4,329) ($147,116) ($153,847) ($160,350) ($228,772) ($228,400) ($126,088) ($108,996)Total Liabilities and Equity $200,000 $182,000 $14,835 $10,000 $34,000 $46,114 $54,296 $270,070 $293,863 $921,165 $949,412
New Company - Pro Forma Income Statement
Month 1 10 11 18 19 20 39 40 54 55
Sales $0 $0 $0 $0 $10,000 $10,881 $54,122 $58,890 $192,047 $193,488Cost of Goods Sold $0 $0 $0 $0 $4,000 $4,352 $21,649 $23,556 $76,819 $77,395Gross Profit $0 $0 $0 $0 $6,000 $6,529 $32,473 $35,334 $115,228 $116,093Selling Expenses $0 $0 $0 $0 $1,500 $1,632 $8,118 $8,834 $28,807 $29,023Administrative Expenses $0 $0 $0 $0 $3,500 $3,647 $10,441 $11,173 $31,405 $31,640Lease Expense $0 $0 $0 $0 $3,000 $3,000 $3,000 $3,000 $3,000 $3,000Operating Expenses $15,000 $16,043 $16,164 $17,032 $8,000 $8,279 $21,559 $23,007 $63,212 $63,664Owner's Salary $3,000 $3,000 $3,000 $3,000 $3,000 $3,000 $7,500 $8,000 $15,000 $15,500Total Exp. Before Int. and Tax $18,000 $19,043 $19,164 $20,032 $11,000 $11,279 $29,059 $31,007 $78,212 $79,164Operating Income ($18,000) ($19,043) ($19,164) ($20,032) ($5,000) ($4,751) $3,414 $4,327 $37,016 $36,929Interest Expense $0 $0 $0 $1,357 $1,731 $1,753 $3,540 $3,651 $5,879 $5,852Net Taxable Income ($18,000) ($19,043) ($19,164) ($21,389) ($6,731) ($6,503) ($125) $676 $31,137 $31,077Income Tax $0 $0 $0 $0 $0 $0 $0 $304 $14,012 $13,985Net Income ($18,000) ($19,043) ($19,164) ($21,389) ($6,731) ($6,503) ($125) $372 $17,126 $17,092
New Company - Pro Forma Sources and Uses of Funds
Month 1 10 11 18 19 20 39 40 54 55
Net Income ($18,000) ($19,043) ($19,164) ($21,389) ($6,731) ($6,503) ($125) $372 $17,126 $17,092Depreciation Expense $0 $0 $0 $0 $0 $0 $0 $0 $0 $0Operating Cash Flow ($18,000) ($19,043) ($19,164) ($21,389) ($6,731) ($6,503) ($125) $372 $17,126 $17,092Changes in Current AssetsAccounts Receivable $0 $0 $0 $0 $10,000 $5,881 $6,396 $6,959 $22,695 $9,215Inventory $0 $0 $0 $24,000 $2,114 $2,301 $11,444 $12,452 $3,457 $3,483Changes in Current LiabilitiesAccounts Payable $0 $0 $0 $8,000 $16,705 $2,176 $10,826 $11,780 $26,031 $3,465Net FundsUsed in Operating Activities $18,000 $19,043 $19,164 $37,389 $2,141 $12,508 $7,139 $7,260 ($17,005) ($7,860)
Beginning Cash Balance $200,000 $33,878 $14,835 $10,000 $10,000 $10,000 $45,713 $49,740 $162,207 $176,498Minimum Cash Balance $10,000 $10,000 $10,000 $10,000 $10,000 $10,000 $49,740 $54,122 $176,498 $192,047
New Financing Needed $0 $0 $14,329 $37,389 $2,141 $12,508 $11,166 $11,642 $0 $7,689Debt Repayment $0 $0 $0 $0 $0 $0 $0 $0 $2,715 $0Cummulative New Financing Needed $0 $0 $14,329 $173,116 $175,257 $187,765 $365,133 $376,775 $585,187 $592,877Surplus Cash $172,000 $4,835 $0 $0 $0 $0 $0 $0 $0 $0