chapter 6 the standard normal distributionnlucas/stat 145/145 powerpoint files/145 chapter 6... ·...
TRANSCRIPT

TOPIC SLIDE
What is the Standard Normal Distribution? 2
What do z-scores tell us? 3
The Empirical Rule 10
Steps for finding the area under the Normal Curve 13
• Tutorial: Using Excel 2007 to obtain z-scores
• Tutorial: Using Excel 2007 to obtain the cumulative
area under the Normal Curve
Chapter 6
The Standard Normal Distribution
Chapter 6
➊ A distribution of scores called standard normal or z-
scores
➋ Standard normal or z-scores are used when the
researcher wants to convert the original unit of
measurement into a common unit of measurement (i.e.,
z-scores)
• EXAMPLE: Suppose you are told someone’s test
score is 278. Can you tell if this is a good or bad
score? Why?
The Standard Normal Distribution
Chapter 6
➊ Z-scores are in standard deviation units
• The value of a z-score tells you how many standard
deviations that score is from its mean
• EXAMPLE: Suppose a group of scores have a mean
equal to 250 and a SD equal to 28. What score is one
SD above the mean? Answer: 278. Therefore, the z-
score for an original score of 278 is z = +1.00
• Remember – a z-score tells you how many SDs a
score is from its mean
The Standard Normal Distribution

Chapter 6
➊ EXAMPLE: The heights for a large sample of adults is
normally distributed with a mean of 68” and a SD of 3”
The Standard Normal Distribution
HEIGHT IN INCHES
68” 77”74”71”65”62”59”

Chapter 6
➊ The scores 65” and 71” are each one SD away from the
mean, therefore:
• The z-score for 65” is z = -1.00 and
• The z-score for 71” is z = +1.00
The Standard Normal Distribution
HEIGHT IN INCHES
68” 77”74”71”65”62”59”
Z = -1.00 Z = +1.00

Chapter 6
➊ The sign of a z-score tells you which side of the mean the
score is on
• +Positive z-scores are above the mean
• -Negative z-scores are below the mean
The Standard Normal Distribution
HEIGHT IN INCHES
68” 77”74”71”65”62”59”
Z = -1.00 Z = +1.00

Chapter 6
The Standard Normal Distribution
HEIGHT IN INCHES
68” 77”74”71”65”62”59”
68%
• We expect 68% of all scores to fall in the range
z = -1.00 to z = +1.00
• 68% of all scores are expected to fall within
±1.00 standard deviation of the mean
Chapter 6
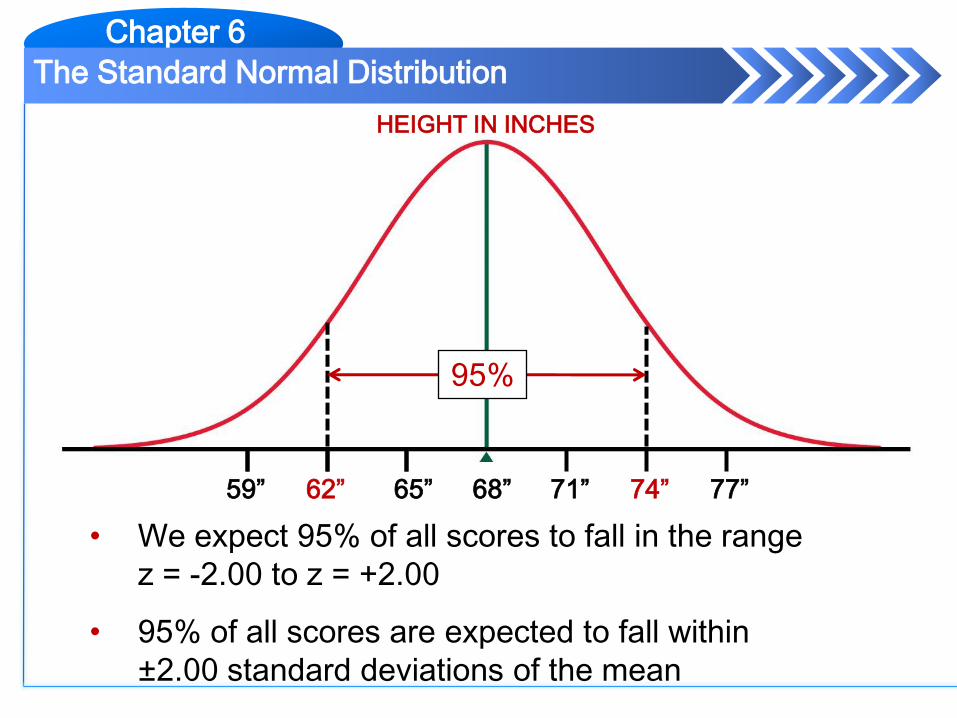
• We expect 95% of all scores to fall in the range
z = -2.00 to z = +2.00
• 95% of all scores are expected to fall within
±2.00 standard deviations of the mean
The Standard Normal Distribution
HEIGHT IN INCHES
68” 77”74”71”65”62”59”
95%
Chapter 6
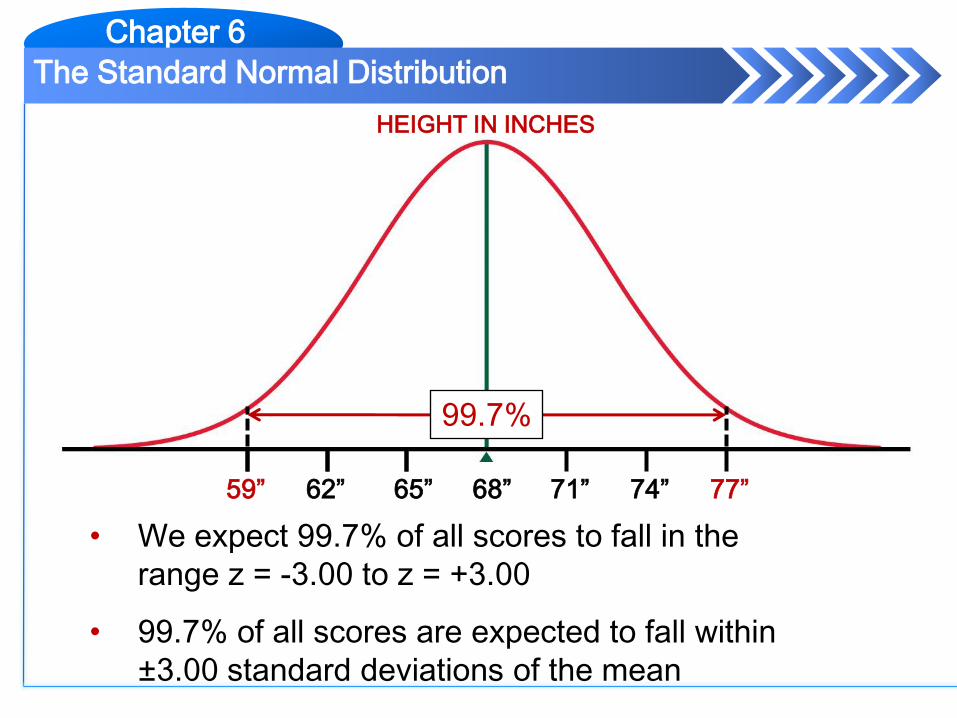
• We expect 99.7% of all scores to fall in the
range z = -3.00 to z = +3.00
• 99.7% of all scores are expected to fall within
±3.00 standard deviations of the mean
The Standard Normal Distribution
HEIGHT IN INCHES
68” 77”74”71”65”62”59”
99.7%

Chapter 6
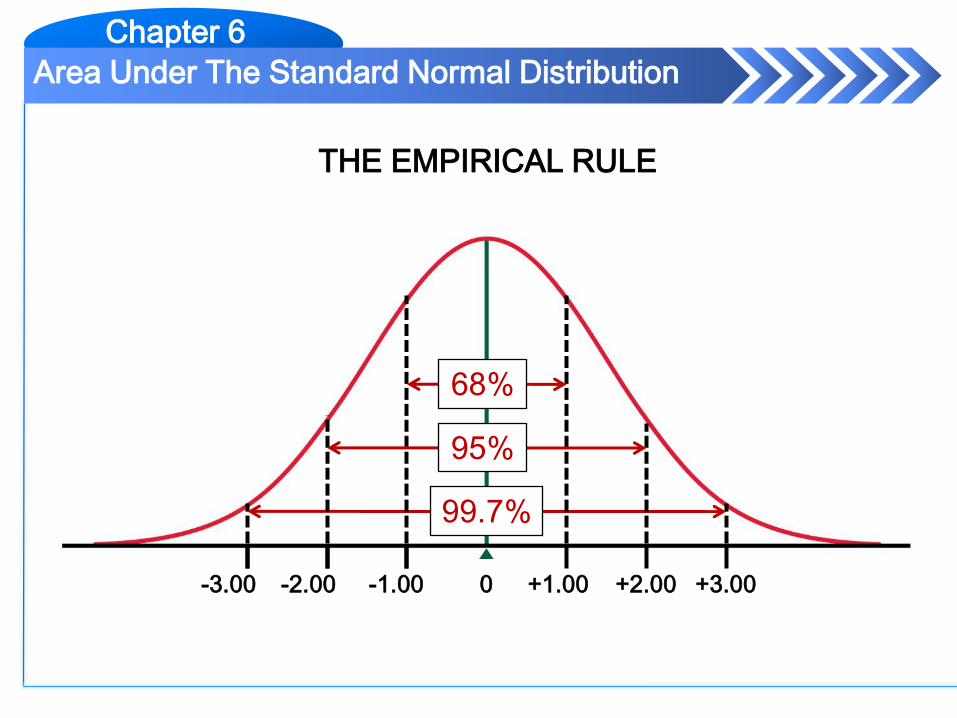
➊ We can also use z-scores to estimate the percentage of
scores expected to occur in a given range
➋ The Empirical Rule can help us understand how to
estimate the percentage of scores expected in a given
range:
• 68% of all scores are expected to be in the range
-1.00 to +1.00
• 95% of all scores are expected to be in the range
-2.00 to +2.00
• 99.7% of all scores are expected to be in the
range -3.00 to +3.00
The Standard Normal Distribution
Chapter 6
Area Under The Standard Normal Distribution
0 +1.00
99.7%
68%
95%
+3.00+2.00-3.00 -1.00-2.00
THE EMPIRICAL RULE
Chapter 6
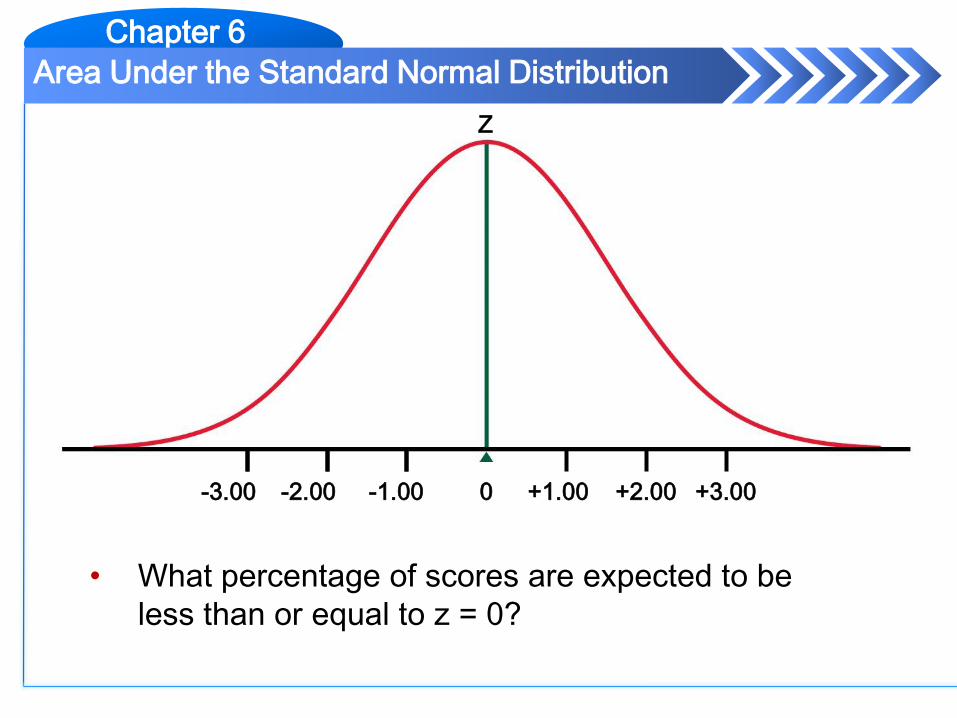
• What percentage of scores are expected to be
less than or equal to z = 0?
Area Under the Standard Normal Distribution
Z
0 +1.00 +3.00+2.00-3.00 -1.00-2.00

Chapter 6
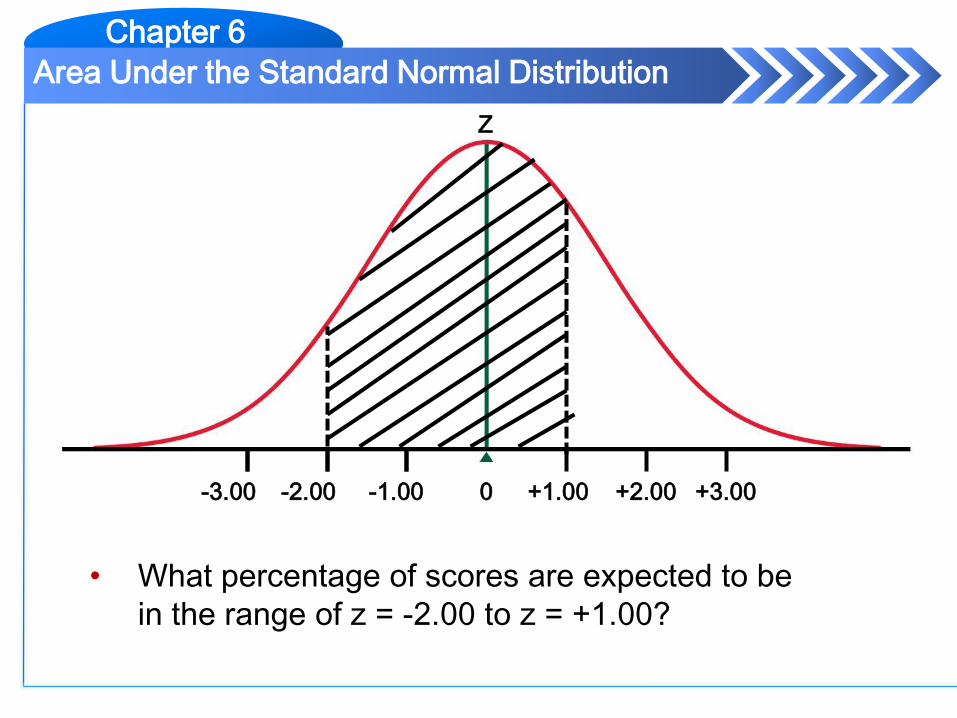
➊ Sketch the normal distribution
➋ Plot the approximate location of the z-score(s) in question
➌ Shade-in the area in question
➍ Use the Empirical Rule or Excel to obtain the estimated
percentage of scores at or below the z-score(s)
➎ When finding the percentage of scores between two z-
scores, subtract the smaller area from the larger area
The Standard Normal Distribution

Chapter 6
• What percentage of scores are expected to be
less than or equal to z = 0?
• ANSWER 50% of all scores are expected to
be equal to z = 0 or less
Area Under the Standard Normal Distribution
Z
0 +1.00 +3.00+2.00-3.00 -1.00-2.00

Chapter 6
• What percentage of scores are expected to be
in the range of z = -2.00 to z = +1.00?
Area Under the Standard Normal Distribution
Z
0 +1.00 +3.00+2.00-3.00 -1.00-2.00
Chapter 6
• What percentage of scores are expected to be
in the range of z = -2.00 to z = +1.00?
Area Under the Standard Normal Distribution
Z
0 +1.00 +3.00+2.00-3.00 -1.00-2.00

Chapter 6
• What percentage of scores are expected to be
in the range of z = -3.00 to z = -1.00?
Area Under the Standard Normal Distribution
Z
0 +1.00 +3.00+2.00-3.00 -1.00-2.00

Chapter 6
• What percentage of scores are expected to be
greater than or equal to z = +1.00?
Area Under the Standard Normal Distribution
Z
0 +1.00 +3.00+2.00-3.00 -1.00-2.00

Chapter 6
HEIGHT IN INCHES
68” 77”74”71”65”62”59”
• Using the height data, what percentage of the
sample is expected to be in the range of 59” to
65”?
Area Under the Standard Normal Distribution

Chapter 6
HEIGHT IN INCHES
68” 77”74”71”65”62”59”
• Using the height data, what percentage of the
sample is expected to be in the range of 59” to
65”?
Area Under the Standard Normal Distribution

Chapter 6
HEIGHT IN INCHES
68” 77”74”71”65”62”59”
• Using the height data, what percentage of the
sample is expected to be 62” or taller?
Area Under the Standard Normal Distribution

Chapter 6
HEIGHT IN INCHES
68” 77”74”71”65”62”59”
• Using the height data, what percentage of the
sample is expected to be 62” or taller?
Area Under the Standard Normal Distribution

End of Chapter 6 – Part 1