chapter 7 effect of conditioning ph on sulphur, gold …
TRANSCRIPT

CHAPTER 7 EFFECT OF CONDITIONING PH ON FLOTATION
95
CHAPTER 7
EFFECT OF CONDITIONING pH ON SULPHUR, GOLD AND
URANIUM FLOTATION
7.1 Introduction
The feed treated at No 2 Gold Plant consists of a mixture of tailings from the
cyanidation of run-of-mine ore and reclaimed dump material. Exposure of
this feed to air and water, coupled with the use of air during leaching all
subject the sulphide minerals to surface oxidation. Oxidized surfaces inhibit
their reaction with collector molecules. For optimal recovery, the negative
effect of surface oxidation has to be overcome.
Examination of thermodynamic data for metal-water systems shows certain
Eh-pH conditions in which metals are more stable in their cationic form
(Jackson, 1986). Subjecting oxides to these conditions promotes their
dissolution in order to achieve the thermodynamically supported species. In
this view, treatment of the oxidised flotation feed at low pH in the presence of
dissolved oxygen should favour the removal of iron oxides formed on pyrite,
thereby exposing underlying fresh sulphide. This is likely to improve
interaction with SIBX, and hence flotation response.
Based on this background, the effect of a low pH treatment prior to flotation
was investigated on No. 2 Gold Plant feed. After the initial conditioning for
1 minute, 1.25kg/t of sulphuric acid was added and the pH decreased from
7.8 to 1.9. At the same time, the pulp potential increased from 0.3V to 0.6VΩ.
The pulp was conditioned for 10 minutes, the pH rose to 3.7 and the potential
decreased to 0.5V. A caustic solution was added to achieve the standard
Ω All pulp potentials are reported versus the standard hydrogen electrode
UUnniivveerrssiittyy ooff PPrreettoorriiaa eettdd,, MMaakkaannzzaa AA TT ((22000066))

CHAPTER 7 EFFECT OF CONDITIONING PH ON FLOTATION
96
flotation pH of 7.2. At this point, the pulp potential was 0.3V. Flotation was
then carried out using the reagent suite of the standard.
7.2 Results and Discussion
7.2.1 Sulphur
Table 7.1 shows sulphur flotation initial rates and corresponding final
recoveries for the two conditioning pHs. The initial rate of 0.91min-1 at pH
1.9℘ indicates significantly higher sulphur flotation kinetics compared to the
0.66min-1 recorded at pH 7.2. This shows that conditioning at this low pH
activated sulphide surfaces, which improved interaction with flotation
reagents.
Table 7.1 Sulphur final recoveries and initial rates
Conditioning pH k (min-1) Rmax (%) R2
1.9 0.91 72.5 0.9995
7.2 0.66 77.4 0.9987
Table 7.2 shows pulp potential and pH values recorded during conditioning.
Superimposing these data on the Pourbaix diagram of the Fe-S-H2O system
can give an indication of the thermodynamically stable species, and hence
reactions that took place during conditioning.
Table 7.2 Pulp pH and potentials recorded during conditioning
Natural Eh-pH
After acid dosage
After 10 min conditioning
After caustic dosage
During Flotation
pH 7.8 1.9 3.7 7.2 7.2
Potential (V) 0.3 0.6 0.5 0.3 0.04
℘ This will be referred to as “pH 1.9 conditioning” throughout this discussion even though pH rose throughout conditioning until it stabilised at 3.7
UUnniivveerrssiittyy ooff PPrreettoorriiaa eettdd,, MMaakkaannzzaa AA TT ((22000066))

CHAPTER 7 EFFECT OF CONDITIONING PH ON FLOTATION
97
Figure 7.1 shows that the natural pulp pH and potential recorded for the
flotation feed (point A) coincide with the domain in which ferric oxideℵ is
thermodynamically stable. Immediately after sulphuric acid was added, the
two responses shifted to point B, which lies in the domain of ferrous ion
stability.
Figure 7.1 A Pourbaix diagram for the Fe-S-H2O system at 25oC, 10-4M [Fe], 10-
4M [S] showing Eh-pH conditions prevailing during conditioning [A] natural pulp Eh-pH, [B] after addition of 1.25kg/t sulphuric acid, [C] after 10 minutes of conditioning, [D] after dosage of a caustic solution to attain standard flotation pH
Any superficial iron oxide on pyrite particles should leach to form ferrous
ions. This exposes the underlying sulphide, so that it can interact freely with
flotation reagents. This probably accounts for the higher flotation kinetics.
Figure 7.2 shows sulphur recovery-grade curves plotted for the two
conditioning pHs. Even though pH 1.9 seemed superior at the beginning of
the experiment, the difference was small. By the end of both flotation
experiments, pH 7.5 had recorded a higher final recovery (Table 7.1). Figure
7.1 shows that after addition of caustic, the new pulp pH and potential fell in
the domain of ferric oxide (point C). If solubility limits were exceeded, then
ferric hydroxide should have precipitated. Because precipitation is not
ℵ Under normal conditions, the hydrated form of this oxide is formed
A
D
B
C
A B
C
D
UUnniivveerrssiittyy ooff PPrreettoorriiaa eettdd,, MMaakkaannzzaa AA TT ((22000066))

CHAPTER 7 EFFECT OF CONDITIONING PH ON FLOTATION
98
selective between sulphide and gangue, the hydroxide could have formed on
pyrite, which is likely to depress it. For the iron ions that remained in
solution, they can form a number of hydroxyl complexes with caustic. These
are likely to affect pyrite flotation with xanthate.
Sulphur Recovery (%)
30 40 50 60 70 80
Sul
phur
Gra
de (
%)
20
25
30
35
40
45
pH 7.2
pH 1.9
Figure 7.2 Sulphur recovery-grade curves
Jiang and co-workers (1998) observed significant depression in the neutral pH
range after 2 x 10⁻³M Fe3+ ions were added to ore pyrite at pH 3, which was
followed by adjustment of pulp pH to flotation pH and dosage of 3.3 x 10⁻⁴M
ethyl xanthate and 50mgl-1 MIBC. A similar exercise using ferrous ions
showed more significant depression in the same pH range. Examination of
speciation diagrams in Figures 7.3 and 7.4 plotted using STABCAL software
for the concentration of ferrous an ferric ions tested by Jiang et al. (1998)
predicts Fe2+, FeOH+ and Fe(OH)3 to be the stable species in the neutral pH
range.
By using iron-xanthate-water system distribution diagrams, the authors
showed that in neutral to weakly alkaline conditions (pH 5-9.5), some
hydroxyl xanthate species are formed, namely (Fe(OH)X2 and Fe(OH)+X.
Since FTIR measurements by Wang (1995) suggested that ferric xanthate is
UUnniivveerrssiittyy ooff PPrreettoorriiaa eettdd,, MMaakkaannzzaa AA TT ((22000066))

CHAPTER 7 EFFECT OF CONDITIONING PH ON FLOTATION
99
adsorbed on pyrite, Jiang and co-workers (1998) attributed the lower
recoveries to the lower hydrophobicity exhibited by the two complexes.
Figure 7.3 Speciation diagram for 2 x 10⁻³M Fe(III) as a function of pH at 25oC. STABCAL Software, NBS Database
Figure 7.4 Speciation diagram for 2 x 10⁻³M Fe(II) as a function of pH at 25oC. STABCAL Software, NBS Database
The depression of pyrite flotation following conditioning at pH 1.9 is
probably due to the two hydroxyl-xanthate species. The above speciation
diagrams suggest that conditioning at pH 1.9 promotes the formation of
Fe(OH)2+, Fe2+ and Fe(OH)+ in the pulp. When pH is raised to 7.2 using a
caustic solution, only Fe(OH)3 is the stable iron (III) species formed. Iron (II)
UUnniivveerrssiittyy ooff PPrreettoorriiaa eettdd,, MMaakkaannzzaa AA TT ((22000066))

CHAPTER 7 EFFECT OF CONDITIONING PH ON FLOTATION
100
forms FeOH+ and Fe2+ only. Addition of xanthate results in the formation of
(Fe(OH)X2 and Fe(OH)+X and ferrous xanthate as well. Due to its high
solubility, ferrous xanthate is unlikely to precipitate. For enhancement of
pyrite flotation, all these complexes have to either form on the surface or
adsorb after formation in solution (Davidtz, 2005). Failure to interact with the
surface will give poor flotation response since there will be less xanthate
available to impart hydrophobicity to pyrite. Since it is not always possible
that all the ferrous hydroxyl xanthates formed in solution will adsorb onto
pyrite, the presence of ferrous ions might have contributed to the lower
sulphide final recoveries in Figure 7.2.
Jiang et al. (1998) have showed that at a modest degree of oxidation; pyrite
surfaces behave like iron oxide with a PZC at pH 7. This is due to the presence
of ferric hydroxide formed during oxidation. The surface will acquire electro-
kinetic features of the iron hydroxide. The authors showed that in the
presence of 2 x 10⁻³M ferric ions and 6.6 x 10⁻⁴M ethyl xanthate, the zeta
potential of pyrite exhibited less positive charge below pH 7.5 compared with
that in the presence of ferric xanthate alone. At pH > 7.5, there was no
noticeable difference between the two. This implies that in the presence of
ferric ions, adsorption of xanthate onto pyrite is favoured in acidic conditions.
In the present work, flotation tests were run at pH 7.2. The speciation diagram
in Figure 7.9 has shown that under these conditions, all iron (III) will form
ferric hydroxide as a stable species so that it did not affect the flotation
response in the manner described above.
The work by Jiang et al. (1998) also showed that the PZC of pyrite in the
presence of 2x10⁻³M ferrous ions is pH 9. Addition of 6.6x10⁻⁴M ethyl xanthate
reduced it to pH 6. The authors observed that at pH < 6, the zeta potential
curve was identical to that in the presence of xanthate only and at pH > 6, it
was identical to that in the presence of only ferrous ions. From these results,
they concluded that ferrous ions do not undergo significant reaction with
UUnniivveerrssiittyy ooff PPrreettoorriiaa eettdd,, MMaakkaannzzaa AA TT ((22000066))
CHAPTER 7 EFFECT OF CONDITIONING PH ON FLOTATION
101
xanthate at pH < 6 and the flotation of pyrite in this region is mainly due to
the adsorption of xanthate on the surface. At pH > 6, the adsorption of
xanthate was reduced, which was in agreement with their flotation results.
Similarly, the presence of ferrous ions from low pH treatment in this present
work could have affected flotation recoveries by reducing xanthate
adsorption. This could have been due to the formation of ferrous hydroxyl
xanthate complexes in solution, rather than on the surface.
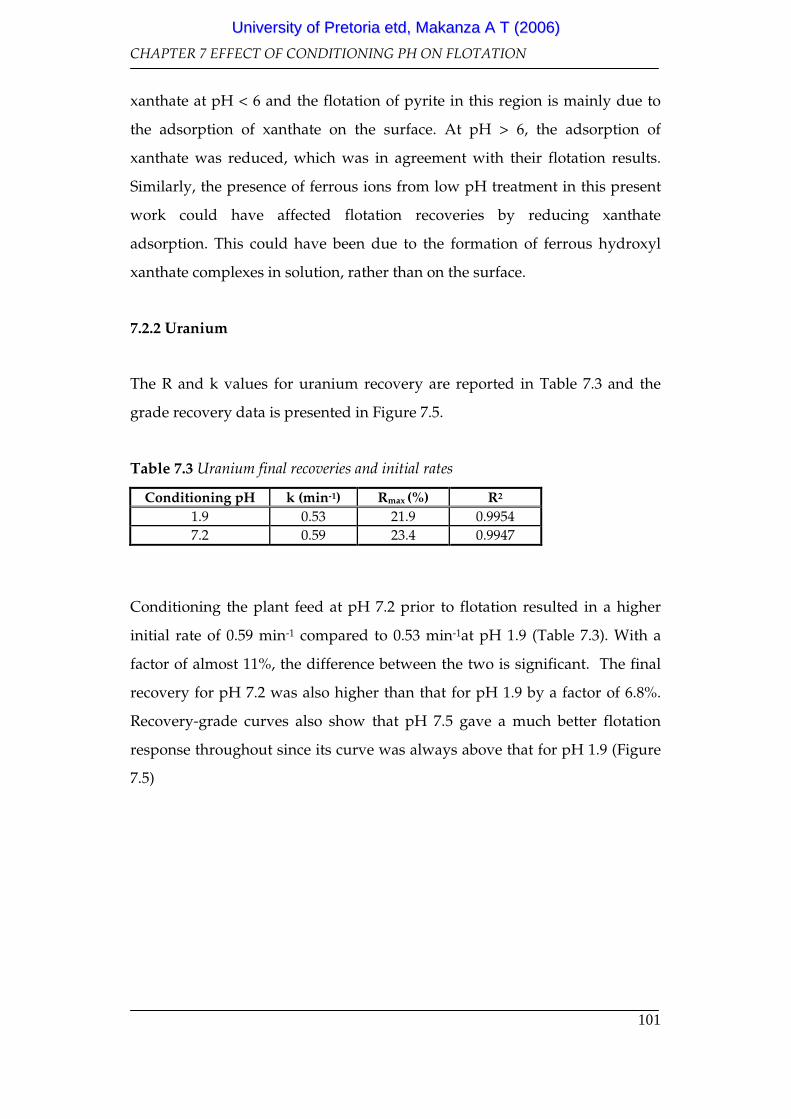
7.2.2 Uranium
The R and k values for uranium recovery are reported in Table 7.3 and the
grade recovery data is presented in Figure 7.5.
Table 7.3 Uranium final recoveries and initial rates
Conditioning pH k (min-1) Rmax (%) R2
1.9 0.53 21.9 0.9954
7.2 0.59 23.4 0.9947
Conditioning the plant feed at pH 7.2 prior to flotation resulted in a higher
initial rate of 0.59 min-1 compared to 0.53 min-1at pH 1.9 (Table 7.3). With a
factor of almost 11%, the difference between the two is significant. The final
recovery for pH 7.2 was also higher than that for pH 1.9 by a factor of 6.8%.
Recovery-grade curves also show that pH 7.5 gave a much better flotation
response throughout since its curve was always above that for pH 1.9 (Figure
7.5)
UUnniivveerrssiittyy ooff PPrreettoorriiaa eettdd,, MMaakkaannzzaa AA TT ((22000066))

CHAPTER 7 EFFECT OF CONDITIONING PH ON FLOTATION
102
U3O8 Recovery (%)
8 10 12 14 16 18 20 22 24 26
U3O
8 G
rade
(pp
m)
1000
1200
1400
1600
1800
2000
2200
pH 7.2
pH 1.9
Figure 7.5 Uranium grade-recovery curves recorded following conditioning at two pH values prior to flotation.
Ores mined from the Vaal Reef contain uranium predominantly in the form of
uraninite (Ford, 1993). Brannerite is also present but in much lower quantities
(Brown, 2002). These are oxides, yet are floated with a sulphide collector. The
effective recovery by sulphide flotation agents is probably due to the
association with other minerals that respond to xanthates, or due to some
activating species present on the uraninite surface.
Back-scattered Electron Imaging (BEI) and Energy Dispersive Spectroscopy
(EDS) have been used to identify the minerals in concentrates recovered with
SIBX. An EDS spectrum (Figure 7.7 (a)) of phase A (Figure 7.6) shows that it
contains 78.95 ± 0.83% wt U as uraninite. Phase B (Figure 7.6) on the other
hand contains vast amounts of sulphur and iron (Figure 7.7 (b)) as pyrite. The
darkest particles (C for instance) consist of aluminosilicates, free quartz and
some pyrophyllite (Figure 7.7 (c)).
UUnniivveerrssiittyy ooff PPrreettoorriiaa eettdd,, MMaakkaannzzaa AA TT ((22000066))

CHAPTER 7 EFFECT OF CONDITIONING PH ON FLOTATION
103
Figure 7.6 A back-scattered electron image taken from a concentrate recovered with
20g/t SIBXℜ
ℜ More back-scattered images are shown in Appendix A
B
A
C
UUnniivveerrssiittyy ooff PPrreettoorriiaa eettdd,, MMaakkaannzzaa AA TT ((22000066))

104
A
B
C
Element Wt % Wt % Error Al Si S
Ca Fe Pb U As
0.12 0.31 1.32 0.68 1.22 15.65 78.95 1.45
± 0.06 ± 0.06 ± 0.30 ± 0.08 ± 0.17 ± 2.90 ± 0.83 ± 1.21
Element Wt % Wt % Error Si S Fe Cl Zn
0.11 51.96 47.48 0.20 0.24
± 0.04 ± 0.35 ± 0.59 ± 0.08 ± 0.22
Element Wt % Wt % Error Al Si Ca Fe U
24.89 71.52 0.16 2.00 0.85
± 0.34 ± 0.62 ± 0.12 ± 0.29 ± 0.68
Figure 7.7 (a), (b) and (c) EDS spectra showing the elemental compositions of the corresponding phases shown in the back scattered electron image in Figure 4.32.
UUnniivveerrssiittyy ooff PPrreettoorriiaa eettdd,, MMaakkaannzzaa AA TT ((22000066))

CHAPTER 7 EFFECT OF CONDITIONING PH ON FLOTATION
105
The presence of lead (15.65 ± 2.90% wt) and sulphur (1.32 ± 0.30 wt %) in the
EDS spectra (Figure 7.7 (a)) of phase A (Figure 7.6) suggests the presence of
galena. This sulphide responds very well to flotation with xanthates (O'Dea et
al., 2001; Woods, 1971; Tolun and Kitchener, 1963). Presumably the presence
of lead acts as a good activator for thiol collectors.
Because of a mineralogical association between uraninite and galena, one may
expect a relationship between lead and uranium recovery. Plots of lead and
uranium recoveries versus mole percent of TTC dosed are shown in Figures
7.8 and 7.9. There does appear to be a relationship.
mole percent C10 TTC
0 8 16 25
Rec
over
y (%
)
0
2
4
6
8
10
12
14
16
18
Uranium
Lead
Figure 7.8 Lead and uranium recoveries for C10 TTC/SIBX mixtures
mole percent C12 TTC
0 8 16 25
Rec
over
y (%
)
0
2
4
6
8
10
12
14
16
18
20
Uranium
Lead
Figure 7.9 Lead and uranium recoveries for C12 TTC/SIBX mixtures
UUnniivveerrssiittyy ooff PPrreettoorriiaa eettdd,, MMaakkaannzzaa AA TT ((22000066))

CHAPTER 7 EFFECT OF CONDITIONING PH ON FLOTATION
106
Particle A in Figure 7.6 shows that it is part of a dispersion of fine particles
that is surrounded by a dark matrix. If the borders of the latter are traced,
they compound to a particle. This is more visible in another BEI shown in
Figure 7.10 below. During micro-probe analysis of a similar particle (Figure
7.11), while resin used to mount the sample was charred by the electron beam
of the instrument, this matrix did not respond. This shows that the matrix
differs from resin.
Figure 7.10 A dispersion of fine uranium-containing particles embedded in a larger particle found in a concentrate floated with 20g/t SIBX
Figure 7.11 A BEI taken from the micro-probe analysis of concentrates floated with 20g/t SIBX, (A) boundaries of a dark matrix carrying a fine dispersion of uranium particles, (B) uranium particles, (C) siliceous phase, (D) pyrite and (E) charring of resin after exposure to electron beam
Boarders of dark matrix
Uranium particles
A
B E
C
D
UUnniivveerrssiittyy ooff PPrreettoorriiaa eettdd,, MMaakkaannzzaa AA TT ((22000066))

CHAPTER 7 EFFECT OF CONDITIONING PH ON FLOTATION
107
EDS spectra (Figure 7.13) generated from the micro-probe analysis of phase A
(Figure 7.11) showed a carbon peak. Comparison between this peakℜ and that
on spectra from an iron-sulphide (Figure 7.12) eliminates the effect of carbon
introduced to increase the conductivity of the sample. Since the peak is larger,
the dark matrix is carbonaceous in nature and it could be the karogen (or
thucolite) that constitutes carbon seams found in the Witwatersrand Basin
(Rob and Meyer, 1995; Anhaeusser et al., 1987; Simpson and Bowels, 1977).
Since the carbonaceous matter is organic, it possesses natural hydrophobicity.
Another observation from the back-scattered electron image in Figure 7.11 is
that uranium and pyrite co-exist in a single particle. This implies that
uranium could at least partially be recovered with pyrite. The flotation
behaviour following pre-flotation conditioning at pH 1.9 can be accounted for
through the mineralogical relationships with pyrite, karogen and galena.
ℜ Note that the peak labelled [O] in Figure 4.39 is actually a carbon peak
UUnniivveerrssiittyy ooff PPrreettoorriiaa eettdd,, MMaakkaannzzaa AA TT ((22000066))

CHAPTER 7 EFFECT OF CONDITIONING PH ON FLOTATION
108
Figure 7.12 EDS spectra generated from the microprobe analysis of an iron sulphide
UUnniivveerrssiittyy ooff PPrreettoorriiaa eettdd,, MMaakkaannzzaa AA TT ((22000066))

CHAPTER 7 EFFECT OF CONDITIONING PH ON FLOTATION
109
Figure 7.13 EDS spectra generated from the microprobe analysis of the dark phase found in a concentrate recovered with 20g/t SIBX.
UUnniivveerrssiittyy ooff PPrreettoorriiaa eettdd,, MMaakkaannzzaa AA TT ((22000066))

CHAPTER 7 EFFECT OF CONDITIONING PH ON FLOTATION
110
Karogen is not expected to undergo chemical change at low pH because it is
essentially carbon. It might however adsorb ferric hydroxide, ferrous ions and
the respective hydroxyl complexes. Interaction between xanthate and the
adsorbed species will form hydroxyl xanthate complexes, which will enhance
flotation of karogen. This would consequently improve flotation of the hosted
uranium.
The flotation response of galena can be predicted by using thermodynamic
data to establish the species formed on the surface. Figure 7.13 shows a
Pourbaix diagram for the Pb-S-H2O system in which Eh-pH conditions
encountered in each conditioning stage (Table 7.2) have been superimposed.
Natural pulp potential and pH (point A) fall in the domain of Pb(OH)2
stability so that galena is likely to be coated by lead hydroxide. Conditions
prevailing immediately after acid addition and 10 minutes of conditioning
(points B and C) both predict the formation of PbSO4. After addition of a
caustic solution to adjust pH to the standard flotation pH, Pb(OH)2 is formed.
This implies that the flotation behaviour of galena is controlled by interactions
between lead hydroxide and the collector. O’Dea and co-workers (2001) have
proposed a mechanism in which the hydroxide attaches to the surface of
galena (equation 7.1). An exchange reaction between xanthate and hydroxide
may then take place (equation 7.2). Oxidation of xanthate to dixanthogen
accompanied by oxygen reduction may follow (equation 4.3).
PbS + Pb(OH)2 = PbS.Pb(OH)2 [7.1]
PbS.Pb(OH)2 + 2X- ↔ PbS.PbX2 + 2OH- [7.2]
PbS.PbX2 + ½O2 + 2H+ ↔ PbS.X2 + Pb2+ + H2O [7.3]
In this way, a mineralogical association between galena and uranium
minerals should enhance recoveries after low pH conditioning.
UUnniivveerrssiittyy ooff PPrreettoorriiaa eettdd,, MMaakkaannzzaa AA TT ((22000066))

CHAPTER 7 EFFECT OF CONDITIONING PH ON FLOTATION
111
Figure 7.13 A Pourbaix diagram for the Pb-S-H2O system at 25oC, 10-3M [Pb], 10-3M [S] showing Eh-pH conditions prevailing during conditioning [A] natural pulp Eh-pH, [B] soon after addition of 1.25kg/t sulphuric acid, [C] after 10 minutes of conditioning, [D] after addition of a caustic solution to attain standard flotation pH
4.4.3 Gold
Table 7.4 shows gold final recoveries and initial rates for the two conditioning
pHs tested. Corresponding recovery-grade curves are shown in Figure 7.14.
The curve for pH 1.9 is above that for pH 7.2 throughout, which implies a
better flotation response. This is also evidenced by their flotation initial rates;
pH 1.9 recorded 0.65min-1 while the latter gave 0.53min-1. A similar trend was
observed in the final recoveries, 43.9% compared to 41.5 %.
Table 7.4 Gold final recoveries and initial rates
Conditioning pH k (min-1) Rmax (%) R2
1.9 0.65 43.9 0.9931
7.2 0.53 41.5 0.9956
B
A C
D
UUnniivveerrssiittyy ooff PPrreettoorriiaa eettdd,, MMaakkaannzzaa AA TT ((22000066))

CHAPTER 7 EFFECT OF CONDITIONING PH ON FLOTATION
112
Gold Recovery (%)
10 15 20 25 30 35 40 45 50
Gol
d G
rade
(g/
t)
4
5
6
7
8
pH 1.9
pH 7.2
Figure 7.14 Gold recovery–grade curves plotted from data recorded from experiments in which No 2 Gold Plant feed was conditioned at pH 1.9 and pH 7.5 prior to flotation
Since gold is associated with cyanide insoluble pyrite (Parnell, 2001; Rob and
Meyer, 1995; Ford, 1993), recovery of this sulphide accounts for the recovery
of gold from leach residues (de Wet et al., 1995). Part of the feed to the plant
consists of reclaimed old dump material so that the sulphide is likely to be
oxidised. This is further influenced by air that is introduced to meet the
oxygen requirement of the cyanidation process. Low pH treatment prior to
flotation has already been shown to result in higher kinetics and lower final
recoveries. Rob and Meyer (1995) have also mentioned the presence of gold in
quartz veins in the Witwatersrand basin. This fraction, if partially liberated
will not be fully soluble in cyanide. Acid conditioning could have polished
the gold, and improved interaction with flotation reagents.
UUnniivveerrssiittyy ooff PPrreettoorriiaa eettdd,, MMaakkaannzzaa AA TT ((22000066))

CHAPTER 7 EFFECT OF CONDITIONING PH ON FLOTATION
113
7.2.4 Conclusions
Based on release curve experiments, conditioning at pH 1.9 gave significantly
higher sulphur flotation kinetics and slightly lower final recoveries compared
to the standard pH of 7.2. Uranium initial rates were higher although
recovery-grade curves showed that the standard pH was better all through. In
fact, uranium lost flotability considerably because the curve for the standard
was above throughout. Gold initial rates and final recoveries were
significantly improved by the low pH treatment. This was also shown in the
corresponding recovery-grade curve that was above the standard throughout.
Through use of EDS analysis and back-scattered electron images from micro-
probe analysis and scanning electron microscopy, all uranium-bearing
particles recovered with SIBX were shown to have an association with pyrite,
galena and/or karogen. The flotation of uranium was therefore attributed to
these relationships since all these minerals are flotable.
UUnniivveerrssiittyy ooff PPrreettoorriiaa eettdd,, MMaakkaannzzaa AA TT ((22000066))