chapter graduation: a m not the winning post
TRANSCRIPT

Graduation: a Milestone, not the WinninG Post
CHAPTER1
U N I T E D N AT I O N S C O N F E R E N C E O N T R A D E A N D D E V E L O P M E N T
The path to graduation and beyond: Making the most of the process
THE LEAST DEVELOPED COUNTRIES REPORT 2016

The Least Developed Countries Report 201616
A. Introduction
While the 2030 Agenda for Sustainable Development (2030 Agenda) and the Sustainable Development Goals imply a much stronger focus on the least developed countries (LDCs) than did the Millennium Development Goals (UNCTAD, 2015a), they do not include an explicit goal for graduation from LDC status. However, such a goal was previously established by the Programme of Action for the Least Developed Countries for the Decade 2011–2020 (the Istanbul Programme of Action (IPoA)), adopted in 2011. This included for the first time an explicit target for graduation — that at least half of the 49 countries classified as least developed at the time should satisfy the criteria for graduation from LDC status by 2020. Though not embodied in the 2030 Agenda, this represents a bold step by the international community to move LDC graduation towards the centre of international attention.
At the halfway point between the adoption of the IPoA target and the target date of 2020, it is timely to review the nature and historical experiences of graduation, and the outlook for graduation to 2020 and beyond.1 This is the focus of The Least Developed Countries Report 2016. It analyses the experience of LDC graduation since the establishment of the category in 1971, against the background of the major changes that have occurred in the global economic environment in this period; examines the outlook for graduation until 2024; and draws conclusions for national policies and international support measures (ISMs) for LDCs and the graduation process. The objective is to assist countries graduating in the future to achieve what this Report terms “graduation with momentum” — a development path leading to graduation that also establishes the basis needed for continued and solid sustainable development in the post-graduation phase.
The present chapter provides the historical context and conceptual framework for the remainder of the Report. Section B places graduation in the context of the origins and rationale of the LDC category and the underdevelopment “traps” that underlie it. This is followed by a presentation of the graduation process and criteria (section C), and the historical evolution of the LDC list as a result of new inclusions in, and graduations from, the category (section D). Section E highlights the greater-than-ever relevance of the LDC category, as a result of the economic and social divergence between LDCs and other developing countries (ODCs), reflecting the interaction between divergences in their productive capacities and long-term changes in the global economic environment. Section F presents graduation in the context of the longer-term process of development, emphasizing the importance of graduation with momentum. Finally, the economic and political calculus of graduation, from the perspective of LDC governments, is discussed in section G.
Following this chapter, the Report is structured around four further chapters. Chapter 2 presents projections for graduation cases in the 2017–2024 period and describes the national dynamics of graduation, including the role of geographical constraints, and the processes, strategies and policies leading to graduation. Chapter 3 examines the role and limitations of ISMs in bringing LDCs to graduation, including an assessment of their role in past graduation cases. Chapter 4 analyses the post-graduation phase of the development process, examining smooth transition, the costs and benefits of graduation, and the experience of those countries that have graduated to date. Chapter 5 discusses how graduation can be steered to achieve graduation with momentum, to avoid major post-graduation pitfalls and traps. It discusses policy alternatives for consideration by LDCs and by the international community to strengthen the development processes of LDCs and establish “graduation-plus” strategies for graduation with momentum.
The IPoA set a target that half of all LDCs should satisfy the criteria for
graduation by 2020.
This Report aims to help future graduates achieve “graduation
with momentum”.

17CHAPTER 1. Graduation: A Milestone, Not the Winning Post
B. The least developed country predicament, the rationale of the category and
the significance of graduation
1. the rationale of the least developed Country Category
The nature and significance of the graduation process emerge from the rationale of the LDC category. From its inception, the rationale of a distinct category of LDCs was that certain developing countries had particularly low levels of economic and human development and limited economic and export diversification, in most cases associated with these countries’ relatively recent emergence from colonial rule and/or geographical factors; and that this underdevelopment gave rise to insurmountable obstacles to their ability to engage with global markets or to derive developmental benefits from doing so. A brief history of the LDC category is presented in box 1.1.
Box 1.1. A brief history of the LDC category
The concept of the least developed countries has its origins in the first session of the United Nations Conference on Trade and Development (UNCTAD I), which adopted without dissent a recommendation that (United Nations, 1964, annex A.IV.1, paragraph 4, emphasis added)):
Industrialized countries and regional and international organizations should endeavour to increase the flow of the technical assistance needed to accelerate the growth of developing countries, and particularly of the least developed, to achieve the maximum efficiency in the use of external resources.
It also adopted a general principle that (United Nations, 1964, general principle fifteen:11, emphasis added):
The adoption of international policies and measures for the economic development of the developing countries shall take into account the individual characteristics and different stages of development of the developing countries, special attention being paid to the less developed among them, as an effective means of ensuring sustained growth with equitable opportunity for each developing country.
Both the concept of LDCs and the linkage with ISMs was reinforced by UNCTAD II in 1968, which adopted a resolution on “Special measures to be taken in favour of the least developed among the developing countries aimed at expanding their trade and improving their economic and social development”. This called on the Secretary-General of UNCTAD to (United Nations, 1968, resolution 24 (II)):
undertake studies of different aspects of the special problems of the least developed countries with a view to devising effective measures that would enable these countries to benefit fully from measures undertaken within the UNCTAD programme and framework.
While inviting other agencies “to identify such countries in the context of each measure concerned, taking fully into account the identifying criteria relevant to the policy measure in question” (resolution 24 (II), paragraph 2), it also requested the Secretary-General of UNCTAD “to continue studies relative to the identification of least developed countries” (paragraph 3(c)). This resolution thus provided the foundation both for the LDC category and later for The Least Developed Countries Report series, which UNCTAD started publishing in 1984.
On 13 December 1969, the United Nations General Assembly adopted the International Development Strategy for the Second United Nations Development Decade, including a section on the adoption of measures to support LDCs (resolution 2626(XXV):C.5). In early 1970, a working group of the United Nations Committee for Development Planning (later renamed the Committee for Development Policy (CDP)) was formed to identify the LDCs (box 1.2).
Further resolutions were passed on special measures in support of LDCs at UNCTAD III in 1972 and UNCTAD IV in 1976. However, a heightened sense of urgency was apparent at UNCTAD V in 1979, reflecting the adverse global economic environment for development at the time. In a resolution adopted without dissent, the Conference expressed concern that the UNCTAD III and IV resolutions had not been fully implemented, and also “deep concern at the gravity of the economic and social situation of the least developed countries”. It therefore launched “as one of its major priorities” a Comprehensive New Programme of Action for the Least Developed Countries, encompassing an Immediate Action Programme for 1979–1981 and a Substantial New Programme of Action for the 1980s. This programme was finalized and adopted unanimously by the international community in 1981 at the First United Nations Conference on the Least Developed Countries, which was convened in Paris by the General Assembly to establish such a programme. This was followed by further such conferences in 1990 (also in Paris), 2001 (in Brussels) and 2011 (in Istanbul), each of which adopted a programme of action for the following decade. The most recent of these is the IPoA. Sources: UNCTAD secretariat; CDP (2015); Guillaumont (2009).
The nature and significance of the graduation process emerge from
the rationale of the LDC category…

The Least Developed Countries Report 201618
Then as now, these obstacles were linked with the idea that LDCs are caught in an “underdevelopment trap” arising from a number of intersecting vicious circles, most notably the poverty trap and the commodity dependence (see, for example, Guillaumont, 2009; UNCTAD, 2002). The consequence is that the vulnerabilities associated with low levels of economic and human development and limited diversification of production and exports in LDCs hamper their ability to derive developmental benefits from engagement in international markets. This view, the conceptual roots of which can be traced to the seminal work of development economists such as Rosenstein-Rodan, Nurkse and Hirschmann, was and remains a key part of the rationale for the LDC category.
It should be emphasized that the terminology of “traps” does not mean that these problems are insurmountable or deterministic, although they may be exacerbated by geographical challenges (for example, landlocked position, extremely small size or remoteness). Rather, “traps” are vicious circles that need to be overcome if a country is to establish a sustainable development path (Sindzingre, 2012). Nonetheless, escaping from such traps requires specific and concrete actions.
The international community therefore decided to establish ISMs, especially in the fields of finance, trade, technology and technical assistance, to assist “low-income countries which faced severe structural handicaps to economic growth and development and needed access to support beyond what was commonly available for all developing countries” (CDP, 2015). By providing more favourable treatment for LDCs than for ODCs, such measures were intended to help them to break out of the trap of underdevelopment, to overcome their major development challenges, and thus to embark on a path of sustainable growth and development.
Establishing ISMs specific to LDCs required the establishment of a clearly defined category of LDCs, and thus a set of criteria as a basis for such a definition. A corollary of this, though not operationalized until two decades after the establishment of the LDC category in 1971, is the definition of a point at which a country has attained a sufficient level of development that it has escaped the traps associated with underdevelopment, and therefore no longer requires the special treatment associated with LDC status – that is, a point at which it should be considered to have graduated from LDC status.
Hence, it is in the context of these traps and vicious circles, the most important of which are outlined in the following subsections, that the significance and nature of graduation can best be understood.
2. the poverty trap
A poverty trap can be defined as “a circular constellation of forces tending to act and react upon one another in such a way as to keep a poor country in a state of poverty” (Nurkse, 1953:4). On the one hand, low incomes and slow economic growth are reflected in a persistently high incidence of poverty; on the other, pervasive poverty acts as a brake on investment, limiting economic growth (Azariadis and Stachurski, 2005). Where the majority of the population lives at income levels at or below those necessary to meet their basic needs, this all-pervasive poverty acts as a major constraint on economic growth (UNCTAD, 2002).
Collectively, LDCs are the group of countries where poverty is most pervasive. In 2011, all but seven LDCs had a poverty headcount ratio above 30 per cent, whereas in only five ODCs was it even above 25 per cent (UNCTAD, 2015a). Poverty reduction has also been much slower in LDCs than in ODCs, and fell
…particularly the idea that LDCs are caught in an underdevelopment
“trap”.
LDC-specific ISMs are intended to enable LDCs to break out of this
trap…
…requiring clear criteria to define which countries are LDCs.
The poverty trap arises because low incomes and slow growth increase poverty, while poverty slows growth
by limiting investment.

19CHAPTER 1. Graduation: A Milestone, Not the Winning Post
far short of the Millennium Development Goals target: in LDCs, the poverty headcount ratio fell by less than one third, from 65.7 per cent in 1990 to 44.8 per cent in 2011, compared with a fall from 47.7 per cent to 18.1 per cent in ODCs (United Nations, 2015). Thus almost half of the overall population of LDCs lives in poverty, with much higher rates in some individual LDCs – in excess of 70 per cent in 2011 in Burundi, the Democratic Republic of the Congo, Liberia, Madagascar, Malawi and Zambia.2
A major mechanism through which poverty hampers growth and development is its negative effects on the domestic resources available to finance investment and the provision of public goods. Where the majority of the population lives in absolute poverty, a major part of the gross domestic product (GDP) must be devoted to the necessities of life, giving rise to low savings and very limited capital accumulation. This in turn leads to low fixed investment, and thus to low productivity and low incomes.
Similarly, State capacities tend to be weaker where extreme poverty is pervasive. This situation gives rise to a very narrow fiscal base, which limits the provision of public services such as education, health, administration, and law and order. While government revenues, public investment and government final consumption expenditure in LDCs may appear little lower than in ODCs in terms of GDP share, this translates into extremely limited resources in absolute per-capita terms (UNCTAD, 2002).
An important aspect of poverty traps in LDCs is the fact that a large majority (two thirds) of the LDC labour force works in agriculture, especially smallholder agriculture, which suffers from chronically low and slow-growing labour productivity. This is, in itself, a major cause of poverty, and thus tends to be self-perpetuating: the high levels of risk aversion inherent in extreme poverty interact with the extreme uncertainties of agricultural yields, output and income that are characteristic of traditional smallholder agriculture; and this limits the adoption of new technologies and techniques that could raise labour productivity and household incomes (UNCTAD, 2015a).3
There are thus various vicious circles — processes of circular and cumulative causation — in which the high incidence and severity of poverty act as constraints on economic growth, which in turn perpetuates all-pervasive poverty.4 A similar phenomenon arises from the detrimental effect of poverty on the environment: widespread and serious poverty may lead to environmental degradation, undermining sustainability, as people have to overexploit natural capital to make an adequate living, even if this ultimately reduces the productivity of key assets on which their livelihoods depend (Barrett et al., 2011). Over time, such environmental degradation also increases the uncertainty of agricultural production, further impeding technological upgrading.
3. the Commodity-dependenCe trap
The international aspect of the poverty trap is particularly apparent in those countries that are heavily dependent on primary commodities. A complex set of interrelated trade and financial relationships may lock a country in to a disadvantageous pattern of market integration, exposing it to boom-and-bust cycles that ultimately compound its structural vulnerabilities and exacerbate poverty. While the coexistence of globalization with chronic poverty clearly does not indicate a causal relationship, it does mean that economic outcomes are increasingly determined by global economic forces, and not solely related to household, local and national factors (UNCTAD, 2002).
Since the majority of LDCs, notably in the African region, depend heavily on primary commodities for the generation of employment, income, and
Poverty is systematically higher, and falling more slowly, in LDCs than in
other developing countries...
…undermining domestic resource mobilization and State capacities.
Poverty traps are particularly pervasive in agriculture, which
employs two thirds of the workforce in LDCs.
Poverty tends to lead to unsustainable exploitation of
natural capital.
Trade and financial relationships may lock a country into commodity
dependence.

The Least Developed Countries Report 201620
foreign exchange, a natural starting point for successful graduation strategies is the upgrading of the commodity sector. Key objectives in this respect are to improve productivity and to increase domestic value addition by fostering backward and forward linkages in key segments of the value chain, as a means of promoting commodity-based industrialization (UNECA and AUC, 2013; Morris and Fessehaie, 2014). This requires countries to overcome an array of challenges related to insertion into commodity value chains and upgrading within them. These include volatile and unstable international prices, intense competition among suppliers of raw materials, and barriers to skill development and adoption of more sophisticated technologies. Other challenges, particularly those related to resource management and utilization, are commodity specific, including, for example, the adoption of sustainable production practices and reduction of post-crop losses in agriculture.
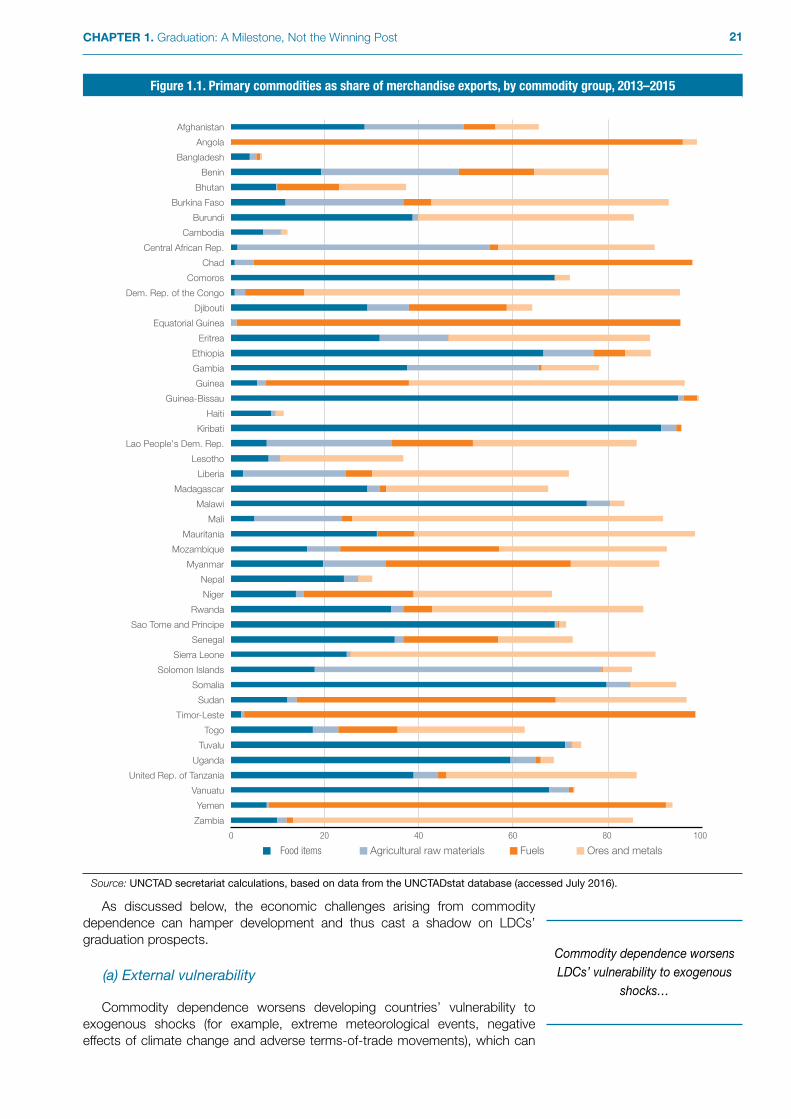
Most LDCs are characterized by a high level of reliance on primary commodities, particularly for export revenues, but also as essential sources of employment (in the case of agricultural commodities), income and government revenues. Abundant natural endowments of mineral and fuel stocks or agricultural land (compounded in many cases by legacies from the colonial era) have shaped LDCs’ comparative advantages and specialization strongly towards primary commodity sectors. In the overwhelming majority of LDCs (38 of the 47 for which data are available), commodities accounted for more than two thirds of merchandise exports in 2013–2015.
In nearly half of the LDCs, the disproportionate weight of primary commodities in the export basket is mainly driven by food items, particularly tropical beverages and fish, and agricultural raw materials such as cotton. Exports of minerals, and particularly metals, play a key role for the African LDCs that make up the mineral exporters group in the classification used in this Report (the Democratic Republic of the Congo, Guinea, Mali, Mauritania, Rwanda, Sierra Leone and Zambia), while fuels account for the great majority of merchandise export revenues for the fuel exporters group (Angola, Chad, Equatorial Guinea and Yemen)5 (figure 1.1).
Commodity dependence inhibits the emergence and development of activities in other sectors, thus restricting economic and export diversification. It can thus lock countries into a development path based on static comparative advantage rather than the dynamic evolution of comparative advantage in progressively more sophisticated and development-oriented activities.
The changes in the commodity shares in LDC exports clearly demonstrate the persistence of commodity export dependence (figure 1.2). As the figure shows, only a handful of LDCs (Afghanistan, Burundi, the Comoros, Solomon Islands and Uganda) have experienced any significant reduction in their dependence on primary commodities since the beginning of the century, while around a quarter have seen increases of a similar magnitude. More generally, despite many instances of growth accelerations partly or wholly underpinned by commodity sectors, relatively few commodity-dependent developing countries have managed to achieve sustainable development gains through successful economic diversification.
Concerns about the persistence of commodity dependence have often been linked with other factors such as a supposed secular decline of commodity prices (generally referred to as the Prebisch-Singer hypothesis), exposure to commodity price volatility and the absence in the commodity sectors of the opportunities for increasing returns and learning-by-doing characteristic of the manufacturing sector. Previous UNCTAD publications have argued that the current international trade and financial architecture reinforces commodity-related boom-and-bust cycles, by limiting the policy space available to commodity-dependent countries to take measures to increase the sophistication of their economies by increasing value addition to locally sourced commodities (UNCTAD, 2013a, 2014a).
In 38 LDCs commodities accounted for more than two thirds of
merchandise exports in 2013–2015.
Commodity dependence is driven mainly by agricultural produce in
nearly half of LDCs, and by minerals and fuels in many African LDCs.
Commodity dependence can lock countries into a development path based on static comparative
advantage.
Only a handful of LDCs have reduced their commodity
dependence significantly since 2000, while it has increased
in around a quarter.
21CHAPTER 1. Graduation: A Milestone, Not the Winning Post
Figure 1.1. Primary commodities as share of merchandise exports, by commodity group, 2013–2015
0 20 40 60 80 100
Zambia
Yemen
Vanuatu
United Rep. of Tanzania
Uganda
Tuvalu
Togo
Timor-Leste
Sudan
Somalia
Solomon Islands
Sierra Leone
Senegal
Sao Tome and Principe
Rwanda
Niger
Nepal
Myanmar
Mozambique
Mauritania
Mali
Malawi
Madagascar
Liberia
Lesotho
Lao People's Dem. Rep.
Kiribati
Haiti
Guinea-Bissau
Guinea
Gambia
Ethiopia
Eritrea
Equatorial Guinea
Djibouti
Dem. Rep. of the Congo
Comoros
Chad
Central African Rep.
Cambodia
Burundi
Burkina Faso
Bhutan
Benin
Bangladesh
Angola
Afghanistan
Food items Agricultural raw materials Fuels Ores and metals
Source: UNCTAD secretariat calculations, based on data from the UNCTADstat database (accessed July 2016).
As discussed below, the economic challenges arising from commodity dependence can hamper development and thus cast a shadow on LDCs’ graduation prospects.
(a) External vulnerability
Commodity dependence worsens developing countries’ vulnerability to exogenous shocks (for example, extreme meteorological events, negative effects of climate change and adverse terms-of-trade movements), which can
Commodity dependence worsens LDCs’ vulnerability to exogenous
shocks…

The Least Developed Countries Report 201622
Figure 1.2. Primary commodities as share of merchandise exports in LDCs
0 20 40 60 80 100
Zambia
Yemen
Vanuatu
United Rep. of Tanzania
Uganda
Tuvalu
Togo
Timor-Leste
Sudan*
Somalia
Solomon Islands
Sierra Leone
Senegal
Sao Tome and Principe
Rwanda
Niger
Nepal
Myanmar
Mozambique
Mauritania
Mali
Malawi
Madagascar
Liberia
Lesotho
Lao People's Dem. Rep.
Kiribati
Haiti
Guinea-Bissau
Guinea
Gambia
Ethiopia
Eritrea
Equatorial Guinea
Djibouti
Dem. Rep. of the Congo
Comoros
Chad
Central African Rep.
Cambodia
Burundi
Burkina Faso
Bhutan
Benin
Bangladesh
Angola
Afghanistan
2013–20152000–2002
Source: UNCTAD secretariat calculations, based on data from the UNCTADstat database (accessed July 2016).
have serious and wide-ranging macroeconomic impacts. Terms-of-trade shocks are of particular relevance, as dependence on primary commodity exports tends to be associated with a high level of export concentration, particularly among LDCs (figure 1.3). Since commodity price changes are essentially exogenous to most LDCs, whose capacity to withstand large commodity shocks is very limited, these countries bear a disproportionate share of the adjustment costs of commodity market volatility.
…as shown by the 2008-2009 financial crisis and the subsequent
slump in commodity prices.

23CHAPTER 1. Graduation: A Milestone, Not the Winning Post
The risks associated with commodity market volatility have been highlighted both by the 2008–2009 crisis and by the more recent (and ongoing) slump in commodity prices. Contrary to the implication of the “efficient market hypothesis”, there is little evidence that commodity financialization has reduced price volatility. Rather, it has introduced spurious price signals, reflecting trading decisions based largely on financial market movements rather than on market fundamentals for each commodity (UNCTAD, 2015b; UNCTAD and Arbeiterkammer Wien, 2011). The greater correlation between commodity and other financial markets increases the difficulty of coping with often procyclical price movements, whose macroeconomic effects can be substantial (UNCTAD, 2013a).
While rising commodity prices undoubtedly underpinned growth in LDC export revenues for most of the 2000s, especially among African LDCs, much of this expansion stemmed from an increase in prices rather than in export volumes. Export volume growth has been increasingly outpaced by that of imports, further increasing exposure to adverse terms-of-trade shocks. In a context of chronic current account deficits in the majority of LDCs (with the notable exception of fuel exporters in some years), adverse price movements even in a few key commodity markets have the potential to trigger significant terms-of-trade shocks, putting pressure on the balance of payments (subsection 4).
It should also be noted that LDCs’ dependence on imports of food and fuel exposes them to price volatility in commodity markets for these goods as importers, in addition to their exposure to the markets for their major products as exporters. Since imports of food and fuel are both difficult to compress in the short term, and highly vulnerable to sharp fluctuations in international prices, this high level of import dependence reinforces the external vulnerability arising from
Figure 1.3. Primary commodity dependence and export concentration, 2012–2014
0
10
20
30
40
50
60
70
80
90
100
Expo
rts c
once
ntra
tion
inde
x
0 10 20 30 40 50 60 70 80 90 100
Share of primary commodities in merchandise exports
Non-LDCsLDCs
Source: UNCTAD secretariat calculations, based on data from the UNCTADstat database (accessed July 2016).
Adverse price movements even in a few key commodity markets
can put pressure on the balance of payments.
LDCs are also exposed as importers to price volatility in commodity
markets for food and fuel.

The Least Developed Countries Report 201624
commodity dependence. This tendency has recently been demonstrated by the experiences of net fuel importing LDCs in the 2003–2011 period and of net food importers in 2008–2011.
(b) Global value chains
The emergence of global value chains (GVCs) has the potential to create a more efficient international division of labour and open new opportunities of economic diversification. However, it also raises the risk of locking in LDCs’ commodity dependence through specialization in primary commodities and low-value-added products, thereby hampering the gradual upgrading of the sophistication of production and exports that lies at the core of successful development trajectories (Hausmann et al., 2007).
In principle, connecting to GVCs, even though the production of raw material or of simple apparel (as in the case of Lesotho, Haiti and various Asian LDCs) can provide firms with opportunities to accumulate technological capabilities, acquire tacit knowledge and establish business relationships, thus paving the way for subsequent upgrading (UNCTAD, 2013c). However, the process of upgrading along a GVC is far from automatic, and depends on a number of factors, including the input-output structure, geographic features and governance of the supply chain, and the interaction of these factors with the socioeconomic and institutional context of the host country (Gereffi et al, 2005; UNCTAD, 2013a; UNECA, 2015a). In the case of the apparel sector in Lesotho and Madagascar, for example, more locally-embedded regional or diaspora-owned firms tend to provide greater upgrading prospects than other lead firms, whose primary interest is in exploiting preferential access to the United States market under the Africa Growth and Opportunity Act (Staritz and Morris, 2013).
While captive value chains (those characterized by asymmetric bargaining power between the lead firm and its suppliers) typically offer less potential for upgrading, the scope for sophistication may be enhanced by the presence of a supportive institutional framework and innovation system (Pietrobelli and Rabellotti, 2011). Examples include Botswana’s diamond industry, where the Government has played a significant role in fostering linkages to downstream activities, through the establishment of the international branch of the Diamond Trading Company and the promotion of training programmes on gem-cutting and polishing (UNECA, 2015a).
Fuel and mineral commodity value chains tend to be capital-intensive, and moving beyond basic transformation requires specific engineering and/or chemical skills and reliable energy supply, factors which are typically lacking in LDCs. Even in sectors where they display revealed comparative advantage, LDCs are thus mostly confined to low-end activities and to the role of exporters of raw materials (UNCTAD, 2007: chap.1). This suggests that the emergence of GVCs and the associated reorganization of the production process have in most cases left LDCs’ commodity dependence virtually unchanged. While both trade in intermediate goods and trade in value-added terms suggest that the majority of LDCs have established small but rapidly expanding forward linkages within global supply chains (UNECA, 2015a), these relationships are often restricted to the supply of products embodying limited domestic value addition.
Similar problems arise in LDC agricultural sectors, which are typically dominated by smallholder farmers, as the benefits to small producers of connecting to agricultural GVCs are likely to be limited by the concentration of market power that characterizes them. For example, four transnational corporations control more than 60 per cent of the global coffee market, while three control 85 per cent of the world’s tea market. This poses significant challenges to small producers at the early stages of buyer-driven value chains controlled by global retailers and category buyers (UNCTAD, 2013a).
The emergence of global value chains raises the risk of locking in LDCs’ commodity dependence…
...as upgrading along GVCs depends on a number of country-specific
factors.
The scope for upgrading within a GVC can be enhanced through
supportive institutions.
Fuel and mineral commodity value chains tend to be capital-intensive, and LDCs are mostly confined to
low-end activities.

25CHAPTER 1. Graduation: A Milestone, Not the Winning Post
(c) The natural resource curse
Commodity dependence, and dependence on mineral and fuel exports more particularly, has often been associated with sluggish growth and poor economic and social performance, a phenomenon often referred to as the “natural resource curse” (Frankel, 2010; Gylfason, 2001; Sachs and Warner, 1995). In addition to “Dutch disease” (associated with exchange rate appreciation triggered by surging commodity export revenues undermining the competitiveness of manufacturing), concerns revolve primarily around the limited use of the resources generated by extractive industries due to weak incentives for savings and investment (including in human capital) and obstacles to harnessing resource rents for development. Resource rents originating in extractive industries are unequally distributed, partly reflecting a “race to the bottom” to attract resource-seeking foreign direct investment (FDI) through lower taxation and royalties and weaker regulation. Combined with the limited reinvestment in the local economy of profits from extractive industries, which have in practice mostly been remitted, this has constrained LDCs’ ability to leverage primary commodities for structural transformation (UNCTAD, 2010, 2013a).
Illicit financial flows through trade mis-invoicing are a particularly important dimension of the resource mobilization issue, in light of their documented magnitude, making this a high policy priority for commodity-dependent LDCs, most notably in the fuel, mining and timber sectors (Mevel et al., 2013; UNCTAD, 2016a; UNDP, 2011; UNECA, 2015b). A recent study by UNCTAD, for example, documents significant under-invoicing of Zambian copper exports to most trading partners (UNCTAD 2016b).
Limited resources and weak incentives for investment represent a particular obstacle to reducing commodity dependence, because investment and human capital are essential to the development of new sectors and activities, and particularly to increasing the sophistication of production. This is compounded by the Dutch-disease effect, which reduces the incentives for investment in tradeable sectors in particular. Economic diversification is further inhibited by the inability of commodity-dependent LDCs to move beyond low-end activities or to foster the establishment of backward and forward linkages with the domestic economy. This reinforces the enclave nature of extractive industries in many LDCs, limiting opportunities for value addition and job creation.
Thus, while extractive industries have undoubtedly contributed to improving the macroeconomic fundamentals of many LDCs, their long-term developmental benefits depend crucially on the economic and institutional framework. Although mineral and fuel exports contribute substantially to generating government revenues and foreign-exchange earnings, their expansion has made little contribution to poverty reduction, even during boom phases (UNCTAD, 2013a).
4. balanCe-of-payments Constraints to growth
LDCs’ generally very narrow export bases, exposure to variations in international commodity prices and heavy dependence on imports of essential goods results in a strong tendency towards chronic current accounts deficits. This has been compounded by a strong tendency for their trade opening to be accompanied by a trend towards stronger growth of imports than of exports, except for commodity exporters in periods of booming prices. When non-debt-creating financial flows such as official development assistance (ODA) and FDI are limited, this gives rise to accumulation of foreign debt; and overindebtedness limits access to countercyclical financing to offset external shocks, as well as potentially triggering highly damaging debt crises, such as those experienced by many African LDCs in particular throughout the 1980s and 1990s (UNCTAD, 2016a).
The benefits to small producers of connecting to agricultural GVCs are limited by concentration of market
power.
Commodity dependence is also associated with the “natural
resource curse”.
Illicit financial flows through trade mis-invoicing are a key deterrent
to resource mobilization.
The Dutch-disease effect weakens incentives for investment
in tradable sectors.
Despite macroeconomic benefits, extractive industries have
contributed little to poverty reduction.

The Least Developed Countries Report 201626
The current account balances of LDCs since 2000 are shown in figure 1.4, by export categories. This highlights particularly the very wide swings in the current account balances of fuel exporting countries. Mineral and agricultural exporters also show wide variations, with persistent and often large deficits; and mixed exporters also show consistently large deficits. While the current account of manufactures exporters is broadly in balance over time, with much more limited variations, services exporters moved from significant surpluses before the financial crisis to substantial deficits in the post-crisis period.
Large current account deficits arise in part from the heavy dependence of most LDCs on imports of food, fuels and capital goods. Imports of capital goods (as well as intermediate goods and specialist services) are essential to the investment needed for the development or productive capacities, not least as a means of accessing new technologies needed to upgrade production and increase productivity. Equally, however, food and fuel imports are difficult to reduce at times of external shocks. This can give rise to a tension between the two: either food and fuel imports are maintained at the expense of capital goods, limiting investment and slowing growth and the development of productive capacities; or imports of capital goods are maintained (for example, due to binding commitments to investors), intensifying pressure on imports of food and fuels, with potential impacts on the well-being of the population. More generally, foreign-exchange shortage or exchange rate depreciation as a result of external shocks reduces the attractiveness of investments that use imported items, which are more likely to embody productivity-enhancing technologies.
The balance of payments is thus typically a constraint to LDCs’ long-term economic growth and development (Thirlwall, 1979) and, hence, to graduation. Chronic current account deficits typically dampen investment and growth prospects, as they often end with a sharp balance of payments adjustment occasioned by tightening external financing constraints (Cavallo et al., 2016).
Figure 1.4. Current account balance of LDCs, by export category, 2000–2014
0
5
-15
-10
-5
10
15
20
2000
2001
2002
2003
2004
2005
2006
2007
2008
2009
2010
2011
2012
2013
2014
2000
2001
2002
2003
2004
2005
2006
2007
2008
2009
2010
2011
2012
2013
2014Pe
r cen
t of G
DP
A. Most commodity-dependent groups B. Less commodity-dependent groups
Agricultural and food exporters Fuel exporters
Minerals exporters
Manufactures exporters Services exporters
Mixed exporters
Source: UNCTAD secretariat calculations, based on data from the UNCTADstat database (accessed July 2016).Note: For the composition of the groups, see p.xiii.
Large current account deficits result partly from heavy dependence on imports of food, fuels and capital
goods…

27CHAPTER 1. Graduation: A Milestone, Not the Winning Post
Since the severity of these constraints depends on the composition of imports (in the short term) and of production and exports (in the longer term), economic diversification is a key element in overcoming them.
The period since the global financial and economic crisis has seen renewed recourse by LDCs to balance-of-payments support from the International Monetary Fund (IMF). Since 2010, IMF facilities have been used by 29 LDCs, of which 14 were using the Extended Credit Facility and two the Standby Credit Facility in September 2016.6 While increases in foreign-exchange reserves in most LDCs over the last decade may contribute to easing their foreign-exchange constraints, reserve accumulation entails a considerable opportunity cost in terms of forgone mobilization of finance for developmental purposes.
5. the signifiCanCe of graduation
The above discussion provides a basis for an interpretation of the significance of graduation in the context of the LDC predicament and the rationale for the LDC category. In principle, graduation marks the point at which an LDC has escaped sufficiently from the vicious circles described above to enable it to operate in, and benefit from, international markets on an equal footing with ODCs — that is, to make a transition from reliance primarily on exceptional international support to a greater degree of reliance on international markets.
As discussed in section F, however, policy approaches to graduation also need to go beyond the need to escape from the traps particular to the earliest stages of development, and take fully into account the need to prepare for the challenges of development beyond graduation. In other words, it is not sufficient merely to fulfil the criteria and complete the processes of graduation itself. The aim should rather be to achieve graduation with the momentum required to maintain development progress in the post-graduation period.
C. The graduation process and criteria
The concept of graduation was established only in 1991. Until that point, the criteria for LDC status had only been considered in relation to the addition of new countries to the list. Since then, the CDP has conducted triennial reviews, as part of which it analyses each LDC’s performance against the graduation criteria and decides whether it is statistically eligible for graduation.
While the criteria for addition to, and graduation from, the LDC category have changed significantly over time (box 1.2), they are now based on three elements:
• The income criterion — gross national income (GNI) per capita;
• A human assets index (HAI);
• An economic vulnerability index (EVI).
The components of the HAI and EVI are shown in box figure 1.1.
An LDC may be considered to be statistically qualified for graduation if it achieves the threshold levels of two of these three indicators, or (since 2006) if its GNI per capita is at least double the threshold level. The latter is referred to as income-only graduation, and was introduced in response to rapid growth in certain LDCs — notably some oil-producing countries — which continued to perform poorly on the other graduation criteria.
…and give rise to balance-of- payments constraints to long-term
development and graduation.
In principle, graduation marks the point at which an LDC has
escaped from the vicious circles of underdevelopment.
Graduation is based on three criteria: GNI per capita, a human assets index and an economic
vulnerability index.

The Least Developed Countries Report 201628
Box 1.2. Evolution of the criteria for inclusion in, and graduation from, the LDC category
In 1971, in the interests of simplicity and clarity, the CDP established three criteria for a country’s classification as an LDC:
• GDP per capita of $100 or less;
• An adult literacy rate (among those above 15 years of age) of 20 per cent or less;
• A share of manufacturing value added in GDP of 10 per cent or less.
Eligibility was based on countries meeting these three criteria. However, recognizing the need for flexibility in applying these criteria, the CDP allowed a slightly higher GDP per capita threshold (of $120) for countries that met the literacy and manufacturing criteria. In borderline cases, it also took account of recent growth rates and particular factors likely to affect the relevant indicators. In 1971, the CDP identified 25 countries as LDCs on this basis. The criteria were adopted by the United Nations General Assembly following reviews by the Economic and Social Council and an UNCTAD committee established for the purpose. The CDP was accorded the role of recommending revisions both to the criteria and the list of LDCs.
These criteria have been modified repeatedly over time (box figure 1.1). From 1975, the CDP decided that the threshold for GDP per capita should be adjusted, not only for global inflation (which was particularly high at the time), but also for global growth. The threshold was adjusted in this way in 1975, 1985 and 1990. In 1980, observing that adult literacy rates in several LDCs had increased above the threshold level while their economies remained undiversified and poverty remained acute, the CDP adopted a hierarchy of criteria, with GDP per capita at the top and literacy rates at the bottom. They thus allowed a country to be classified as an LDC if it met the GDP per capita and manufacturing-value-added criteria even if its literacy rate was above the threshold level.
The first substantial revision of the criteria came in 1991, when the adult literacy rate was replaced by the augmented physical quality of life (APQL), a broader composite indicator of human development; and the share of manufacturing in GDP was similarly replaced by a broader economic diversification index (EDI). The APQL retained the adult literacy rate, but combined this with indicators of health (life expectancy at birth), nutrition (per-capita calorie supply) and education (the combined primary and secondary school enrolment ratio). The EDI, likewise, included the share of manufacturing in GDP, but combined this with the export concentration ratio, the share of employment in industry and per-capita electricity consumption.
An additional criterion for inclusion was also added in 1991, although this was not considered in the context of graduation – that the population should be less than 75 million. This allowed Bangladesh to retain its LDC status, but would have prevented countries such as Nigeria or Pakistan from joining the list.
In 1991, the gap between the inclusion and graduation thresholds was fixed in absolute terms for each criterion ($100 in the case of GDP per capita). In its 1991 review, the CDP also emphasized the importance of flexibility in application of the graduation criteria, and the need to take account of other considerations such as natural resources, natural disaster risks and dependency on ODA in borderline cases. This was taken a step further in 1999, when the CDP decided that consideration of the inclusion and graduation criteria should be supplemented by a qualitative assessment of vulnerability. In the three years following the review in which the criteria were met, in the case of potential inclusion cases, UN/DESA was to prepare an assessment note on eligibility; and, in the case of potential graduation cases, UNCTAD was to produce a vulnerability profile, to be supplemented by ex-ante assessments of the likely consequences of graduation and potential gains and risks following graduation.
In 1999, the EDI was replaced with the EVI. While retaining export concentration, this changed the manufacturing value-added indicator to the share of manufacturing and modern services in GDP. Reflecting the shift of emphasis from diversification to vulnerability, the share of employment in industry and per-capita electricity consumption were dropped; and the logarithm of population (reflecting the greater vulnerability of very small economies) was added, together with indicators of the instability of agricultural production and of exports of goods and services (as indicators of vulnerability to climatic shocks and external economic shocks, respectively). More minor changes were also made to the health and nutrition components of the AQPL: life expectancy at birth was replaced by the under-5 mortality rate; and per-capita calorie supply was replaced with average calorie intake as a percentage of calorie requirements.
Two further minor changes occurred in 2002, when GDP per capita – unchanged as a criterion since 1971 – was replaced with GNI per capita, and the AQPL was further modified (replacing the combined primary and secondary enrolment ratio with the gross secondary school enrolment ratio) and renamed the human assets index (HAI).
In 1999, the gap between the inclusion and graduation criteria was changed to a fixed percentage (15 per cent, compared with 11–17 per cent for the previous absolute differences). In 2002, the margin between inclusion and graduation thresholds for GNI per capita was increased from 15 per cent to 20 per cent, while those for the HAI and EVI were reduced from 15 per cent to 10 per cent.
In 2005, average calorie intake per capita as a percentage of calorie requirements was replaced as a component of the HAI by the percentage of the population who are undernourished.
The EVI has also been further modified twice, in 2005 and 2011. In 2005, two further indicators were added – remoteness and homelessness due to natural disasters — and the share of manufacturing and modern services in GDP as a positive indicator was replaced with the share of agriculture, forestry and fisheries in GDP as a negative indicator. In 2011, homelessness due to natural disasters was replaced by a wider measure of victims of natural disasters; and the share of population in low-lying coastal areas was added, to reflect the potential risk of rising sea levels and storm surges as a result of climate change.
Sources: CDP (2015); Guillaumont (2009).

29CHAPTER 1. Graduation: A Milestone, Not the Winning Post
2011 LDCs are low-income countries suffering from the most severe structural impediments to sustainable development
GNI per capita Human Assets Index (HAI) Economic Vulnerability Index (EVI)
• Percentage of population undernourished (1/4) • Population size (1/8)• Remoteness (1/8)• Merchandise export concentration (1/16)
• Share of population in low-lying coastal zones (1/8)
• Gross secondary school enrolment ratio (1/4)• Adult literacy rate (1/4)
• Victims of natural disasters (1/8)• Instability of agricultural production (1/8)• Instability of exports of goods and services (1/4)
2005 LDCs are low-income countries suffering from low levels of human resources and a high degree of economic vulnerability
GNI per capita Human Assets Index (HAI) Economic Vulnerability Index (EVI)
• Percentage of population undernourished • Population size• Remoteness• Merchandise export concentration•
• Gross secondary school enrolment ratio• Adult literacy rate
• Homelessness due to natural disasters• Instability of agricultural production• Instability of exports of goods and services
2002 LDCs are low-income countries suffering from low levels of human resources and a high degree of economic vulnerability
GNI per capita Human Assets Index (HAI) Economic Vulnerability Index (EVI)
• Average calorie intake per capita as a percentage of the calorie requirement
• Population size• Export concentration• Share of manufacturing and modern services in GDP
• Gross secondary school enrolment ratio• Adult literacy rate
• Instability of agricultural production• Instability of exports of goods and services
1999 LDCs are low-income countries suffering from low levels of human resources and a high degree of economic vulnerability
GDP per capita Augmented Physical Quality of Life Index (APQLI) Economic Vulnerability Index (EVI)
• Average calorie intake per capita as a percentage of the calorie requirement•
• Population size• Export concentration• Share of manufacturing and modern services in GDP
• Combined primary and secondary school enrolment ratio• Adult literacy rate
• Instability of agricultural production• Instability of exports of goods and services
1991 LDCs are low-income countries suffering from long-term handicaps to growth, in particular, low levels of human resource development and/or severe structural weaknesses
GDP per capita Augmented Physical Quality of Life Index (APQLI)
• Per capita calorie supply• Life expectancy at birth
• Export concentration ratio• Share of manufacturing in GDP• Share of employment in industry• Per capita electricity consumption
• Combined primary and secondary school enrolment ratio• Adult literacy rate
1971 LDCs are countries with very low levels of per capita gross domestic product facing the most severe obstacles to development
GDP per capita • Adult literacy rate • Share of manufacturing in GDP
Source: UNCTAD secretariat, based on CDP and UNDESA (2015).Notes: Bold type indicates new components or new names. For the 2011 criteria, numbers in parenthesis indicate the weighting in the index composition.
Box 1.2 (contd.)
The Least Developed Countries Report 201630
To qualify for graduation, a country must meet these conditions in at least two consecutive triennial reviews. As a further measure to limit the risk of premature graduation, resulting in a graduating country subsequently reverting to LDC status, the threshold levels of the indicators for graduation are set above those for inclusion in the category.
Where a country meets these conditions for graduation, the CDP can make a recommendation for graduation for consideration by the Economic and Social Council. However, such a recommendation does not follow automatically from fulfilling the statistical graduation criteria — the specific circumstances of each country, particularly its vulnerability, are also taken into account, as is the anticipated impact of graduation and the loss of LDC treatment.
If the Economic and Social Council endorses the recommendation — again taking account of country circumstances and the likely impact of graduation — it sends the case to the United Nations General Assembly to take the final decision on the country’s graduation, including its timing. While graduation should in principle take place three years after the decision to graduate the country is taken, a different grace period may be agreed. Longer periods have been agreed in nearly all graduation cases, but not as yet a shorter one.
Given the potential adverse effects of loss of access to LDC-specific ISMs, a three-year period following graduation is granted to enable the country to negotiate a “smooth transition” process with its development partners, so as to avoid disruption to development plans and programmes. The CDP continues to monitor the progress of graduating countries following their graduation and UNCTAD provides technical assistance to accompany the country during this phase.
D. The evolution of the least developed country list
In principle, it might seem reasonable to expect that the list of LDCs would become shorter over time, as countries escape from the vicious circles outlined above – particularly as the primary objective of establishing the LDC category was to allow countries to develop sufficiently, through ISMs and national development strategies, to be able to engage more successfully in global markets.
In practice, however, this has not been the case. On the contrary, the number of LDCs doubled from the original list of 25 in 1971 to a peak of 50 between 2003 and 2007, declining only to 48 since 2014 (figure 1.5). However, while this has been partly a result of changes in country circumstances, two other factors have been largely responsible: countries gaining independence (including by secession from existing States); and changes in the LDC criteria and the graduation thresholds (box 1.2).
The geographical composition of the group has varied relatively little since 1971 (figure 1.5). The main change has been the increase in the proportion of island economies, from 8 per cent (2 of 25) when the category was established in 1971, to 20 per cent (8 of 39) 15 years later, largely reflecting the late attainment of independence by many countries in this group.
As well as the number of new countries becoming LDCs, the near doubling of the size of the group in the last 45 years in part reflects the small number of countries graduating out of the category — just four in the 25 years since
LDCs can graduate either by meeting two of the three criteria, or by reaching double the graduation
threshold for GNI per capita.
Country-specific circumstances are also taken into account in graduation
decisions.
After a transition period of at least three years, graduating countries
lose access to LDC-specific ISMs.
The number of LDCs doubled from 25 LDCs in 1971 to 50 in 2003–
2007, and has since fallen only to 48.

31CHAPTER 1. Graduation: A Milestone, Not the Winning Post
the principle of graduation was established (Botswana in 1994, Cabo Verde in 2007, Maldives in 2011 and Samoa in 2014). While these limited numbers in part reflect relatively slow progress towards the graduation thresholds, they may also reflect changes in the economic and political calculus of graduation, as discussed in section F below.
After 45 years of relative stability, however, the expected increase in the number of countries expected to graduate in the coming years, if realized, is likely to give rise to much more significant changes in the composition of the group. This is discussed in chapter 2.
E. The least developed country category: More relevant than ever
1. eConomiC divergenCe and the growing ConCentration of soCial deprivation
The global economy and the landscape for development have changed dramatically since the LDC category was introduced. Nonetheless, it unquestionably remains valid. Indeed, it is of greater relevance than ever. Some ODCs, particularly emerging economies, have grown strongly, and their per-capita incomes have converged rapidly towards the global average. Despite some improvement in their growth performance in the early part of the twenty-first century, the LDCs have been left ever further behind.
Thus, the average GDP per capita of ODCs and countries with economies in transition (as a single group) has increased by nearly half relative to that of the world as a whole in just 16 years, from 28.4 per cent in 1998 to 42.8 per cent in 2015. By contrast, the figure for (current) LDCs rose by barely a quarter over the same period, from 5.8 per cent to 7.3 per cent; and even this increase did little
Figure 1.5. Number of LDCs by geographical group, 1971–2016
0
10
20
30
40
50
60
1971 1975 1980 1985 1990 1995 2000 2005 2010 2015
African LDCs and Haiti Asian LDCs Island LDCs
Source: UNCTAD secretariat elaboration, based on CDP and UNDESA (2015).
To date, only four countries have graduated from LDC status: Botswana, Cabo Verde, Maldives
and Samoa.
Widening economic and social gaps between LDCs and ODCs make
the LDC category more relevant than ever.

The Least Developed Countries Report 201632
more than reverse the reduction experienced since the early 1980s (figure 1.6). The GDP per capita of LDCs as a whole has fallen almost continuously relative to that of ODCs and countries with economies in transition since 1981, from more than a quarter to barely one sixth. This ratio fell in all but 5 of the 33 years from 1981 to 2014.
LDCs have also fallen ever further behind in terms of social indicators in recent decades (figure 1.7). While their share in the world population has increased only from 9.7 per cent to 12.8 per cent since 1990, the proportion of extreme poverty accounted for by LDCs has doubled from less than 20 per cent to nearly 40 per cent, accelerating markedly since the beginning of the current economic and financial crisis which broke out in 2008. Over the same period, the share of people in LDCs without access to electricity has increased by two thirds, from 31.8 per cent to 53.4 per cent; and the share of people without access to water has more than doubled, from 20.0 per cent to 43.5 per cent.
This further highlights the contemporary relevance of the LDC category, particularly in light of the increased emphasis on social goals embodied in the 2030 Agenda and the Sustainable Development Goals, which have the avowed aim of “leaving no one behind”. The LDCs are the epitome of those left behind in the global economy, both economically and in human development; and, as observed in The Least Developed Countries Report 2015 (UNCTAD, 2015a), their increasing share of the social ills addressed by the Sustainable Development Goals makes them the battleground on which the 2030 Agenda will be won or lost. If extreme poverty is to be eradicated globally by 2030, in line with the 2030 Agenda, it must be eradicated everywhere; and it is in the LDCs that extreme poverty is systematically most generalized and most severe, and where it is falling most slowly. A similar logic applies to other Sustainable
Figure 1.6. LDC and ODC GDP per capita as percentage of world average, 1981–2014
0
5
10
15
20
25
30
35
40
45
1981 1983 1985 1987 1989 1991 1993 1995 1997 1999 2001 2003 2005 2007 2009 2011 2013
ODCs and transition economiesLDCs
Source: UNCTAD secretariat calculations, based on data from World Bank, World Development Indicators database (accessed May 2016).
LDCs' GDP per capita has fallen almost continuously relative to
ODCs and transition economies since 1981.
LDCs now account for twice as large a proportion of global poverty and of people without access to electricity
as in 1990.

33CHAPTER 1. Graduation: A Milestone, Not the Winning Post
Development Goal targets, such as access to water, sanitation and electricity, preventable child deaths and children out of school. Achieving such outcomes will require both very close attention to the LDCs and continued and enhanced international support.
2. divergenCe in produCtive CapaCities
The economic divergence between LDCs and ODCs has reflected, and is reflected in, a widening gap in their productive capacities. Advanced education is critical to the development of productive capacities, not only in the fields of science and technology, but also in areas such as management, and business and public administration. However, tertiary education enrolment ratios in LDCs have fallen progressively further behind the overall figure for developing countries. Even in relative terms, there was only a brief convergence, from 2004 until 2010, and the absolute gap has continued to widen (figure 1.8). In 1970, the tertiary enrolment ratio in LDCs was 1.6 per cent, compared with 4.0 per cent across developing countries as a whole; by 2013 the ratio had increased
Figure 1.7. LDCs’ share in world population, poverty and infrastructure shortfalls, 1980–2014
0
10
20
30
40
50
60
1990 1995 2000 2005 2010 2015
% of people in extreme poverty (estimated)
% of people without access to electricity
% of people without access to water
% of world population
Source: UNCTAD secretariat estimates, based on data from World Bank, World Development Indicators database and World Bank, PovcalNet database (both accessed April 2016).
Notes: Figures for extreme poverty are approximate, and based on a poverty line of $1.25 per day at 2005 purchasing power parity (PPP) (due to the unavailability of data for some LDCs at 2011 PPP at the time of writing). The estimates provided are based on the overall poverty headcount ratio for all LDCs for which data are available, multiplied by the total population for all LDCs. Since no data are available for Afghanistan, Angola (before 2002), Equatorial Guinea, Eritrea, Kiribati, Myanmar, the Solomon Islands, So-malia, Tuvalu and Vanuatu, this effectively assumes that the average poverty headcount ratio across these countries is equal to the average across the other LDCs.
The 2030 Agenda aims to "leave no one behind" - and the LDCs are the epitome of those left behind in the
global economy.
Economic divergence has reflected, and is reflected in, a widening gap in
productive capacities.

The Least Developed Countries Report 201634
to 26.4 per cent for developing countries as a whole, but only to 9.0 per cent in LDCs – a level attained by the developing world as a whole in 1996. Moreover, retention of high-level human capital is as important, and can be as problematic, as its production. Not only is the supply of graduates in LDCs barely one third of that in ODCs, but the “brain drain” is substantially greater, further widening the gap: the proportion of graduates from LDCs living abroad is more than half as much again as in ODCs, at 12.4 per cent in 2000, compared with 7.9 per cent for ODCs (UNCTAD, 2007).
There is also a widening technological gap between LDCs, on the one hand, and ODCs and developed countries on the other, a trend documented by previous UNCTAD research (UNCTAD, 2014b). A dramatic divergence has occurred in their respective science and technology outputs. The ratio between the number of patents filed per capita by ODC and LDC citizens soared from 35 in 1980 to 907 in 2014, reflecting a strong intensification of ODC efforts in science and technology, and a virtual stagnation in LDCs (figure 1.9A). The share of middle and high skills- and technology-intensive manufactures in total merchandise exports (an indicator of export sophistication) has consistently been around 10 times higher in ODCs than in LDCs, and the gap has widened still further in recent years (figure 1.9B).
The divergence in energy use – another important measure of productive capacities – has also been dramatic (figure 1.10). Between 1971 and 2013, per-capita energy use in LDCs increased by only 12.5 per cent, compared with 169 per cent across ODCs.
Financial depth and inclusion is another important enabler of the development of productive capacities, given its role in financing productive investment (UNCTAD, 2006), as well as in channelling remittances to development in
Figure 1.8. Tertiary education enrolment ratio, LDCs and ODCs, 1970–2013
0
5
10
15
20
25
30
1970 1974 1978 1982 1986 1990 1994 1998 2002 2006 2010 2012
LDCs ODCs
Source: UNCTAD secretariat calculations, based on data from World Bank, World Development Indicators database (accessed April 2016).
The widening LDC-ODC gap can be seen in tertiary education and
graduate emigration…
…patent registration and skills- and technology-intensive
manufactured exports.

35CHAPTER 1. Graduation: A Milestone, Not the Winning Post
Figure 1.9. Selected indicators of technological capabilities in LDCs and ODCs
0
10
20
30
40
50
60
1995 1997 1999 2001 2003 2005 2007 2009 2011 2013 2015P
er c
ent
of m
erch
adis
e ex
port
s
B. Exports of medium and high skill- andtechnology-intensive manufactures, 1995–2015
0
50
100
150
200
250
1980 1985 1990 1995 2000 2005 2010 2014
Num
ber
of p
aten
ts p
er m
illio
n in
habi
tant
s,by
app
lican
t's
orig
in
A. Patents per capita, 1980–2014
LDCs ODCs
Source: UNCTAD secretariat calculations, based on data from World Intellectual Property Organization, WIPO Statistics Database; and UNCTADstat database (both accessed September 2016).
Figure 1.10. Per capita energy use, LDCs and ODCs, 1971–2013
LDCs ODCs
0
200
400
600
800
1 000
1 200
1 400
1 600
1971 1974 1977 1980 1983 1986 1989 1992 1995 1998 2001 2004 2007 2010 2013
Ener
gy u
se (k
g oi
l equ
ivale
nt p
er c
apita
)
Source: UNCTAD secretariat calculations, based on data from World Bank, World Development Indicators database (accessed April 2016).
The Least Developed Countries Report 201636
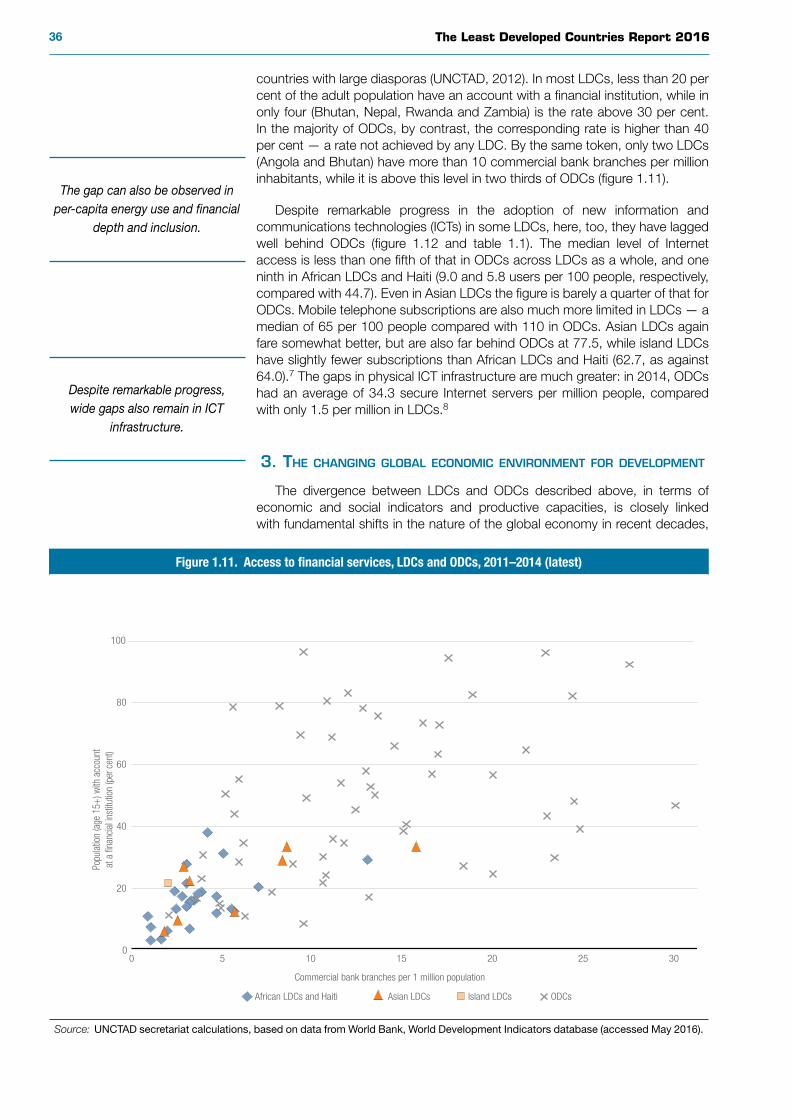
countries with large diasporas (UNCTAD, 2012). In most LDCs, less than 20 per cent of the adult population have an account with a financial institution, while in only four (Bhutan, Nepal, Rwanda and Zambia) is the rate above 30 per cent. In the majority of ODCs, by contrast, the corresponding rate is higher than 40 per cent — a rate not achieved by any LDC. By the same token, only two LDCs (Angola and Bhutan) have more than 10 commercial bank branches per million inhabitants, while it is above this level in two thirds of ODCs (figure 1.11).
Despite remarkable progress in the adoption of new information and communications technologies (ICTs) in some LDCs, here, too, they have lagged well behind ODCs (figure 1.12 and table 1.1). The median level of Internet access is less than one fifth of that in ODCs across LDCs as a whole, and one ninth in African LDCs and Haiti (9.0 and 5.8 users per 100 people, respectively, compared with 44.7). Even in Asian LDCs the figure is barely a quarter of that for ODCs. Mobile telephone subscriptions are also much more limited in LDCs — a median of 65 per 100 people compared with 110 in ODCs. Asian LDCs again fare somewhat better, but are also far behind ODCs at 77.5, while island LDCs have slightly fewer subscriptions than African LDCs and Haiti (62.7, as against 64.0).7 The gaps in physical ICT infrastructure are much greater: in 2014, ODCs had an average of 34.3 secure Internet servers per million people, compared with only 1.5 per million in LDCs.8
3. the Changing global eConomiC environment for development
The divergence between LDCs and ODCs described above, in terms of economic and social indicators and productive capacities, is closely linked with fundamental shifts in the nature of the global economy in recent decades,
Figure 1.11. Access to financial services, LDCs and ODCs, 2011–2014 (latest)
0
20
40
60
80
100
0 5 10 15 20 25 30
Popu
latio
n (a
ge 1
5+) w
ith a
ccou
ntat
a �
nanc
ial i
nstit
utio
n (p
er c
ent)
Commercial bank branches per 1 million population
African LDCs and Haiti Asian LDCs Island LDCs ODCs
Source: UNCTAD secretariat calculations, based on data from World Bank, World Development Indicators database (accessed May 2016).
The gap can also be observed in per-capita energy use and financial
depth and inclusion.
Despite remarkable progress, wide gaps also remain in ICT
infrastructure.

37CHAPTER 1. Graduation: A Milestone, Not the Winning Post
Figure 1.12. ICT access, LDCs, ODCs and graduating countries, 2014
0
10
20
30
40
50
60
70
80
90
100
50 100 150 200
Inte
rnet
use
rs p
er 1
00 p
opul
atio
n
Mobile telephone subscriptions per 100 people
ODCsAfrican LDCs and Haiti Asian LDCs Island LDCs LDC graduates
Source: UNCTAD secretariat calculations, based on data from World Bank, World Development Indicators database (accessed May 2016).
Table 1.1. Median access to ICTs by country group, 2014
Mobile telephone subscriptions Internet users Secure Internet servers
(Per 100 population) (Per 1 million population)
LDCs (total) 64.9 9.0 1.5
African LDCs and Haiti 64.0 5.8 1.4
Asian LDCs 77.5 11.9 1.6
Island LDCs 62.7 10.6 9.1
LDC graduates 144.5 30.7 40.9
Other developing countries 110.1 44.7 34.3
Source: UNCTAD secretariat calculations, based on data from World Bank, World Development Indicators database (accessed May 2016).
particularly from a development perspective (UNCTAD, 2015b). In particular, this divergence is related to the major increase in the role of commercial transactions, and the corresponding reduction in the relative importance of non-market mechanisms, since the inception of the LDC category. This is clearly demonstrated in figure 1.12, above. Trade has increased from around 12 per cent of global GDP in the 1960s to around 30 per cent since 2011. FDI has risen from an average of 0.4 per cent of global GDP between 1970 and 1985 to between 2 per cent and 5 per cent since 1998. ODA, by contrast, fell by nearly half relative to global GDP, from 0.35 per cent in the early 1960s to an average of less than 0.2 per cent since 1996. By contrast, migrants’ remittances, which were less than half as much as ODA in the early 1970s, are now three times as great as ODA. FDI flows, which were around 1.5 times greater than ODA in the 1970s and early 1980s, have been between 10 and 20 times greater since 1997.
Divergence is also linked to the shift in the global economy from ODA
to commercial transactions.

The Least Developed Countries Report 201638
In the context of LDCs and graduation, this has three critically important implications. First, the major increase in the importance of trade and international investment in the global economy has made success in development ever more dependent on effective engagement with export markets and foreign investors, and latterly on being able to secure a position in higher-value segments of GVCs. This has dramatically highlighted the gap in productive capacities between LDCs and ODCs, intensifying its effects on the LDCs’ prospects for success.
Second, the greatly increased flows of trade and international investment have strengthened the rewards available to those countries that are most successful in competing for them. Together, these two factors have made an important contribution to the increasing divergence between LDCs and ODCs in economic and human development highlighted above. At the same time, this has increased the need for effective international support to the development of productive capacities in LDCs, to enable them to compete more successfully in a changing international landscape.
Third, the decline in ODA relative to private capital flows and trade has limited its impact. Its effectiveness has also been impaired by extraneous influences on its allocation, such as commercial, financial, geopolitical and domestic political considerations rather than relative needs (Alesina and Dollar, 2000; Dollar and Levin, 2006). In the 1960s, ODA per capita to the countries that are now LDCs was approximately equal to that to ODCs, increasing only slowly during the course of the decade. Following the official recognition of the LDC category in 1971, however, ODA to LDCs increased dramatically, peaking at 3.5 times that for ODCs in per-capita terms in 1987. Thereafter, however, the trend was reversed, the ratio having fallen to 2 by 1999. Despite the inclusion in the Millennium Development Goals and the 2001 Programme of Action for the Least Developed Countries for the Decade 2001–2010 (the Brussels Programme of Action) of a target of 0.15–0.20 per cent of donor GNI for ODA to LDCs, the
Figure 1.13. ODA, trade, FDI and remittances as percentage of world GDP, 1960–2015
0
5
10
15
20
25
30
35
0
1
2
3
4
5
6
7
1960 1965 1970 1975 1980 1985 1990 1995 2000 2005 2010 2015
Remittances FDI ODATrade (right-hand scale)
Source: UNCTAD secretariat calculations, based on data from World Bank, World Development Indicators database (accessed April 2016).
The growing importance of international markets intensifies
the effect of the divergence in productive capacities on LDCs' prospects…
…widening the economic gap with ODCs and increasing the need for
more effective international support.

39CHAPTER 1. Graduation: A Milestone, Not the Winning Post
ratio has fluctuated widely in a range between 2 and 3 since 2000, but with no clear trend (figure 1.14).
F. Graduating to what?
1. a milestone, not the winning-post
The above discussion highlights the importance of considering graduation from the LDC category in the context of a broader and longer development process. While developing countries are often divided into broad categories, of which the LDCs are one, these do not generally represent clearly demarcated groups. Rather, developing countries are spread across a continuous spectrum, whether in terms of income, commodity dependence, fragility or any other criterion or set of criteria. The precise criteria for LDC status do not signify a clearly defined boundary between fundamentally different economies, any more than the threshold between the low- and middle-income, or between the lower- and upper-middle-income categories. A degree of arbitrariness is inevitable in any such classification.
This progressive nature of development means that graduation — and still more the achievement of the statistical criteria for graduation — is not an end in itself. It marks the end of a political and administrative process, but not the completion of an economic or developmental process. Rather, it should indicate that a certain minimal level of development has been achieved as the initial stage of a single continuous process – that the threshold has been crossed from dependency on ISMs to a capacity to rely primarily on markets.
Figure 1.14. Real ODA receipts per capita, LDCs and ODCs, 1960–2014
0
10
20
30
40
50
60
70
1960 1964 1968 1972 1976 1980 1984 1988 1992 1996 2000 2004 2008 2012 2014
$ pe
r cap
ita, 2
013
pric
es
LDCs ODCs
Source: UNCTAD secretariat calculations, based on data from World Bank, World Development Indicators database (accessed March 2016).
The criteria for LDC status do not signify a clearly defined boundary between fundamentally different
economies.
Graduation is not the winning post of a race to leave the LDC category,
but the first milestone in the marathon of development.

The Least Developed Countries Report 201640
Graduation is thus not the winning post of a race to cease being an LDC, but rather the first milestone in the marathon of development. This has critically important implications for LDCs’ approaches to development and to graduation. Just as it is inadvisable to sprint for the first kilometre of a marathon, it is not enough simply to target achievement of the criteria needed for graduation: it is also necessary to establish the foundations needed to maintain development progress beyond graduation. Focusing exclusively on the graduation indicators risks diverting attention and resources from other aspects of development that will be critical long after graduation has been achieved.
This is of particular importance because many of the prerequisites for development are dependent on prior actions and/or subject to very long time lags, and their effectiveness and sustainability can be seriously impaired by attempting to compress such actions into an unrealistically short period.
This applies particularly — but by no means exclusively — to the income-only route to graduation. As the experiences of Angola and Equatorial Guinea demonstrate, it is possible for an LDC to reach the income level necessary for graduation with limited progress either on human assets or on economic vulnerability. Particularly where growth is based on an extractive sector that operates essentially as an enclave, this may provide a very weak basis for post-graduation development, unless resource rents are effectively used to support a deeper and more broadly based development process.
Even where countries qualify for graduation on the basis of two criteria (typically income per capita and the HAI), similar issues arise. Important as the indicators underlying these criteria unquestionably are, there are many critical aspects of development that they capture only indirectly or to a limited extent. Graduation may thus be achieved with relatively limited progress in key areas such as infrastructure, structural transformation, and effective institutions and governance. However, if the necessary foundations are not laid in these areas, they are likely to constrain post-graduation development.
This means that how the income criterion is met (that is, the nature of growth) may be as important as when it is met (the rate of growth). Moderate but broadly based growth, founded upon the development of productive capacities (which entails increasing productivity, structural transformation and infrastructure development), may well be more conducive to development success in the long term than faster growth with weaker foundations, even if the latter leads to faster graduation.
Equally, some caution is needed with respect to the components of the human assets indicator. Focusing on improving under-5 mortality statistics, for example through concentrating on vertical immunization programmes, may well maximize the reduction of child mortality in the short term, and hence progress towards meeting the human assets criterion for graduation. Important as child immunization unquestionably is, however, a greater emphasis on the development of effective health systems may provide a more solid foundation for development beyond graduation, as well as broader and more sustainable progress on child health.
Similarly, progress towards graduation can be maximized by focusing on increasing the secondary school enrolment ratio — that is, providing more classrooms and promoting school attendance. In developmental terms, however, merely having children in classrooms is not enough: the nature and quality of education, though less readily measurable, is also critical. Moreover, given the time lags inherent in child education, long-term development requires attention to prospective needs a decade or more in the future. Those children
Income-only graduation may provide a weak basis for later development, especially when based on extractive
sectors.
How the income criterion is met may be as important as when it is met,
and the nature of growth as relevant as the rate of growth.
Focusing only on the specific indicators used in the graduation
criteria is not enough…
41CHAPTER 1. Graduation: A Milestone, Not the Winning Post
beginning education now will be the pool of adults from which the graduates and post-graduates available in 15–20 years will be drawn.
Thus the nature of the graduation criteria, and of their individual components, need to be borne in mind. Indicators are selected for this purpose primarily on the basis, first, that they have a strong correlation with key aspects of development; and, second, that they are readily and objectively measurable. The latter is of particular importance in LDCs, where reliable data collection is limited by a combination of financial and human resource constraints, institutional limitations, and logistical factors such as low population densities and poor transport and communications infrastructure.
While the indicators are readily measurable, the picture they provide of the development process is inevitably imperfect and incomplete. To target improvements in the specific indicators would be to place excessive emphasis on certain objectives because they are readily measurable, rather than on the basis of their importance — for example, on child mortality rather than other aspects of child and adult health or the establishment of effective health systems. This would be suboptimal from a longer-term development perspective.9
This suggests that a graduation strategy should focus primarily on the needs of the long-term development process rather than on the particular criteria used to assess graduation. This is referred to in this Report as “graduation with momentum” — graduation from LDC status in such a way as to provide a solid basis for sustained development progress subsequently, allowing the pitfalls of the later stages of development to be avoided.
2. graduation with momentum: the key role of produCtive CapaCities
The key to such a process of graduation with momentum is the development of productive capacities — an issue consistently highlighted in The Least Developed Countries Report series (most notably UNCTAD, 2006). This entails a shift of production towards more sophisticated goods and services, through investment in technological upgrading of productive facilities and the establishment of new sectors and activities; and diversification and upgrading of the export structure towards a greater number of higher-value-added products. A key aspect is the production, not only of new, but of “better” products – those generating a greater proportion of value added in the country, with forward and backward linkages and positive externalities. Further elements include improving product quality, product differentiation to earn a market premium, and increasing domestic supply of the services associated with production.
Such development of productive capacities leads to structural transformation of the economy, shifting labour and capital from less productive to more productive sectors and activities (UNCTAD, 2014c), and contributes to creating the jobs needed for the growing LDC population with higher levels of labour productivity and value addition, thus raising living standards (UNCTAD, 2013b). This process of progressively increasing sophistication of production (and export) structures lies at the core of successful development trajectories (Hausmann et al., 2007).
Such a “virtuous” pattern of development, founded upon the development of productive capacities and structural transformation, is also essential to increasing LDCs’ ability to cope with their acute vulnerability to external risks and shocks, particularly economic shocks (stemming from factors such as commodity dependence, chronic current account deficits, dependence on imports of essential inputs, the combination of small economies and openness,
…as the picture of development they provide is inevitably imperfect
and incomplete.
Graduation strategies should focus primarily on long-term development needs, to achieve graduation with
momentum.
Graduation with momentum requires the development of productive capacities, leading to structural
transformation…
...to enable LDCs to cope with their vulnerability to economic and
environmental shocks.

The Least Developed Countries Report 201642
and constraints to raising fiscal revenues) and environmental shocks (such as natural disasters and climate change impacts, in some cases compounded by geographical factors). Since such vulnerabilities tend to hamper investment and thus jeopardize development, increasing resilience further contributes to progress towards graduation and subsequent development.
At some point along this trajectory — in principle marked by graduation — LDCs should cease to need LDC-specific ISMs and be able to face international competition on the basis of the productive capacities they have developed. However, this is but one step along the development continuum, and they often continue to face challenges such as commodity dependence and vulnerability to a greater or lesser extent. The need to continue developing productive capacities and upgrading the productive base is thus a permanent one.
The concept of graduation with momentum also accords closely with the 2030 Agenda. In contrast with the previous Millennium Development Goals, the Sustainable Development Goals incorporate a balanced treatment of the economic, social and environmental dimensions of sustainable development, fully recognizing the interdependence among them. Sustainable Development Goals 1, 8–12 and 17, in particular, imply achieving sustainable development through the development of productive capacities, structural transformation, technological upgrading, diversification, rising productivity and the creation of more and better jobs. Thus, to pursue the Sustainable Development Goals in a similarly balanced manner implies a development strategy consonant with that long advocated by The Least Developed Countries Report series and summarized in figure 1.14. If LDCs were to achieve the Goals and their targets fully, they would in doing so also achieve graduation with momentum.
In practice, of course, such an ideal graduation-with-momentum scenario is by no means always achieved. While the graduation criteria are intended to ensure that graduating countries are fully capable of pursuing their development process in the post-graduation phase in the absence of ISMs, they are inevitably imperfect, and can omit some important aspects of development. As discussed in chapter 2, some countries may thus graduate without having achieved significant structural transformation.
3. the key role of inClusivity and gender
The structural transformation and development of productive capacities essential to graduation with momentum require making full use of productive resources, not least human resources. This requires harnessing the productivity, skills, talents, creativity and entrepreneurial vigour of the entire population effectively for development. Given the potentially transformative role of women’s empowerment, greater gender equality in access to education, employment opportunities and factors of production is an important aspect of this.10 Graduation with momentum can best be achieved and sustained by ensuring inclusiveness in access to and use of productive resources, including through implementation of gender-specific measures where appropriate to overcome the particular disadvantages faced by women.
Women in LDCs face particular constraints to their access to productive resources and markets. Their disadvantages in reproductive health, empowerment and the labour market are particularly striking: the United Nations Development Programme (UNDP) gender inequality index for LDCs in 2015 amounted to 0.57, compared with 0.45 for developing countries as a whole.11 LDCs also perform significantly less well than ODCs on the UNDP’s gender development index (based on the female-to-male ratios of indicators relating to health, education and command over economic resources). In 2014, the
The concept of graduation with momentum accords closely with the
2030 Agenda.
If LDCs meet the SDGs, they will in doing so also achieve graduation
with momentum.
Some countries may graduate without achieving significant
structural transformation.

43CHAPTER 1. Graduation: A Milestone, Not the Winning Post
Figure 1.15. LDC graduation and sustainable development
Drivers
Development
Vulnerability
Traps
LDCs ODCs
Internationaldimensions
Middle-income trap
International markets
ISMs/ODA
Poverty
Commodity dependence
Balance of payments
Landlocked countriesSmall islandsGeographical
Economic
Natural/environmental
Productivity, value addition,income, innovation,
technology, sophistication
Productivecapacities Diversi�cation
Structural transformation
ountries
Grad
uatio
n
Source: UNCTAD secretariat.
overall gender development index of LDCs was 0.87, compared with 0.90 for developing countries as a whole. Of the 36 LDCs for which data are available, 26 are in the lowest of five categories based on this index, and a further six in the second lowest group. Only four LDCs, all in Africa, performed better: Madagascar and the United Republic of Tanzania were classified in the middle group, while Lesotho and Rwanda were in the second highest group (UNDP, 2015: table 4).

The Least Developed Countries Report 201644
The cost of failing to address gender parity effectively is considerable. The Africa Human Development Report 2016 (UNDP, 2016) estimated the cost of gender inequality in labour markets in sub-Saharan Africa in 2014 at $105 billion (6 per cent of GDP). Reducing such costs requires realizing the potential contribution of women to development, by identifying and addressing the particular constraints they face in accessing education and labour and other markets. Women typically face time constraints arising from obligations to care for other family members; discriminatory practices and cultural norms that limit access to labour (and other) markets; gender assignment of roles and tasks (notably in agriculture) and occupations; lack of control over the proceeds of crop sales in agriculture; lack of financial inclusion and access to financial services; limited access to education and training; and discriminatory practices, customs and laws (for example, in relation to land ownership, titling and inheritance).
Though by no means exclusively a rural issue, gender inequality tends to be particularly marked in rural areas, and is therefore of particular relevance to the transformation of rural economies (UNCTAD, 2015a: chap. 4). Gender-based obstacles, compounded by other market imperfections in rural areas, reduce women’s productivity and inhibit their entrepreneurial potential, slowing the transformation of rural economies. Unless such constraints are addressed, the supply response to incentives aimed at increasing production will remain weak, as half the population will be unable to respond effectively. Estimates made by the Food and Agriculture Organization of the United Nations (FAO, 2011) suggest that total agricultural output could be increased by between 2.5 per cent and 4 per cent if women were provided with the same access to productive resources as men.
G. The economic and political calculus of graduation
1. the eConomiC CalCulus
Graduation should in principle be a reflection of development in terms of income per capita, human assets and economic vulnerability; and this development, in itself, has clear economic benefits. However, these benefits may be increased or reduced by the economic effects of graduation (that is, of the loss of LDC status itself); and these potential effects are a key element in LDCs’ approaches to graduation.
A key result of graduation from LDC status is that the graduating country, after the three-year transition period, loses access to LDC-specific ISMs. This is a potentially significant economic cost, as further analysed in chapter 4 of this Report. However, the importance of ISMs to a graduating country depends on the benefits it derived from them while it was an LDC. As discussed in chapter 3, such benefits are often subject to major constraints and limitations.
It is also possible that there may be indirect costs of graduation. The increasing emphasis on LDCs within the development cooperation discourse, for example, could contribute to a reduction in ODA receipts following graduation. Once a country has graduated, the ODA it receives no longer contributes to the donor country’s performance against the target of 0.15–0.20 per cent of GNI for ODA to LDCs. To the extent that this target is regarded as a significant policy objective in donor countries, this could contribute to a reallocation of ODA from a graduating country towards the remaining LDCs.
Loss of access to LDC-specific ISMs after graduation may give rise to
economic costs…
…but there could also be benefits in terms of international market
perceptions.
45CHAPTER 1. Graduation: A Milestone, Not the Winning Post
Against this, however, graduation may have more positive effects. While LDC status may confer benefits in terms of access to ISMs, graduation may have (or be perceived by governments as having) potential benefits in terms of commercial relations, particularly its attractiveness to foreign investors. Market perceptions are important, most notably to FDI, credit ratings, and access to and the cost of international lending. Such benefits could, in principle, outweigh any losses associated with the loss of access to ISMs.
The economic calculus of graduation therefore rests on the balance between these positive and negative aspects; and this balance is likely to evolve over the course of development. At the earliest stages of development, a country’s attractiveness to foreign investors (at least outside extractive industries) is limited by low incomes, limited human capital, weak infrastructure, relatively poor health and nutrition, and often economic, social and/or political instability. The potential benefits of graduation in terms of FDI are therefore likely to become progressively more important as development progresses, and the country becomes potentially more attractive as a destination for FDI.
The evolution of the effects of ISMs over the course of development is less clear-cut. While the need for ISMs is likely to be greatest at earlier stages of development, when the ability to compete in international markets is most limited, the potential to exploit and benefit from some ISMs – for example, market access — is dependent on the level of development of productive capacities. The benefits of such ISMs, and hence the potential impact of their loss through graduation, may thus increase as development progresses.
The economic calculus of graduation may also be expected to change over time, in line with changes in the global economy. As noted above, there has been a major increase in the importance of market transactions over time, while ODA to LDCs has failed even to regain its 1980s level in per-capita terms. At the same time, as discussed in chapter 3, the potential benefits of preferential market access have been reduced as the wider process of trade liberalization globally over recent decades has resulted in preference erosion.
The above discussion suggests that the balance of the economic calculus is likely to have shifted significantly towards graduation since its introduction in the early 1990s, as the importance of commercial transactions such as trade and FDI has increased relative to non-market transactions such as ODA. This appears to be confirmed by the historical experience of graduation cases, as discussed in chapter 2.
2. the politiCal CalCulus
In practice, national policy approaches to graduation (as to other aspects of development) depend not only on economic considerations, but also on a political calculus. While the economic calculus is an important part of this, it is overlain by distinct political considerations, both domestically and at the international level. Domestically, there is a potential kudos effect – the opportunity for a government to enhance its reputation and gain future political advantage by claiming responsibility for having brought a country from LDC status to parity with ODCs. This may have encouraged some LDC governments to develop strategies specifically oriented towards graduation by a specified date.
Internationally, there may also be a status effect, to the extent that graduation is seen as enhancing the country’s image in the global community; and this may be expected to have some positive effect on the country’s influence in regional and international forums. Its bargaining power at the international level may also be enhanced by reduced dependency on support from ISMs,
The graduation costs and benefits evolve over the course
of development…
…and as a result of changes in the global economy.
Economic considerations are only part of the political calculus of
graduation…
…as graduation may enhance the government's reputation
domestically and the country's status internationally.

The Least Developed Countries Report 201646
which are essentially discretionary in nature. Such benefits, in turn, could further reinforce the positive economic effects of graduation. Graduation typically constitutes a culminating moment of national pride, which allows reaffirmation and strengthening of the country’s long-term development vision, as was the case, for instance, in Cabo Verde (Resende Dos Santos, 2016).
Either or both of these effects may tend to tip the balance of the political calculus towards seeking to graduate sooner than would be indicated by economic considerations alone. This tendency is likely to be strengthened by political and electoral cycles, to the extent that governments seek to secure the political benefits of graduation during their terms of office.
This gives rise to a potentially significant tension between the economics and the politics of graduation. While the “how” of graduation is more important than the “when” economically, as discussed above, the reverse may be the case politically. While this might improve progress towards achieving the IPoA target for graduation, it may increase the risk that some LDCs will graduate without the momentum necessary for sustained development progress beyond graduation.
LDCs’ attitudes towards graduation are essentially a product of the combination of political and economic reasoning mentioned above. The political dividends derived from graduation and the declining economic effectiveness of some of the LDC ISMs arguably explain the shift from an apparent reluctance to graduate during the 1990s and early 2000s to the recent adoption of strategies specifically aimed at rapid graduation.
H. Summary
• The 2011 IPoA for the first time adopted an explicit target on graduation — that at least half of the 49 LDCs at that time should satisfy the graduation criteria by 2020.
• Graduation in principle marks the point at which an LDC has escaped sufficiently from the vicious circles which obstructs its development to benefit from international markets on an equal basis with ODCs.
• Graduation thus marks a shift from dependence primarily on ISMs to dependence on markets — that is, from dependency to a greater degree of self-reliance.
• Graduation is the first milestone in a marathon of development, not the winning post in a race to escape LDC status. It marks the end of a political and administrative process, but not the completion of an economic or developmental process.
• It is not enough for LDCs to graduate; they need to achieve graduation with momentum, laying the foundations for their subsequent development, to avoid the pitfalls of the post-graduation phase.
• Graduation with momentum requires the development of productive capacities and structural transformation of the economy. This, not the fulfilment of the statistical criteria for graduation, should be the primary objective of graduation strategies.
• Economic and social divergence between LDCs and ODCs, including in productive capacities, makes the LDC category more relevant than ever. This is further reinforced by the 2030 Agenda.
• While the “how” of graduation is more important than the “when” economically, the reverse may be the case politically, giving rise to a potential tension between the two.
Tensions between the economic and political calculus of graduation
may arise.

47CHAPTER 1. Graduation: A Milestone, Not the Winning Post
Notes
1 At the intergovernmental level, the Comprehensive High-Level Midterm Review of the Implementation of the Istanbul Programme of Action for the Least Developed Countries for the Decade 2011–2020 was held in Antalya, Turkey on 27–29 May 2016.
2 Based on a poverty line of $1.25 per person per day at 2005 purchasing power parity. At the time of writing, data based on the World Bank’s revised poverty line of $1.90 per person per day at 2011 purchasing power parity were not available for all LDCs.
3 In the analysis of convergence and divergence in the global economy, economists have spent considerable time and resources to understand why the very richest and the very poorest countries do not converge in output per worker. (See, for example, Ben-David, 1998; Mayer-Foulkes, 2010).
4 In the growth-related literature, a poverty trap is essentially characterized by the presence of multiple equilibria with a locally stable low-level attractor, so that countries spontaneously tend towards the high-level equilibrium only above a given threshold (typically characterized in terms of income and/or investment). The main mechanisms cited as potentially giving rise to poverty traps include: subsistence consumption and demographic issues (which give rise to saving-based non-linearities); increasing returns due to externalities and learning by doing (typically in the manufacturing sector); complementarities across heterogeneous production factors; financial externalities acting on demand; credit market imperfections; coordination failures; and institutional traps (Azariadis, 1996; Azariadis and Stachurski, 2005; Acemoglu et al., 2005).
5 The Sudan and Timor-Leste are other important fuel exporters. The former, however, is classified as a mixed exporter (reflecting the substantial shares in its exports of ores and metals and of services). In the case of Timor-Leste, foreign exchange receipts in the energy sector mostly take the form of royalty payments, which are therefore classified as services exports. Consequently, the country is included in the service exporters category.
6 As of 30 September 2016, the Extended Credit Facility was being used by Afghanistan, Burkina Faso, the Central African Republic, Chad, Guinea, Guinea-Bissau, Haiti, Liberia, Madagascar, Malawi, Mali, the Niger, Sao Tome and Principe, and Sierra Leone, and the Stand-by Credit Facility by Mozambique and Rwanda.
7 It should be noted that these figures include individuals with more than one subscription, a phenomenon which is particularly pronounced in countries where signal coverage from individual providers is limited or unreliable.
8 In this case, island LDCs fare much better than the other LDC groups, with 9.1 secure servers per million people (doubtless reflecting the very small population of most), six times the figure for the other two groups, but still barely a quarter of the median for ODCs.
9 Possible improvements to the LDC criteria are discussed in chapter 5 of this Report.10 The considerations in this section also apply (in varying degrees in different countries) to
other systematically disadvantaged population groups, notably those living in poverty, ethnic minorities, migrants, refugees and displaced people, indigenous peoples, people with disabilities and chronic illnesses, and people living with HIV/AIDS. All of these dimensions also intersect with gender, potentially leaving women in these groups particularly disadvantaged.
11 The gender inequality index is equal to zero when women and men fare equally, and it is equal to 1 when either gender fares as poorly as is possible in all measured dimensions.

The Least Developed Countries Report 201648
References
Acemoglu D, Johnson S and Robinson JA (2005). Institutions as a fundamental cause of long-run growth. In: Aghion P and Durlauf SN, eds. Handbook of Economic Growth vol.1A. Handbooks in Economics. No.22. Elsevier. Amsterdam:385–472.
Alesina A and Dollar D (2000). Who gives foreign aid to whom and why? Journal of Economic Growth. 5(1):33–63.
Azariadis C (1996). The economics of poverty traps part one: Complete markets. Journal of Economic Growth. 1(4):449–486.
Azariadis C and Stachurski J (2005). Poverty traps. In: Aghion P and Durlauf S, eds. Handbook of Economic Growth. Handbooks in Economics. Elsevier. Amsterdam:295–384.
Barrett CB, Travis AJ and Dasgupta P (2011). On biodiversity conservation and poverty traps. Proceedings of the National Academy of Sciences. 108(34):13907–13912.
Ben-David D (1998). Convergence clubs and subsistence economies. Journal of Development Economics. 55(1):155–171.
Cavallo E, Eichengreen B and Panizza U (2016). Can countries rely on foreign saving for investment and economic development? Working paper No. 07-2016. Economics Section, Graduate Institute of International and Development Studies. Geneva.
CDP and UNDESA (2015). Handbook on the Least Developed Country Category: Inclusion, Graduation and Special Support Measures. United Nations publication. Sales No. E.07.II.A.9. New York.
Dollar D and Levin V (2006). The increasing selectivity of foreign aid, 1984–2003. World Development. 34(12):2034–2046.
FAO (2011). The State of Food and Agriculture 2010–11: Women in Agriculture: Closing the Gender Gap for Development. Rome.
Frankel JA (2010). The natural resource curse: A survey. Working paper No.15836. National Bureau of Economic Research. Cambridge (MA).
Gereffi G, Humphrey J and Sturgeon T (2005). The governance of global value chains. Review of International Political Economy. 12(1):78–104.
Guillaumont P (2009). Caught in a Trap: Identifying the Least Developed Countries. Economica. Paris.
Gylfason T (2001). Natural resources and economic growth: What is the connection? CESifo Working Paper Series. No. 530. CESifo. Munich.
Hausmann R, Hwang J and Rodrik D (2007). What you export matters. Journal of Economic Growth. 12(1):1–25.
Mayer-Foulkes D (2010). Divergences and convergences in human development. Human Development Research Paper 2010/20. United Nations Development Programme. New York.
Mevel S, Vakataki Ofa S and Karingi S (2013). Illicit Financial Flows from Africa through Trade Mispricing and Assessing Their Incidence on African Economies. Presented at the Sixteenth Annual Conference on Global Economic Analysis. Shanghai. 12–14 June. Available at https://www.gtap.agecon.purdue.edu/resources/res_display.asp?RecordID=4192 (accessed 22 October 2016).
Morris M and Fessehaie J (2014). The industrialisation challenge for Africa: Towards a commodities based industrialisation path. Journal of African Trade 1(1): 25–36.
Nissanke M and Mavrotas G, eds. (2010). Commodities, Governance and Economic Development Under Globalization. Palgrave Macmillan. Basingstoke, Hampshire.
Nurkse R (1953). Problems of Capital Formation in Underdeveloped Countries. Oxford University Press. New York.
Pietrobelli C and Rabellotti R (2011). Global value chains meet innovation systems: Are there learning opportunities for developing countries? World Development. 39(7):1261–1269.
Resende Dos Santos J (2016). Cabo Verde: Impacts and lessons of graduation from the LDC list. Background paper prepared for The Least Developed Countries Report 2016. UNCTAD. Geneva.
Sachs J and Warner AM (1995). Natural resource abundance and economic growth. National Bureau of Economic Research Working paper No. 5398. Cambridge (MA).
Sindzingre A (2012). The impact of the 2008–2009 crisis on commodity-dependent low-income African countries: Confirming the relevance of the concept of poverty trap? Journal of International Development. 24(8):989–1007.
Staritz C and Morris M (2013). Local embeddedness, upgrading and skill development global value chains and foreign direct investment in Lesotho’s apparel industry. Manchester: Capturing the Gains working paper 2013/20. Capturing the Gains. University of

49CHAPTER 1. Graduation: A Milestone, Not the Winning Post
Manchester. Available at http://www.capturingthegains.org/pdf/ctg-wp-2013-20.pdf (accessed 22 October 2016).
Thirlwall AP (1979). The balance of payments constraint as an explanation of international growth rate differences. Banca Nazionale del Lavoro Quarterly Review. 32 (128):45–53.
UNCTAD (2002). The Least Developed Countries Report 2002: Escaping the Poverty Trap. United Nations publication. Sales No. E.02.II.D.13. New York and Geneva.
UNCTAD (2006). The Least Developed Countries Report 2006: Developing Productive Capacities. United Nations publication. Sales No. E.06.II.D.9. New York and Geneva.
UNCTAD (2007). The Least Developed Countries Report 2007: Knowledge, Technological Learning and Innovation for Development. United Nations publication. Sales No. E.07.II.D.8. New York and Geneva.
UNCTAD (2010). The Least Developed Countries Report 2010: Towards a New International Development Architecture for LDCs. United Nations publication. Sales No. E.10.II.D.5. New York and Geneva.
UNCTAD (2012). The Least Developed Countries Report 2012: Harnessing Remittances and Diaspora Knowledge to Build Productive Capacities. United Nations publication. Sales No. E.12.II.D.18. New York and Geneva.
UNCTAD (2013a). Commodities and Development Report: Perennial Problems, New Challenges and Evolving Perspectives. United Nations publication. New York and Geneva.
UNCTAD (2013b). The Least Developed Countries Report 2013: Growth with Employment for Inclusive and Sustainable Development. United Nations publication. Sales No. E.13.II.D.1. New York and Geneva.
UNCTAD (2013c). World Investment Report 2013: Global Value Chains: Investment and Trade for Development. United Nations publication. Sales No. E.13.II.D.5. New York and Geneva.
UNCTAD (2014a). Trade and Development Report, 2014: Global Governance and Policy Space for Development. United Nations publication. Sales No. E.14.II.D.4. New York and Geneva.
UNCTAD (2014b). Transfer of Technology and Knowledge Sharing for Development: Science, Technology and Innovation Issues for Developing Countries. UNCTAD Current Studies on Science, Technology and Innovation, No. 8. United Nations publication. New York and Geneva.
UNCTAD (2014c). The Least Developed Countries Report 2014: Growth with Structural Transformation – A Post-2015 Development Agenda. United Nations publication. Sales No. E.14.II.D.7. New York and Geneva.
UNCTAD (2015a). The Least Developed Countries Report 2015: Transforming Rural Economies. United Nations publication. Sales No. E.15.II.D.7. New York and Geneva.
UNCTAD (2015b). Trade and Development Report 2015: Making the International Financial Architecture Work for Development. United Nations publication. Sales No: E .15.II.D.4. New York and Geneva.
UNCTAD (2016a). Economic Development in Africa Report 2016: Debt Dynamics and Development Finance in Africa. United Nations publication. Sales No. E.16.II.D.3. New York and Geneva.
UNCTAD (2016b). Trade misinvoicing in primary commodities in developing countries: The cases of Chile, Côte d’Ivoire, Nigeria, South Africa and Zambia. Special Unit on Commodities. UNCTAD/SUC/2016/ 2. New York and Geneva. Available at http://unctad.org/en/PublicationsLibrary/suc2016d2.pdf (accessed 22 October 2016).
UNCTAD and Arbeiterkammer Wien (2011). Price Formation in Financialized Markets: The Role of Information. United Nations publication. UNCTAD/GDS/2011/1. New York and Geneva.
UNDP (2011). Illicit financial flows from the least developed countries: 1990–2008. Discussion paper. New York. Available at https://www.researchgate.net/publication/272534851_Illicit_Financial_Flows_from_the_Least_Developed_Countries_1990-2008 (accessed 22 October 2016).
UNDP (2015). Human Development Report, 2015: Work for Human Development. United Nations Development Programme (UNDP). Sales No. E.15.III.B.1. New York.
UNDP (2016). Africa Human Development Report 2016: Accelerating Gender Equality and Women’s Empowerment in Africa. United Nations Development Programme (UNDP). New York.
UNECA and AUC (2013). Economic Report on Africa 2013: Making the Most of Africa’s Commodities: Industrializing for Growth, Jobs and Economic Transformation. United Nations Economic Commission for Africa. Addis Ababa.

The Least Developed Countries Report 201650
UNECA (2015a). Economic Report on Africa 2015: Industrializing through Trade. United Nations publication. Sales No. E.15.II.K.2. United Nations Economic Commission for Africa. Addis Ababa.
UNECA (2015b). Illicit financial flows. Report of the High-level Panel on Illicit Financial Flows from Africa. Addis Ababa: United Nations Economic Commission for Africa. Available at http://www.uneca.org/sites/default/files/PublicationFiles/iff_main_report_26feb_en.pdf (accessed 9 October 2016).
United Nations (1964). Proceedings of the United Nations Conference on Trade and Development, Geneva, 23 March–16 June 1964. E/CONF.46/141. New York.
United Nations (1968). Proceedings of the United Nations Conference on Trade and Development, second session, New Dehli, 1 February–29 March 1968. TD/97. New York.
United Nations (2015). The Millennium Development Goals Report 2015. United Nations publication. New York.