chapter i – finances of the state government · audit report (state finances) for the year ended...
TRANSCRIPT

1
CHAPTER I
FINANCES OF THE STATE GOVERNMENT
Profile of Kerala
The State is located at the southern end of the country, sharing borders with Tamil
Nadu and Karnataka. In terms of geographical area, Kerala is ranked 21st in the
country with an area of 38,863 sq.km. While the State is having a population of
3.34 crore (12th in the country), it remains the third most densely populated State
with a density of 859 persons per sq.km. As indicated in Appendix 1.1, the
State’s population increased from 3.18 crore in 2001 to 3.34 crore in 2011
recording a decadal growth of five per cent. The State’s percentage of population
below the poverty line is less than the all-India average. The State’s Gross State
Domestic Product (GSDP) in 2012-13 at current prices was `3,63,305 crore. The
State’s literacy rate increased from 90.92 per cent (as per 2001 census) to 93.91
per cent (as per 2011 census). The per capita income of the State at current prices
(Economic Review 2012) stands at `90,816 against the country average of
`68,491. General data relating to the State is given in Appendix 1.1.
Gross State Domestic Product (GSDP)
GSDP is the market value of all officially recognized final goods and services
produced within the State in a given period of time. The growth of GSDP of the
State is an important indicator of the State’s economy as it indicates the standard
of living of the State’s population. The trends in the annual growth of India’s
GDP at current prices are indicated below:
Table 1.1: Trends in annual growth of GDP and GSDP (at current prices)
Particulars 2008-09 2009-10 2010-11 2011-12 2012-13
India’s GDP (` in crore) 5303567 6108903 7266967 8353495 9461013
Growth rate of GDP
(percentage)
15.75 15.18 18.96 14.95 13.26
State’s GSDP (` in crore) 202783 231999 269474 315206 363305
Growth rate of GSDP
(percentage) 15.78 14.41 16.15 16.97 15.26
Source : figures furnished by Economics and Statistics Department
During the last two years, the GSDP growth rate of the State was better than the
growth rate of GDP of the country. This indicates the better economic
performance of the State during the above period.
1.1 Introduction
This chapter is based on the audit of Finance Accounts and makes an assessment
of the Kerala Government’s fiscal position as on 31 March 2013. It provides a
broad perspective of the finances of the Government of Kerala during 2012-13

Audit Report (State Finances) for the year ended 31 March 2013
2
and analyses critical changes in the major fiscal aggregates relative to the
previous year, keeping in view of the overall trends during the last five years. The
structure and form of Government Accounts have been explained in Appendix
1.2 Part A and the layout of the Finance Accounts is shown in Appendix 1.2
Part B. The methodology adopted for the assessment of the fiscal position of the
State and norms/ceilings prescribed by the Kerala Fiscal Responsibility Act, 2003
are given in Appendix 1.3. As prescribed in the Act, the Government laid its
Medium Term Fiscal Policy and Strategy Statement with Medium Term Fiscal
Plan for 2012-13 to 2014-15 in the State legislature in March 2012.
1.1.1 Summary of Current Year’s Fiscal Transactions
The Table 1.2 presents the summary of the State Government’s fiscal transactions
during the current year (2012-13) vis-à-vis the previous year (2011-12), while
Appendix 1.4 provides details of receipts and disbursements as well as the overall
fiscal position during the current year.
Table 1.2: Summary of Fiscal operations in 2012-13
(` in crore)
Receipts 2011-12 2012-13 Disbursements 2011-12 2012-13
Section –A:Revenue Non-plan Plan Total
Revenue Receipts 38010.36 44137.30 Revenue
Expenditure 46044.62 46639.41 6849.33 53488.74
Tax Revenue 25718.60 30076.61 General Services 20300.02 22718.03 68.58 22786.61
Non-tax Revenue 2592.18 4198.51 Social Services 16223.86 14565.47 4312.02 18877.49
Share of Union Taxes/
Duties 5990.36 6840.65 Economic Services 6131.66 5339.69 2468.73 7808.42
Grants from
Government of India 3709.22 3021.53
Grants-in-aid and
contribution 3389.08 4016.22 4016.22
Section-B : Capital and Others
Miscellaneous
Capital Receipts 16.05 14.81 Capital Outlay 3852.92 1137.63 3465.66 4603.29
Recoveries of Loans
and Advances 54.90 73.61
Loans and Adva-
nces disbursed 998.54 533.06 603.09 1136.15
Public Debt Receipts 9798.96 13261.19 Repayment of
Public Debt 2893.06 2804.08
Contingency Fund 33.92 20.80 Contingency Fund 20.80 ..
Public Account
Receipts 95829.74 105879.64
Public Account
disbursements 91200.26 100455.82
Opening Cash
Balance 5059.73 3793.46
Closing Cash
Balance 3793.46 4692.73
Total 148803.66 167180.81 Total 148803.66 167180.81
(Source : Finance Accounts for the respective years)

Chapter I – Finances of the State Government
3
The following are the major changes in fiscal transactions during 2012-13 over
the previous year
The Revenue receipts grew by 16 per cent relative to previous year. The
increase in revenue receipts (`6,126.94 crore) was contributed by increase
in tax revenue by `4,358.01 crore, non-tax revenue by `1,606.33 crore and
Share of Union Taxes/Duties by `850.29 crore. This increase was partly
offset by decrease in Grants from Government of India by `687.69 crore.
Though the total tax revenue collected during 2012-13 (`30,076.61 crore)
was higher than the normative assessment (`28,355.99 crore) made by the
Thirteenth Finance Commission (ThFC), it was less than the projections
made (`32,122 crore) in the Medium Term Fiscal Plan (MTFP) for the
year. However, non-tax revenue collection for the year (`4,198.51 crore)
was higher than the projections in ThFC report (`2,187.16 crore) and
MTFP (`3,495 crore).
The Revenue expenditure increased by `7,444.12 crore (16 per cent) due
to increase in expenditure under General Services (`2,486.59 crore),
Social Services (`2,653.63 crore), Economic Services (`1,676.76 crore)
and Grants-in-aid and Contributions (`627.14 crore). Crucially, the actual
Non-plan revenue expenditure for 2012-13 (`46,639.41 crore) exceeded
the normative assessment made by the ThFC (`34,752.86 crore) by
`11,886.55 crore (34 per cent).
Capital expenditure increased by `750.37 crore (19 per cent) mainly due
to increase in expenditure under major heads ‘Other Transport Services’
(`354.66 crore) and ‘Roads and Bridges’ (`338.31 crore).
Public debt receipts increased by `3,462.23 crore due to increase in
internal debt receipts by `3317.08 crore and increase in borrowings from
GOI by `145.15 crore.
Public Account receipts and disbursements increased by `10,049.90 crore
and `9,255.56 crore respectively over the previous year.
The cash balance of the State increased by `899.27 crore from `3,793.46
crore as on 31 March 2012 to `4,692.73 crore as on 31 March 2013.
1.1.2 Review of the fiscal situation
The State Government enacted the Kerala Fiscal Responsibility Act, 2003 which
came into force on 5 December 2003 to ensure prudence in fiscal management
and fiscal stability by progressive elimination of revenue deficit and sustainable
debt management consistent with fiscal stability, greater transparency in fiscal
operations of the Government and conduct of fiscal policy in a medium term
framework and for matters connected therewith or thereto. As per the stipulation
in the Kerala Fiscal Responsibility Act, 2003, a Medium Term Fiscal Policy
(MTFP) and Strategy Statement is to be prepared, covering fiscal targets fixed for
ensuing three financial years, and submitted along with the budget documents to

Audit Report (State Finances) for the year ended 31 March 2013
4
the State Legislature. The State has resumed its fiscal consolidation efforts with
the amendment to Kerala Fiscal Responsibility Act 2003, incorporating target put
forth by the ThFC in the revised roadmap for fiscal consolidation.
Accordingly, major fiscal variable targets set by the State Government in budget
estimates for 2012-13 and corresponding targets given in the ThFC report are
detailed below;
Table 1.3: Comparison of fiscal variable targets
Fiscal variables
2012-13
Targets fixed
by ThFC
Targets fixed
in BE
Actual
Ratio
Revenue deficit/ GSDP 0.9 0.89 2.6
Fiscal deficit/ GSDP 3.5 2.74 4.1
Outstanding Debt to GSDP 31.7 25.86 29.9
Source : ThFC report and budget documents for 2012-13
According to the Act, the Government is committed to reduce the revenue deficit
to ‘nil’ within a period of four years commencing on the 1 April 2011 and ending
with the 31 March 2015 by reducing the revenue deficit in the years 2011-12,
2012-13, 2013-14 and 2014-15 in the order of 1.4 per cent, 0.9 per cent, 0.5 per
cent and zero per cent, respectively, of the GSDP. The Government is also
committed to reduce the fiscal deficit to 3 per cent of the estimated GSDP within
a period of three years commencing on the 1 April, 2011 and ending with the 31
March, 2014 by maintaining the fiscal deficit at a level not exceeding 3.5 per cent
of the gross state domestic product in the years 2011-12 and 2012-13 and
reducing it to 3 per cent in 2013-14.
It was observed that the State could not achieve the revenue/fiscal deficit targets
set in the revised fiscal consolidation path stipulated in the ThFC report as well as
that estimated in the budget documents. Disproportionate growth of revenue
expenditure together with non-realisation of estimated revenue collection led to
increase in revenue/fiscal deficit and consequent non-achievement of fiscal
targets. However, State’s Debt-GSDP ratio was well within the target fixed by
the ThFC.
1.1.3 Budget estimates and actual
As per Article 202 of the Constitution of India, the Governor of the State shall,
cause to be laid before the House of the Legislature of the State a statement of the
estimated receipts and expenditure of the State for a financial year. This estimated
statement of receipt and expenditure for a financial year named in the Constitution
as the ‘Annual Financial Statement’ is commonly known as ‘Budget’. The budget
is Government’s most important economic policy tool, that translates
Government’s policies, political commitments, and goals into decisions on how
much revenue to raise, how it plans to raise it and how to use these funds to meet
the State’s competing needs. A budget system that functions well is crucial to
developing sustainable fiscal policies and economic growth.

Chapter I – Finances of the State Government
5
Comparison of State’s budget estimates vis-à-vis actuals for the year 2012-13 is
detailed in Table 1.4 and Chart 1.1 given below:
Table 1.4: Budget estimates and actual for 2012-13 (` in crore)
Particulars Budget
Estimate
Revised
Estimate Actual
Revenue Receipts 48141 48269 44137
Revenue Expenditure 51605 51676 53489
Revenue Deficit 3464 3407 9352
Capital Expenditure 6555 6903 4603
Loans and Advances (Net)1 (-)728 (-)1057 (-)1062
Public Debt (Net)2 10816 10754 10457
Public Account (Net)3 176 482 5424
Chart 1.1: Budget estimation vis-à-vis actuals
During the year revenue receipts were lower than the estimated amount as receipts
in respect of tax revenue and grants-in-aid were much lower than the amount
estimated by the State Government. However, non-tax revenue collection was
higher than the estimated amount. Similarly, Revenue expenditure and loans and
1 Minus figure was due to loan disbursement more than loan repayment Particulars Receipt Expenditure Net
2. Public Debt 13261 2804 10457
a. Internal Debt 12709 2478 10231
a. Loans & Advances from GOI 552 326 226
3. Public Account 105880 100456 5424
a. Small Savings 23821 20135 3686
b. Reserves 382 528 (-) 146
c. Deposit and Advances 7840 6699 1141
d. Suspense 64132 63420 712
e. Remittances 9705 9674 31
48141
51605
6555
728
10816
44137
53489
4603
1062
10457
0 10000 20000 30000 40000 50000 60000
Revenue Receipts
Revenue expenditure
Capital expenditure
Loans and Advances-net
Public Debt-Net` in crore
Actual Receipt/Expenditure Budget Estimates

Audit Report (State Finances) for the year ended 31 March 2013
6
advances (net) were higher than the estimated amount and capital expenditure was
less than the estimated amount. Wide variation in estimates and actuals, in respect
of tax-revenue and revenue expenditure led to disproportionate growth of revenue
deficit during the year.
1.2 Resources of the State
1.2.1 Resources of the State as per the Annual Finance Accounts
Revenue and capital are the two streams of receipts that constitute the resources
of the State Government. Revenue receipts consist of Tax revenues, non-tax
revenues, State’s share of union taxes and duties and grants-in-aid from the
Government of India (GOI). Capital receipts comprise miscellaneous capital
receipts such as proceeds from disinvestments, recoveries of loans and advances,
debt receipts from internal sources (market loans, borrowings from other financial
institutions/commercial banks) and loans and advances from GOI. Besides the
funds available in the Public Accounts after disbursement is also utilized by the
Government to finance its deficit. Chart 1.2 depicts the composition of resources
of the State during the current year.
Chart 1.2 : Composition of receipts (` in crore)
Total Receipts`1,63,388
Revenue Receipts`44,137
Tax Revenue`30,077
Taxes on Sales, Trade
etc.`22,511
Stamps and Registration
`2,938
State Excise `2,314
Taxes on vehicles`1,925
Others `389
Non-tax revenue`4,198
State Lotteries`2,674
Forestryand Wildlife
`237
Dividends and Profits
`48
Interest Receipts
`172
Others`1,067
Share of Union
taxes and duties`6,841
Grants-in-aid from
GOI `3,021
Capital Receipts`13,350
Debt receipts`13,261
Internal Debt
`12,709
Loans and Advances from GOI
`552
Non-debt receipts
`89
Retirement of shares
`15
Recoveries of loans and
advances`74
Contingency Fund `21
Public Account Receipts`1,05,880
Small Savings, PF, etc`23,821
Reserve Fund`382
Deposits and Advances`7,840
Suspense and Miscellaenous
`64,132
Remittances`9,705

Chapter I – Finances of the State Government
7
Total receipts4 of the State Government increased from `87,843 crore in 2008-09
to `1,63,388 crore in 2012-13, recorded an increase of 86 per cent during the last
five years. Public Account receipt has the major share in total receipts of the State
Government and it was ranged between 64 to 67 per cent during the last five
years. Trend in total receipt during the last five years is given in Chart 1.3 and
composition of total receipt during 2012-13 is given in Chart 1.4.
Chart 1.3: Trend in total receipts during the last five years(` in crore)
4 Consists of Revenue receipts, Capital receipts including Debt receipts and Public Account receipts.
24512 2610930991
3801044137
6966 6703 72589870 13350
5628561314
73754
95830105880
80 6 26 34 21
8784394132
112029
143744 163388
0
20000
40000
60000
80000
100000
120000
140000
160000
180000
2008-09 2009-10 2010-11 2011-12 2012-13
` i
n c
ro
re
Revenue Receipts Capital Receipt including Debt
Public Account receipts Contingency Fund Receipts
Total receipts
Revenue
Receipts
`44137
Capital Receipts
`13350
Public Account
Receipts
`105880
Contingency
Fund
`21
Chart 1.4: Composition of total receipts during 2012-13
Revenue Receipts Capital Receipt including Debt
Public Account Receipts Contingency Fund
(` in crore)

Audit Report (State Finances) for the year ended 31 March 2013
8
1.2.2 Funds transferred to State Implementing Agencies outside the State
Budget
The Central Government has been transferring a sizeable quantum of funds
directly to the State implementing agencies5 for implementation of various
schemes/programmes in social and economic sectors, which are recognized as
critical. In the present system these funds are not routed through the State
Budget/State Treasury System and hence do not find mention in the Finance
Accounts of the State. As such, the Annual Finance Accounts of the State does
not provide a complete picture of the resources under the control of the State
Government. To present the holistic picture on availability of aggregate resources,
funds directly transferred to State implementing agencies, implementing 12 major
centrally sponsored schemes, are presented in Table 1.5.
Table 1.5: Funds transferred directly to State implementing agencies (` in crore)
Sl.
No.
Programme/scheme and
implementing agency
Un-utilised
balance as
on 1 April
2012
GOI
release
during
2012-13
State
release
Other
receipts
Amount
utilised
Balance
as on
31
March
2013
1. Mahatma Gandhi National Rural
Employment Guarantee scheme-
District Rural Development
Agencies (Poverty Alleviation Unit)
85.81 1311.18 21.02 14.65 1416.35 16.31
2. Pradhan Mantri Gram Sadak
Yojana-Kerala State Rural Roads
Development Agency 187.84 1.50 0.00 0.00 57.00 132.34
3. Rural Housing-Indira Awaas
Yojana-District Rural Development
Agencies (Poverty Alleviation Unit) 62.52 153.44 53.02 37.41 218.31 88.08
4. Rashtriya Madhyamik Shiksha
Abhiyan-Secondary Education
Development Society Kerala 33.10 15.27 30.00 0.10 21.09 57.38
5. Ajeevika-District Rural
Development Agencies (Poverty
Alleviation Unit) 0.00 35.86 6.56 0.00 20.66 21.76
6. National Horticulture Mission-
Kerala State Horticulture Mission 4.83 35.00 11.00 0.00 41.02 9.81
7. National Rural Drinking Water
Programme-Kerala Water Authority 0.25 249.04 31.73 3.67 246.77 37.92
8. Sarva Shiksha Abhiyan-Primary
Education Development Society of
Kerala 189.19 134.49 128.03 31.96 429.70 53.97
5 State implementing agencies include any organization/institution including Non-Governmental
organization which is authorized by the State Government to receive funds from the Government
of India for implementing specific programmes in the State.

Chapter I – Finances of the State Government
9
Sl.
No.
Programme/scheme and
implementing agency
Un-utilised
balance as
on 1 April
2012
GOI
release
during
2012-13
State
release
Other
receipts
Amount
utilised
Balance
as on
31
March
2013
9. Swarna Jayanthi Shahari Razgar
Yojana-State Poverty Eradication
Mission (Kudumbashree) 25.19 32.28 11.85 7.83 23.39 53.76
10. National Rural Health Mission
State Health and Family Welfare
Society
117.79 196.87 234.18 0.00 537.11 11.73
11. Rashtriya Swasthya Bima Yojana-
Comprehensive Health Insurance
Agency of Kerala 0.00 118.56 95.00 0.00 213.56 0.00
12. Integrated Watershed Management
Programme-District Rural
Development Agencies (Poverty
Alleviation Unit)
2.01 5.77 0.58 0.00 5.92 2.44
Total 708.53 2289.26 622.97 95.62 3230.88 485.50
Source : Information furnished by respective implementing agencies
As per the information furnished by these implementing agencies, an amount of
`485.50 crore remaining un-utilised (March 2013) with them. Due to inadequate
monitoring on the part of State Government on these direct transfers, there was
risk of improper utilisation of funds by implementing agencies. Unless uniform
accounting practices are followed by all these agencies, with proper
documentation and timely reporting of expenditure, it would be difficult to
monitor the end use of these direct transfers.
1.3 Revenue Receipts
Statement-11 of the Finance Accounts details the revenue receipts of the
Government. The revenue receipts consist of its own tax and non-tax revenues,
share of central tax transfers and grants-in-aid from GOI. The trends and
composition of revenue receipts over the period 2008-13 are presented in
Appendix 1.5 and also depicted in Charts 1.5 and 1.6 respectively.

Audit Report (State Finances) for the year ended 31 March 2013
10
The revenue receipts of the State increased by 80 per cent during the last five
years (2008-2013). Though, during the same period State’s own revenue recorded
an increase of 95 per cent, increase in Central tax transfers (60 per cent) and
2451226109
30991
3801044137
1754919477
23653
28311
34275
4276 43995142 5990
6841
26872233 2196
3709 30210
5000
10000
15000
20000
25000
30000
35000
40000
45000
50000
2008-09 2009-10 2010-11 2011-12 2012-13
`in
cro
re
Chart 1.5: Trends in revenue receipts
Revenue receipts State's own revenue Central tax transfers Grants-in-aid
0%
10%
20%
30%
40%
50%
60%
70%
80%
90%
100%
2008-09 2009-10 2010-11 2011-12 2012-13
65 6770
67 68
6 7 6 7 1018 17 17 16 15
11 9 7 10 7
Per
cen
tag
e sh
are
Chart 1.6: Composition of revenue receipts during 2008-2013
Grants-in-aid Central tax transfers Non-tax revenue Own taxes
Chapter I – Finances of the State Government
11
Grants-in-aid and contributions from GOI (12 per cent) was not to that extent. As
shown in Chart 1.6, during 2012-13, the share of Central tax transfers and
Grants-in-aid and contributions from GOI in revenue receipts decreased by one
and three percentage points respectively, as compared to previous year (2011-12).
During 2003-04 to 2011-12, the compounded annual growth rate of revenue
receipts (15.20) was less than the growth rate of other General Category States
(17.48). This growth rate for the period 2003-04 to 2012-13 was 15.77 per cent
(Appendix 1.1).
Revenue collected (`44,137 crore) during the year was lower than the projections
made (`48,141 crore) in the Medium Term Fiscal Plan by `4,004 crore (eight per
cent).
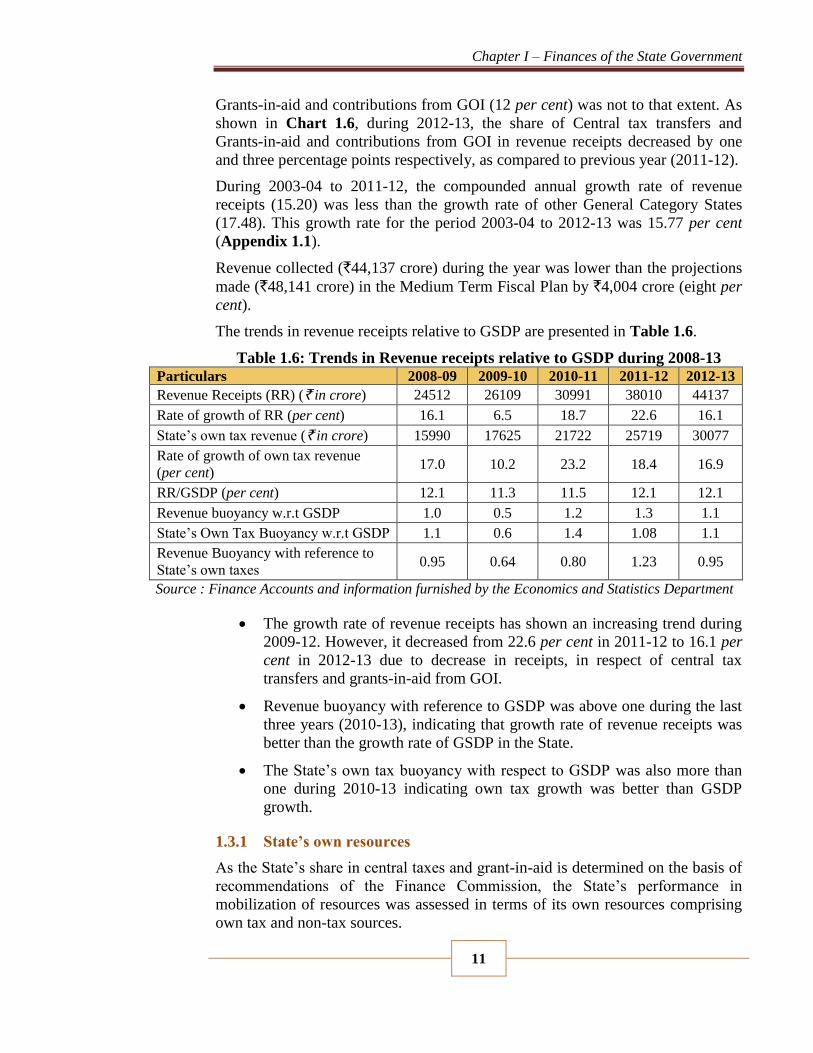
The trends in revenue receipts relative to GSDP are presented in Table 1.6.
Table 1.6: Trends in Revenue receipts relative to GSDP during 2008-13
Particulars 2008-09 2009-10 2010-11 2011-12 2012-13
Revenue Receipts (RR) (` in crore) 24512 26109 30991 38010 44137
Rate of growth of RR (per cent) 16.1 6.5 18.7 22.6 16.1
State’s own tax revenue (` in crore) 15990 17625 21722 25719 30077
Rate of growth of own tax revenue
(per cent) 17.0 10.2 23.2 18.4 16.9
RR/GSDP (per cent) 12.1 11.3 11.5 12.1 12.1
Revenue buoyancy w.r.t GSDP 1.0 0.5 1.2 1.3 1.1
State’s Own Tax Buoyancy w.r.t GSDP 1.1 0.6 1.4 1.08 1.1
Revenue Buoyancy with reference to
State’s own taxes 0.95 0.64 0.80 1.23 0.95
Source : Finance Accounts and information furnished by the Economics and Statistics Department
The growth rate of revenue receipts has shown an increasing trend during
2009-12. However, it decreased from 22.6 per cent in 2011-12 to 16.1 per
cent in 2012-13 due to decrease in receipts, in respect of central tax
transfers and grants-in-aid from GOI.
Revenue buoyancy with reference to GSDP was above one during the last
three years (2010-13), indicating that growth rate of revenue receipts was
better than the growth rate of GSDP in the State.
The State’s own tax buoyancy with respect to GSDP was also more than
one during 2010-13 indicating own tax growth was better than GSDP
growth.
1.3.1 State’s own resources
As the State’s share in central taxes and grant-in-aid is determined on the basis of
recommendations of the Finance Commission, the State’s performance in
mobilization of resources was assessed in terms of its own resources comprising
own tax and non-tax sources.

Audit Report (State Finances) for the year ended 31 March 2013
12
The States actual tax and non tax receipts for the year 2012-13 vis-à-vis
assessment made by Thirteenth Finance Commission and Medium Term Fiscal
Plan are given in the Table 1.7 below:
Table 1.7: Projections and realization of revenue (` in crore)
Particulars ThFC
projection
Budget estimates
and MTFP
projection
Actual
Tax Revenue 28356 32122 30077
Non-tax Revenue 2187 3495 4198
Source : ThFC report, Budget documents and Finance Accounts
The total of tax revenues collected during 2012-13 (`30,077 crore) was six per
cent more than the normative assessment made by the ThFC (`28,356 crore) for
the year but it was six per cent less than the projections made by the Government
in Medium Term Fiscal Plan and Annual Budget estimates (`32,122 crore).
However, non-tax revenue collection was higher than normative assessment made
by ThFC and projections in Annual budget and MTFP, due to increased receipts
under State Lotteries.
1.3.1.1 Tax Revenue
The State’s own tax revenue increased by 16.9 per cent from `25,719 crore to
`30,077 crore during the current year. The gross collections in respect of major
taxes and duties, during the last five years are given in Table 1.8:
Table 1.8: Components of State’s own Tax Revenue during 2008-13 (` in crore)
Revenue Head 2008-09 2009-10 2010-11 2011-12 2012-13
Taxes on Sales, Trade etc. 11377 12771 15833 18939 22511
Stamps and Registration fees 2003 1896 2552 2987 2938
State Excise 1398 1515 1700 1883 2314
Taxes on vehicles 937 1131 1331 1587 1925
Land Revenue 48 54 56 61 122
Taxes on Agricultural income 12 28 47 43 19
Other Taxes 215 230 203 219 248
Total 15990 17625 21722 25719 30077
Source : Finance Accounts of respective years
‘Taxes on Sales, Trade etc.’, was the major source of the State’s own tax revenue
during the last five years and its share increased from 71 per cent (2008-09) to
75 per cent (2012-13). ‘Stamps and Registration fees’ (10 per cent), ‘State
Excise’ (eight per cent) and ‘Taxes on Vehicles’ (six per cent) were the remaining
major source of State’s own tax revenue.

Chapter I – Finances of the State Government
13
‘Taxes on Sales, Trade etc.’ increased by 19 per cent (`3,572 crore) during 2012-
13 over the previous year. This increase in revenue was mainly under ‘Value
Added Tax’ (`2,368 crore) and ‘Receipts under State Sales Tax Act’ (`1,167
crore).
Receipts under ‘State Excise’ increased by 23 per cent (`431 crore) during 2012-
13 over the previous year. The increase was mainly under ‘Foreign Liquors and
Spirits’ (`584 crore). This was partly offset by decrease in receipts under
‘Country Fermented Liquors’ (`109 crore) and ‘Malt Liquor’ (`47 crore).
Receipts under ‘Taxes on Vehicles’ increased by 21 per cent (`337 crore) due to
increased receipts under ‘Receipts under the State Motor Vehicles Taxation Act’
(`324 crore).
1.3.1.2 Non-tax revenue
Collection under non-tax revenue increased by 62 per cent from `2,592 crore in
2011-12 to `4,198 crore in 2012-13. Major components of non-tax revenue,
during the last five years are detailed in Table 1.9.
Table 1.9: Composition of non-tax revenue during 2008-13 (` in crore)
Revenue Head 2008-09 2009-10 2010-11 2011-12 2012-13
Interest receipts 51 153 172 136 172
Dividends and profits 35 27 75 67 48
State Lotteries 420 624 571 1283 2674
Forestry and Wildlife 191 273 274 221 237
Other non-tax receipts 862 775 839 885 1067
Total 1559 1852 1931 2592 4198
Source : Finance Accounts of respective years
State’s non-tax revenue sources mainly comprised receipts from ‘State Lotteries’
(64 per cent), ‘Forestry and Wildlife’ (six per cent), ‘Dividends and profits’ (one
per cent) and ‘Interest Receipts’ (four per cent). During 2012-13 substantial
increase in revenue was recorded under ‘State Lotteries’ (`1391 crore). Increase
was also recorded under ‘Interest Receipts’ (`36 crore) and ‘Forestry and
Wildlife’ (`16 crore). Though the receipts under ‘State Lotteries’ (`2,674 crore)
recorded an increase of 108 per cent over the previous year, with an equally high
expenditure (`2,083 crore) during the current year the net yield from lotteries was
only `591 crore, which was higher by `210 crore than the net yield of `381 crore
of the previous year.
1.3.2 Grants-in-aid from Government of India
Grants-in-aid from the Government of India decreased by `688 crore (18.54 per
cent) from `3,709 crore in 2011-12 to `3,021 crore in 2012-13. The decrease was
mainly under ‘Non-plan grants’ (`776 crore) and ‘Grants for Centrally sponsored
Audit Report (State Finances) for the year ended 31 March 2013
14
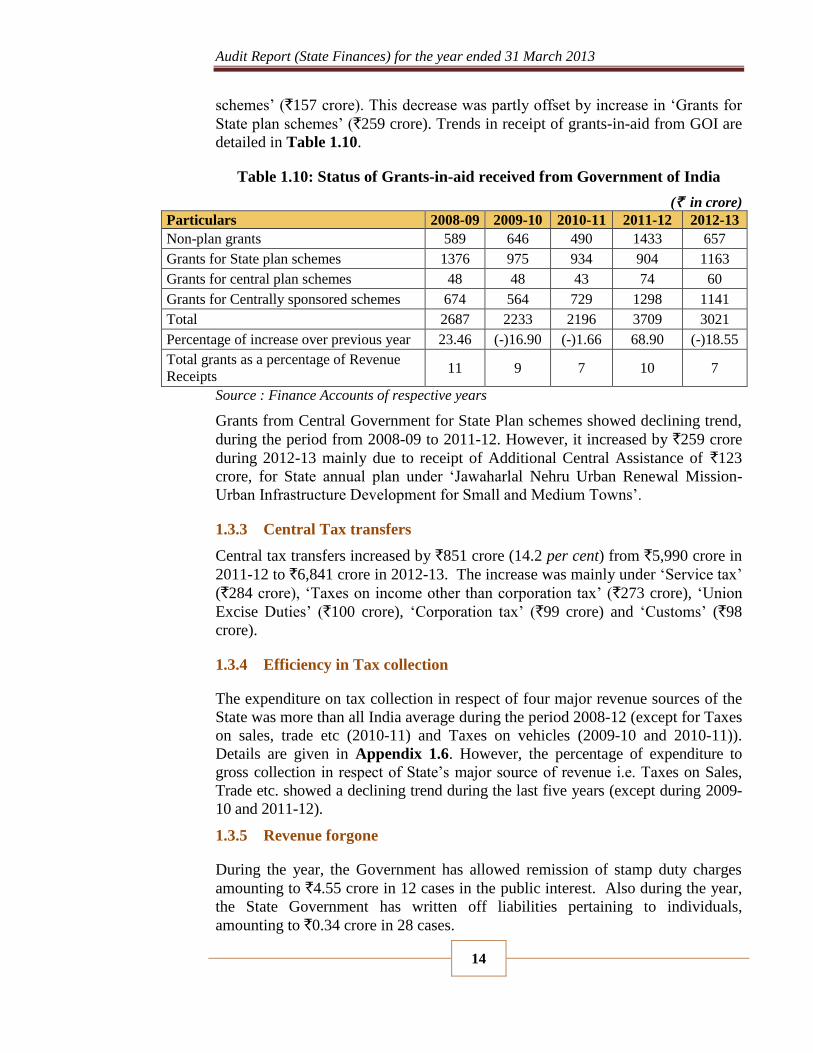
schemes’ (`157 crore). This decrease was partly offset by increase in ‘Grants for
State plan schemes’ (`259 crore). Trends in receipt of grants-in-aid from GOI are
detailed in Table 1.10.
Table 1.10: Status of Grants-in-aid received from Government of India
(` in crore)
Particulars 2008-09 2009-10 2010-11 2011-12 2012-13
Non-plan grants 589 646 490 1433 657
Grants for State plan schemes 1376 975 934 904 1163
Grants for central plan schemes 48 48 43 74 60
Grants for Centrally sponsored schemes 674 564 729 1298 1141
Total 2687 2233 2196 3709 3021
Percentage of increase over previous year 23.46 (-)16.90 (-)1.66 68.90 (-)18.55
Total grants as a percentage of Revenue
Receipts 11 9 7 10 7
Source : Finance Accounts of respective years
Grants from Central Government for State Plan schemes showed declining trend,
during the period from 2008-09 to 2011-12. However, it increased by `259 crore
during 2012-13 mainly due to receipt of Additional Central Assistance of `123
crore, for State annual plan under ‘Jawaharlal Nehru Urban Renewal Mission-
Urban Infrastructure Development for Small and Medium Towns’.
1.3.3 Central Tax transfers
Central tax transfers increased by `851 crore (14.2 per cent) from `5,990 crore in
2011-12 to `6,841 crore in 2012-13. The increase was mainly under ‘Service tax’
(`284 crore), ‘Taxes on income other than corporation tax’ (`273 crore), ‘Union
Excise Duties’ (`100 crore), ‘Corporation tax’ (`99 crore) and ‘Customs’ (`98
crore).
1.3.4 Efficiency in Tax collection
The expenditure on tax collection in respect of four major revenue sources of the
State was more than all India average during the period 2008-12 (except for Taxes
on sales, trade etc (2010-11) and Taxes on vehicles (2009-10 and 2010-11)).
Details are given in Appendix 1.6. However, the percentage of expenditure to
gross collection in respect of State’s major source of revenue i.e. Taxes on Sales,
Trade etc. showed a declining trend during the last five years (except during 2009-
10 and 2011-12).
1.3.5 Revenue forgone
During the year, the Government has allowed remission of stamp duty charges
amounting to `4.55 crore in 12 cases in the public interest. Also during the year,
the State Government has written off liabilities pertaining to individuals,
amounting to `0.34 crore in 28 cases.

Chapter I – Finances of the State Government
15
1.4 Receipt and Utilisation of Thirteenth Finance Commission Award for
the first three years of award period (2010-13)
1.4.1 Introduction
The Thirteenth Finance Commission (ThFC) was constituted by the President of
India under Article 280 of the Constitution to make recommendations for the
period 2010-2015. The Commission has the mandate to recommend the principles
which should govern the grants-in-aid of revenues of the States out of the
Consolidated Fund of India and the sums to be paid to the States, which are in
need of assistance under Article 275 of the Constitution of India. For the award
period (2010-11 to 2014-15), the Commission has recommended an amount of
`6715.566 crore, under various sectors. Of this, `3,112.70 crore was due to the
State for the first three years (2010-2013). A review of the receipt and utilisation
of ThFC award amount for three years period was conducted to assess:-
Whether the award amount for the first three years has been actually
received, if not reason for the shortfall;
Whether amount received as Grant has been provided in the annual budget
for utilisation by respective implementing departments;
Whether the amount provided in the budget has been utilized fully;
Whether the utilisation of award amounts was for the purposes for which
they were actually provided; and
Whether there existed effective monitoring and evaluation system.
Audit findings
1.4.2 Release of award amount by Government of India
During the period 2010-11 to 2012-13, the State Government received an amount
of `2,222.15 crore, out of an award amount of `3112.70 crore, resulting in a
short-release of `890.55 crore (details are given in Appendix 1.7). Sector-wise
short-release and specific reasons for the same are as follows:
(i) Environment related grants
As against an amount of `67.76 crore due for the forest related activities, the State
had received `59.29 crore resulting in a short-release of `8.47 crore. Central-State
Finance Commission Cell7 stated that shortfall in receipt was due to non-
achievement of projected Non-plan revenue expenditure (NPRE) during 2010-11,
under the major head 2406-Forestry and Wildlife. In response to Audit’s
observations, Government replied that non-achievement of projected NPRE was
due to booking of forest grant (as per earlier direction of GoI) on the plan side.
Government reply cannot be accepted because the booking of ThFC grant under
plan or non-plan would not alter the actual NPRE as the net of grant (after
6 Includes interest relief of `329.22 crore for the loan taken from National Small Savings Fund. 7 Cell functioning in the Kerala Government secretariat to monitor the receipt of Finance
Commission award.

Audit Report (State Finances) for the year ended 31 March 2013
16
deducting the ThFC grant utilized from NPRE) alone was considered for
ascertaining NPRE.
Under water sector management, grant was for meeting non-salary expenses like
maintenance of major, medium and minor irrigation schemes, in addition to
normal assistance of the State. The grant was to be released in two equal
instalments. The conditions for release were:-
The State should set up an independent Water Regulatory Authority and
notify by 31 March 2012.
The State should achieve the recovery rate as projected by the ThFC.
Non-adherence to the above two conditions resulted in shortfall of `44 crore in
the first three years.
(ii) Improving outcomes
For improving justice delivery8 an amount of `84.03 crore was due to the State in
the first three years. However, the State received `42.02 crore, resulting in a
shortfall of `42.01 crore. This was due to under-utilisation of amount released
during the first year.
An amount of `29.76 crore was due to the State under incentive grant for UID;
against this, release was only `4.96 crore, resulting in shortfall of `24.80 crore.
The release was based on the progress of enrolment of ‘Below Poverty Line’
beneficiaries. Slow pace in enrolment contributed to the shortfall.
For improving Statistical systems at district and state level, `8.40 crore was
awarded and the State received only `2.80 crore due to non-achievement of
milestones (resulting in under-utilisation of first instalment) fixed by the Finance
Commission.
(iii) Maintenance of Roads and Bridges
This grant is provided for maintenance of roads and bridges, and the yearly
release was in single instalment during the month of July. The release was based
on the condition that the NPRE of a particular year should reach the NPRE
projected to the ThFC. As the NPRE (`552.27 crore) for the year 2010-11 was
below the projected NPRE (`574.12 crore), the award amount (`232 crore) for the
year 2012-13 was not released to the State. The Department attributed the
shortfall in expenditure to delayed settlement of work bills and stated that the
expenditure would be booked during the earlier part of the next year.
(iv) Grant for capacity building
ThFC has awarded an amount of `20 crore (` four crore in each year) to
undertake measures to build capacity amongst those handling response and
creating awareness amongst people for effective disaster response. Out of the
8 Speedy disposal of cases by holding morning/evening/shift courts, enhancing support to Lok
Adalath, providing additional funding to State Legal Service Authorities, etc.

Chapter I – Finances of the State Government
17
award amount of `12 crore (for the first three years), the State received only
` eight crore, resulting in a short-release of ` four crore (award amount for 2012-
13). This was due to low utilisation of grant released in the first two years.
(v) Local Bodies Grant
An amount of `1,206.50 crore was due to the State Government as Basic Grant
and Performance Grant. The State had received `1,023.76 crore resulting in a
shortfall of `182.74 crore. The shortfall in receipt was due to delayed transfer of
funds to Local Self Government Institutions by the State Government.
(vi) State Specific Grants
In respect of State Specific Grants, instructions issued by Ministry of Finance
stipulate that 2/3rd of the first year release was to be utilized for getting second
year release. Owing to short utilisation of first release, against the award amount
of `750 crore, `346.93 crore was not released by the Government of India.
Sector-wise short-release is as follows:
Table 1.11: Short-release of funds under State Specific Grants (` in crore)
Sl.
No. Name of the Sector
Award amount
by ThFC
Amount released
by GOI
Shortfall in
receipt
1. Inland water ways/coastal
zone management 100.00 40.02 59.98
2. Primitive tribal group 74.00 11.55 62.45
3. Health infrastructure 99.00 49.50 49.50
4. Fisheries 100.00 50.00 50.00
5. Animal Husbandry 75.00 37.50 37.50
6. Kuttanad Development 150.00 75.00 75.00
7. Water bodies 25.00 12.50 12.50
Total 623.009 276.07 346.93 Source : Compiled from Detailed Appropriation Accounts and information furnished by departments
In the case of inland water ways/coastal zone management and primitive tribal
groups, apart from the condition mentioned above, submission of working plan
for lesser amount also contributed to the short-release.
1.4.3 Allocation of ThFC Grant to implementing agencies and its utilisation
For the efficient utilisation of ThFC grant, amount received by the State
Government has to be provided in the budget and released to the implementing
offices/agencies in time. Audit scrutiny revealed that ThFC grant received by the
State Government during the first three years has been included in the budget for
respective years for utilisation by implementing offices/agencies. However,
9 There was no shortfall in receipt under upgradation of police (`50 crore) and up-gradation of
prisons (`77 crore)

Audit Report (State Finances) for the year ended 31 March 2013
18
under-utilisation of the above allocation was noticed in some sectors as detailed
below:
Table 1.12: Utilisation of funds released (` in crore)
Sl.
No. Name of the Sector
Amount
received
Amount
utilised
Amount not
utilised
Environment related grants
1. Water sector management 44.00 39.20 4.80
Improving outcomes
2. Improving justice delivery 42.02 12.56 29.46
3. Improving statistical systems at district and
state level 2.80 1.90 0.90
4. Data base for employees and pensioners 2.50 … 2.50
State specific grants
5. Inland waterways/coastal zone management 40.02 26.29 13.73
Total 131.34 79.95 51.39 Source : Information furnished by departments
Delay in awarding the work was stated as the reason for under-utilisation of
budget allocation in water sector management. As regards improving justice
delivery, the Registrar General of High Court, Ernakulam stated that practical
difficulties experienced for setting up morning/evening courts, non-arrangement
of training to judicial officers due to delay in construction of State Judicial
Academy, etc. are the reasons for under utilization of funds released. In respect of
improving statistical systems at district and state level, delay in getting
administrative sanction for the action plan and non-completion of activities,
particularly surveys and studies proposed by ThFC, attributed to under utilisation
of released grant. Procedural delay was the reason stated for reduced utilisation
of budget allocation in the case of Inland waterways/coastal zone management.
1.4.4 Parking of funds in Treasury Savings Bank and other commercial
bank accounts
When an amount was drawn from the treasury, it was shown as expenditure in
Government account. However, it was noticed that, an amount `51.71 crore
shown as expenditure, was actually parked in Treasury Savings Bank (TSB)
account, maintained as part of Public Account, or in other commercial bank
accounts. Instances are detailed below:
(i) Incentive grant for UID
State may use the incentive, to directly assist the intended beneficiary or create
convenient facilities for them such that the cost of registration is minimal to
Below Poverty Line beneficiaries. Audit scrutiny revealed that entire release of
`4.96 crore was kept in fixed deposit (State Bank of Travancore) as the Kerala IT
Mission failed to utilize the fund for intended purpose. The Director, Kerala State
IT Mission stated that non-utilisation of fund was due to non-identification of
beneficiaries.

Chapter I – Finances of the State Government
19
(ii) Upgradation of infrastructure for police force
An amount of `24.40 crore was given (from November 2011 to January 2012) to
Kerala Police Housing Construction Corporation for constructing community
police resource centres, tourist protection and police assistance centres, etc. It was
noticed that out of the above amount, an amount of `10.71 crore remained
unutilized and was kept in the Public Account of Kerala Police Housing
Construction Corporation (December 2013), maintained in the Treasury.
However, the utilisation certificate for entire amount was given to GOI.
(iii) Fisheries
Under fisheries sector, for development of Model fishing villages by constructing
houses and providing water supply, sanitation and power, an amount `50 crore
was released (December 2011) to Deputy Directors (Fisheries) of eight districts
and to Managing Director, Kerala State Coastal Area Development Corporation
(` five crore). It was proposed to construct 284 houses in each of 11 Model
villages. As the list of beneficiaries was finalized only at the end of 2012, `34.21
crore only could be paid (December 2013) to beneficiaries. As a result, `15.79
crore remained unutilized in the TSB accounts of various District Officers.
However, the utilisation certificate for entire amount of `50 crore was given to
GOI.
(iv) Animal Husbandry
To strengthen the animal husbandry sector, including constitution of hi-tech dairy
complexes, commercial layer farm and setting up of pharmaceutical production
unit an amount of `37.50 crore was drawn by the Director of Dairy Development
and disbursed as given below:
Table 1.13: Utilisation of funds released under Animal Husbandry (` in crore)
Amount received by Purpose Amount
released
Amount
utilized
Director of Animal Husbandry Calf protection programme, Multi
speciality complex at Kudappanakunnu,
Pharmaceutical division at Veterinary
Biological Institute, Palode, Hi-tech dairy
complexes at Vithura and Kuriottumala
26.12 15.93
Managing Director, Kerala
Livestock Development Board
Hi-tech dairy complex at Dhoni,
Palakkad
5.38 0.00
MD, Kerala State Poultry
Development Corporation
Hi-tech layer farm at Kudappanakunnu 3.00 0.10
Director of Dairy Development Automation in milk collection in dairy
co-operatives
3.00 1.22
Total 37.50 17.25 Source : Information furnished by departments
Delayed execution of these components resulted in blocking up of `20.25 crore in
TSB account.

Audit Report (State Finances) for the year ended 31 March 2013
20
Thus, an amount of `51.71 crore shown as expenditure in Government account is
actually blocked up in TSB account/commercial banks. While submitting the
utilisation certificate to GOI, actual utilisation of the amount was not ensured.
Amounts certified as fully utilized were parked in TSB accounts. In response to
audit observations, the Principal Secretary, Finance Department stated (August
2013) that a proposal for engaging Finance Inspection Wing to inspect
departmental offices to detect parking of funds to overstate utilisation was under
consideration.
1.4.5 Utilisation of award amount for unintended purposes
District Innovation Fund was aimed at increasing the efficiency of capital assets
already created and the investment was to be used for filling the vital gaps in
public infrastructure already available in the district, which was not being fully
utilised for want of a relatively small investment. ThFC awarded an amount
`14.00 crore (` one crore for each district and the release of funds would be in
two instalments in 2011-12 and 2014-15) and the first instalment of ` seven crore
was received by Government of Kerala in 2011-12. Audit noticed that in Palakkad
and Thiruvananthapuram districts, the funds were not utilized for the purpose,
covered under the guidelines, as stated below:
In Thiruvananthapuram District, the entire amount of `50 lakh was
utilized for establishment of DC suite project10, for which estimate was
`100.03 lakh. The award was intended for capital assets already created
and not for new projects.
In Palakkad District, the entire fund of `50 lakh was used for construction
of play area including galleries in Indoor stadium, Palakkad.
As the funds are to be used to fill in vital gaps in public infrastructure already
available in the district which is not fully utilized for want of relatively small
investments, utilisation of funds for bigger projects was irregular.
1.4.6 Monitoring and submission of utilisation certificate
As per the guidelines a State level empowered committee headed by Chief
Secretary to the State government was constituted to monitor utilization of grants
for its stated objectives. Though the committee was convened in every quarter to
ensure proper utilisation of the award amount, audit noticed some deficiency in
ensuring timely utilisation of funds. Due to deficient utilisation of funds an
amount of `890.55 crore (29 per cent) was not received till 2012-13.
1.5 Capital Receipts
Capital receipts comprise miscellaneous capital receipts, recovery of loans and
advances released to institutions/organizations and public debt receipts. Trends in
receipts under capital sector during the period 2008-13 are detailed in Table 1.14.
10 Office automation programme to provide speedy and efficient service to the public

Chapter I – Finances of the State Government
21
Table 1.14: Trends in growth and composition of Capital Receipts
(` in crore)
Sources of State’s Receipts 2008-09 2009-10 2010-11 2011-12 2012-13
Capital Receipts (CR)
Miscellaneous Capital Receipts 9 49 25 16 15
Recovery of Loans and Advances 36 38 44 55 74
Public Debt Receipts 6921 6616 7189 9799 13261 Internal Debt Receipts 6153 6053 6828 9392 12709
Loans and Advances from GOI 768 563 361 407 552
Total CR 6966 6703 7258 9870 13350
Rate of growth of debt capital receipts
(per cent)
22.6 (-)4.4 8.7 36.3 35.3
Rate of growth of non-debt capital
receipts (per cent)
(-)15.1 93.3 (-)20.7 2.9 25.4
Rate of Growth of GSDP(per cent) 15.8 14.4 16.2 17.0 15.3
Rate of growth of CR (per cent) 22.3 (-)3.8 8.3 36.0 35.3
Buoyancy of Debt receipts w.r.t GSDP 1.4 (-)0.3 0.5 2.1 2.3
Source : Finance Accounts of respective years
In Capital receipts share of ‘Miscellaneous Capital receipts’ and ‘Recovery of
loans and advances’ was less than one per cent during the last five years (except
during 2009-10). During the period share of ‘Internal Debt’ in Public Debt
receipts increased from 89 per cent in 2008-09 to 96 per cent in 2012-13. Internal
Debt mainly comprised Open Market Borrowings of the State and growth rate
shown by debt capital receipts in last two years was mainly due to increased open
market borrowing in these years. During the last two years buoyancy of debt
receipts with respect to GSDP was more than two due to increased market
borrowings.
1.5.1 Proceeds from disinvestment
As of March 2013, the State Government had an amount of `4,511.03 crore as
investment in Statutory Corporations, Government Companies, Joint Stock
companies and Co-operatives. During the year, `14.75 crore was received from
retirement of capital/disinvestment of shares of co-operative societies/banks and
accounted under Miscellaneous Capital Receipts.
1.5.2 Recoveries of loans and advances
During the year, the State Government had released an amount of `1,136.15 crore
as loans and advances to various institutions/organizations and at the end of
March 2013 an amount of `10,456.93 crore was outstanding under this head.
Against this balance, principal amount recovered was `73.47 crore, which was
only 0.7 per cent of the outstanding balance under loans and advances. As per the
details furnished by the Departments (Finance Accounts 2012-13), the repayment
arrears from various loanee entities as of March 2013 was `6382.47 crore
(Principal: `3,745.87 crore and Interest: `2,636.60 crore), which indicate that
State Government’s receipts under loans and advances were much less than the
amount actually due.

Audit Report (State Finances) for the year ended 31 March 2013
22
1.5.3 Debt receipts from internal sources
Public Debt receipts of the State Government increased (35 per cent) from `9,799
crore in 2011-12 to `13,261 crore in 2012-13. This includes, Open Market
Borrowing (`11,583 crore), Special Securities issued to National Small Savings
Fund (`630 crore) and Loans from Financial Institutions (`496 crore).
Consequent on resetting of interest rates on National Small Savings Fund loans
for 2010-11 and 2011-12, as per recommendations of the ThFC, `6.90 crore was
credited back to Government Account during 2012-13.
1.5.4 Loans and advances from GOI
During the year the State Government received `552 crore from GOI as Loans for
State Plan schemes and this was 35.6 per cent more than the receipt (`407 crore)
during the previous year.
1.6 Public Accounts Receipts
Receipts and disbursements in respect of certain transactions such as small
savings, provident funds, reserve funds, deposits, suspense, remittances, etc.
which do not form part of the Consolidated Fund, are kept in the Public Account
set up under Article 266(2) of the Constitution. Here the Government acts as
banker. The balance after disbursements is the fund available with the government
for use.
Table 1.15: Net receipts under Public Account heads (` in crore)
Resources under various heads 2008-09 2009-10 2010-11 2011-12 2012-13
Public Account receipts
a. Small Savings, Provident Fund etc. 5531.33 2849.29 2489.94 3839.05 3685.54
b. Reserve Fund 381.59 328.42 407.21 146.93 -145.58
c. Deposits and Advances 131.91 436.87 468.89 -51.47 1140.93
d. Suspense and Miscellaneous -85.04 370.14 -197.30 852.37 712.44
e. Remittances 23.45 57.31 26.92 -157.40 30.49
Total 5983.24 4042.03 3195.66 4629.48 5423.82
Compared to previous year, overall net receipts under public account increased by
`794.34 crore during 2012-13 from `4,629.48 crore to `5,423.82 crore.
Substantial increase was noticed under Deposit and Advances (`1,192.40 crore)
and Remittances (`187.89 crore). This was partly offset by decrease in other
sectors. However, net accretions in the above Public Account heads were the main
source of fund to the State Government, for meeting its fiscal gap during the last
five years.
Chapter I – Finances of the State Government
23
1.7 Application of Resources
Analysis of the allocation of expenditure at the State Government level assumes
significance since major expenditure responsibilities are entrusted with them.
Within the framework of fiscal responsibility legislations, there are budgetary
constraints in raising public expenditure financed by deficit or borrowings. It is,
therefore, important to ensure that the ongoing fiscal correction and consolidation
process at the State level is not at the cost of expenditure, especially the
expenditure directed towards development of social sector.
1.7.1 Growth and Composition of Expenditure
The total expenditure of the State Government consists of revenue expenditure as
well as capital expenditure which include expenditure on loans and advances.
The trends in various components of total expenditure-Plan and Non-Plan revenue
expenditure, committed expenditure such as salaries and wages, interest
payments, pension payments and subsidies, financial assistance to local bodies,
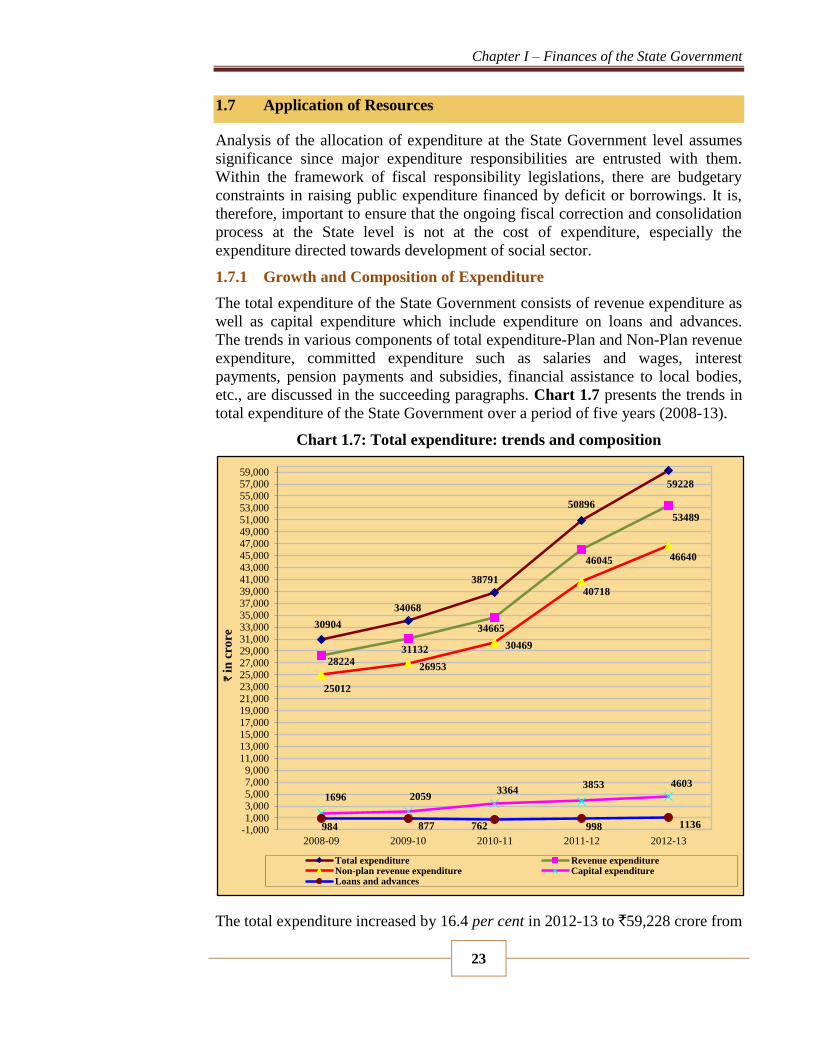
etc., are discussed in the succeeding paragraphs. Chart 1.7 presents the trends in
total expenditure of the State Government over a period of five years (2008-13).
Chart 1.7: Total expenditure: trends and composition
The total expenditure increased by 16.4 per cent in 2012-13 to `59,228 crore from
30904
34068
38791
50896
59228
28224
31132
34665
46045
53489
25012
26953
30469
40718
46640
1696 20593364
3853 4603
984 877 762 998 1136-1,0001,0003,0005,0007,0009,000
11,00013,00015,00017,00019,00021,00023,00025,00027,00029,00031,00033,00035,00037,00039,00041,00043,00045,00047,00049,00051,00053,00055,00057,00059,000
2008-09 2009-10 2010-11 2011-12 2012-13
`in
cro
re
Total expenditure Revenue expenditureNon-plan revenue expenditure Capital expenditureLoans and advances

Audit Report (State Finances) for the year ended 31 March 2013
24
`50,896 crore in the previous year. The total expenditure, its annual growth rate,
the ratio of expenditure to the State GSDP and to revenue receipts and its
buoyancy with respect to GSDP and revenue receipts are indicated in Table 1.16.
During 2003-04 to 2011-12, the compounded annual growth rate of total
expenditure (13.96 per cent) was less than the growth rate of other General
Category States (14.15 per cent). For the period 2003-04 to 2012-13 the growth
rate of the State was further increased to 14.56 per cent (Appendix 1.1).
Table 1.16: Total expenditure – basic parameters
Particulars 2008-09 2009-10 2010-11 2011-12 2012-13
Total expenditure (TE) (` in crore) 30904 34068 38791 50896 59228
Rate of growth (per cent) 13.4 10.2 13.9 31.2 16.4
TE/GSDP ratio (per cent) 15.2 14.7 14.4(*) 16.1(*) 16.3
RR/TE ratio (per cent) 79.3 76.6 79.9 74.7 74.5
Buoyancy of TE with reference to:
GSDP (ratio) 0.8 0.7 0.9(*) 1.8(*) 1.1
RR (ratio) 0.8 1.6 0.7 1.4 1.0 (*) change in figures is due to adoption of new series of GSDP figures
The increase (`8,332 crore) of total expenditure during 2012-13 was on account
of increase of `7,444 crore in revenue expenditure, `750 crore in capital
expenditure and `138 crore in disbursement of loans and advances. Decreasing
trend in ratio between revenue receipt and total expenditure, during last three
years, indicates the widening gap in receipt and expenditure amounts of the State
Government. Buoyancy of the total expenditure with respect to GSDP and
revenue receipt was more than one during 2011-12 and declining of this ratio
during 2012-13 was a positive indicator. The composition of the total expenditure
is depicted in Chart 1.8.
0
10
20
30
40
50
60
70
80
90
100
110
2008-09 2009-10 2010-11 2011-12 2012-13
91 91 89 90 90
6 6 9 8 83 3 2 2 2
per
cen
tag
e sh
are
Chart 1.8 : Total Expenditure - share of its components
Revenue expenditure Capital expenditure Loans and advances
Chapter I – Finances of the State Government
25
During the five-year period 2008-13, the share of revenue expenditure ranged
between 89 to 91 per cent of the total expenditure whereas the share of capital
expenditure ranged between six and nine per cent of the total expenditure. The
revenue expenditure increased in absolute terms from `28,224 crore in 2008-09 to
`53,489 crore in 2012-13 but its percentage to total expenditure remained almost
static during the last five year period. Capital expenditure increased from `1,696
crore in 2008-09 to `4,603 crore in 2012-13 and its percentage in total
expenditure increased from six per cent to eight per cent.
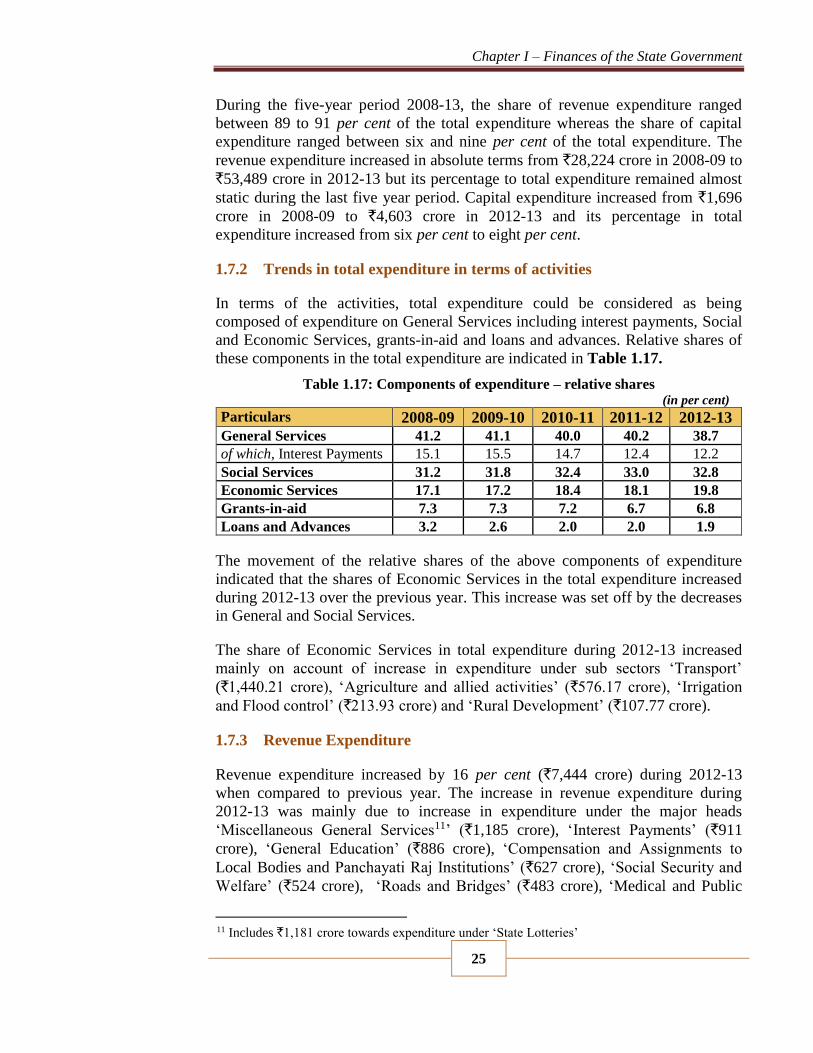
1.7.2 Trends in total expenditure in terms of activities
In terms of the activities, total expenditure could be considered as being
composed of expenditure on General Services including interest payments, Social
and Economic Services, grants-in-aid and loans and advances. Relative shares of
these components in the total expenditure are indicated in Table 1.17.
Table 1.17: Components of expenditure – relative shares (in per cent)
Particulars 2008-09 2009-10 2010-11 2011-12 2012-13
General Services 41.2 41.1 40.0 40.2 38.7
of which, Interest Payments 15.1 15.5 14.7 12.4 12.2
Social Services 31.2 31.8 32.4 33.0 32.8
Economic Services 17.1 17.2 18.4 18.1 19.8
Grants-in-aid 7.3 7.3 7.2 6.7 6.8
Loans and Advances 3.2 2.6 2.0 2.0 1.9
The movement of the relative shares of the above components of expenditure
indicated that the shares of Economic Services in the total expenditure increased
during 2012-13 over the previous year. This increase was set off by the decreases
in General and Social Services.
The share of Economic Services in total expenditure during 2012-13 increased
mainly on account of increase in expenditure under sub sectors ‘Transport’
(`1,440.21 crore), ‘Agriculture and allied activities’ (`576.17 crore), ‘Irrigation
and Flood control’ (`213.93 crore) and ‘Rural Development’ (`107.77 crore).
1.7.3 Revenue Expenditure
Revenue expenditure increased by 16 per cent (`7,444 crore) during 2012-13
when compared to previous year. The increase in revenue expenditure during
2012-13 was mainly due to increase in expenditure under the major heads
‘Miscellaneous General Services11’ (`1,185 crore), ‘Interest Payments’ (`911
crore), ‘General Education’ (`886 crore), ‘Compensation and Assignments to
Local Bodies and Panchayati Raj Institutions’ (`627 crore), ‘Social Security and
Welfare’ (`524 crore), ‘Roads and Bridges’ (`483 crore), ‘Medical and Public
11 Includes `1,181 crore towards expenditure under ‘State Lotteries’
Audit Report (State Finances) for the year ended 31 March 2013
26
Health’ (`316 crore), Crop Husbandry (`252 crore), ‘Police’ (`250 crore),
‘Labour and Employment’ (`236 crore), ‘Pension and Other Retirement Benefits’
(`167 crore), etc.
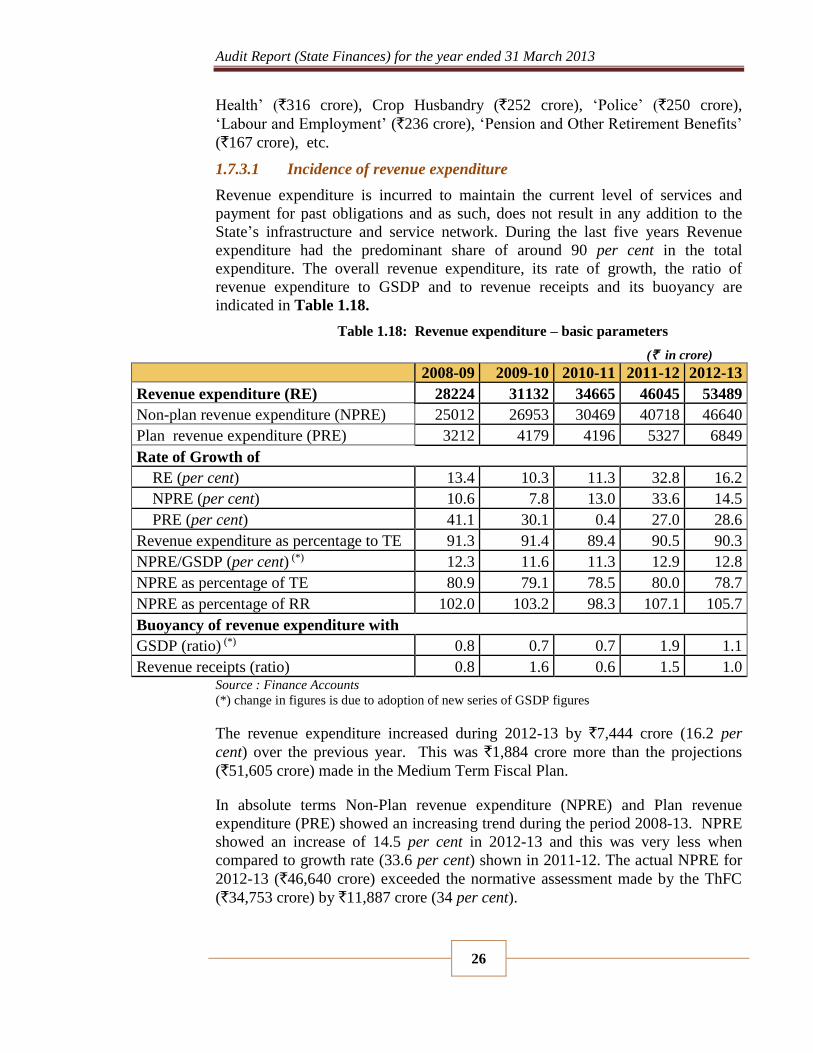
1.7.3.1 Incidence of revenue expenditure
Revenue expenditure is incurred to maintain the current level of services and
payment for past obligations and as such, does not result in any addition to the
State’s infrastructure and service network. During the last five years Revenue
expenditure had the predominant share of around 90 per cent in the total
expenditure. The overall revenue expenditure, its rate of growth, the ratio of
revenue expenditure to GSDP and to revenue receipts and its buoyancy are
indicated in Table 1.18.
Table 1.18: Revenue expenditure – basic parameters
(` in crore)
2008-09 2009-10 2010-11 2011-12 2012-13
Revenue expenditure (RE) 28224 31132 34665 46045 53489
Non-plan revenue expenditure (NPRE) 25012 26953 30469 40718 46640
Plan revenue expenditure (PRE) 3212 4179 4196 5327 6849
Rate of Growth of
RE (per cent) 13.4 10.3 11.3 32.8 16.2
NPRE (per cent) 10.6 7.8 13.0 33.6 14.5
PRE (per cent) 41.1 30.1 0.4 27.0 28.6
Revenue expenditure as percentage to TE 91.3 91.4 89.4 90.5 90.3
NPRE/GSDP (per cent) (*) 12.3 11.6 11.3 12.9 12.8
NPRE as percentage of TE 80.9 79.1 78.5 80.0 78.7
NPRE as percentage of RR 102.0 103.2 98.3 107.1 105.7
Buoyancy of revenue expenditure with
GSDP (ratio) (*) 0.8 0.7 0.7 1.9 1.1
Revenue receipts (ratio) 0.8 1.6 0.6 1.5 1.0 Source : Finance Accounts
(*) change in figures is due to adoption of new series of GSDP figures
The revenue expenditure increased during 2012-13 by `7,444 crore (16.2 per
cent) over the previous year. This was `1,884 crore more than the projections
(`51,605 crore) made in the Medium Term Fiscal Plan.
In absolute terms Non-Plan revenue expenditure (NPRE) and Plan revenue
expenditure (PRE) showed an increasing trend during the period 2008-13. NPRE
showed an increase of 14.5 per cent in 2012-13 and this was very less when
compared to growth rate (33.6 per cent) shown in 2011-12. The actual NPRE for
2012-13 (`46,640 crore) exceeded the normative assessment made by the ThFC
(`34,753 crore) by `11,887 crore (34 per cent).

Chapter I – Finances of the State Government
27
During the year, Plan Revenue Expenditure (PRE) showed a higher growth (28.6
per cent) rate, when compared to NPRE and it increased by `1,522 crore.
As in the previous year, buoyancy of revenue expenditure with respect to GSDP
was more than one, indicating that growth rate of revenue expenditure was more
than the growth rate of GSDP. However, it declined from 1.9 per cent to 1.1 per
cent which is a good indicator
1.7.3.2 Expenditure on salaries, wages, interest payments, pension, etc.
The committed expenditure of the State Government on revenue account mainly
consists of interest payments, expenditure on salaries and wages, pensions and
subsidies. Table 1.19 and Chart 1.9 present the trends in the expenditure on these
components during 2008-13.
Table 1.19: Components of Committed Expenditure (` in crore)
Components of committed
expenditure 2008-09 2009-10 2010-11 2011-12
2012-13
BE Actuals
Salaries* and Wages, 9,146 9894 11,178 16,229 16,919 17,505 Non-plan head 8,895 9,529 10,815 15,681 16,415 16,939
Plan heads** 251 365 363 548 504 566
Interest payments (MH 2049) 4,660 5,292 5,690 6,294 7,234 7,205
Expenditure on pensions (MH 2071) 4,686 4,706 5,767 8,700 8,178 8,867
Subsidies 355 442 627 1,014 769 1,268
Total 18,847 20,334 23,262 32,237 33,100 34,845
Revenue Expenditure 28,224 31,132 34,665 46,045 51,605 53,489
Revenue Receipts 24,512 26,109 30,991 38,010 48,141 44,137
Percentage of committed expenditure
to Revenue Expenditure 67 65 67 70 64 65
Percentage of committed expenditure
to Revenue Receipts 77 78 75 85 69 79
* Salaries include teaching grant paid to aided educational institutions like schools and colleges to meet the
salaries of their teaching and non-teaching staff.
**The plan heads also include the salaries and wages paid under Centrally Sponsored schemes
During the current year, the percentage of State’s committed expenditure with
respect to Revenue Expenditure and Revenue Receipt has decreased, compared to
previous year. However, consumption of 79 per cent of the Revenue receipts for
committed expenditure was high when compared to the State’s estimation of
69 per cent.

Audit Report (State Finances) for the year ended 31 March 2013
28
Chart 1.9 shows that share of salaries/wages and pensions in revenue expenditure
remained static during last five years, though there was slight increase in 2011-12
due to implementation of recommendations of Ninth State Pay Revision
Commission. However, share of interest payments in revenue expenditure showed
a declining trend during the last five years.
During 2011-12, expenditure on salaries under Non-plan and Plan heads increased
to `16,939 crore and `566 crore respectively from `15,681 crore and `548 crore
in the previous year. Similarly, pension payment also increased from `8,700 crore
to `8,867 crore during the year. Expenditure on pension exceeded the projections
made in the Medium Term Fiscal Plan (`8,178 crore) by `689 crore.
Interest payments increased by 14.5 per cent during 2012-13, (`7,205 crore) when
compared to the previous year (`6,294 crore). This was mainly due to increase in
interest payment on ‘Market Loans’ availed by the State Government. However,
expenditure on interest payments was in line with the projections made by the
State Government in the Medium Term Fiscal Plan (`7,234 crore).
1.7.3.3 Subsidies
In any welfare State, it is not uncommon to provide subsidies/subventions to
disadvantaged sections of the society. Subsidies are dispensed not only explicitly
but also implicitly by providing subsidized public service to the people.
Budgetary support to financial institutions, inadequate returns on investments and
poor recovery of user charges from social and economic services provided by the
Government fall in the category of implicit subsidies. As an exhaustive statement
of implicit subsidies given by the State Government could not be compiled easily
from the accounts, information collected from Finance department in respect of
department-wise implicit subsidy provided during 2012-13 is given in Table 1.20.
0
10
20
30
40
50
60
70
80
2008-09 2009-10 2010-11 2011-12 2012-13
32 32 32 35 33
17 17 16 1413
17 15 17 1917
1 1 22
2
Chart 1.9 : Components of Committed Expenditure in Revenue
Expenditure
Subsidies Expenditure on pensions Interest payments Salaries & Wages

Chapter I – Finances of the State Government
29
Table 1.20: Implicit subsidies given in 2012-13
(` in crore)
Name of the Department Purpose Expenditure
incurred
Coir Development Department Incentive provided to coir co-operatives
based on their production
34.40
Food and Civil Supplies
Department
Handling charges given to retailers
under Antyodaya Annapoorna scheme
17.71
Land Revenue Department Tax concessions given under various
items
24.79
Total 76.90
Source : Information furnished by Finance Department, Government of Kerala
As per Finance Accounts an amount of `1,268 crore was given as explicit subsidy
during 2012-13. It mainly includes amount given to Food Corporation of India in
respect of reimbursement of price difference of ration rice and wheat (`640
crore), for Paddy procurement through Kerala State Civil Supplies Corporation
(`120 crore), to Kerala State Civil Supplies Corporation Limited for market
intervention (`135 crore) and towards special support schemes for farm sector
(`95 crore).
1.7.4 Capital Expenditure
Capital expenditure increased by 19 per cent (`750 crore) during 2012-13 and the
increase was mainly under ‘Roads and Bridges’ (`338 crore), ‘Civil Aviation’
(`174 crore), ‘‘Flood control projects’ (`117 crore), ‘Other Transport services’
(`355 crore), etc. This increase was partly offset by decrease in expenditure
mainly under ‘Co-operation’ (`126 crore), ‘Industries and Minerals’ (`93 crore)
and ‘Urban Development’ (`83 crore).
1.7.5 Financial assistance by State Government to Local Bodies and other
institutions
The quantum of assistance provided by the Government as grants and loans to
local bodies, educational institutions, Government companies, Welfare Fund
Boards, etc during the current year relative to the previous years is presented in
Table 1.21.
Table 1.21: Financial assistance to local bodies, educational institutions, etc. (` in crore)
Financial Assistance to Institutions 2008-09 2009-10 2010-11 2011-12 2012-13
Educational Institutions (Aided Schools,
Aided Colleges, Universities, etc.) 3306.81 3546.61 4087.83 5605.77 6204.36
Municipal Corporations and Municipalities 966.99 834.46 901.87 1073.78 1177.77
Zilla Parishads and Other Panchayati Raj
Institutions 2600.11 2996.66 3411.65 4203.98 5279.31
Development Agencies 1.95 2.04 5.25 5.50 5.15

Audit Report (State Finances) for the year ended 31 March 2013
30
Financial Assistance to Institutions 2008-09 2009-10 2010-11 2011-12 2012-13
Hospitals and Other Charitable Institutions 56.66 76.40 139.02 144.46 153.33
Other Institutions12 658.83 1159.47 1252.58 1065.96 896.42
Total 7591.35 8615.64 9798.20 12099.45 13716.34
Assistance as percentage of revenue
expenditure 27 28 28 26 26
Source: Finance Accounts and information received from the State Government
The financial assistance to local bodies and other institutions increased from
`7,591.35 crore in 2008-09 to `13,716.34 crore in 2012-13. During 2012-13,
financial assistance to Educational Institutions, Panchayati Raj institutions, etc.
increased by `1,616.89 crore compared to the previous year. As a percentage of
revenue expenditure it was 26 per cent as in the previous year.
1.8 Quality of Expenditure
The availability of better social and physical infrastructure in the State generally
reflects the quality of its expenditure. Improvement in the quality of expenditure
basically involves three aspects, viz., adequacy of public expenditure (i.e.
adequate provisions for providing public services); efficiency of expenditure use
and its effectiveness (assessment of outlay-outcome relationships for select
services).
1.8.1 Adequacy of public expenditure
The responsibilities relating to expenditure on the social sector and the economic
infrastructure assigned to the State Governments are largely State subjects.
Enhancing human development levels requires the States to step up their
expenditure on key social services like education, health, etc. Low fiscal priority
(ratio of expenditure under a category to aggregate expenditure) is attached to a
particular sector, if it is below the respective national average. Table 1.22
analyses the fiscal priority of the State Government with regard to development
expenditure, social expenditure and capital expenditure during 2009-10 and
2012-13.
12 Other institutions, inter alia, include Kerala State Road Transport Corporation (`175 crore),
Kerala Sports Council (`34.89 crore), Kerala Water Authority (`18.25 crore) State Council for
Science, Technology & Environment (`98.10 crore), Welfare fund for Cashew workers
(`35.78 crore), Kudumbasree (`84.17 crore), Kerala Khadi and Village Industries Board (`11.50
crore), Kerala State Information Technology Mission (`26.30 crore), etc.

Chapter I – Finances of the State Government
31
Table 1.22: Fiscal priority of the State in 2009-10 and 2012-13 (in per cent)
Fiscal Priority by the State* AE/
GSDP
DE#/
AE
SSE/
AE
CE/
AE
Education/
AE
Health/
AE
General Category States’
Average, 2009-10 17.06 66.05 35.73 14.96 16.19 4.24
Kerala’s Average, 2009-10 14.68 49.02 31.79 6.04 17.04 5.04
General Category States’
Average, 2012-13 15.93 65.79 32.77 13.23 17.23 4.47
Kerala’s Average, 2012-13 16.30 54.24 33.74 7.77 17.52 5.48
* As per cent to GSDP
AE: Aggregate (Total) Expenditure DE: Development Expenditure
SSE: Social Sector Expenditure CE: Capital Expenditure.
# Development expenditure includes Development Revenue Expenditure, Development Capital
expenditure and Loans and Advances disbursed (Social and Economic sector).
General category States exclude Delhi, Goa and Puducherry.
Though, during 2009-10 the State’s aggregate expenditure as a proportion
of its GSDP was less comparing to General Category States, it was higher
than the General category state’s proportion in 2012-13.
In 2009-10 and 2012-13, development expenditure as a proportion of
aggregate expenditure has been lower than the General Category States'
average. Developmental expenditure consists of both economic sector
expenditure and social sector expenditure.
Though the State has not been given adequate priority to Social sector
during 2009-10, it was better than the General Category States during
2012-13. As far as health sector and education sector’s fiscal priority is
concerned, the State has the better statistics compared to General Category
States.
The proportion of capital expenditure has been much lower as compared
to General Category States during 2009-10 and 2012-13. However, it is
observed that the State has shown some improvement in 2012-13 as
compared to 2009-10 by increasing expenditure on capital but it is still
lower than General Category States’ average.
The Government may consider enhancing the proportion of expenditure on capital
sector in order to create the much needed assets to stimulate growth and give
priority to physical capital formation that will further increase the growth
prospects of the State by creating durable assets.
1.8.2 Efficiency of expenditure use
In view of the importance of public expenditure on development heads from the
point of view of social and economic development, it is important for the State
Government to take appropriate expenditure rationalisation measures and lay

Audit Report (State Finances) for the year ended 31 March 2013
32
emphasis on provision of core public and merit goods13. Apart from improving
the allocation towards development expenditure14, particularly in view of the
fiscal space being created on account of decline in expenditure on debt servicing
in recent years, the efficiency of expenditure use is also reflected by the ratio of
capital expenditure to total expenditure (and/or GSDP) and the proportion of
revenue expenditure being spent on operation and maintenance of the existing
social and economic services. The higher the ratio of these components to total
expenditure (and/or GSDP), the better would be the quality of expenditure.
Development expenditure comprised revenue and capital expenditure including
loans and advances in socio-economic services. Table 1.23 presents the trends in
development expenditure relative to the aggregate expenditure of the State during
the period 2008-09 to 2012-13. Chart 1.10 presents component-wise
development expenditure during 2008-13.
Table 1.23: Development expenditure
(` in crore)
Components of Development
Expenditure 2008-09 2009-10 2010-11 2011-12
2012-13
BE Actuals
Development Expenditure (a to c)
a. Development revenue
expenditure
13,292
(43.0)
14,708
(43.2)
16,469
(42.5)
22,356
(43.9) 26,578
26,686
(45.1)
b. Development capital expenditure 1,643
(5.3)
1,993
(5.9)
3245
(8.4)
3,691
(7.3) 6,495
4456
(7.5)
c. Development loans and advances 979
(3.2)
822
(2.4)
708
(1.8)
854
(1.7) 665
982
(1.7)
Total Development expenditure 15,914 17,523 20,422 26,901 33,738 32,124
Figures in parentheses indicate percentage to aggregate expenditure
Source: Finance Accounts and Annual Financial Statement of the State Government for 2012-13
13 Core public goods are goods which all citizens enjoy in common in the sense that each
individual's consumption of such goods leads to no subtractions from any other individual's
consumption of that good, e.g. enforcement of law and order, security and protection of our
rights; pollution free air and other environmental goods and road infrastructure etc.
Merit goods are commodities that the public sector provides free or at subsidized rates because
an individual or society should have them on the basis of some concept of need, rather than
ability and willingness to pay the Government and therefore, wishes to encourage their
consumption. Examples of such goods include the provision of free or subsidized food for the
poor to support nutrition, delivery of health services to improve quality of life and reduce
morbidity, providing basic education to all, drinking water and sanitation etc. 14 The analysis of expenditure data is disaggregated into development and non-development
expenditure. All expenditure relating to Revenue Account, Capital Outlay and Loans and
Advances is categorized into Social Services, Economic Services and General Services.
Broadly, the social and economic services constitute development expenditure, while
expenditure on general services is treated as non-development expenditure.

Chapter I – Finances of the State Government
33
Development expenditure increased by 102 per cent (`16,210 crore) from
`15,914 crore in 2008-09 to `32,124 crore in 2012-13. Development revenue
expenditure during 2012-13 constituted 83 per cent of development expenditure
whereas the share of development capital expenditure, including loans and
advances was only 17 per cent.
Development revenue expenditure increased by 19.4 per cent (`4,330 crore)
from `22,356 crore in 2011-12 to `26,686 crore in 2012-13. The increase was
mainly due to increase in expenditure under the sub-sectors ‘General Education’
(`886 crore), ‘Social Security and Welfare’ (`524 crore), ‘Roads and Bridges’
(`483 crore), ‘Medical and Public Health’ (`316 crore) and ‘Crop Husbandry’
(`252 crore).
Development capital expenditure increased by 20.7 per cent (`765 crore) from
`3,691 crore in 2011-12 to `4,456 crore in 2012-13. The increase was mainly due
to increase in expenditure under the accounts heads; ‘Roads and Bridges’
(`338 crore), and ‘Other Transport Services’ (`355 crore).
Details of capital expenditure and the components of revenue expenditure
incurred on the maintenance of the selected social and economic services are
given in Table 1.24.
13292
1470816469
2235626686
1643 19933245
36914456
979 822 708 854 982
-2000
1000
4000
7000
10000
13000
16000
19000
22000
25000
28000
2008-09 2009-10 2010-11 2011-12 2012-13
`in
cro
re
Chart 1.10: Components of development expenditure
Development revenue expenditure Development capital expenditure
Development loans and advances

Audit Report (State Finances) for the year ended 31 March 2013
34
Table 1.24: Efficiency of expenditure in selected Social and Economic Services
Social/Economic
Infrastructure
2011-12 2012-13
Ratio
of CE
to TE
In RE, the share of Ratio
of CE
to TE
In RE, the share of
S&W O&M S&W O&M
Social Services (SS)
General Education 0.2 89.2 (*) 0.6 86.9 0.0
Health and Family Welfare 4.1 73.9 0.1 4.0 72.0 0.3
Water Supply, Sanitation,
Housing and Urban
Development 13.4 5.9 2.3 7.2 4.9 3.1
Total (SS) 3.4 67.0 0.7 2.8 62.2 0.8
Economic Services (ES)
Agriculture and Allied
Activities 9.5 28.4 0.1 5.4 25.2 0.1
Irrigation and Flood Control 40.6 66.1 32.7 41.4 51.8 48.3
Power and Energy 0.1 0.3 0.0 0.3
Transport 58.3 16.2 39.5 59.7 12.0 37.2
Total (ES) 32.4 29.5 10.6 32.1 24.7 11.8
Total (SS+ES) 13.7 56.7 3.4 13.9 51.3 4.0
TE: Total Expenditure; CE: Capital Expenditure; RE: Revenue Expenditure;
S&W: Salaries and Wages; O&M: Operations and Maintenance.
(*) insignificant
The ratio of capital expenditure to total expenditure under Social Services
decreased from 3.4 per cent in the previous year to 2.8 per cent in the year 2012-
13. However, ratio of capital expenditure to total expenditure under General
Education sector increased from 0.2 per cent in the previous year to 0.6 per cent
in 2012-13 indicating State’s more investment in the sector. In all other sectors
the ratio was less than the previous year.
The percentage of capital expenditure to total expenditure under Economic
Services also decreased from 32.4 per cent in 2011-12 to 32.1 per cent in 2012-
13. However, this percentage increased in ‘Irrigation and Flood Control’ and
‘Transport’ sectors due to more expenditure in Flood control projects and
Transport.
During 2012-13, the share of salaries and wages in revenue expenditure decreased
from 67 per cent to 62.2 per cent and 29.5 per cent to 24.7 per cent in Social
Services and Economic Services respectively, compared to previous year.

Chapter I – Finances of the State Government
35
1.9 Financial Analysis of Government Expenditure and Investments
In the post-Fiscal Responsibility and Budget Management framework, the State is
expected to keep its fiscal deficit (and borrowings) not only at low levels but also
meet its capital expenditure/ investment (including loans and advances)
requirements from its own sources of revenue. In addition, in a transition to
complete dependence on market-based resources, the State Government is
required to initiate measures to earn adequate returns on its investments and
recover its cost of borrowed funds rather than bearing the same on its budget in
the form of implicit subsidies. The State is also required to take requisite steps to
infuse transparency in financial operations. This section presents the broad
financial analysis of investments and other capital expenditure undertaken by the
Government during the current year vis-à-vis previous years.
1.9.1 Financial results of irrigation works
In the case of eight irrigation projects, which have been declared commercial,
with a cumulative capital outlay of `136.27 crore as on 31 March 2013, the
revenue realised from them during 2012-13 was `2.07 crore, which was only 1.5
per cent of the total outlay. After considering the working and maintenance
expenses of `40.20 crore and interest charges of `12.81 crore, these projects
suffered a net loss of `50.94 crore (as detailed in Appendix IX to Finance
Accounts).
1.9.2 Incomplete projects/works
Department-wise information pertaining to incomplete projects/works (each
costing above ` one crore) as on 31 March 2013 is given in Table 1.25.
Table 1.25: Status of incomplete projects in the State (` in crore)
Sl.
No Name of the department/project
No. of
incomplete
projects/
works
Initial
budgeted
cost
Cumulative
actual expendi-
ture as on 31
March 2013
1. Water Resources Department –
(Irrigation and Minor Irrigation Works) 16 37.24 20.38
2. Public Works Department – (Roads) 86 285.15 184.98
3. Public Works Department – (Bridges) 32 163.57 104.35
4. Public Works Department – (Buildings) 75 263.65 166.62
5. Harbour Engineering Department 6 59.49 62.73
Total 215 809.10 539.06
Source: Appendix X of Finance Accounts 2012-13
According to information included in the Finance Accounts, 215 projects/works

Audit Report (State Finances) for the year ended 31 March 2013
36
on which an expenditure of `539.06 crore was incurred up to March 2013 were
not completed at the end of March 2013 though the stipulated period of
completion was over. Delay in completion of projects/works may result in cost
overrun.
1.9.3 Investment and returns
As of 31 March 2013, the State Government had invested `4,511.03 crore in
Statutory Corporations, Government Companies, Joint Stock Companies and
Co-operatives (Table 1.26). The average return on these investments was
1.3 per cent in the last five years while the Government paid an average interest
rate ranging from 7.1 per cent to 7.5 per cent on its borrowings during
2008-2013.
Table 1.26: Return on investments (` in crore)
Investment/Return/Cost of
Borrowings 2008-09 2009-10 2010-11 2011-12 2012-13
Investment at the end of the year
(` in crore) 3153.10 3328.25 3807.52 4206.43 4511.03
Return (` in crore) 33.53 27.29 75.46 67.44 48.15
Return (per cent) 1.1 0.8 2.0 1.6 1.1
Average rate of interest on
Government borrowing (per cent) 7.5 7.5 7.3 7.2 7.1
Difference between interest rate and
return (per cent) 6.4 6.7 5.3 5.6 6.0
Source: Finance Accounts of the State Government
During 2012-13, the State Government invested `0.50 crore in Statutory
Corporations, ` 224.38 crore in Government Companies and ` 84.40 crore in Co-
operative Banks and Societies. Two Statutory Corporations and 45 Government
Companies with aggregate Government investments of `1,751.53 crore were
incurring losses and their accumulated losses amounted to ` 3,829.63 crore as per
the latest accounts furnished by these Companies.
As per the latest accounts finalized by the companies/statutory corporations, three
statutory corporations and 36 Government companies are running on profits. Of
these, ten major companies which had accumulated profits above `100 crore are
listed in Table 1.27.

Chapter I – Finances of the State Government
37
Table 1.27: Major profit making companies (` in crore)
Sl.
No. Name of Government Company
Accounts for
the year ended
Accumulated
profit
1. Kerala State Electricity Board 2012-13 2208.3215
2. The Kerala Minerals and Metals Limited 2012-13 577.25
3. Kerala State Beverages (Manufacturing and Marketing)
Corporation Limited 2010-11 550.87
4. Malabar Cements Limited 2011-12 188.99
5. The Kerala State Financial Enterprises Limited 2010-11 171.13
6. The Rehabilitation Plantations Limited 2012-13 138.40
7. The Kerala Agro-Machinery Corporation Limited. 2011-12 100.12
8. The Plantation Corporation of Kerala Limited 2012-13 132.40
9. Kerala State Industrial Development Corporation
Limited 2012-13 126.91
10. Kerala Industrial Infrastructure Development
Corporation 2012-13 124.87
Source: Annexure 2 of Audit Report (Commercial) for the year ended 31 March 2013
1.9.4 Loans and advances by the State Government
In addition to investments in Co-operative Societies, Statutory Corporations and
Government Companies, the Government has also been providing loans and
advances to many institutions/organisations. Table 1.28 presents the outstanding
loans and advances as on 31 March 2013 and interest receipts vis-à-vis interest
payments during the last five years.
Table 1.28: Average interest received on loans advanced by the State Government
(` in crore)
Quantum of Loans/Interest
Receipts/Cost of Borrowings 2008-09 2009-10 2010-11 2011-12 2012-13
Opening balance 6,28016 691017 7749 846118 939419
Amount advanced during the year 984 877 762 998 1136
Amount repaid during the year 36 38 44 55 74
15 As per the notification issued by the Central Electricity Regulatory Commission, electricity
utility of every State has to show a return of 15.5 per cent return on equity. In compliance with
this, the accounts of KSEB for the year 2012-13 showed an accumulated profit of `2208.32
crore whereas the operations resulted in accumulated loss of `7,118.56 crore. 16 Difference of `130 crore with reference to the previous year’s closing balance was on account
of pro forma adjustments vide footnotes (b), (d) and (e) of Statement no.5 of the Finance
Accounts 2008-09. 17 Difference of `318 crore with reference to previous year’s closing balance was on account of
pro forma adjustments vide footnote (pp) of Statement no.16 of Finance Accounts 2009-10. 18 Difference of ` six crore with reference to previous year’s closing balance was on account of
pro forma adjustments vide footnote (Z) of Statement no.16 of Finance Accounts 2011-12. 19 Difference of `10 crore with reference to previous year’s closing balance was on account of
pro forma adjustments vide footnote (q) of Statement no.16 of Finance Accounts 2012-13.

Audit Report (State Finances) for the year ended 31 March 2013
38
Quantum of Loans/Interest
Receipts/Cost of Borrowings 2008-09 2009-10 2010-11 2011-12 2012-13
Closing balance 7228 7749 8467 9404 10456
Net addition 948 839 718 943 1062
Interest receipts 48 46 44 23 19
Source: Finance Accounts of the State Government.
The total outstanding loans and advances as on 31 March 2013 increased by
`1,062 crore compared to those of the previous year. The major disbursement of
loans during the current year was mainly to the Kerala State Housing Board
for the settlement of dues with Housing Development Finance Corporation (`265
crore), to the Kerala Water Authority for implementing the Water Supply Project
assisted by the Japan International Co-operation Agency (`257 crore) and to the
Kerala State Road Transport Corporation (`175 crore). Interest received against
these loans remained less than one per cent during the period 2008-09 to 2012-13
and was 0.2 per cent during 2012-13 as against the cost of borrowing of 7.1 per
cent during the year.
1.9.4.1 Defaulters on loan repayment
Government has been providing loan assistance to Statutory Corporations,
Government Companies, Autonomous Bodies/Authorities etc., and the same was
treated as assets in the Government accounts. As per Finance Accounts,
outstanding balance at end of March 2013 was `10,456.93 crore. Though the
institutions/organizations have the liability to repay the loan in stipulated
installments, they have defaulted in this regard and arrears in repayment at the end
March 2013 from 68 institutions/organizations was `6,382.47 crore (Principal:
`3,745.87 crore and Interest : `2,636.60 crore). More than 83 per cent of the
above arrears pertains to four institutions/organizations viz. Kerala Water
Authority (`2,922.55 crore), Kerala State Electricity Board (`1,536.21 crore),
Kerala State Road Transport Corporation (`459.97 crore) and Kerala State
Cashew Development Corporation (`395.32 crore). In spite of this arrears in
repayment, `771.83 crore was released to 18 institutions/organizations (defaulted
loanees) during the current year, from whom repayment of earlier loans are in
arrears. This includes Kerala State Housing Board (`267.59 crore), Kerala Water
Authority (`256.91 crore) and Kerala State Road Transport Corporation (`175
crore).
It was also observed that State Government released 81 loans to 19 institutions/
organizations amounting to `939.42 crore, during the period from 1990-91 to
2009-10, without specifying the terms and conditions for repayment. In order to
provide a true and fair status to the balance sheet of the State Government,
Government needs to take effective steps to reduce these non-performing assets.

Chapter I – Finances of the State Government
39
1.9.5 Cash Balances and investment of cash balances
The cash balances and investments made by the State Government out of the cash
balances during the year are shown in Table 1.29.
Table 1.29: Cash balances and investment of cash balances (` in crore)
Particulars As on 31
March 2012
As on 31
March 2013
Increase/
Decrease(-)
Cash balances 3793.46 4692.73 899.27
Investments from cash balances (a + b) 2709.85 3201.71 491.86
a. GOI Treasury Bills 2702.62 3194.48 491.86
b. GOI Securities 7.23 7.23 …
Fund-wise break-up of investments
from earmarked balances (a to d) 1608.50 1402.19 (-)206.31
a. Reserve funds bearing interest … …
b. Reserve funds not bearing interest 1608.50 1402.19 (-)206.31
c. Deposit bearing interest … …
d. Deposit not bearing interest … …
Interest realised during the year on
investment of cash balances 82.38 123.38 41.00
Source: Finance Accounts of the State Government
The cash balance as on 31 March 2013 increased by `899.27 crore over
the previous year.
The interest received during the year on investment of cash balances also
increased by `41 crore as compared to the previous year.
1.9.5.1 Outstanding balances under the head ‘Cheques and Bills’
This head is an intermediary accounting head for initial record of transactions
which are to be cleared eventually. As per accounting rules, when a cheque is
issued, the functional head is debited and the Major Head-8670-Cheques and Bills
is credited. On clearance of the cheque by the bank, the minus credit is given to
Major Head 8670-Cheques and Bills by crediting the Major Head- 8675-Deposits
with Reserve Bank and thereby reducing the cash balance of the Government.
Thus, the outstanding balance under the Major Head 8670-Cheques and Bills
represents the amount of uncashed cheques.
As on 31 March 2013, there was an outstanding balance (cumulative) of
`2,340.88 crore and to this extent, the Government cash balance stood overstated.
1.10 Assets and Liabilities
1.10.1 Growth and composition of assets and liabilities
In the existing Government accounting system, comprehensive accounting of
fixed assets like land and buildings owned by the Government is not done.
However, the Government accounts do capture the financial liabilities of the

Audit Report (State Finances) for the year ended 31 March 2013
40
Government and the assets created out of the expenditure incurred. Appendix 1.4
gives an abstract of such liabilities and assets as on 31 March 2013, compared
with the corresponding position as on 31 March 2012. While the liabilities in this
Appendix consist mainly of internal borrowings, loans and advances from GOI,
receipts from the Public Account and Reserve Funds, the assets mainly comprise
the capital outlay and loans and advances given by the State Government and its
cash balances.
According to the definition given in the Kerala Fiscal Responsibility Act, 2003,
total liabilities mean liabilities upon the Consolidated Fund and the Public
Account of the State. The ratio of financial liabilities vis-à-vis assets, indicates
that 60 per cent of liabilities are without any backup due to unbridled increasing
revenue expenditure.
1.10.2 Fiscal liabilities
The trends of outstanding fiscal liabilities of the State are presented in Appendix
1.5. The composition of fiscal liabilities during the current year vis-à-vis the
previous year is presented in Charts 1.11.
The overall fiscal liabilities of the State increased from `93,132 crore in
2011-12 to `1,08,477 crore in 2012-13, a growth rate of 16 per cent. Fiscal
liabilities of the State comprised Consolidated Fund liabilities and Public Account
liabilities. As at the end of March 2013, the Consolidated Fund liabilities
(`72,250 crore) comprised Market Loans (`48,810 crore), Loans from the
Government of India (`6,622 crore) and Other Loans (`16,818 crore). The Public
Account liabilities (`36,227 crore) comprised Small Savings, Provident Funds,
0 20000 40000 60000 80000 100000 120000
Public Account
Internal Debt
Loans and Advances
Total Liability
31339
55397
6396
93132
36227
65628
6622
108477
Chart 1.11 : Composition of Fiscal Liabilities (` in crore)
As on 31 March 2013 As on 1 April 2012

Chapter I – Finances of the State Government
41
etc., (`31,311 crore)20, interest bearing obligations (`112 crore) and non-interest
bearing obligations like Deposits and other earmarked funds (`4,804 crore). The
fiscal liabilities which were 29.521 per cent of GSDP in 2011-12 increased to 29.9
per cent of GSDP in 2012-13. As in the previous year, fiscal liabilities stood at
2.5 times the revenue receipts. As per the Kerala Fiscal Responsibility
(Amendment) Act, 2011 the State has to reduce the State’s total debt liabilities to
29.8 per cent of the estimated GSDP within a period of four years commencing
on the 1 April 2011 and ending with the 31 March 2015 by reducing the total debt
liability in the years of 2011-12, 2012-13, 2013-14 and 2014-15 to the order of
32.3 per cent, 31.7 per cent, 30.7 per cent and 29.8 per cent respectively of the
gross state domestic product. During 2012-13 the percentage of State’s fiscal
liabilities to GSDP (29.9) was much better than the target (31.7) fixed in the
Kerala Fiscal Responsibility (Amendment) Act, 2011.
The overall liabilities of the State include balance under Reserve Funds
amounting to `1803.14 crore (as on 31 March 2013). The details in respect of two
of the reserve funds are given in succeeding paragraphs:
(a) State Disaster Response Fund
The State Disaster Response Fund (SDRF) has been set up from 1 April 2010
replacing the existing Calamity Relief Fund. At the beginning of the year there
was `44.48 crore as opening balance in the Fund. The size of the Fund for Kerala
for the year 2012-13 fixed by the ThFC was `144.51 crore, 75 per cent (`108.38
crore) of which was to be contributed by the Central Government and 25 per cent
(`36.13 crore) by the State Government. During the year the Government of
India contributed `100.6822 crore and the State Government contributed its
matching contribution (25 per cent). In addition to the yearly contribution the
State Government had received an amount of `109.69 crore from National
Disaster Response Fund (March 2012) towards relief on account of
Flood/Landslide of 2011 which has been credited to the Fund during 2012-13.
After setting off the expenditure for disaster relief operations (`176.21 crore), the
balance in SDRF as on 31 March 2013 was `112.20 crore.
According to the guidelines issued by the Government of India, the accretions to
SDRF were to be invested in Central Government dated securities and/or
Auctioned Treasury Bills and/or interest earning deposits and Certificates of
deposits with Scheduled Commercial Banks. However, no such investments were
made by the State Government so far.
20 This includes liabilities from the Treasury Savings Bank Account (`6,876 crore ) and Treasury
Fixed Deposits (`5,992 crore). 21 Change in figure is due to adoption of new series of GSDP figures. 22 Balance contribution of `7.70 crore was received in April 2013.

Audit Report (State Finances) for the year ended 31 March 2013
42
(b) Consolidated Sinking Fund
The State Government had set up a Consolidated Sinking Fund from the financial
year 2007-08, according to which the Fund was to be utilised as an Amortisation
Fund for redemption of all outstanding liabilities of the Government commencing
from the financial year 2012-13. The Fund was to be credited with contributions
from revenue at the prescribed rate and interest accrued on investments made out
of the Fund. Only the interest accrued and credited in the Fund was to be utilised
for redemption of the outstanding liabilities of the Government. As per paragraph
5 of revised model scheme for the constitution and administration of Consolidated
Sinking Fund of Kerala, the rate of contribution to the Consolidated Sinking Fund
was 0.5 per cent of the outstanding liabilities as at the end of the previous year.
According to this, the State Government had to contribute ` 465.66 crore during
2012-13 to the Consolidated Sinking Fund. However, the State Government has
not contributed any amount to the Fund, during the current year.
During 2012-13, an amount of `340.05 crore was utilized (from the interest
receipts of re-investment of accretion in the fund) during the year for repayment
of loans availed from National Co-operative Development Corporation and Life
Insurance Corporation of India. The balance outstanding in the Sinking Fund as
on 31 March 2013 was `1,387.63 crore.
1.10.3 Status of guarantees – contingent liabilities
Guarantees are liabilities contingent on the Consolidated Fund of the State in
cases of default by borrowers for whom the guarantees have been extended.
Section 3 of the Kerala Ceiling on Government Guarantees Act, 2003 which came
into effect on 5 December 2003 stipulates that the total outstanding Government
Guarantees as on the first day of April every year shall not exceed `14,000 crore.
As per Section 6 of the Act, the Government was to constitute a Guarantee
Redemption Fund. The guarantee commission charged under Section 5 of the Act
was to form the corpus of the Fund. However, the Fund had not been constituted
and consequently, guarantee commission of `510.28 crore collected during
2003-04 to 2012-13 had not been credited to the Fund but was treated as non-tax
revenue in the relevant years and used for meeting the revenue expenditure of the
Government.
The maximum amount for which guarantees were given by the State and
outstanding guarantees at the end of the year since 2008-09 are given in
Table 1.30.

Chapter I – Finances of the State Government
43
Table 1.30: Guarantees given by the Government of Kerala (` in crore)
Guarantees 2008-09 2009-10 2010-11 2011-12 2012-13
Maximum amount guaranteed 11,385.54 10,225.78 12,625.07 11332.11 11482.25
Outstanding amount of guarantees 7,603.32 7,495.00 7,425.79 8277.44 9099.50
Percentage of maximum amount
guaranteed to total revenue receipts 46 39 41 30 26
Criteria as per Kerala Ceiling on
Government Guarantees Act, 2003
(Outstanding amount of guarantees
as on the first day of April)
14,000 14,000 14,000 14,000 14000
Source: Finance Accounts of the State Government
The outstanding guarantees at the end of the past five years i.e. 2008-13 ranged
between `7,426 crore and `9,099 crore, which were well within the ceiling
prescribed by the Kerala Ceiling on Government Guarantees Act.
The State Government guaranteed payment of minimum dividend of 3.5 per cent
on the share capital up to `10 crore and 7.5 per cent on the share capital beyond
`10 crore in respect of Kerala Financial Corporation. The total payment made by
Government towards subvention to the Kerala Financial Corporation was `2.52
crore of which `0.002 crore only has been received (March 2013).
During the year an amount of `35.75 crore was received as guarantee commission
and `159.89 crore was due as arrears in this regard as of March 2013.
1.11 Debt Sustainability
Apart from the magnitude of debt of the State Government, it is important to
analyse various indicators that determine the debt sustainability23of the State. This
section assesses the sustainability of debt of the State Government in terms of
debt stabilisation24; sufficiency of non-debt receipts25; net availability of
23 Debt sustainability is defined as the ability of the State to maintain a constant debt-GDP ratio
over a period of time and also embodies the concern about the ability to service its debt.
Sustainability of debt, therefore, also refers to sufficiency of liquid assets to meet current or
committed obligations and the capacity to keep a balance between costs of additional
borrowings with returns from such borrowings. It means that the rise in fiscal deficits should
match the increase in the capacity to service the debts. 24 A necessary condition for stability states that if the rate of growth of the economy exceeds the
interest rate or the cost of public borrowings, the debt-GSDP ratio is likely to be stable provided
primary balances are either zero or positive or are moderately negative. Given the rate spread
(GSDP growth rate – interest rate) and quantum spread (Debt x Interest spread), the debt
sustainability condition states that if the quantum spread together with the primary deficit is
zero, the debt-GSDP ratio would be constant or that debt would stabilize eventually. On the
other hand, if the primary deficit together with the quantum spread turns out to be negative, the
debt-GSDP ratio would be rising. In case it is positive, the debt-GSDP ratio would eventually be
falling, which is a positive sign. 25 Adequacy of incremental non-debt receipts of the State to cover the incremental interest
liabilities and incremental primary expenditure. The debt sustainability could be significantly
facilitated if the incremental non-debt receipts could meet the incremental interest burden and
the incremental primary expenditure.

Audit Report (State Finances) for the year ended 31 March 2013
44
borrowed funds26; burden of interest payments (measured by interest payments to
revenue receipts ratio) and the maturity profile of State Government securities.
Table 1.31 analyses the debt sustainability of the State according to these
indicators for the period of five years beginning from 2008-09.
Table 1.31: Debt sustainability: indicators and trends (` in crore)
Indicators of Debt
Sustainability 2008-09 2009-10 2010-11 2011-12 2012-13
Debt Stabilisation (Quantum
Spread27 + Primary Deficit) 3136(*) 1981(*) 4565(*) 1556(*) (-)160
Sufficiency of Non-debt
Receipts (Resource Gap) (-) 247 (-) 1,525 141 (-)5,084 (-)2187
Net Availability of Borrowed
Funds 3,334 2,834 2,507 4,426 8154
Burden of Interest Payments
(Interest Payment/Revenue
Receipts per cent)
19 20 18 17 16
Maturity Profile of debt
Up to one year 1.59 1587.67
(3.2)
2566.98
(4.7)
2154.64
(3.5)
2569.25
(3.6)
One to three years 5852.42
(13.1)
4503.59
(9.1)
5205.33
(9.5)
8401.13
(13.6)
5791.05
(8.0)
Three to five years 5349.27
(11.9)
5215.70
(10.5)
6260.17
(11.4)
9100.09
(14.7)
9100.72
(12.6)
Five to seven years 6241.10
(13.9)
6786.36
(13.7)
9314.78
(17.0)
13156.00
(21.3)
13181.39
(18.2)
Seven years and above 26576.50
(59.3)
27363.90
(55.1)
28162.37
(51.3)
24240.81
(39.2)
36932.83
(51.1)
Maturity profile details not
furnished by State Government
801.97
(1.8)
4216.09
(8.4)
3377.55
(6.1)
4740.42
(7.7)
4674.95
(6.5) Figures in parentheses indicate the percentage to total State debt
Source: Finance Accounts of the State Government
(*) change in figure is due to adoption of new series of GSDP figures
During 2008-09 to 2010-11, the quantum spread together with primary deficit was
positive and increased from `3,136 crore to `4,565 crore (though decreased to
`1,981 crore in 2009-10) indicating a declining trend in Debt-GSDP ratio.
However, it decreased steadily from 2010-11 to 2012-13 and became negative in
2012-13 showing rising trend of Debt-GSDP ratio. The resource gap (sufficiency
of non-debt receipts) was negative during the period 2008-13 (except during
2010-11) which showed that the incremental non-debt receipts were inadequate to
finance incremental primary expenditure and incremental interest burden.
26 Defined as the ratio of debt redemption (Principal + Interest Payments) to total debt receipts and
indicates the extent to which the debt receipts are used in debt redemption indicating the net
availability of borrowed funds. 27 Quantum spread = Debt x Interest spread.

Chapter I – Finances of the State Government
45
During 2012-13, total borrowed funds under ‘Public Debt’ was `13,261 crore
(including open market borrowings of `11,583 crore). After providing for interest
and repayment of principal, the net availability was only `5,204 crore. Similarly,
the accumulations in ‘Public Account’ (Small savings, Provident Fund, Reserve
Fund, Deposit Account, etc. which were used by the State for bridging the fiscal
resource gap), were `32,853 crore during the year. Under this sector, net
availability of funds after disbursement with interest was only `2,950 crore. As
the non-debt receipt of the State was also insufficient, some portion of this
borrowing was also used for bridging revenue deficit. Consequently, State
Government was left with `8,154 crore, for developmental activities from the
total borrowings.
The maturity profile of State debt indicates that the Government will have to
repay 42.4 per cent of its debt between one and seven years. A well thought out
debt management strategy will ensure that no additional borrowings which mature
in these critical years are undertaken.
1.12 A Study on Market Borrowings of the State
1.12.1 Introduction
Governments resort to borrowing when the resources available are insufficient to
meet their commitments. Open Market Borrowing (OMB) is one of the preferred
sources of borrowing as it provides attractive terms and is flexible enough to meet
Government’s requirement over a longer term and when there is strong demand
for Government securities in the market.
State Governments are empowered to borrow funds from various sources under
the provisions of Article 293 of the Constitution of India, subject to any statutory
limits prescribed by State Governments. No such statutory limit has been
prescribed in Kerala so far. The only restriction for the State is that it requires
permission of the Government of India (GOI) for its borrowings under the
provisions of Article 293(3) of the Constitution.
The study on OMB was conducted to assess:
the efficiency of the State Government in assessing resource requirements
before resorting to open market borrowing;
effectiveness in utilisation of borrowed funds; and
debt sustainability status of the State Government.
1.12.2 Borrowing process
The resources required and the size for annual plans are determined by the State
Government and submitted to the Planning Commission for approval. The
proposal includes estimated requirement of market borrowing also, as it is one of
the major sources for financing the plan expenditure. Once the Planning
Commission approves the Plan size and associated borrowings, proposal for
market borrowings and borrowings from Financial Institutions (FIs) are sent to

Audit Report (State Finances) for the year ended 31 March 2013
46
Ministry of Finance, GOI for their approval. For the funds to be raised from the
market, Finance Department of Government of Kerala prepares a borrowing
schedule (months in which funds are required) and the funds are arranged through
the Reserve Bank of India (RBI), on the dates decided by RBI in consultation
with the State Government. Before raising each tranche of loan from the market,
the State Government has to obtain sanction from Ministry of Finance (GOI) for
raising the loan. The borrowing is carried out in a phased manner throughout the
year based on actual requirement of funds and market conditions. The method of
issuance of market loans has, however, migrated from the administratively
controlled system to an auction based system28 for all the states since 2006-07. A
uniform 10 year period is followed for all the market loans taken by State
Government, without any call option.
1.12.3 Untimely borrowings leading to surplus cash balance
As per the agreement with Reserve Bank of India, the State Government has to
maintain a minimum cash balance of `1.66 crore with the Bank. If the balance
falls below the agreed minimum on any day, the deficiency is made good by
taking ordinary and special ways and means advances/overdrafts from time to
time. On any day, if the cash balance is found in excess of the stipulated
minimum, excess cash balance will be invested by Reserve Bank in Government
of India securities (short/long term Treasury Bills) under the directions of the
State Government.
Open market borrowings of the State Government made through Reserve Bank of
India are invested in 14-day Treasury Bills on the subsequent day of auction, if
the cash balance of the State is found to be in excess of the stipulated minimum.
Audit scrutiny of daily statement of cash balances maintained in Finance
Department revealed that funds borrowed from the market at higher interest were
retained in low interest bearing Treasury Bills for long periods, indicating
improper assessment of need to borrow. A few instances noticed during the
scrutiny of daily balance statements for the period from 2010-11 to 2012-13 are
given below:
State Government had raised an amount of `1000 crore from open market
on 16 March 2011 at an interest rate of 8.36 per cent when there was cash
balance investment in 14-day Treasury Bills (interest five per cent) in
excess of `3000 crore. It was also noticed that, during the period up to the
next borrowing on 24 August 2011 the balance in Treasury Bills was less
than `1000 crore only on nine days. Replying to audit observation,
Principal Secretary (Finance) stated that, as the Government departments
have the tendency to withdraw huge amounts during the fag end of the
financial year, the accumulations in the Treasury Bills would drain out
before the end of April. However, in the above instance there were more
28 In administratively controlled system, rate of the interest of the State Development Loan is fixed
by the State Government, whereas in auction based system it is as per the offer of the investor.
Chapter I – Finances of the State Government
47
than `1000 crore lying in Treasury Bills for a substantial period even after
April.
Government have raised `1000 crore (8.85 per cent), `2000 crore (8.92
per cent), `1000 crore (8.80 per cent), `1000 crore (8.93 per cent) and
`850 crore (8.93 per cent) on 18 July 2012, 8 August 2012, 25 October
2012, 21 November 2012 and 19 December 2012 respectively. While
making all the above borrowings the State had more than `1000 crore
invested in Treasury Bills29. Principal Secretary stated that State
Government opted to borrow in batches instead of bulk borrowing. This
was done to avail loan with lower interest rate. However, the fact remains
that while staggering the borrowings, the Government could have
considered the balance available in the Treasury Bills as well as actual
requirement of funds, to avoid accumulation of high cost borrowing in
low-interest earning deposits.
The State Government had borrowed `2500 crore in January 2013 (`1000
crore on 9 January 2013 and `1500 crore on 23 January 2013). After these
borrowings, the balance in the Treasury Bills shot up to more than `3500
crore and remained at this high level till the end of March 2013. The
Principal Secretary stated that going for OMB at the end of the year
proves costly as there is heavy demand from all the other States for market
borrowing. This leads to interest rate going up. However, if the
borrowings are made for meeting the future requirements, Government
could have invested the surplus cash in long term securities. As this was
not done to optimize interest burden, the action of the State Government in
undertaking borrowings when substantial amounts were already invested
in Treasury Bills, was injudicious.
The above cited instances point towards the need for a more efficient and well-
thought out plan to streamline the borrowing schedules and subsequent fund
management to optimize the interest burden of the Government.
1.12.4 Market borrowing component in Public Debt
The Public Debt of the State consists of market borrowings, loans and advances
from Government of India and loans from other financial institutions like Life
Insurance Corporation of India, General Insurance Corporation, National Bank for
Agriculture and Rural Development, National Co-operative Development
Corporation, etc. Following the recommendations of the Twelfth Finance
Commission, the Central Government dis-intermediated State Government
borrowing from 2005-06 onwards, resulting in sharp decline in the inflows of
loans from the Centre in the subsequent years. Loans from the National Small
Savings Fund which formed a substantial source of the funding between 2003-04
and 2006-07, declined substantially thereafter. Consequently, there has been
significant increase in market loans raised by the State Government from 2007-08
29 Interest on Treasury Bills investment is five per cent.

Audit Report (State Finances) for the year ended 31 March 2013
48
onwards to finance its developmental activities. The share of market borrowing in
Public Debt increased significantly during the last five years as shown below:
Table 1.32: Share of market borrowing in Public Debt
(` in crore)
Year Market
Borrowing(MB)
Weighted
average interest
Public Debt30
(PD)
Percentage of
MB in PD
2008-09 5516 7.70 6921 79.70
2009-10 5456 8.22 6616 82.47
2010-11 5500 8.42 7189 76.51
2011-12 8880 8.81 9799 90.62
2012-13 11583 8.85 13261 87.35 Source : Finance Accounts for respective years
It was observed that:
During the five year period, substantial increase was noticed in the share
of market loan component in public debt (ranged between 76 and 90 per
cent) indicating State’s over dependence on open market borrowing. In
2003-04, this was only 27.62 per cent, thus showing more than three times
increase in the share of market loan during the last 10 year period.
Since the rate of interest and subscription by Financial Institutions depend
on market conditions including liquidity, dependence on a single source
for its financial requirements is fraught with the risk of non-availability of
funds at advantageous rates at the required time due to possible adverse
financial conditions in the market. It was noted that the weighted average
interest rate on market loans has shown an increasing trend over the years,
mainly due to increased dependence on market borrowing by the state
governments.
Over the years, net accretions to National Small Savings Fund (NSSF)
have come down and this has resulted in reduced availability of loan to the
State Government from NSSF. Consequently, the State Government had
opted for additional open market borrowing, in lieu of the shortfall under
NSSF.
1.12.5 Investment of Borrowed funds
Generally, borrowed funds are to be utilized for creation of capital assets as the
revenue generated from these assets are to be utilized for servicing of the debt.
Notification specifying the auction for open market loans disclosed the objective
of the loan as ‘loan for development activities of the State’. However, the State
Government has not raised any open market loan during the last five years for any
specific project.
Prudent financial management requires utilisation of borrowed funds for
generating income sufficient at least to meet the interest payments on the debt. In
30 Receipts under Major heads 6003 and 6004

Chapter I – Finances of the State Government
49
the State, only a small portion of the annual borrowing of market loans were
invested in such assets like investments in PSUs and loans to various bodies as
shown in the Table 1.33:
Table 1.33: Investment of borrowed funds in revenue generating assets
(` in crore)
Year Market
Borrowing
Investment in revenue
generating assets Percentage of total
investment to
Market borrowing Share
capital Loan Total
2008-09 5516 279 984 1263 22.90
2009-10 5456 187 877 1064 19.50
2010-11 5500 504 762 1266 23.02
2011-12 8880 409 998 1407 15.84
2012-13 11583 309 1136 1445 12.48
Total 36935 1688 4757 6445 17.45 Source : Finance Accounts and Audit Report on State Finances for respective years
It was also seen that the income earned by way of dividend and interest on the
investments including loans made out of the borrowed funds was insignificant
compared to the interest liability of the state on the borrowed funds as shown in
the Table 1.34:
Table 1.34: Return on investments from revenue generating assets
(` in crore)
Year
Outstanding
Market
Borrowings
Interest paid
on market
borrowings
Return on investment
Dividend Loan+
interest
Total
2008-09 21263 1383 34 84 118 (9)*
2009-10 25973 1722 27 84 111 (6)
2010-11 30744 2007 75 88 163 (8)
2011-12 38239 2485 67 78 145 (6)
2012-13 48810 3296 48 93 141 (4)
Total 10893 251 427 678 (6) * Figures in brackets are percentage w.r.t to total interest paid on market borrowings
Source : Finance Accounts and Audit Report on State Finances for respective years
Audit scrutiny revealed the following:-
During the last five years, the State Government had received only
`678 crore as dividend/interest on loan against `10,893 crore paid as
interest on funds borrowed from open market. Thus, State’s revenue
generation out of investment of borrowed funds was only six per cent of
its liability towards open market loan, indicating that the bulk of borrowed
funds did not generate any income for servicing the debt.
During 2008-13, out of the `4851.62 crore (loan: `3912.57 crore and
Investment: `939.05 crore) released/made as loan/investment to State
owned PSUs, `1222.41 crore (loan: `1014.11 crore and Investment:
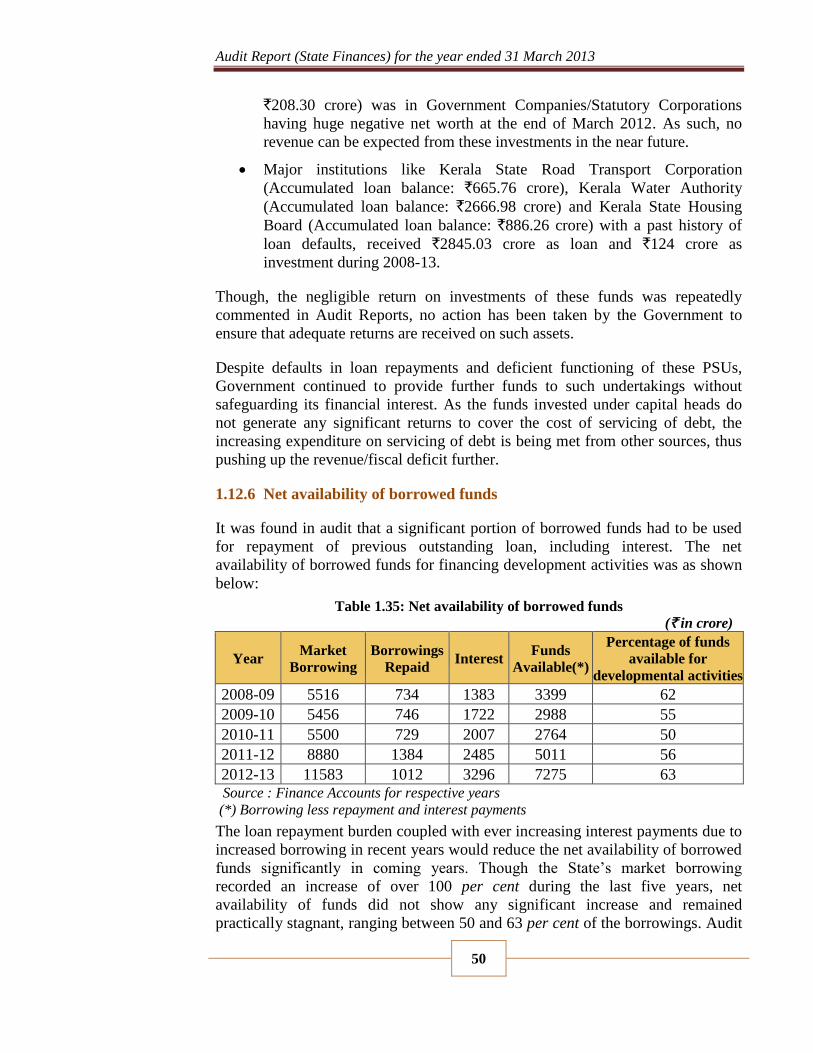
Audit Report (State Finances) for the year ended 31 March 2013
50
`208.30 crore) was in Government Companies/Statutory Corporations
having huge negative net worth at the end of March 2012. As such, no
revenue can be expected from these investments in the near future.
Major institutions like Kerala State Road Transport Corporation
(Accumulated loan balance: `665.76 crore), Kerala Water Authority
(Accumulated loan balance: `2666.98 crore) and Kerala State Housing
Board (Accumulated loan balance: `886.26 crore) with a past history of
loan defaults, received `2845.03 crore as loan and `124 crore as
investment during 2008-13.
Though, the negligible return on investments of these funds was repeatedly
commented in Audit Reports, no action has been taken by the Government to
ensure that adequate returns are received on such assets.
Despite defaults in loan repayments and deficient functioning of these PSUs,
Government continued to provide further funds to such undertakings without
safeguarding its financial interest. As the funds invested under capital heads do
not generate any significant returns to cover the cost of servicing of debt, the
increasing expenditure on servicing of debt is being met from other sources, thus
pushing up the revenue/fiscal deficit further.
1.12.6 Net availability of borrowed funds
It was found in audit that a significant portion of borrowed funds had to be used
for repayment of previous outstanding loan, including interest. The net
availability of borrowed funds for financing development activities was as shown
below:
Table 1.35: Net availability of borrowed funds
(` in crore)
Year Market
Borrowing
Borrowings
Repaid Interest
Funds
Available(*)
Percentage of funds
available for
developmental activities
2008-09 5516 734 1383 3399 62
2009-10 5456 746 1722 2988 55
2010-11 5500 729 2007 2764 50
2011-12 8880 1384 2485 5011 56
2012-13 11583 1012 3296 7275 63 Source : Finance Accounts for respective years
(*) Borrowing less repayment and interest payments
The loan repayment burden coupled with ever increasing interest payments due to
increased borrowing in recent years would reduce the net availability of borrowed
funds significantly in coming years. Though the State’s market borrowing
recorded an increase of over 100 per cent during the last five years, net
availability of funds did not show any significant increase and remained
practically stagnant, ranging between 50 and 63 per cent of the borrowings. Audit

Chapter I – Finances of the State Government
51
observed that substantial portion of the borrowed funds are being used for
financing revenue deficit/servicing of debt, instead of being invested in
development activities. Principal Secretary stated that increasing Revenue deficit
is a concern for the State and this situation is a result of increasing non-plan
revenue expenditure coupled with average growth in revenue receipts.
1.12.7 Maturity profile of Open Market Borrowing – fiscal pressure on the
State from 2017-18
Open market borrowings of the State increased considerably after 2007-08. As
these loans are taken for a maturity period of 10 years, repayment would start
from 2017-18 onwards. Maturity profile of the open market borrowings
outstanding as on 31 March 2013 for the next 10 years is given below:
Table 1.36: Maturity profile of market borrowings
Maturity Period Amount going to
mature (` in crore)
Percentage of
total loan
Upto one year 1426 3
One to three years 3538 7
Three to Five years 6911 14
Above Five years 36935 76
Total 48810 100 Source : Compiled from Finance Accounts
The huge annual repayments becoming due from 2018-19 onwards is likely to put
considerable fiscal pressure on the resources of the State. This points towards the
need for effective action to raise additional resource through revenue generation,
reduce revenue/fiscal deficit and thus contain the ever increasing debt to
manageable limits. The Principal Secretary stated that as long as the Gross State
Domestic Product (GSDP) grows, the debts can easily be repaid. It would become
a threat only if the economy slows down. However, as things stand today, the
huge annual repayment from 2018-19 would pose a serious threat to the annual
fiscal situation unless the economic growth as envisaged is sustained.
1.12.8 Fiscal sustainability indicators
(i) Debt-GSDP ratio
The Debt-GSDP ratio represents the final outcome of all the budgetary
transactions, particularly the borrowings contracted to finance fiscal deficits over
the years, and is an important indicator of required fiscal correction. Ratio of
fiscal liability to GSDP showed a declining trend during 2008-12. However,
during 2012-13, it was increased to 29.9 per cent from 29.5 per cent in the
previous year. Trend in Debt-GSDP ratio, during the last five years is shown in
Chart 1.12.

Audit Report (State Finances) for the year ended 31 March 2013
52
Chart 1.12: Debt-GSDP ratio comparison
(ii) Growth rate of GSDP and Debt
One of the indicators of debt sustainability is that growth rate of debt should be
less than the nominal growth rate of GSDP. It was observed that State’s debt
showed lesser growth rate than that of GSDP during the first four years. However,
during 2012-13 it was higher than GSDP growth as shown below;
Chart 1.13: Growth of GSDP and Debt (` in crore)
Year Debt and
its Growth
GSDP
and its
Growth
2008-09 66097
(13.75)
202783
(15.78)
2009-10 74223
(12.29)
231999
(14.41)
2010-11 82420
(11.04)
269474
(16.15)
2011-12 93132
(13.00)
315206
(16.97)
2012-13 108477
(16.48)
363305
(15.26)
(iii) Interest payments to GSDP
Expected behaviour of this indicator is that it should decline over a period time. In
such a situation, debt liability of the State is considered at a manageable level.
Ratio of interest payments to GSDP showed a declining trend during the last five
years as shown below:
32.632
30.6
29.529.9
30
33.2 32.832.3
31.7
27
28
29
30
31
32
33
34
2008-09 2009-10 2010-11 2011-12 2012-13
State's position FC projection
15.78
14.41
16.1516.97
15.26
13.75
12.29
11.04
13.00
16.48
10.00
12.00
14.00
16.00
18.00
2008-09 2009-10 2010-11 2011-12 2012-13
in p
erc
en
tage
GSDP growth Debt growth

Chapter I – Finances of the State Government
53
Chart 1.14: Interest payments (IP) to GSDP
(` in crore)
Year IP GSDP IP/
GSDP
2008-09 4660 202783 2.30
2009-10 5292 231999 2.28
2010-11 5690 269474 2.11
2011-12 6294 315206 2.0
2012-13 7205 363305 1.98
(iv) Interest payments to Revenue Expenditure and Revenue Receipts
Burden of interest payments will increase with more and more borrowing.
However, comparatively less growth rate of interest payments (when compared
with Revenue Expenditure and Revenue Receipts) indicates better debt
sustainability path for the State. Percentages of interest payments with reference
to Revenue Expenditure and Revenue Receipts over a period of five years ending
2012-13 are given in Charts 1.15 and 1.16 respectively.
Chart 1.15: Interest payments (IP) to Revenue Expenditure(RE)
(` in crore)
Year IP RE IP/RE
2008-09 4660 28224 16.51
2009-10 5292 31132 17.0
2010-11 5690 34665 16.41
2011-12 6294 46045 13.67
2012-13 7205 53489 13.47
2.30 2.28
2.11
2.00 1.98
1.80
1.90
2.00
2.10
2.20
2.30
2.40
2008-09 2009-10 2010-11 2011-12 2012-13
IP/GSDP
16.5117.00
16.41
13.67 13.47
10.00
11.00
12.00
13.00
14.00
15.00
16.00
17.00
18.00
2008-09 2009-10 2010-11 2011-12 2012-13
IP/RE
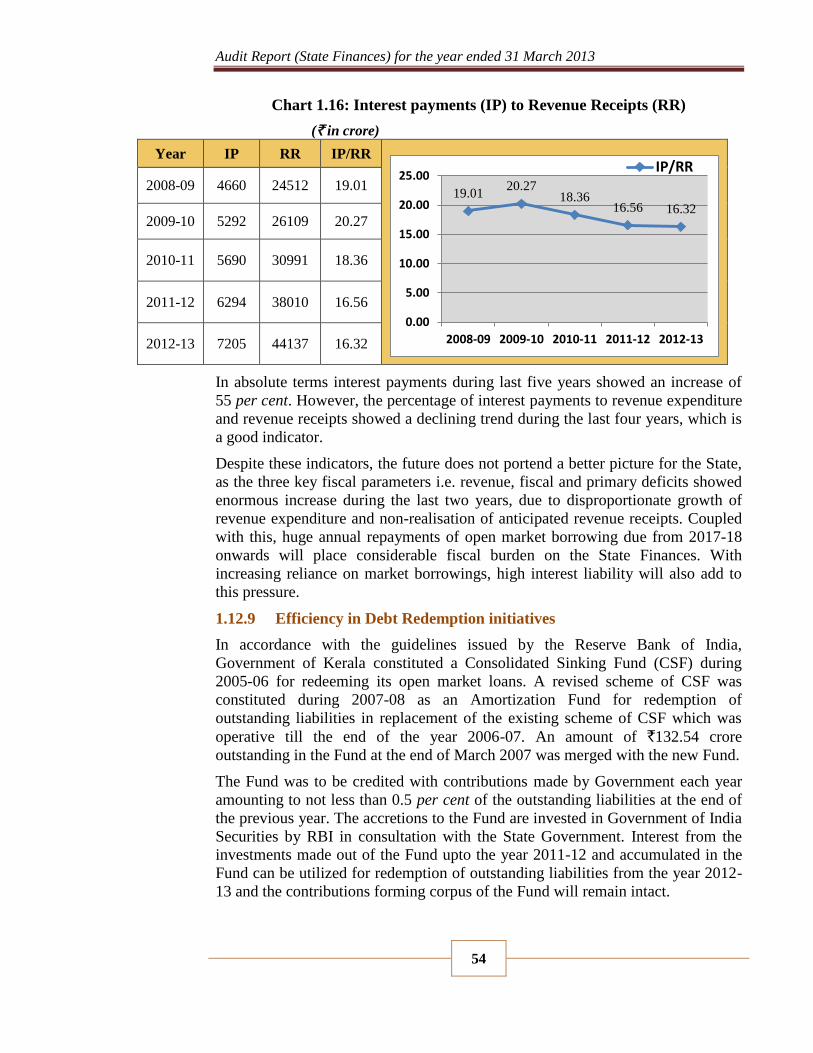
Audit Report (State Finances) for the year ended 31 March 2013
54
Chart 1.16: Interest payments (IP) to Revenue Receipts (RR)
(` in crore)
Year IP RR IP/RR
2008-09 4660 24512 19.01
2009-10 5292 26109 20.27
2010-11 5690 30991 18.36
2011-12 6294 38010 16.56
2012-13 7205 44137 16.32
In absolute terms interest payments during last five years showed an increase of
55 per cent. However, the percentage of interest payments to revenue expenditure
and revenue receipts showed a declining trend during the last four years, which is
a good indicator.
Despite these indicators, the future does not portend a better picture for the State,
as the three key fiscal parameters i.e. revenue, fiscal and primary deficits showed
enormous increase during the last two years, due to disproportionate growth of
revenue expenditure and non-realisation of anticipated revenue receipts. Coupled
with this, huge annual repayments of open market borrowing due from 2017-18
onwards will place considerable fiscal burden on the State Finances. With
increasing reliance on market borrowings, high interest liability will also add to
this pressure.
1.12.9 Efficiency in Debt Redemption initiatives
In accordance with the guidelines issued by the Reserve Bank of India,
Government of Kerala constituted a Consolidated Sinking Fund (CSF) during
2005-06 for redeeming its open market loans. A revised scheme of CSF was
constituted during 2007-08 as an Amortization Fund for redemption of
outstanding liabilities in replacement of the existing scheme of CSF which was
operative till the end of the year 2006-07. An amount of `132.54 crore
outstanding in the Fund at the end of March 2007 was merged with the new Fund.
The Fund was to be credited with contributions made by Government each year
amounting to not less than 0.5 per cent of the outstanding liabilities at the end of
the previous year. The accretions to the Fund are invested in Government of India
Securities by RBI in consultation with the State Government. Interest from the
investments made out of the Fund upto the year 2011-12 and accumulated in the
Fund can be utilized for redemption of outstanding liabilities from the year 2012-
13 and the contributions forming corpus of the Fund will remain intact.
19.0120.27
18.3616.56 16.32
0.00
5.00
10.00
15.00
20.00
25.00
2008-09 2009-10 2010-11 2011-12 2012-13
IP/RR

Chapter I – Finances of the State Government
55
Audit scrutiny revealed the following:-
As per the provisions of the Fund Rules, the State had to contribute an
amount of `1950.84 crore till March 2013. Against this, the contribution
was only `1128.12 crore resulting in a shortfall of `822.72 crore.
Till 2011-12, an amount of `340.68 crore was credited to the Fund as
interest on investments made out of the Fund. Out of this, `340.05 crore
has been utilized during 2012-13, for repayment of loans availed from
NCDC and LIC.
The Fund may not serve the intended purpose at the current rate of contribution as
the interest income generated from the investment of the Fund is too meagre to
meet the repayment liabilities in the coming years. The Principal Secretary stated
that contribution to the Fund is not advisable in the case of Kerala as the State has
to invest in CSF from the Funds Borrowed. The return on Sinking Fund is just
seven per cent, while the interest on borrowings would be minimum nine per
cent, hence a loss of two per cent accrues with every contribution made in the
Fund and, therefore maintaining the fund would not be good economics.
1.12.10 Conclusion
The State Government borrowed `36,935 crore from the open market during the
five year period 2008-09 to 2012-13. Instances of raising open market loans even
when government had substantial investments in short term treasury bills have
been noticed. During the last five years, the State Government could invest only
17 per cent of the market borrowing in revenue generating assets and
Government’s return on this investment was mere six per cent of the total interest
paid on market borrowing during the period. Substantial portion of borrowed
funds were provided as loans or investments in PSUs having negative net worth
with no returns. Despite huge increase in market borrowings, net availability of
the funds for development after meeting the debt servicing obligations did not
show any significant increase. The huge annual repayments becoming due from
2018-19 onwards are likely to put considerable fiscal pressure on the resources of
the State. The Consolidated Sinking Fund constituted in 2005-06 to finance
repayments of the fiscal liabilities from 2012-13 onwards may not serve the
intended purpose in view of the low rate of contribution and shortfall in making
even the prescribed contribution to the Fund.
1.13 Fiscal Imbalances
Three key fiscal parameters - revenue, fiscal and primary deficits - indicate the
extent of overall fiscal imbalances in the finances of the State Government during
a specified period. The deficit in the Government accounts represents the gap
between its receipts and expenditure. The nature of deficit is an indicator of the
prudence of fiscal management of the Government. Further, the ways in which the
deficit is financed and the resources are raised and applied are important pointers
to its fiscal health. This section presents the trends, nature, magnitude and the

Audit Report (State Finances) for the year ended 31 March 2013
56
manner of financing these deficits and also the assessment of actual levels of
revenue and fiscal deficits vis-à-vis targets set under the Fiscal Responsibility
Act/Rules for the financial year 2012-13.
1.13.1 Trends in deficits
Charts 1.17 and 1.18 presents the trends in deficit indicators over the period
2008-13.
-3712
-5023
-3674
-8035
-9352
-6347
-7872 -7731
-12815
-15002
-1687
-2580
-2041
-6521
-7797
-16000
-15000
-14000
-13000
-12000
-11000
-10000
-9000
-8000
-7000
-6000
-5000
-4000
-3000
-2000
-1000
0
1000
2008-09 2009-10 2010-11 2011-12 2012-13
Chart 1.17 : Trends in deficit indicators ( ` in crore)
Revenue Deficit Fiscal Deficit Primary Deficit
-1.8
-2.2
-1.4
-2.5 -2.6
-3.1
-3.4
-2.9
-4.1 -4.1
-0.8
-1.1
-0.8
-2.1 -2.1
-4.5
-4
-3.5
-3
-2.5
-2
-1.5
-1
-0.5
0
0.5
2008-09 2009-10 2010-11 2011-12 2012-13
per
cen
tag
e t
o G
SD
P
Chart 1.18: Trends in deficit indicators relative to GSDP
RD/GSDP FD/GSDP PD/GSDP

Chapter I – Finances of the State Government
57
The revenue deficit of the State which indicates the excess of its revenue
expenditure over revenue receipts showed an increasing trend during the last five
years (except during 2010-11). Revenue deficit of State increased from `3,712
crore in 2008-09 to `9,352 crore in 2012-13.
The fiscal deficit, which represents the total borrowing of the Government and its
total resource gap also increased during the last five years (except during 2010-
11). It increased from `6,347 crore in 2008-09 to `15,002 crore in 2012-13.
During the last five years, more than 4.5 times increase was noticed in the case of
primary deficit and it increased from `1,687 crore in 2008-09 to `7,797 crore in
2012-13. Increase in revenue deficit, fiscal deficit and primary deficit indicate the
disproportionate growth of expenditure with regard to revenue realization.
As a proportion of GSDP, the revenue deficit (1.4 per cent) and fiscal deficit (2.9
per cent) in 2010-11 were the lowest during the last five year period. These
percentages increased to 2.6 per cent and 4.1 per cent respectively in 2012-13.
These were more than the targets fixed (0.89 per cent and 2.74 per cent) in the
Medium Term Fiscal Plan for 2012-13 to 2014-15.
1.13.2 Components of fiscal deficit and its financing pattern
The financing pattern of the fiscal deficit has undergone a compositional shift as
reflected in the Table 1.37. Receipts and disbursements under the components of
financing the fiscal deficit during 2012-13 are given in Table 1.38. Table 1.37: Components of fiscal deficit and its financing pattern
(` in crore)
Particulars 2008-09 2009-10 2010-11 2011-12 2012-13
Decomposition of fiscal deficit
1. Revenue deficit 3712 5023 3674 8035 9352
2. Net capital expenditure 1687 2010 3339 3837 4588
3. Net loans and advances 948 839 718 943 1062
Total fiscal deficit 6347 7872 7731 12815 15002
Financing pattern of fiscal deficit*
1. Market borrowings (net) 4782 4710 4770 7496 10571
2. Loans from Government of India 476 297 54 36 226
3. Special Securities Issued to
National Small Savings Fund (-) 102 (-) 140 42 (-)491 32
4. Loans from Financial Institutions 116 (-) 16 348 (-)7 (-)118
5. Small Savings, PF etc 2589 2849 2490 3839 3686
6. Deposits and Advances 132 437 469 (-)52 1141
7. Suspense and Miscellaneous (-) 85 370 (-) 197 852 712
8. Remittances 23 57 27 (-)157 31
9. Others 72 (-) 31 399 32 (-)379
10. Total (1 to 9) 8003 8533 8402 11548 15902
11. Increase (-)/Decrease (+) in Cash
Balance (-)1656 (-) 661 (-) 671 1267 (-)900
12. Overall deficit 6347 7872 7731 12815 15002 *All these figures are net of disbursements/outflows during the year.
Source: Finance Accounts of the State Government

Audit Report (State Finances) for the year ended 31 March 2013
58
Table 1.38: Receipts and disbursements under components financing the fiscal
deficit during 2012-13
(` in crore)
Sl.
No. Particulars Receipt Disbursement Net
1. Market borrowings 11583 1012 10571
2. Loans from Government of India 552 326 226
3. Special Securities Issued to National Small
Savings Fund 630 598 32
4. Loans from Financial Institutions 410 528 -118
5. Small Savings, PF etc 23821 20135 3686
6. Deposits and Advances 7840 6699 1141
7. Suspense and Miscellaneous 64132 63420 712
8. Remittances 9705 9674 31
9. Others 489 868 -379
10. Total (1 to 9) 119162 103260 15902
11. Increase (-)/Decrease (+) in Cash Balance -900
12. Overall deficit 15002 Source: Finance Accounts of the State Government
Table 1.37 reveals that during the last five years market borrowings and net
accretions in Public Account (especially in Small Savings, PF etc.) are the main
source utilized by the State Government to finance the fiscal deficit. During 2012-
13, ninety five per cent of the fiscal deficit was financed through net Market
borrowings (`10,571 crore) and accretions in the Small Savings, PF, etc. (`3,686
crore).
During 2012-13, the State Government raised `11,583 crore as market loans at an
average interest rate of 8.86 per cent, loans amounting to `410.02 crore from
NABARD at an interest rate of 7.35 per cent and `85.77 crore from NCDC at
interest rates of 12.90 per cent. The State Government also received loans
amounting to `552.30 crore from the Government of India during the year for
which the details of interest rate on all loans were not available.
The State Government has been mobilising deposits from its employees,
pensioners, institutions and general public through treasuries. During
2012-13, the State Government received `16,722.38 crore as deposits through
Treasury Saving Bank accounts at an average interest rate of five per cent and
`1,714.84 crore as Treasury Fixed Deposits at interest rates ranging between 7.25
per cent and 9 per cent. The balance of such deposits as on 31 March 2013 was
`12,868.71 crore.
1.13.3 Quality of deficit/surplus
The ratio of revenue deficit to fiscal deficit and the decomposition of primary
deficit into primary revenue deficit and capital expenditure (including loans and
advances) would indicate the quality of deficit in the States’ finances. The ratio
of revenue deficit to fiscal deficit indicates the extent to which borrowed funds

Chapter I – Finances of the State Government
59
were used for current consumption. Further, persistently high ratios of revenue
deficit to fiscal deficit also indicate that the asset base of the State was
continuously shrinking and a part of the borrowings (fiscal liabilities) did not have
any asset backup. The bifurcation of the primary deficit (Table 1.39) indicates the
extent to which the deficit has been on account of enhancement in capital
expenditure which may be desirable to improve the productive capacity of the
State’s economy.
Table 1.39: Primary deficit/surplus – bifurcation of factors (` in crore)
Year
Non-debt
receipts
(NDR)
Primary
revenue
expenditure
Capital
expenditure
Loans
and
advances
Primary
expenditure
Primary
revenue deficit
(-)/surplus (+)
Primary
deficit (-)/
surplus (+)
1 2 3 4 5 6 (3+4+5) 7 (2-3) 8 (2-6)
2008-09 24,557 23,564 1,696 984 26,244 (+) 993 (-) 1,687
2009-10 26,196 25,840 2,059 877 28,776 (+) 356 (-) 2,580
2010-11 31,060 28,975 3,364 762 33,101 (+) 2,085 (-) 2,041
2011-12 38,081 39,751 3,853 998 44,602 (-) 1,670 (-) 6,521
2012-13 44,226 46,284 4603 1136 52,023 (-) 2,058 (-) 7,797 Source: Finance Accounts of the State Government
The bifurcation of the factors leading to primary deficit or surplus of the State
reveals that during the period from 2008-09 to 2010-11 non-debt receipts (NDR)
of the State were enough to meet the primary revenue expenditure31 of the State.
However, during the last two years NDR was not sufficient to meet the primary
revenue expenditure indicating disproportionate growth of primary revenue
expenditure with respect to NDR.
1.14 Conclusion
Revenue Receipts : During the current year, the State’s Revenue receipts
(`44,137 crore) increased by 16 per cent over the previous year. There was
increase in Tax revenue (`4,358 crore) and Non-tax revenue (`1606 crore) during
the year. Though State’s tax revenue collected (`30,077 crore) during 2012-13
was higher than the normative assessment (`28,356 crore) made by ThFC it was
less than the projections made (`32,122 crore) in Medium Term Fiscal Plan for
the year.
Revenue Expenditure : The revenue expenditure increased by 16 per cent during
the year. Of the total expenditure of `59,228 crore during 2012-13, share of
revenue expenditure was more than 90 per cent (`53,489 crore). More than 65 per
cent of the Revenue expenditure was incurred on salaries, wages, pension
payments, interest payments and subsidies.
31 Primary revenue expenditure represents revenue expenditure less expenditure on interest.

Audit Report (State Finances) for the year ended 31 March 2013
60
Capital Expenditure : During the year Capital expenditure (`4,603 crore)
increased by `750 crore (19 per cent) over the previous year and it accounted for
eight per cent of the total expenditure of the State. However, proportion of Capital
expenditure was much lower as compared to General Category States.
Investment and returns : As of 31 March 2013, the State had invested
`4,511.03 crore in Statutory Corporations, Government companies, Joint Stock
Companies and Co-operatives. The average return on these investments was 1.3
per cent during the last five years, while the Government paid an average interest
rate ranging from 7.1 per cent to 7.5 per cent on its borrowings during the same
period.
It is not uncommon for a State to borrow for increasing its social and economic
infrastructure support and creating additional income generating assets. However,
increase in non-developmental expenditure like salaries, interest payments,
pension and subsidies year after year reduces the net availability of funds from the
borrowings for infrastructure development. The State’s low return on investments
indicates an implicit subsidy and use of high cost borrowings for investments,
which yields low return and is not sustainable.
Loans and Advances : Outstanding loans and advances given by the State
Government to Statutory Corporations, Government companies and Co-operative
Societies at the end of March 2013 was `10,456 crore, recording an increase of
`1062 crore over the previous year. Arrears in repayment of loan as on 31 March
2013 from 68 institutions was `6,382.47 crore, which includes interest amounting
to `2,636.60 crore.
Deficit : All the key fiscal parameters, ie revenue, fiscal and primary deficits
increased during 2012-13 when compared to previous year. The revenue, fiscal
and primary deficit increased to `9,352 crore, `15,002 crore and `7,797 crore in
2012-13 from `8,035 crore, `12,815 crore and `6,521 crore respectively in 2011-
12. The ratio of revenue deficit to fiscal deficit reduced from 62.7 per cent in
2011-12 to 62.3 per cent in 2012-13. As a proportion of GSDP, the revenue
deficit stood at 2.6 per cent and fiscal deficit at 4.1 per cent, which was far off
from the target fixed in the Kerala Fiscal Responsibility (Amendment) Act, 2011.
Increasing revenue and fiscal deficit shows growing fiscal imbalance of the State.
Similarly, increase in the ratio of revenue deficit and fiscal deficit indicates that
the application of borrowed funds has largely been to meet current expenditure.
Debt Management : Fiscal liabilities at the end of the current year worked out to
`1,08,477 crore and stood at 29.9 per cent of GSDP in 2012-13, which was below
the target of 31.7 per cent fixed in the Kerala Fiscal Responsibility (Amendment)
Act, 2011. The net availability of borrowed funds (including market borrowings)
after providing interest and repayment of principal was `8,154 crore against
`4,426 crore in 2011-12. As the non-debt receipt of the State was also

Chapter I – Finances of the State Government
61
insufficient, some portion of this borrowing was used for bridging fiscal gap.
Consequently, the State was left with only `5,204 crore for developmental
activities from the total borrowings of `13,261 crore. The maturity profile of State
shows that the State will have to repay 42.4 per cent of its debt between one and
seven years.
There has been a decline in net availability of funds from its borrowings as large
portion of these funds are being used for debt servicing. The ratio of financial
assets to liabilities has also deteriorated indicating the greater part of liabilities
was without an asset backup. The Balance from Current Revenue (BCR) which
plays a critical role in determining its plan size and a negative BCR adversely
affects the same and reduces the availability of funds for additional infrastructure
requirement.
Monitoring of funds transferred directly from the GOI to the State
implementing agencies : Government of India directly transferred
`2,289.26 crore to the 12 implementing agencies of the State during the year and
at the end of March 2013 an amount of `485.50 crore was remaining un-utilised
with these implementing agencies. But transfer of funds from Government of
India to the state implementing agencies directly ran the risk of inadequate
monitoring of utilisation of funds by these agencies in the absence of uniform
accounting procedures and effective monitoring system.
1.15 Recommendations
Realistic assessment of Revenue Receipts and Revenue Expenditure may
be made, so that achievable goals can be set in the fiscal reform path of the
State.
Management Information Systems may be established and existing Central
Plan Scheme Monitoring System may be utilized effectively for real time
accounting and monitoring of funds transferred directly to State
Implementing agencies of Central sector schemes.
The Government may review the low return from investments in
Government companies/Statutory corporations/Public Sector Undertakings
and huge arrears in repayment of loans released to them for giving true
and fair status to the balance sheet of the State Government.
Statutory contributions to Reserve Funds may be made so as to meet the
possible future liability, envisaged while constituting the Funds. The State
Government should also ensure re-investment of fund balances for
possible accretions to the fund balance.