chapter overview survey research developmental research correlational research
TRANSCRIPT
CHAPTER OVERVIEW
• Survey Research• Developmental Research• Correlational Research
NONEXPERIMENTAL RESEARCH
• Descriptive Research• Historical Research• Correlational Research Methods

DESCRIPTIVE RESEARCH
• Asks about the characteristics of a phenomenon
• Does not include treatment or control groups
DESCRPTIVE RESEARCH
• Case studies—in-depth studies of individuals or organizations
• Developmental studies—changes or differences associated with age
• Correlational studies—relationships between variables are characterized
SURVEY RESEARCH
• Examines the frequency and relationships between psychological and sociological variables
• Assesses constructs such as attitudes, beliefs, prejudices, etc.
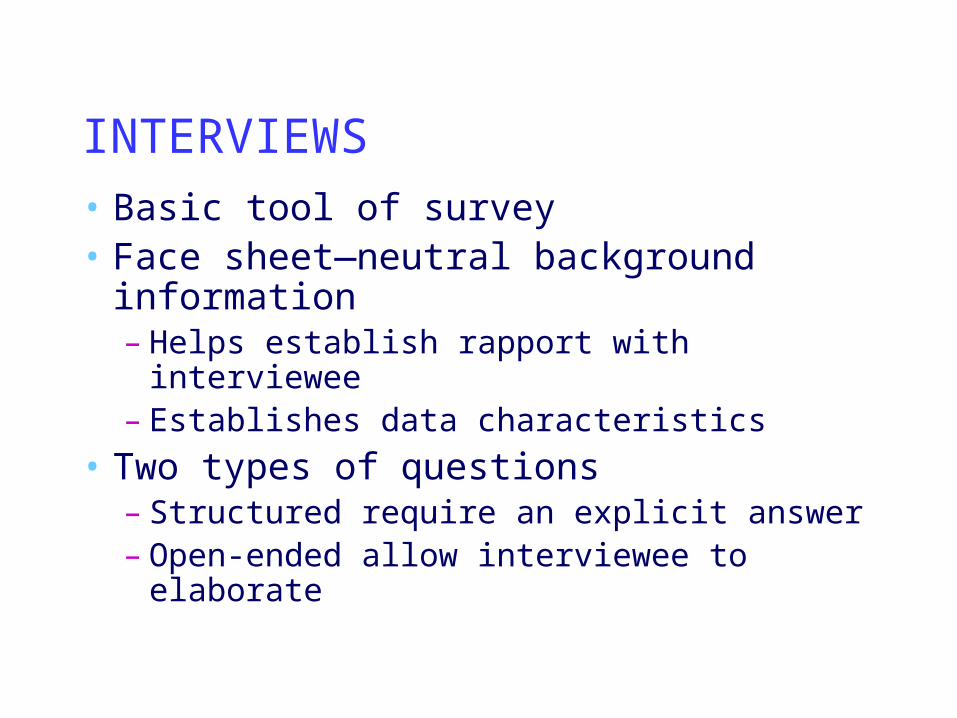
INTERVIEWS• Basic tool of survey• Face sheet—neutral background
information– Helps establish rapport with interviewee– Establishes data characteristics
• Two types of questions– Structured require an explicit answer– Open-ended allow interviewee to
elaborate
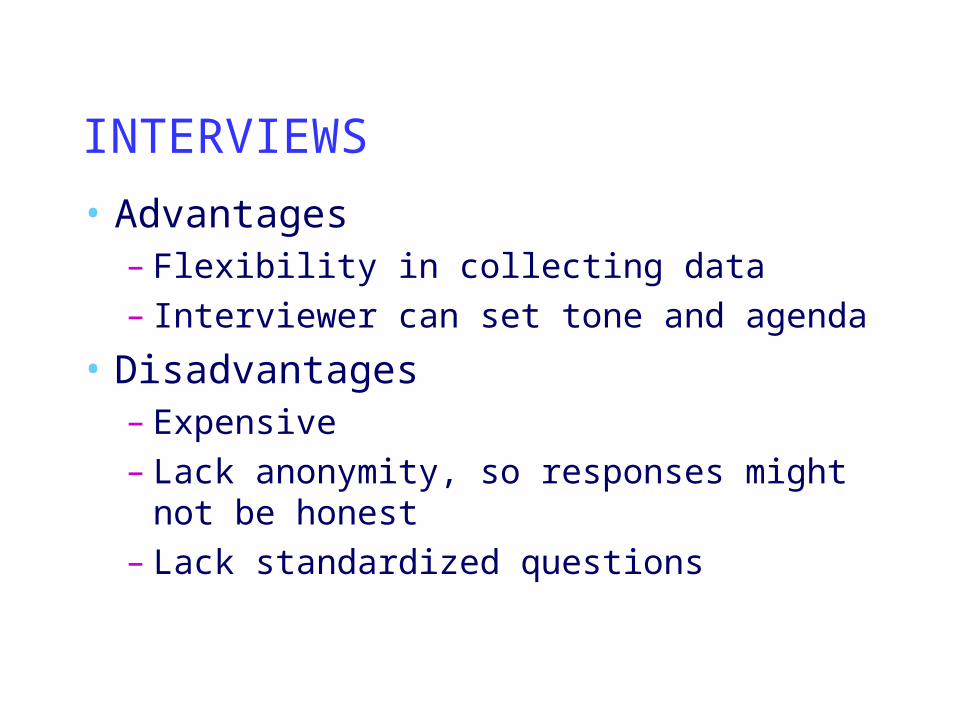
INTERVIEWS
• Advantages– Flexibility in collecting data– Interviewer can set tone and agenda
• Disadvantages– Expensive – Lack anonymity, so responses might
not be honest– Lack standardized questions
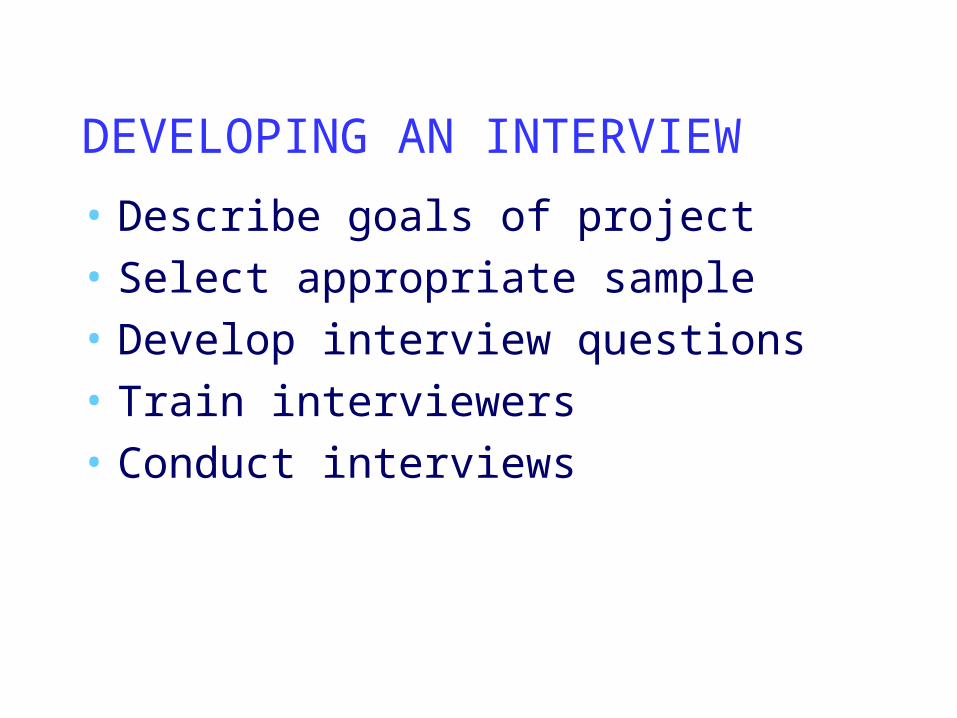
DEVELOPING AN INTERVIEW
• Describe goals of project• Select appropriate sample• Develop interview questions• Train interviewers• Conduct interviews
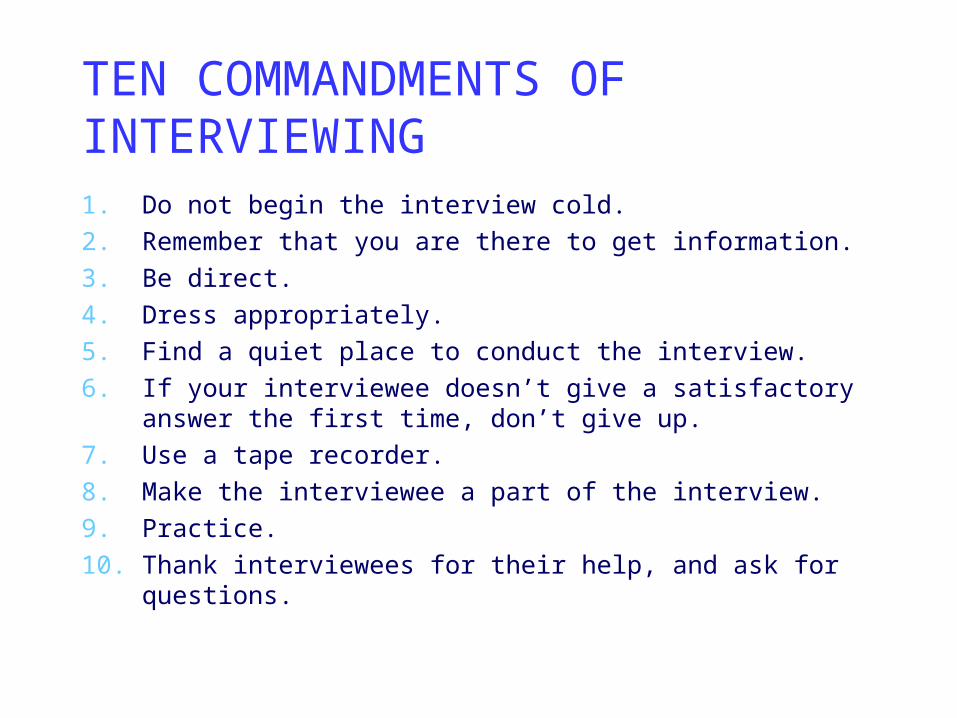
TEN COMMANDMENTS OF INTERVIEWING1. Do not begin the interview cold.2. Remember that you are there to get information.3. Be direct.4. Dress appropriately.5. Find a quiet place to conduct the interview.6. If your interviewee doesn’t give a satisfactory answer
the first time, don’t give up.7. Use a tape recorder.8. Make the interviewee a part of the interview.9. Practice.10. Thank interviewees for their help, and ask for
questions.
HOW TO DO SURVEY RESEARCH
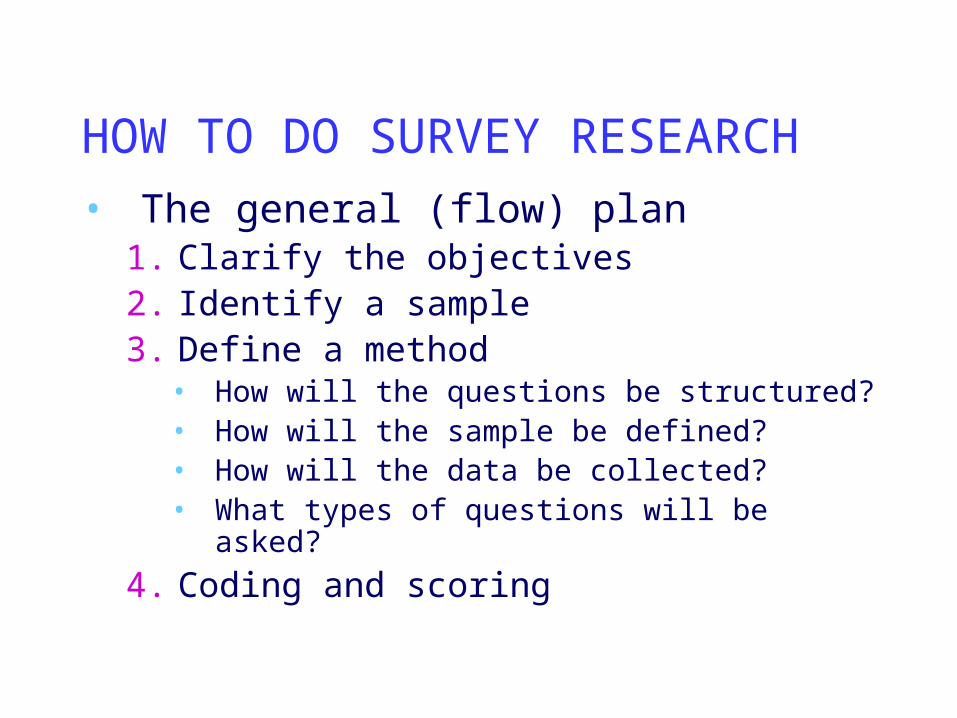
• The general (flow) plan1. Clarify the objectives2. Identify a sample3. Define a method
• How will the questions be structured?• How will the sample be defined?• How will the data be collected?• What types of questions will be asked?
4. Coding and scoring
EVALUATING SURVEY RESEARCH
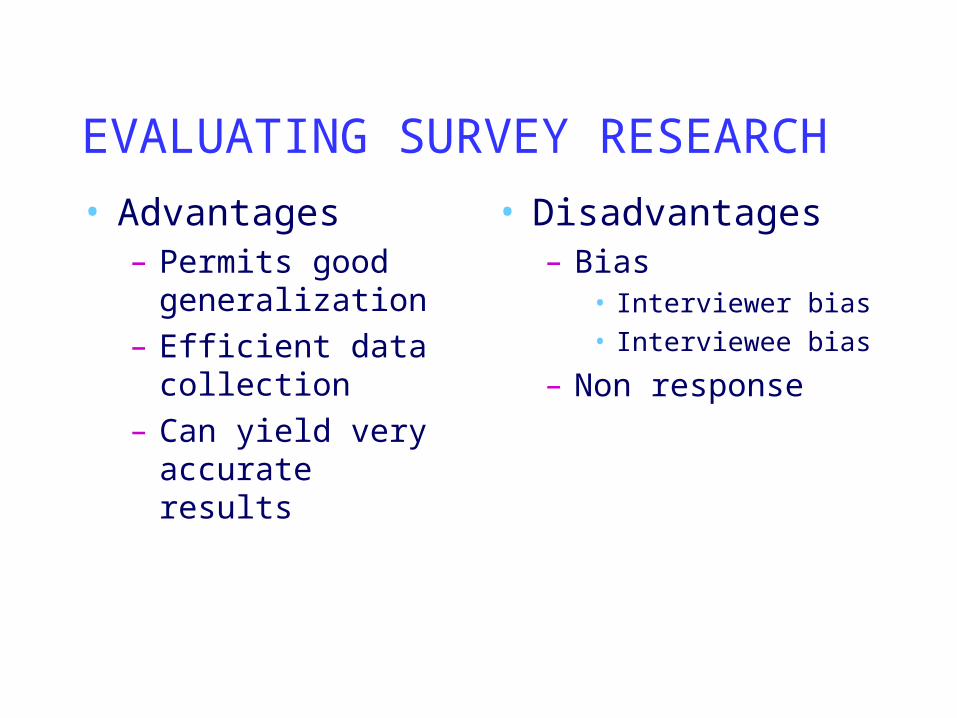
• Advantages– Permits good
generalization– Efficient data
collection– Can yield very
accurate results
• Disadvantages– Bias
• Interviewer bias• Interviewee bias
– Non response
THE LONGITUDINAL METHOD
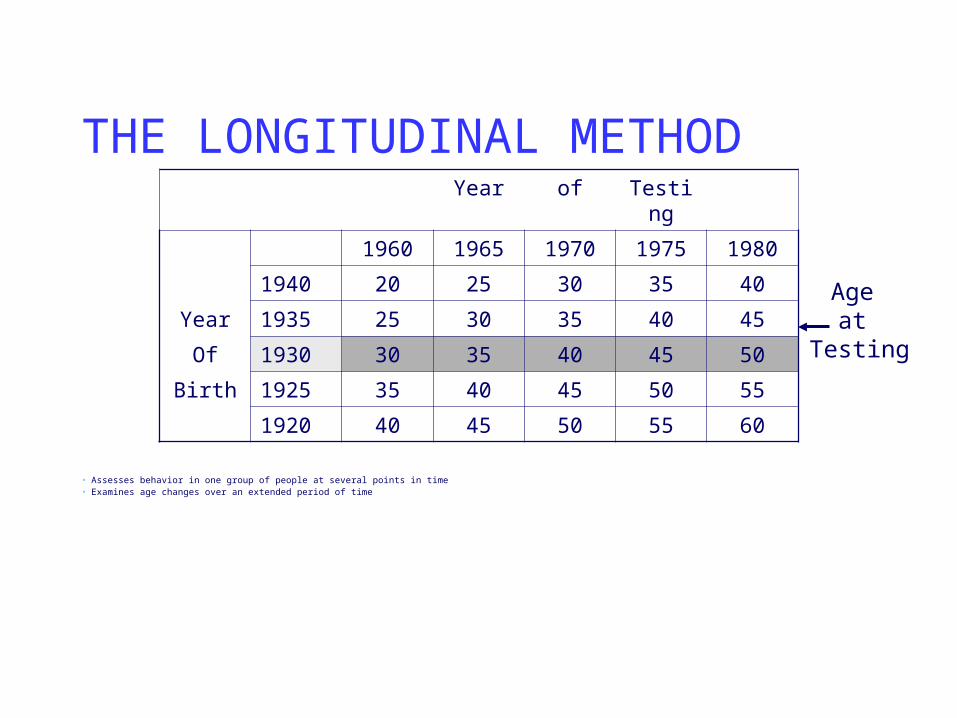
• Assesses behavior in one group of people at several points in time• Examines age changes over an extended period of time
Year of Testing
1960 1965 1970 1975 1980
1940 20 25 30 35 40
Year 1935 25 30 35 40 45
Of 1930 30 35 40 45 50
Birth 1925 35 40 45 50 55
1920 40 45 50 55 60
Age at
Testing
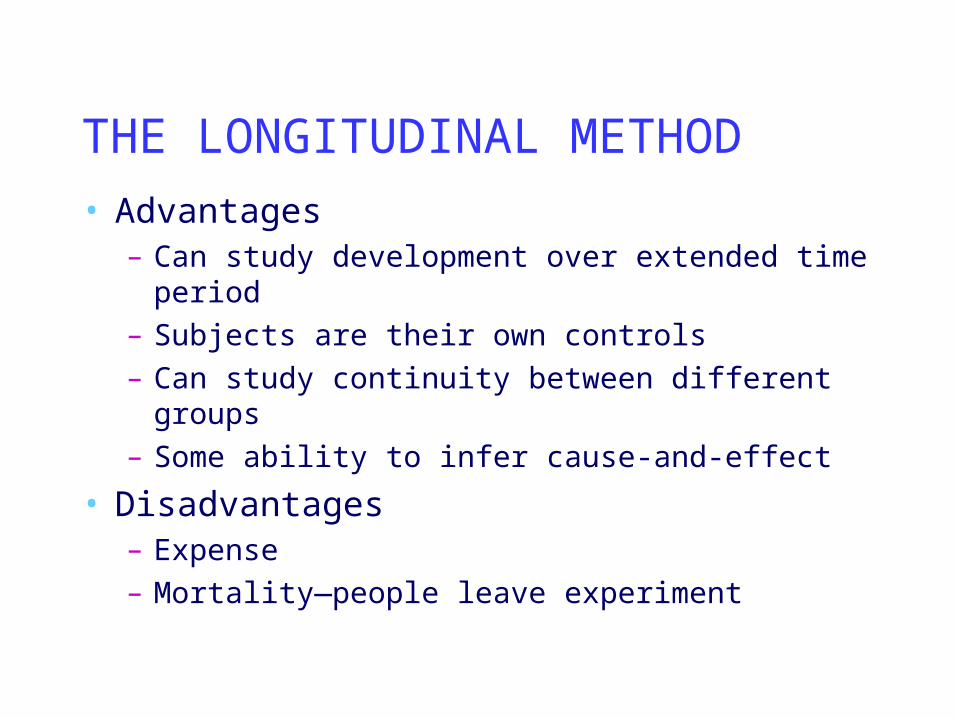
THE LONGITUDINAL METHOD• Advantages
– Can study development over extended time period
– Subjects are their own controls– Can study continuity between different
groups– Some ability to infer cause-and-effect
• Disadvantages– Expense– Mortality—people leave experiment
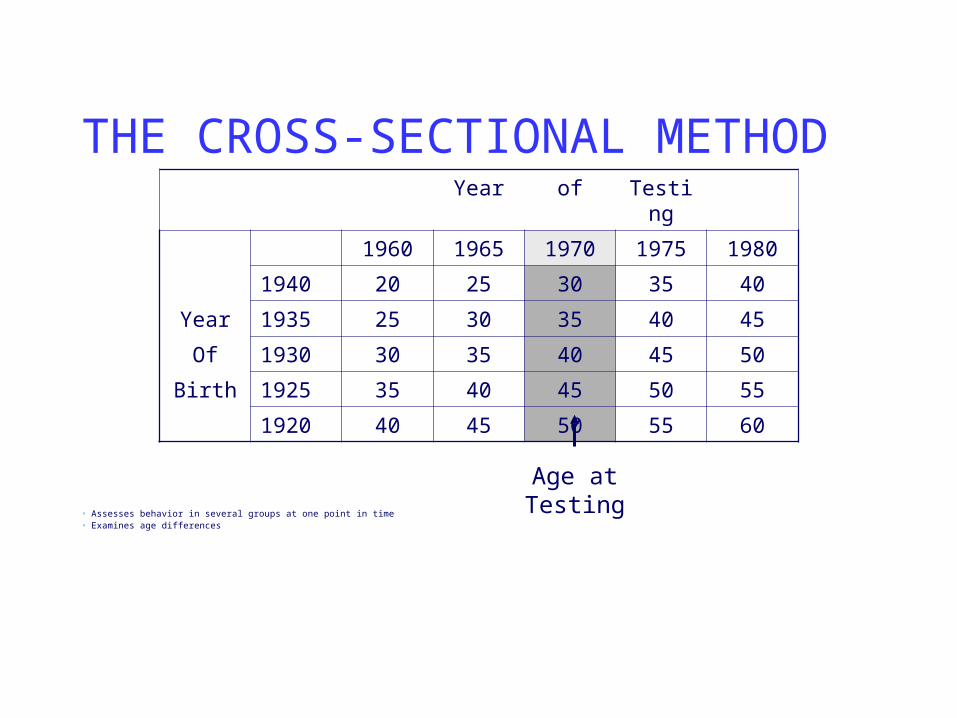
THE CROSS-SECTIONAL METHOD
• Assesses behavior in several groups at one point in time• Examines age differences
Year of Testing
1960 1965 1970 1975 1980
1940 20 25 30 35 40
Year 1935 25 30 35 40 45
Of 1930 30 35 40 45 50
Birth 1925 35 40 45 50 55
1920 40 45 50 55 60
Age at Testing
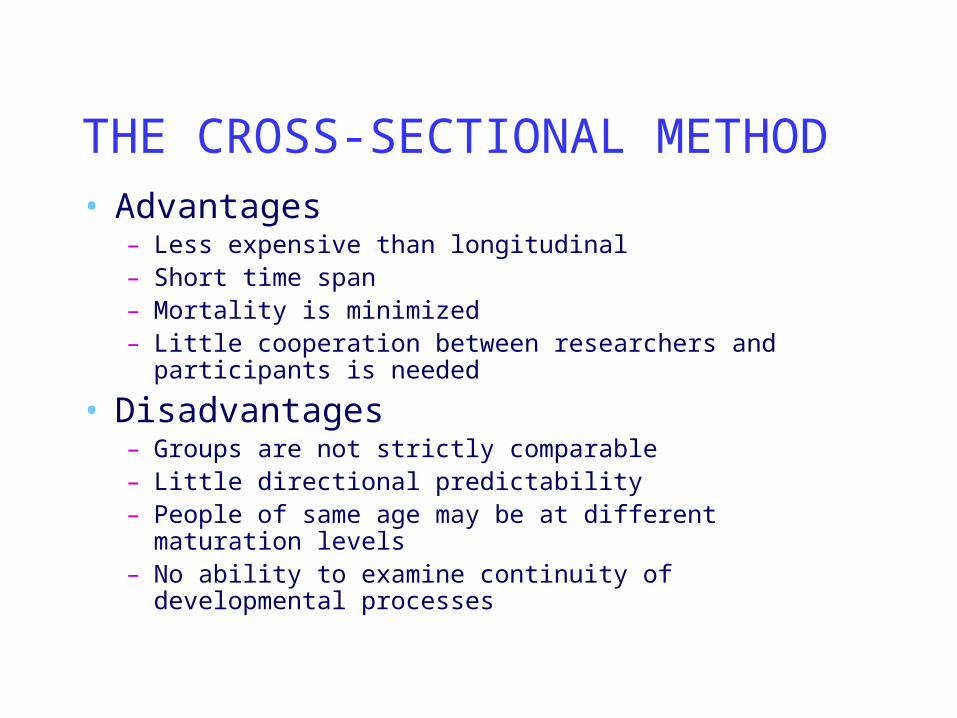
THE CROSS-SECTIONAL METHOD• Advantages
– Less expensive than longitudinal– Short time span– Mortality is minimized– Little cooperation between researchers and
participants is needed
• Disadvantages– Groups are not strictly comparable– Little directional predictability– People of same age may be at different maturation
levels– No ability to examine continuity of developmental
processes

THE UTILITY OF FOLLOW-UP STUDIES
• Data that have already been collected– Guide current and future research– Enables longitudinal research to be
done in a short time
THE ROLE OF AGE IN STUDYING DEVELOPMENT
• Age has descriptive, not explanatory value
• New research techniques consider– Measurement effects—time of testing– Cohort effects—time of birth
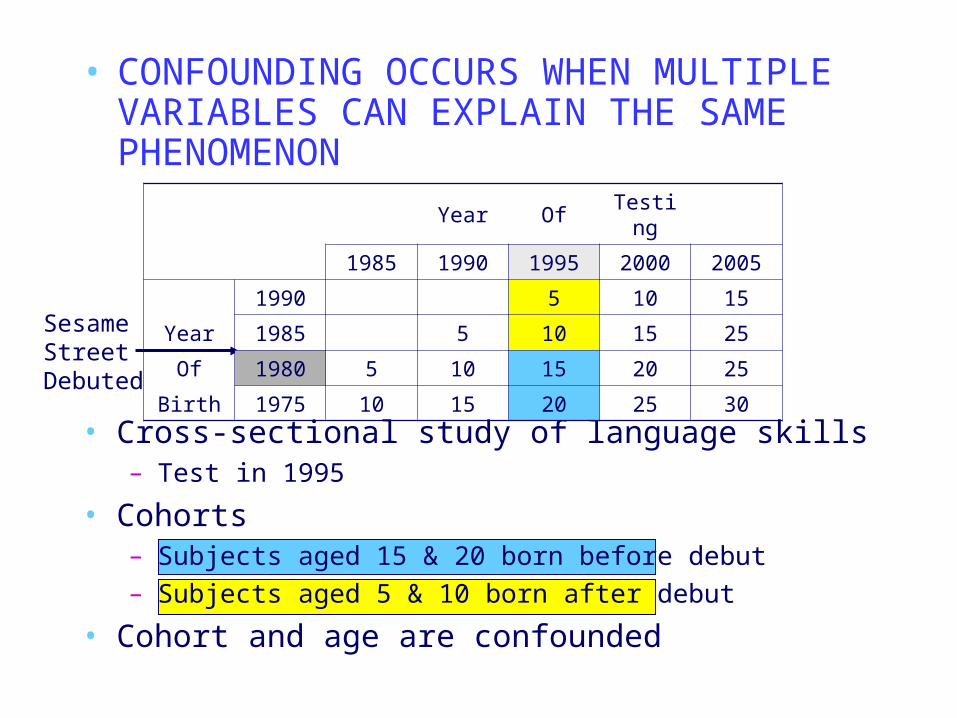
• Cross-sectional study of language skills– Test in 1995
• Cohorts– Subjects aged 15 & 20 born before debut– Subjects aged 5 & 10 born after debut
• Cohort and age are confounded
Sesame Street
Debuted
• CONFOUNDING OCCURS WHEN MULTIPLE VARIABLES CAN EXPLAIN THE SAME PHENOMENON
Year OfTestin
g
1985 1990 1995 2000 2005
1990 5 10 15
Year 1985 5 10 15 25
Of 1980 5 10 15 20 25
Birth 1975 10 15 20 25 30

CORRELATIONAL RESEARCH STUDIES
• Describe a linear relationship between variables
• Do not imply a cause-and-effect relationship
• Do imply that variables share something in common
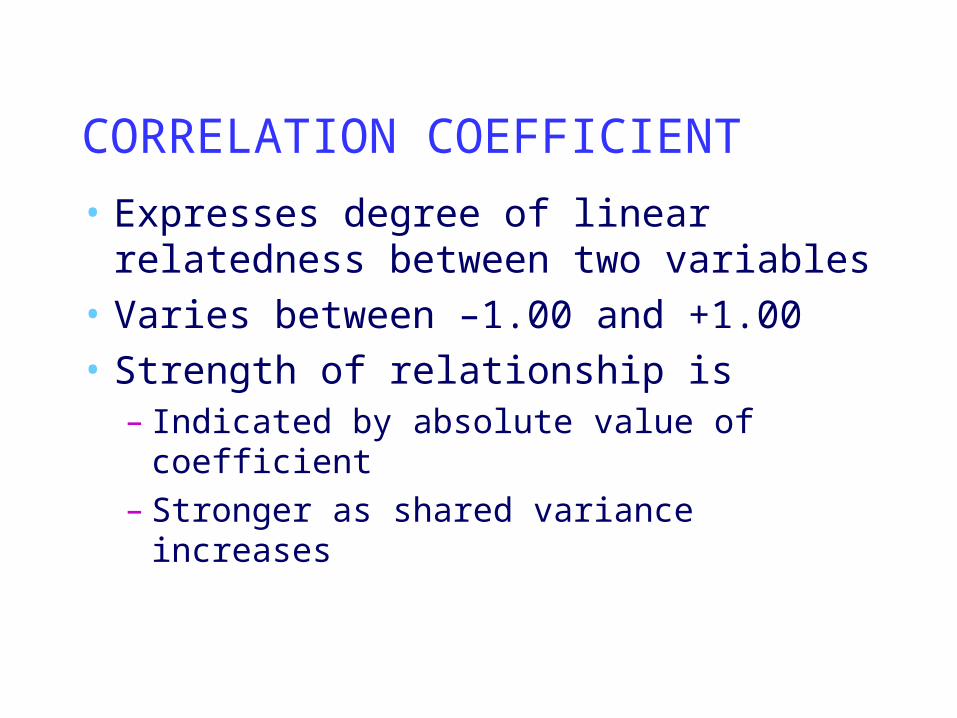
CORRELATION COEFFICIENT
• Expresses degree of linear relatedness between two variables
• Varies between –1.00 and +1.00• Strength of relationship is
– Indicated by absolute value of coefficient
– Stronger as shared variance increases
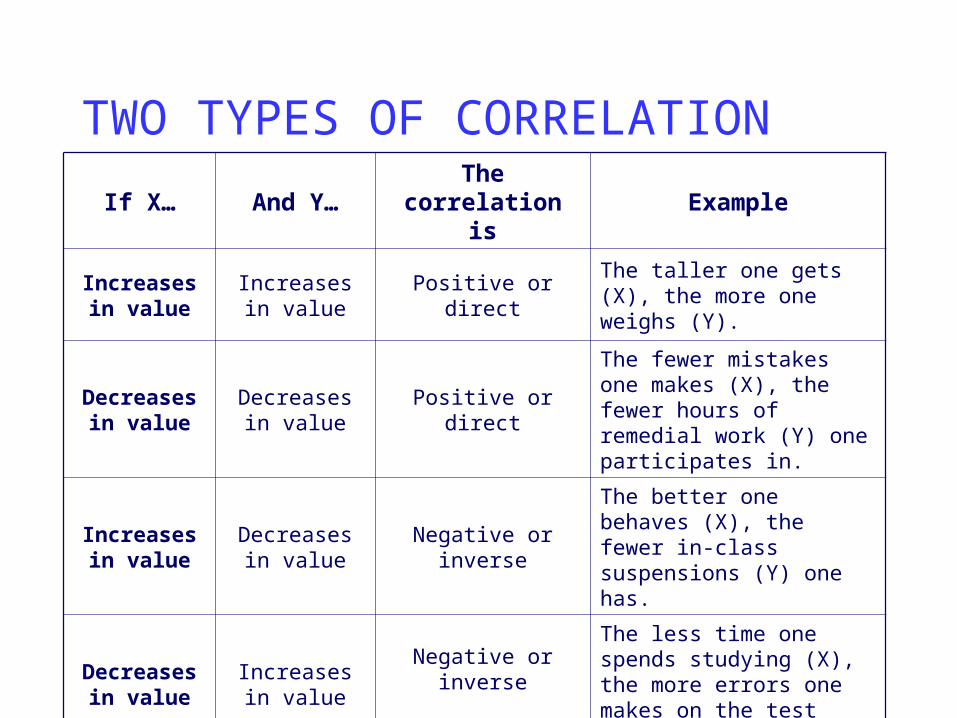
TWO TYPES OF CORRELATIONIf X… And Y…
The correlation is
Example
Increases in value
Increases in value
Positive or directThe taller one gets (X), the more one weighs (Y).
Decreases in value
Decreases in value
Positive or direct
The fewer mistakes one makes (X), the fewer hours of remedial work (Y) one participates in.
Increases in value
Decreases in value
Negative or inverse
The better one behaves (X), the fewer in-class suspensions (Y) one has.
Decreases in value
Increases in value
Negative or inverse
The less time one spends studying (X), the more errors one makes on the test (Y).
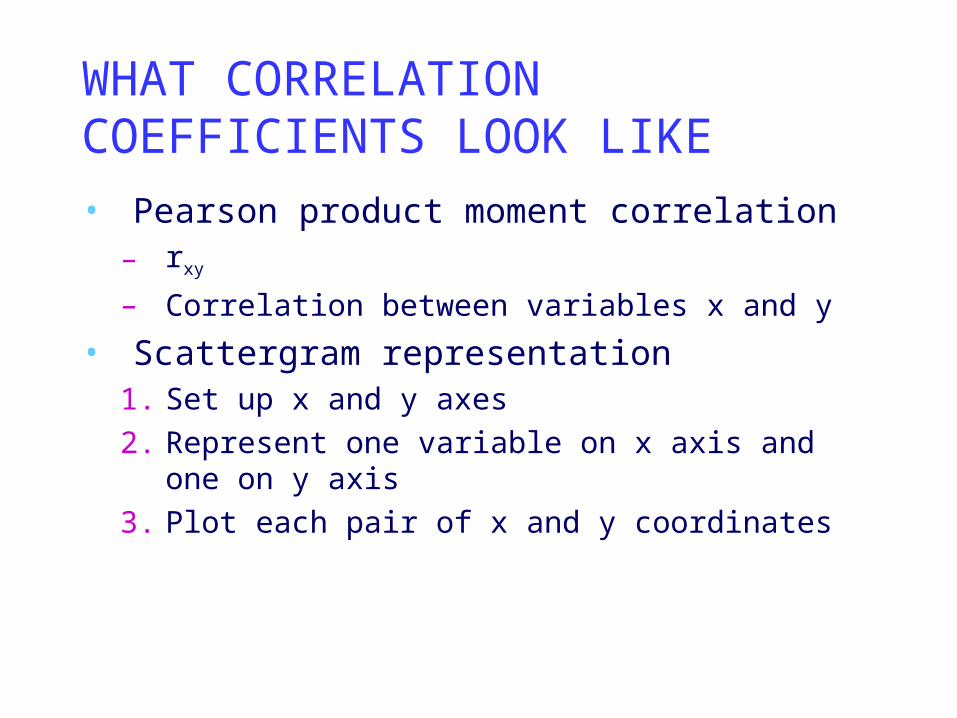
WHAT CORRELATION COEFFICIENTS LOOK LIKE
• Pearson product moment correlation– rxy
– Correlation between variables x and y
• Scattergram representation1. Set up x and y axes2. Represent one variable on x axis and
one on y axis3. Plot each pair of x and y coordinates
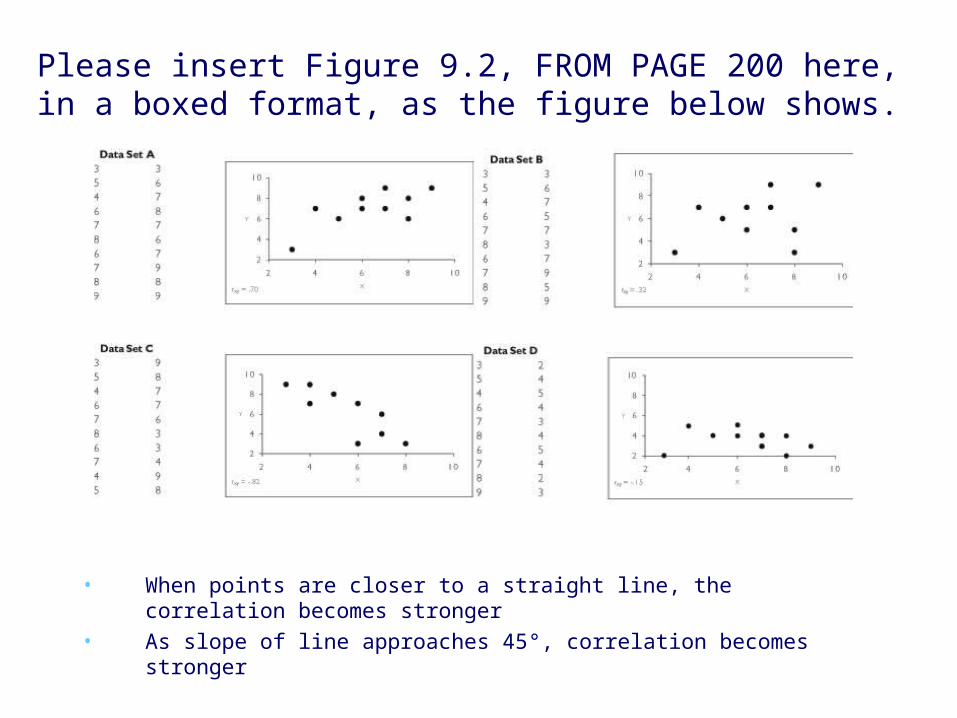
Please insert Figure 9.2, FROM PAGE 200 here, in a boxed format, as the figure below shows.
• When points are closer to a straight line, the correlation becomes stronger
• As slope of line approaches 45°, correlation becomes stronger
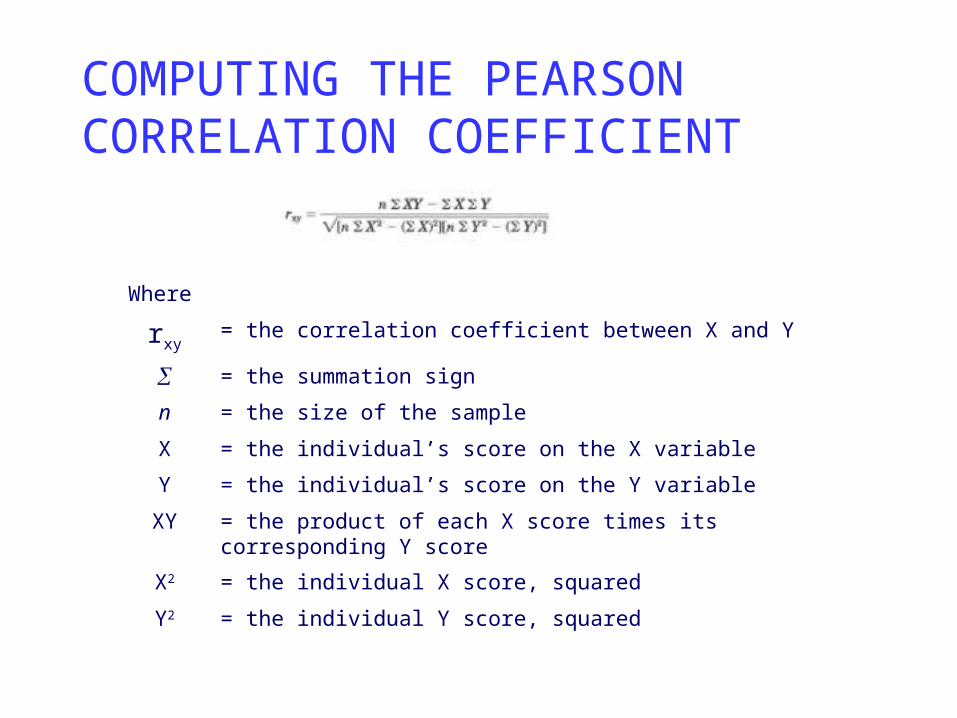
COMPUTING THE PEARSON CORRELATION COEFFICIENT
Where
rxy= the correlation coefficient between X and Y
= the summation sign
n = the size of the sample
X = the individual’s score on the X variable
Y = the individual’s score on the Y variable
XY = the product of each X score times its corresponding Y score
X2 = the individual X score, squared
Y2 = the individual Y score, squared
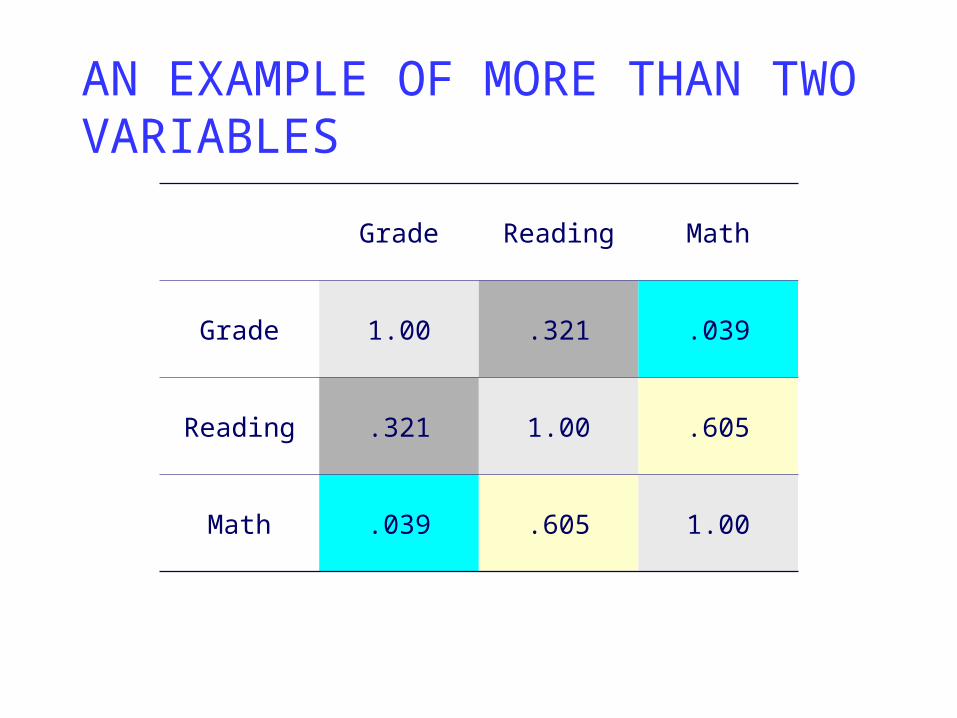
AN EXAMPLE OF MORE THAN TWO VARIABLES
Grade Reading Math
Grade 1.00 .321 .039
Reading .321 1.00 .605
Math .039 .605 1.00

INTERPRETING THE PEARSON CORRELATION COEFFICIENT
• “Eyeball” method
Correlations between Are said to be
.8 and 1.0 Very strong
.6 and .8 Strong
.4 and .6 Moderate
.2 and .4 Weak
0 and .2 Very weak
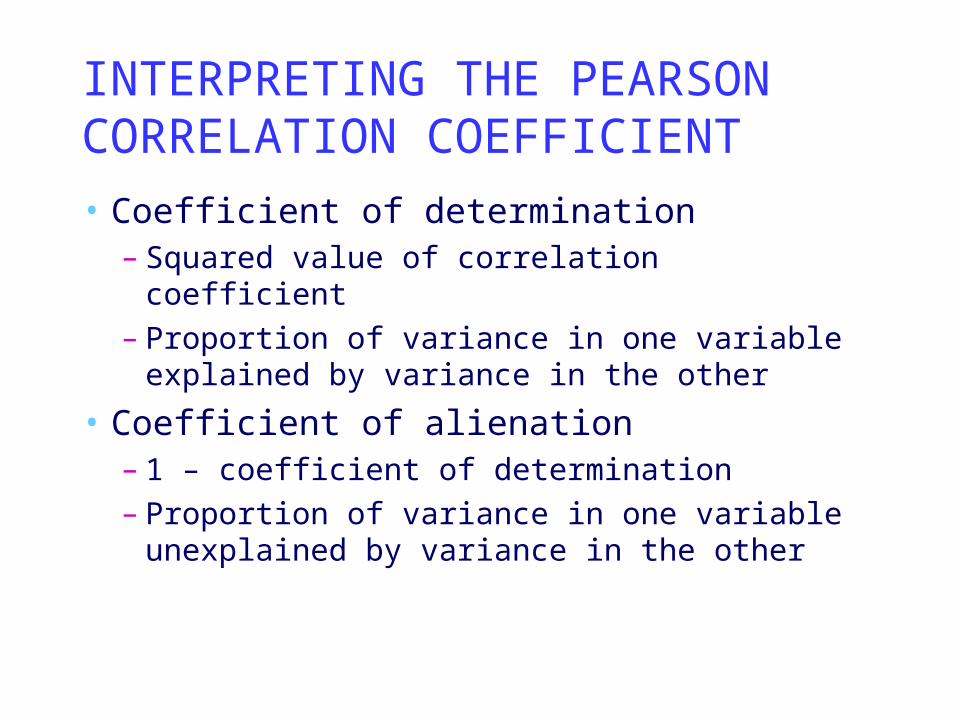
INTERPRETING THE PEARSON CORRELATION COEFFICIENT
• Coefficient of determination– Squared value of correlation coefficient– Proportion of variance in one variable
explained by variance in the other
• Coefficient of alienation– 1 – coefficient of determination – Proportion of variance in one variable
unexplained by variance in the other
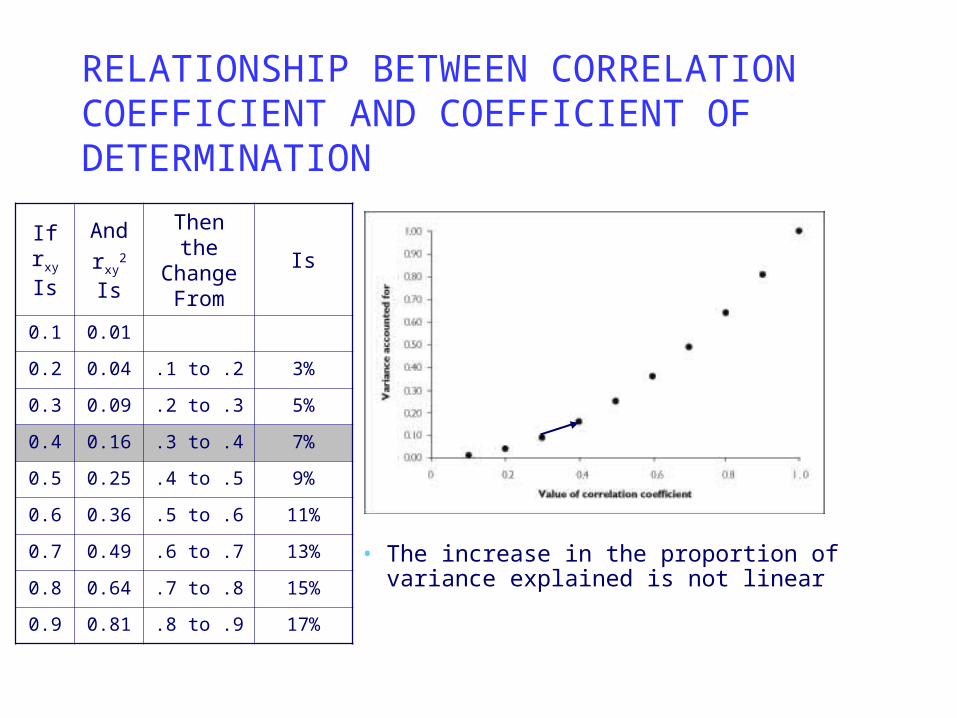
RELATIONSHIP BETWEEN CORRELATION COEFFICIENT AND COEFFICIENT OF DETERMINATION
• The increase in the proportion of variance explained is not linear
If rxy Is
Andrxy
2 Is
Then the
Change From
Is
0.1 0.01
0.2 0.04 .1 to .2 3%
0.3 0.09 .2 to .3 5%
0.4 0.16 .3 to .4 7%
0.5 0.25 .4 to .5 9%
0.6 0.36 .5 to .6 11%
0.7 0.49 .6 to .7 13%
0.8 0.64 .7 to .8 15%
0.9 0.81 .8 to .9 17%