chapter two product and process design 2-1- product designchapter two product and process design...
TRANSCRIPT

1 st year / 2014-2015 / Principles of Industrial Eng. Chapter -2 -/ Dr. May G. Kassir
1
Chapter two
Product and Process design
2-1- Product design
Product design is the process of defining all the features and characteristics of the
product to manufacture. Product design also includes the design of services.
Consumers respond to a product’s appearance, color, texture, and performance. All
of its features, summed up, are the product’s design. Someone came up with the idea
of what this product will look like, taste like, or feel like so that it will appeal to the
customers. This is the purpose of product design. Product design defines a product’s
characteristics, such as its appearance, the materials it is made of, its dimensions and
tolerances, and its performance standards.
Product design deals with conversion of ideas into reality. Every business
organization has to design, develop and introduce new products as a survival and
growth strategy. Developing the new products and launching them in the market is
the biggest challenge faced by the organizations.
— The entire process of need identification to physical manufactures of product involves
three functions: marketing, product development, manufacturing.
Product development translates the needs of customers given by marketing into
technical specifications and designing the various features into the product to these
specifications. Manufacturing has the responsibility of selecting the processes by
which the product can be manufactured. Product design and development provides
link between marketing, customer needs and expectations and the activities
required to manufacture the product.

1 st year / 2014-2015 / Principles of Industrial Eng. Chapter -2 -/ Dr. May G. Kassir
2
2-2- The steps of product design
Certain steps are common to the development of most product designs:
- idea generation
- product screening
- preliminary design and testing,
- Final design.
These steps are shown in Figure 3-1. Notice that the arrows show a circular process.
Product designs are never finished, but are always updated with new ideas.
FIGURE 3-1 Steps in the product design process
2-3- Design for Manufacture
When we think of product design, we generally first think of how to please the
customer. However, we also need to consider how easy or difficult it is to
manufacture the product. Otherwise, we might have a great idea that is difficult or
too costly to manufacture. Design for manufacture (DFM) is a series of guidelines
that we should follow to produce a product easily and profitably. DFM guidelines
focus on two issues:
1. Design simplification means reducing the number of parts and features of the
product whenever possible. A simpler product is easier to make, costs less, and gives
higher quality.
2. Design standardization refers to the use of common and interchangeable parts.
1 st year / 2014-2015 / Principles of Industrial Eng. Chapter -2 -/ Dr. May G. Kassir
3
By using interchangeable parts, we can make a greater variety of products with less
inventory and significantly lower cost and provide greater flexibility.
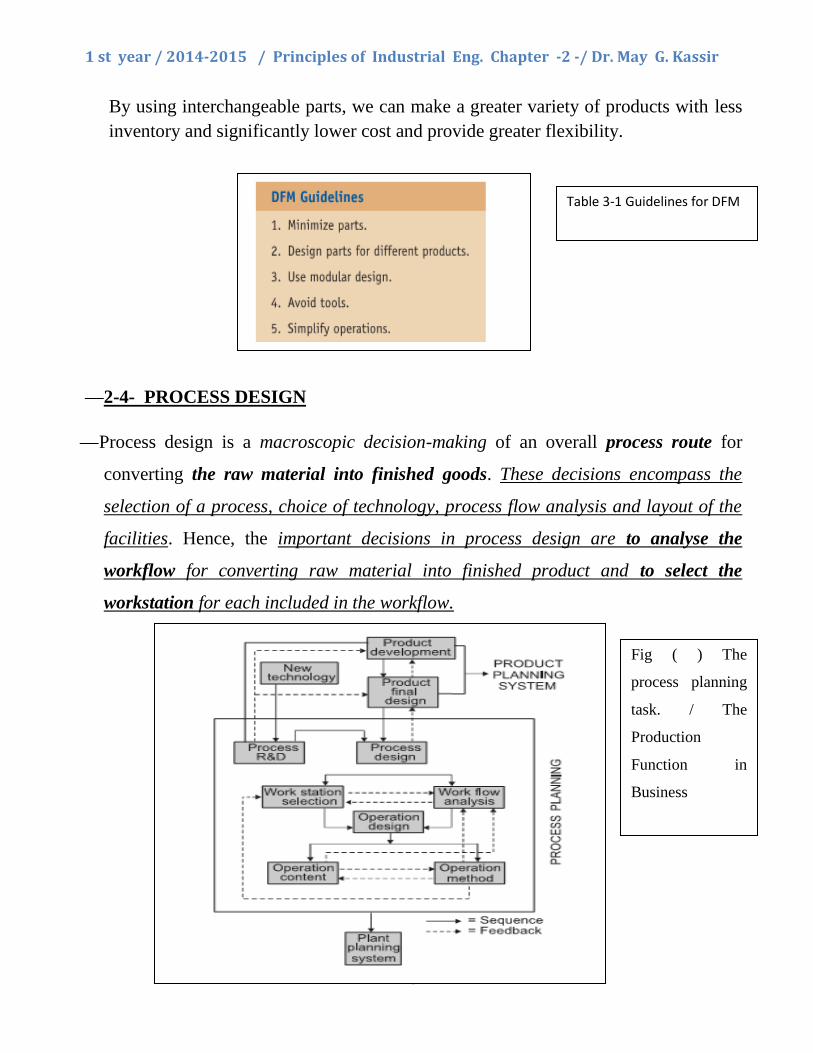
— 2-4- PROCESS DESIGN
— Process design is a macroscopic decision-making of an overall process route for
converting the raw material into finished goods. These decisions encompass the
selection of a process, choice of technology, process flow analysis and layout of the
facilities. Hence, the important decisions in process design are to analyse the
workflow for converting raw material into finished product and to select the
workstation for each included in the workflow.
Table 3-1 Guidelines for DFM
Fig ( ) The
process planning
task. / The
Production
Function in
Business

1 st year / 2014-2015 / Principles of Industrial Eng. Chapter -2 -/ Dr. May G. Kassir
4
2-5- Types of Processes
All processes can be grouped into two broad categories :
- Intermittent operations
- Repetitive operations.
These two categories differ in almost every way. Once we understand these
differences, we can easily identify organizations based on the category of process
they use. The volume produced is usually based on a forecast of future demands
rather than on direct customer orders.
The most common differences between intermittent and repetitive operations relate
to two dimensions: (1) the amount of product volume produced, and (2) the degree
of product standardization.
- Intermittent Operations are used to produce a variety of products with different
processing requirements in lower volumes. Examples are an auto body shop, a
tool and die shop, or a healthcare facility. Because different products have
different processing needs, there is no standard route that all products take
- Repetitive Operations are used to produce one or a few standardized products in
high volume. Examples are a typical assembly line, cafeteria, or automatic car
wash. Resources are organized in a line flow to efficiently accommodate
production of the product. Note that in this environment it is possible to arrange
resources in a line because there is only one type of product. This is directly the
opposite of what we find with intermittent operations.
Product volume can range from making a unique product one at a time to producing
a large number of products at the same time. Product standardization refers to a
lack of variety in a particular product. Examples of standardized products are white
undershirts, calculators, toasters, and television sets. The type of operation used,

1 st year / 2014-2015 / Principles of Industrial Eng. Chapter -2 -/ Dr. May G. Kassir
5
including equipment and labor, is quite different if a company produces one product
at a time to customer specifications instead of mass production of one standardized
product (also see types of production systems).
2-6- Product-production design interaction
Fig.(1-2)Interrelations of design, materials, and processing to produce a product
Fig. ( ) Product
design and the
manufacturing
choices as an
examples
1 st year / 2014-2015 / Principles of Industrial Eng. Chapter -2 -/ Dr. May G. Kassir
6
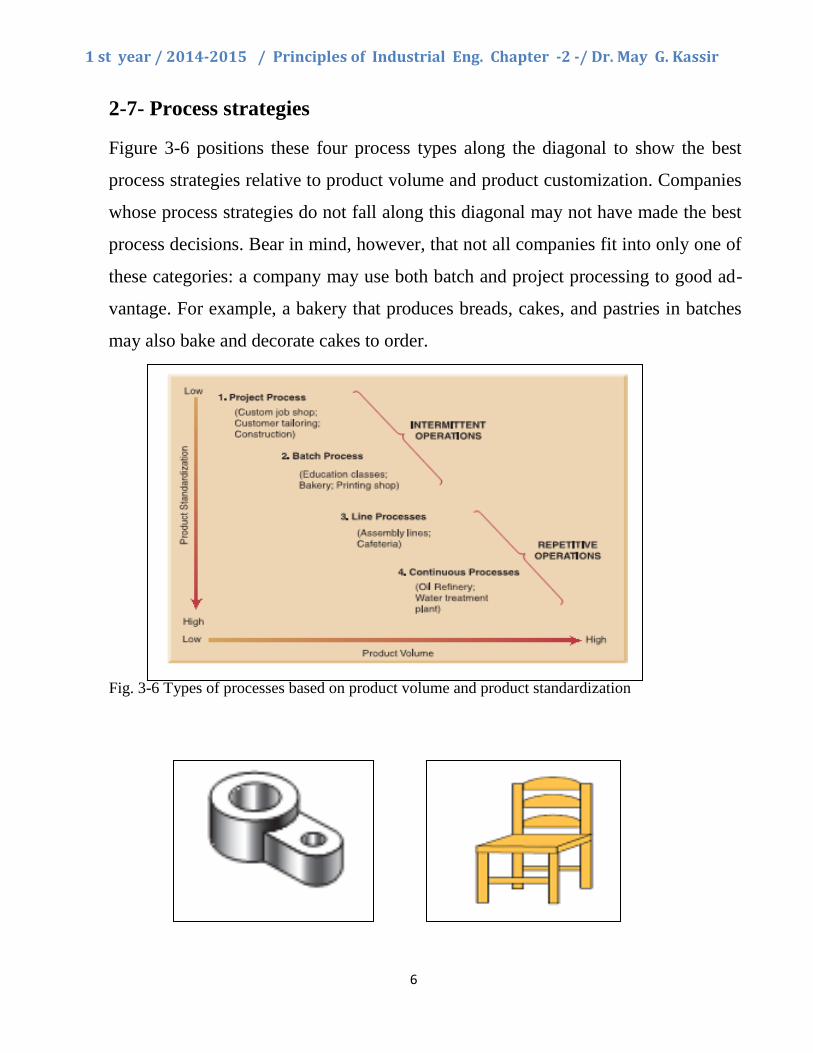
2-7- Process strategies
Figure 3-6 positions these four process types along the diagonal to show the best
process strategies relative to product volume and product customization. Companies
whose process strategies do not fall along this diagonal may not have made the best
process decisions. Bear in mind, however, that not all companies fit into only one of
these categories: a company may use both batch and project processing to good ad-
vantage. For example, a bakery that produces breads, cakes, and pastries in batches
may also bake and decorate cakes to order.
Fig. 3-6 Types of processes based on product volume and product standardization

1 st year / 2014-2015 / Principles of Industrial Eng. Chapter -2 -/ Dr. May G. Kassir
7
2-8- Break-even Analysis
Break even is the point of balance between making either a profit or a loss.
An enterprise, whether or not a profit maximize, often finds it useful to know what
price (or output level) must be for total revenue just equal total cost. This can be
done with a breakeven analysis. This analysis is to determine the minimum level of
output that allows the firm to break even, but it could be used for some other tasks.
see fig. ().
Fig. () break even analysis
Fixed And Variable Costs
Costs in a business are either fixed or variable:
Fixed costs : These are things that are always there, like plant, heating, lighting and
rent. Sometimes called ’indirect’ or ’standing’ costs or simply overheads.
Variable costs : These include things like raw materials that vary in cost and
quantity used. Sometimes called ’direct’ or ’running’ costs.
1 st year / 2014-2015 / Principles of Industrial Eng. Chapter -2 -/ Dr. May G. Kassir
8
It is necessary to know which costs are fixed and which are variable before you can
start to work out the true production costs of a product, or how much it costs to
deliver a service. In general major costs are broken down like this:
Materials : A variable cost as it will change depending on how much is produced.
Direct labour : This is labour directly involved in production and not administration
etc. This is usually seen as a variable cost, since people theoretically can be hired and
fired according to need; in practice, this is not always easy to achieve.
Production Overheads : This is usually considered a fixed cost, although increased
levels of production can raise the amount of energy used.
Research And Development : A fixed cost, budgeted for in advance and over long
periods.
Marketing And Distribution : These are mostly fixed costs but there are some
exceptions; for example, the amount of a salesperson’s commission will vary with
the amount they sell.
General Administration : A fixed cost
Direct costs, overheads and drawings would all be calculated. The profit figure
would be based on your objectives. The sale price is therefore arrived at last, based
on the totals.
In the linear BE Analysis or Cost-Volume-Profit Analysis model (where marginal
costs and marginal revenues are constant, among other assumptions).
The gross profit, is often called the ’contribution per unit’.

1 st year / 2014-2015 / Principles of Industrial Eng. Chapter -2 -/ Dr. May G. Kassir
9
The break-even point (BEP) (in terms of Unit Sales (X)) can be directly computed in
terms of Total Revenue (TR) and Total Costs (TC) as:
Where:
TFC is Total Fixed Costs,
P is Unit Sale Price, and
V is Unit Variable Cost.
The quantity, , is of interest in its own right, and is called the Unit
Contribution Margin (C): it is the marginal profit per unit, or alternatively the
portion of each sale that contributes to Fixed Costs. Thus the break-even point
can be more simply computed as the point where Total Contribution = Total
Fixed Cost:
To calculate the break-even point in terms of revenue (a.k.a. currency units, a.k.a.
sales proceeds) instead of Unit Sales (X), the above calculation can be multiplied by
Price, or, equivalently, the Contribution Margin Ratio (Unit Contribution Margin over
Price) can be calculated:

1 st year / 2014-2015 / Principles of Industrial Eng. Chapter -2 -/ Dr. May G. Kassir
10
R=C, Where R is revenue generated, C is cost incurred i.e.
Fixed costs + Variable Costs or
Q * P (Price per unit) = TFC + Q * VC (Price per unit) ,
Q * P - Q * VC = TFC, Q * (P - VC) = TFC, or,
Break Even Analysis Q = TFC/c/s ratio=Break Even
Example
ABC Company is contemplating manufacturing a product which can be sold for
$10 per unit on the market. It knows of two production processes, between which it
has to choose one, and only one. The following data have been collected for Q =
150,000 units.
(a) Calculate the break-even point for each process.
(b) Which process should be used if there was a high probability of exceeding sales
of 150,000 units? Why?
(c) Which process should be used if there was a high probability of selling
considerably less than 150,000 units? Why?
1 st year / 2014-2015 / Principles of Industrial Eng. Chapter -2 -/ Dr. May G. Kassir
11
Solution
a. Break-even point for process 1:
Q1 = TFC/[P !AVC] = 400,000/[10!(800,000/150,000)]
= 85,713.67
Break-even point for process 2:
Q2 = 250,000/[10 !(950,000/150,000)]
= 68,181.82
b. If sales are going to exceed 150,000 units, the firm should use process 1 because the
average variable cost (assumed to be constant) for each unit above 150,000 will be only
$5.33 for process 1 but will be $6.33 for process 2.
c. Process 2 should be used if the firm expects to operate below 150,000 units because
the variable cost will fall more quickly with this process and profits will decline less
slowly than with process 1. %
2-9- ROUTING
—Routing may be defined as the selection of path which each part of the product will
follow while being transformed from raw materials to finished products. Path of the
product will also give sequence of operation to be adopted while being
manufactured.

1 st year / 2014-2015 / Principles of Industrial Eng. Chapter -2 -/ Dr. May G. Kassir
12
—In other way, routing means determination of most advantageous path to be followed
from department to department and machine to machine till raw material gets its
final shape, which involves the following steps:
—( a ) Type of work to be done on product or its parts.
—( b ) Operation required to do the work.
—( c ) Sequence of operation required.
—( d ) Where the work will be done.
—( e ) A proper classification about the personnel required and the machine for doing
the work.
—Routing provides the basis for scheduling, dispatching and follow-up.
—2-9-1 Techniques of Routing
—While converting raw material into required goods different operations are to be
performed and the selection of a particular path of operations for each piece is termed
as ‘Routing’. This selection of a particular path, i.e . sequence of operations must be
the best and cheapest to have the lowest cost of the final product. The various routing
techniques are:
1. Route card: This card always accompanies with the job throughout all operations.
This indicates the material used during manufacturing and their progress from one
operation to another. In addition to this the details of scrap and good work produced
are also recorded. See Fig. () route sheet and process plan.
—2. Work sheet: It contains
—( a ) Specifications to be followed while manufacturing.

1 st year / 2014-2015 / Principles of Industrial Eng. Chapter -2 -/ Dr. May G. Kassir
13
—( b ) Instructions regarding routing of every part with identification number of
machines and work place of operation.
—This sheet is made for manufacturing as well as for maintenance.
—3. Route sheet: It deals with specific production order. Generally made from
operation sheets. One sheet is required for each part or component of the order.
These includes the following:
—( a ) Number and other identification of order.
—( b ) Symbol and identification of part.
—( c ) Number of pieces to be made.
—( d ) Number of pieces in each lot—if put through in lots.
—( e ) Operation data which includes:
—(i ) List of operation on the part.
—( ii ) Department in which operations are to be performed.
—(iii ) Machine to be used for each operation.
—( iv ) Fixed sequence of operation, if any.
—( f ) Rate at which job must be completed, determined from the operation sheet.
Route Sheet
Part No. S1243
Part Name: Mounting Bracket
1. Mtl Rm
2. Mill02 5
3. Drl01 4
4. Insp 1
workstation Time(min)
by: T.C. Chang

1 st year / 2014-2015 / Principles of Industrial Eng. Chapter -2 -/ Dr. May G. Kassir
14
Fig. () route sheet and process plan
2-10- Process design techniques
- Process flow analysis is a technique used for evaluating a process in terms of the
sequence of steps from inputs to outputs with the goal of improving its design.
One of the most important tools in process flow analysis is a process flowchart. A
process
- Flow chart is used for viewing the sequence of steps involved in producing the
product and the flow of the product through the process. It is useful for seeing the
totality of the operation and for identifying potential problem areas.
There is no exact format for designing a flowchart. It can be very simple or highly
detailed. The typical symbols used are arrows to represent flows, triangles to
represent decision points, inverted triangles to represent storage of goods, and
rectangles as tasks. Let’s begin by looking at some elements used in developing a
flowchart, as shown in Figure 3-7.
PROCESS PLAN ACE Inc.
Part No. S0125-F
Part Name: HousingOriginal: S.D. Smart Date: 1/1/89Checked: C.S. Good Date: 2/1/89
Material: steel 4340Si
Changes: Date: Approved: T.C. Chang Date: 2/14/89
No. OperationDescription
Workstation Setup Tool Time(Min)
10 Mill bottom surface1 MILL01 see attach#1for illustration
Face mill6 teeth/4" dia
3 setup5 machining
20 Mill top surface MILL01 see attach#1 Face mill6 teeth/4" dia
2 setup6 machining
30 Drill 4 holes DRL02 set on surface1 twist drill1/2" dia2" long
2 setup3 machining

1 st year / 2014-2015 / Principles of Industrial Eng. Chapter -2 -/ Dr. May G. Kassir
15
Fig. 3-7 Elements of flowchart development
2-12- BILL OF MATERIALS (BOM)
— BOM is a listing of all of the raw materials, parts, subassemblies, and assemblies
needed to produce ONE unit of a product. Also it identifies how each end product is
manufactured, specifying all subcomponents items, their sequence of build up, their
quantity in each finished unit and the work-centers performing the buildup sequence.
This information is obtained from product design documents, workflow analysis and
other standard manufacturing information.
— Product structure tree: Visual depiction of the requirements in a bill of materials,
where all components are listed by levels.

1 st year / 2014-2015 / Principles of Industrial Eng. Chapter -2 -/ Dr. May G. Kassir
16
—
Question:
Use the information presented in product structure tree, do the following:
taking into account the quantities on hand (i.e., in inventory) of various components: B
(OH:4); C (OH:10); D (OH:8); E(OH:60)
—
—

1 st year / 2014-2015 / Principles of Industrial Eng. Chapter -2 -/ Dr. May G. Kassir
17
Using the product-tree shown, determine the following:
a) The quantity of component K that will be needed to assemble 80 units of P, assuming
no on-hand inventory exists.
b) The quantity of component K needed to assemble 80 units of P, given on-hand
inventory of 30 A's, 50 B's and 20 C's
The answer:
Product tree with Lead Time

1 st year / 2014-2015 / Principles of Industrial Eng. Chapter -2 -/ Dr. May G. Kassir
18
2-13- SCHEDULING
—Scheduling can be defined as “prescribing of when and where each operation
necessary to manufacture the product is to be performed”. It is also defined as
“establishing of times at which to begin and complete each event or operation
comprising a procedure”. The principle aim of scheduling is to plan the sequence of
work so that production can be systematically arranged towards the end of
completion of all products by due date.
Principles of Scheduling
—1. The principle of optimum task size: Scheduling tends to achieve maximum
efficiency when the task sizes are small, and all tasks of same order of magnitude.
—2. Principle of optimum production plan: The planning should be such that it imposes
an equal load on all plants.
—3. Principle of optimum sequence: Scheduling tends to achieve the maximum
efficiency when the work is planned so that work hours are normally used in the
same sequence.
Inputs to Scheduling
1. Performance standards: The information regarding the performance standards
(standard times for operations) helps to know the capacity in order to assign required
machine hours to the facility.
2. Units in which loading and scheduling is to be expressed.
3. Effective capacity of the work centre.
4. Demand pattern and extent of flexibility to be provided for rush orders.

1 st year / 2014-2015 / Principles of Industrial Eng. Chapter -2 -/ Dr. May G. Kassir
19
5. Overlapping of operations.
6. Individual job schedules.
—