chapter vi: monazite u-pb dating and ar-39ar...
TRANSCRIPT

177
Chapter VI: Monazite U-Pb dating and 40Ar-39Ar
thermochronology of metamorphic events in the Central African
Copperbelt during the Pan-African Lufilian Orogeny1
C. RAINAUD1, S. MASTER1, R. A. ARMSTRONG2, D. PHILLIPS2,3
AND L. J. ROBB1
1Economic Geology Research Institute, School of Geosciences,University of the
Witwatersrand, P. Bag 3, WITS 2050, South Africa. [email protected]
2PRISE, Research School of Earth Sciences, Australian National University,
Canberra, Australia
3Present Address: University of Melbourne, Melbourne, Victoria, Australia
Abstract: New SHRIMP U-Pb age data on metamorphic monazite, as well as
step-heating 40Ar-39Ar ages on metamorphic biotite, muscovite and microcline,
from Katangan meta-sedimentary rocks of the Central African Copperbelt are
presented. These rocks were deformed and metamorphosed during the Pan-
African Lufilian Orogeny. Three samples of metamorphic monazite from the
Chambishi structural basin give ages of 592 ± 22 Ma, 531 ± 12 Ma and 512 ± 17
Ma, which correspond respectively to the ages of eclogite facies metamorphism,
high pressure talc-kyanite whiteschist metamorphism, and of a regional
metamorphism/mineralisation pulse elsewhere within the Lufilian orogen. A
biotite population from Luanshya gives a 40Ar/39Ar plateau age of 586.1 1.7 Ma
coinciding with the oldest monazite age. Several samples from the Chambishi
basin and the Konkola area give 40Ar/39Ar biotite ages in the range of 492 to 450
Ma, and are a manifestation of regional uplift and cooling that affected the whole
Katangan basin. The youngest apparent 40Ar/39Ar ages obtained are from
1 This paper has been submitted to the Journal of African Earth Sciences for the Special Issue (Eds.) Robb, Cailteux, Sutton.

178
microcline at Musoshi and range from 467.0 ± 2.7 Ma to 405.8 3.8 Ma,
reflecting slow cooling.
1. Introduction
This paper is part of a wider geochronological study of the Central African
Copperbelt and its basement. After constraining the nature and evolution of the
basement of the Copperbelt (Rainaud et al. 2003, 2004), the provenance of key
units within the Katangan Sequence and their ages (Master et al. 2004), in this
paper we provide new data dealing with the several metamorphic episodes which
occurred in the Central African Copperbelt during the Lufilian Orogeny, and
discuss their implications for the evolution of the Katangan basin
2. Regional setting
The Katanga Supergroup is the host of the major stratiform sediment-hosted
Cu-Co deposits, as well as numerous other deposits of Cu, Pb, Zn, U, Au, Fe
etc., which constitute the Central African Copperbelt in Zambia and the
Democratic Republic of Congo. This succession is a Neoproterozoic
metasedimentary sequence which consists of the Roan Group, the Nguba
Group, the Fungurume and the Biano Groups (Wendorff, 2001a,b; 2002a,b;
2003a,b; Cailteux, 2003). The lowermost Roan Group was deposited after c. 880
Ma (Armstrong et al., 2004), and is subdivided into the mainly siliciclastic Lower
Roan Subgroup, and the mainly dolomitic and evaporitic Upper Roan Subgroup
(Master et al., 2004). The base of the Nguba Group, the Mwashya Subgroup,
was deposited at around 765 Ma (Key et al., 2001) while porphyritic lavas
attributed to the upper part of the Nguba Group were dated at 735 Ma
(Armstrong, 2000; Liyungu et al., 2001; Key et al., 2001). The Mwashya
Subgroup is overlain by the Grand Conglomerat Member, which is a glacial tillite
179
(Master et al., 2004). Finally, the Fungurume and Biano Groups were deposited
syntectonically in a foreland basin during the Lufilian orogeny, after c. 572 Ma
(Wendorff, 2003a; Master et al., 2004).
The Katangan Supergroup was deformed and metamorphosed during the
Pan-African Zambezi and Lufilian orogenies (Porada and Berhorst, 2000), at
between 600 and 480 Ma. A large number of imprecise U-Pb, Rb-Sr and K-Ar
age data from the Lufilian arc and Zambezi belt, spanning the time period 500 ±
100 Ma are summarised by Cahen et al. (1984). More recently, the Kipushi
deposit was dated at 454 Ma (Walraven and Chabu, 1994) but was also
recalculated at 750 Ma using a three-stage model (Kampunzu et al., 1998). In the
Musoshi district, U-Pb analyses on uraninites yielded ages at 514 Ma (Richards,
1988). Molybdenite from Kansanshi (Zambia) yielded ages of 511, 512 and 503
Ma with the Re-Os technique (Torrealday et al., 2000). Eclogites from Central
Zambia yielded a Sm-Nd isochron at 595 ± 10 Ma (John et al., 2003) while a
phase of high-pressure whiteschist metamorphism yielded a U-Pb monazite age
at 529 ± 2 Ma (John et al., 2004).
3. Analytical methods
40Ar-39Ar analyses were performed at the Research School of Earth Sciences
(RSES), Australian National University, Canberra. Muscovites were separated at
the the Hugh Allsopp Laboratory, University of the Witwatersrand, Johannesburg,
South Africa. Samples were reduced in a jaw crusher and through a pulverizer
into a coarse powder which was then sieved. Extracts were purified at the
Australian National University, using conventional magnetic separation and
heavy liquid techniques. The resulting separates were of ~99% or higher purity.
The 40Ar/39Ar dating technique was described in detail by McDougall and
Harrison (1999). Crystals were placed into an aluminium irradiation canister
together with interspersed aliquots of the flux monitor GA 1550 (age = 98.5 Ma;
180
Spell and McDougall, 2003). Packets containing degassed potassium glass were
placed at either end of the canister to monitor the 40Ar production from potassium
(e.g. Tetley, 1980). The irradiation canister was irradiated for 504 hours in
position X34 of the ANSTO, HIFAR reactor, Lucas Heights, New South Wales,
Australia. The canister, which was lined with 0.2 mm Cd to absorb thermal
neutrons, was inverted three times during the irradiation, which reduced neutron
flux gradients to < 2% along the length of the canister. Mass discrimination was
monitored by analyses of standard air volumes. Correction factors for interfering
reactions are as follows: (40Ar/39Ar)Ca = 3.50(± 0.14)x10-4; (39Ar/37Ar)Ca = 7.86(±
0.01)x10-4 (McDougall and Harrison, 1999); (40Ar/39Ar)K = 0.050 (± 0.005). K/Ca
ratios were determined from the ANU laboratory hornblende standard 77-600
and were calculated as follows: K/Ca = 1.9 x 39Ar/37Ar. The reported data have
been corrected for system blanks, mass discrimination and radioactive decay.
The calculated ages have been additionally corrected for reactor interferences,
fluence gradients and atmospheric contamination. Errors associated with the age
determinations are one sigma uncertainties and include errors in the J-value
estimates. The error on the J-value is ± 0.35 %, excluding the uncertainty in the
age of GA1550 (which is ~ 1%). Decay constants are those of Steiger and Jäger
(1977).
Plateau portions of the age spectra are defined as comprising at least three
contiguous increments, with concordant ages (i.e. ages that are within two sigma
of the mean age). In addition, this segment should contain a significant
proportion of the total 39Ar released (MacDougall, 1999).
U-Pb analyses were performed on the SHRIMP II ion microprobe at The
Australian National University, Canberra. The separation of monazites was
carried out at the Hugh Allsopp Laboratory, Johannesburg, using Wilfley Table,
heavy liquids and isodynamic magnetic separation. The SHRIMP analytical
procedure used in this study is similar to that described by Claoué-Long et al.
(1995). Age calculations and plotting were done using Isoplot/Ex (Ludwig, 2000).
181
4. Sampling
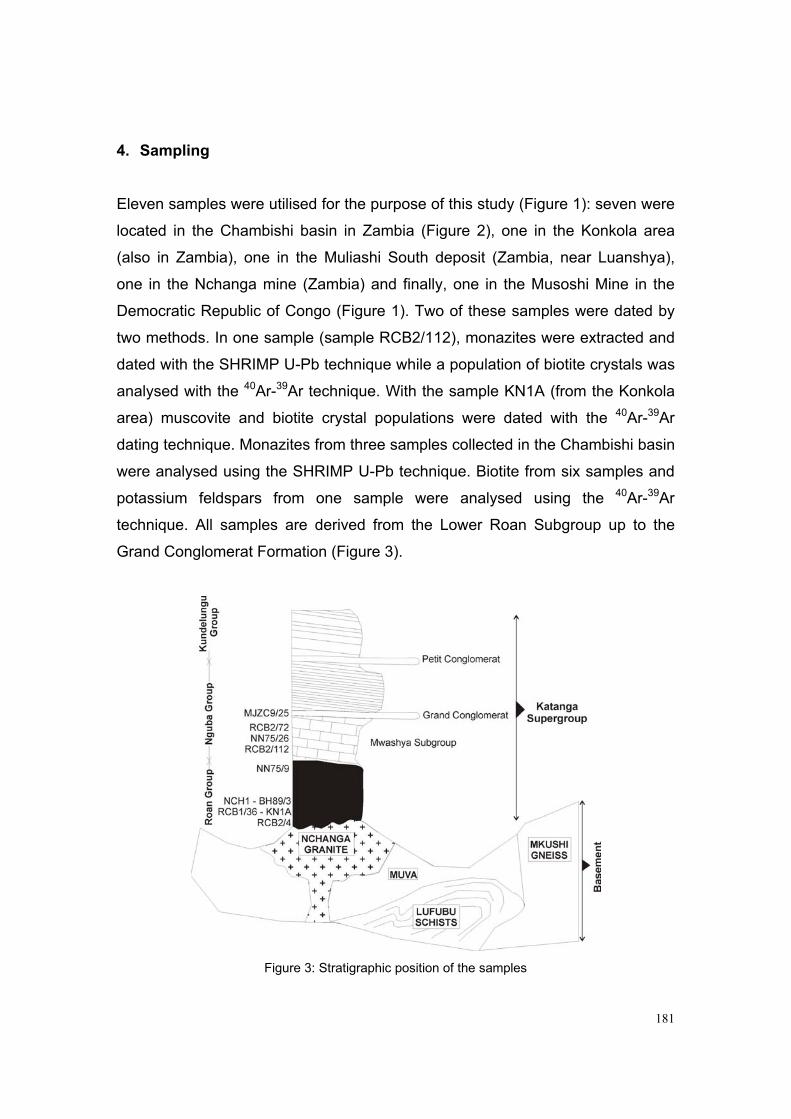
Eleven samples were utilised for the purpose of this study (Figure 1): seven were
located in the Chambishi basin in Zambia (Figure 2), one in the Konkola area
(also in Zambia), one in the Muliashi South deposit (Zambia, near Luanshya),
one in the Nchanga mine (Zambia) and finally, one in the Musoshi Mine in the
Democratic Republic of Congo (Figure 1). Two of these samples were dated by
two methods. In one sample (sample RCB2/112), monazites were extracted and
dated with the SHRIMP U-Pb technique while a population of biotite crystals was
analysed with the 40Ar-39Ar technique. With the sample KN1A (from the Konkola
area) muscovite and biotite crystal populations were dated with the 40Ar-39Ar
dating technique. Monazites from three samples collected in the Chambishi basin
were analysed using the SHRIMP U-Pb technique. Biotite from six samples and
potassium feldspars from one sample were analysed using the 40Ar-39Ar
technique. All samples are derived from the Lower Roan Subgroup up to the
Grand Conglomerat Formation (Figure 3).
Figure 3: Stratigraphic position of the samples

182
Fig
ure
1:
Sim
plif
ied g
eolo
gic
al m
ap o
f th
e C
opp
erb
elt a
nd location o
f sam
ple
s,
after
Fra
nçois
, 19
74.

183
Fig
ure
2:
Sim
plif
ied g
eolo
gic
al m
ap o
f th
e C
ham
bis
hi basin
an
d location o
f drill
hole
s,
aft
er
JIC
A/M
MA
J,
1996.

184
5. Results
Samples analysed and dated in this study yielded several distinct age
ranges. Three samples give an age range between 631.8 ± 1.8 Ma and 586.1
± 1.7 Ma, 6 samples give an age range between 496.6 ± 0.6 Ma and 467.0 ±
2.7 Ma while individual samples give ages of 531 ± 12 Ma and 512 ± 17 Ma.
a. Muliashi South deposit (Luanshya), sample BH89/3, biotite
Borehole BH89 is localised on the southern flank of the Roan Antelope
synclinorium and more precisely on the Muliashi South deposit (Figure 1)
where reserves are estimated at 22 Mt grading at 2.32% Cu (Mbendi, 2002).
This bore hole is 975.36 m deep and reaches the pre-Katangan basement.
Sample BH89/3 is located 743 m below the surface and at 35 m above the
contact between the sedimentary sequence and the pre-Katangan basement.
Stratigraphically, the sample is situated within the Ore Shale Formation at the
base of the Upper Roan Subgroup. It is a biotite–tremolite–quartz schist with
a porphyroblastic texture which also contains bornite and chalcopyrite.
Retrograde metamorphism is reflected by biotite being replaced by chlorite.
Step-heating 39Ar-40Ar was undertaken on a 0.47 mg population of biotite.
Data are reported in a diagram of age versus %39Ar released (Fig. 4 and
Table 1). The first apparent age, connected to a degassing temperature of
600ºC, is 469.5 ± 6.7 Ma and corresponds to 0.934% of the 39Ar released.
The diagram presents two peaks at the temperatures 680ºC and 850ºC with
apparent ages at 602.5 ± 2.8 Ma and 602.2 ± 2.3 Ma respectively. Between
these older apparent ages and for 55.52% of the 39Ar released (equivalent to
5 consecutive increments), the apparent ages vary between 583.3 ± 1.8 Ma
and 588.7 ± 1.5 Ma and yield a plateau age at 586.1 ± 1.7 Ma with a MSWD
at 1.4. The steps following the second peak, at 950ºC and 1050ºC show
similar ages at 596.4 ± 1.8 Ma and 595.9 ± 1.9 Ma. Finally, the step at
1150ºC yielded an apparent age of 575.5 ± 19.1 Ma.

185
Figure 4: Age vs. 39
Ar released diagram, sample BH89/3
Temp Cum40
Ar/39
Ar37
Ar/39
Ar36
Ar/39
Ar Vol. 39
Ar %Rad. Ca/K40
Ar*/39
Ar Age ± 1 .d.
(C)%39
Ar x10-15
mol40
Ar (Ma) (Ma)
Mass = 0.47 mg
J-value = 0.010224 ± 0.000025
600 0.97 39.22 0.0163 0.0342 0.859 74.1 0.0311 29.07 469.5 6.7
680 3.07 42.45 0.0007 0.0122 1.868 91.4 0.0014 38.78 602.5 2.8
720 11.47 38.68 0.0000 0.0035 7.451 97.1 0.0001 37.58 586.6 2.0
740 23.88 38.07 0.0000 0.0010 11.02 99.1 0.0000 37.74 588.7 1.5
760 37.77 37.83 0.0000 0.0015 12.33 98.6 0.0000 37.34 583.3 1.8
780 50.26 37.73 0.0001 0.0006 11.08 99.3 0.0001 37.47 585.2 1.9
800 58.59 38.04 0.0000 0.0015 7.397 98.7 0.0001 37.54 586.0 2.7
850 65.23 39.11 0.0001 0.0010 5.886 99.1 0.0002 38.76 602.2 2.3
950 85.30 38.56 0.0002 0.0006 17.81 99.4 0.0004 38.32 596.4 1.8
1050 99.61 38.70 0.0000 0.0012 12.70 98.9 0.0000 38.28 595.9 1.9
1150 99.96 52.03 0.0339 0.0515 0.314 70.6 0.0645 36.75 575.5 19.1
1300 100.0 230.12 0.2652 0.8582 0.033 -10.2 0.5040 0.00 0.0 0.0
Total 37.17 0.0252 0.0012 88.74 37.80 589.5 2.2
I) Errors are one sigma uncertainties and exclude uncertainties in the J-value.
ii) Data are corrected for mass spectrometer backgrounds, discrimination and radioactive decay.
iii) Interference corrections: (36
Ar/37
Ar)Ca = 3.49E-4; (39
Ar/37
Ar)Ca = 7.86E-4; (40
Ar/39
Ar)K = 0.042
iv) J-values are based on an age of 97.9 Ma for GA-1550 biotite.
Table 1: 40
Ar-39
Ar step-heating analytical results, sample BH89/3 biotite

186
b. Chambishi basin, sample RCB2/72, monazite
Borehole RCB2 is 1840.68 m long and is located at the western limit of the
Chambishi Southeast prospect (Figure 2). It reaches the basal conglomerate
of the Katangan sedimentary sequence. This sample was collected at a
depth of 497 m and is stratigraphically situated in the Mwashya Subgroup.
Sample RCB2/72 is from an iron formation interbedded with an altered tuff
(biotite retrograded to chlorite, quartz and carbonate). Monazites are
anhedral and green, intergrown with biotite or chlorite and clearly of
metamorphic origin. Metamorphic monazites were analysed using the U-Pb
SHRIMP technique. Data are reported in a Tera-Wasserburg diagram, Figure
5 and in Table 2. Analyses plot on a discordia intercepting the concordia
curve. The weighted mean 206Pb/238U age is 592 ± 22 Ma, which is
interpreted as the age of formation of these monazites.
Figure 5: Tera-Wasserburg diagram, sample RCB2/72

187
Grain. U Th Th/U Pb* f206208
Pb/206
Pb/208
Pb/206
Pb/
spot (ppm) (ppm) (ppm) %238
U ±238
U ±238
U ±238
U ±
1.1 167 6380 38.2 180 2.31 0.0299 0.0035 0.0934 0.0093 596 68 575 552.1 178 8676 48.8 245 2.13 0.0304 0.0035 0.0993 0.0096 604 70 610 573.1 204 7301 35.8 266 2.00 0.0388 0.0045 0.1084 0.0103 770 87 664 604.1 223 6832 30.7 207 1.32 0.0317 0.0034 0.0933 0.0083 630 66 575 495.1 193 9422 48.9 293 1.87 0.0337 0.0036 0.0976 0.0090 670 71 600 536.1 220 6847 31.1 209 1.75 0.0320 0.0040 0.0959 0.0101 637 78 590 607.1 261 18329 70.3 436 1.20 0.0261 0.0024 0.0910 0.0071 520 47 561 428.1 178 6465 36.3 170 1.22 0.0278 0.0024 0.0870 0.0065 554 47 538 389.1 161 5571 34.5 151 0.41 0.0285 0.0038 0.0879 0.0100 569 75 543 5910.1 183 9814 53.6 261 0.15 0.0288 0.0022 0.0968 0.0062 574 43 595 3611.1 207 4613 22.3 153 0.51 0.0335 0.0030 0.0994 0.0073 666 59 611 4312.1 288 5824 20.2 188 0.07 0.0319 0.0021 0.0998 0.0056 635 41 613 3313.1 209 5566 26.7 181 0.75 0.0336 0.0027 0.0974 0.0065 668 53 599 3814.1 197 10148 51.6 274 0.06 0.0292 0.0026 0.0959 0.0075 582 52 590 4415.1 181 4330 23.9 137 0.88 0.0322 0.0023 0.0990 0.0060 641 45 608 35
Notes : (1) Uncertainties given at the one level; (2) f206 % denotes the percentage of 206
Pb that is common Pb.
Measured Ratios Apparent Ages (Ma)
Table 2: SHRIMP Th-U-Pb results from monazites, sample RCB2/72
c. Chambishi basin, sample NN75/26, biotite
Borehole NN75 is located in the northeast area of the Chambishi basin,
designated as the Southeast prospect (Figure 2). It is 1033.78 m long, and
penetrates the Katanga Supergroup to reach a granite that forms, together
with the Lufubu schists, the local pre-Katangan basement (Rainaud et al.,
2004). The sample NN75/26 was collected at a depth of 148 m, in a
magnetite-rich iron-formation located 2 metres below a tuffaceous layer in the
Mwashya Subgroup. Between the grains of iron oxides, intergrowths of
chlorite-biotite, calcite and quartz are developed. A population of biotite
crystals, weighing 1.00 mg was analysed by the 39Ar-40Ar technique. Data are
reported in a diagram of age versus %39Ar released (Fig. 6; Table 3). This
diagram presents a hump-shaped 40Ar-39Ar age profile Apparent ages vary
between 53.7 ± 1.0 Ma and 631.8 ± 1.8 Ma for temperatures between 650ºC
and 970ºC. For temperatures between 1000ºC and 1100ºC, apparent ages
vary between 614.7 ± 1.8 Ma and 554.4 ± 3.1 Ma. No plateau age can be
extracted and apparent ages are greater than the ones previously yielded by
other samples.

188
Figure 6: Age vs. 39
Ar released diagram, sample NN75/26
Temp Cum40
Ar/39
Ar37
Ar/39
Ar36
Ar/39
Ar Vol. 39
Ar %Rad. Ca/K40
Ar*/39
Ar Age ± 1 .d.
(C)%39
Ar x10-15
mol40
Ar (Ma) (Ma)
Mass = 1.00 mg
J-value = 0.010209 ± 0.000025
650 11.36 8.55 0.1223 0.0188 42.73 34.6 0.2320 2.96 53.7 1.0
700 13.23 28.33 0.2466 0.0145 7.039 84.8 0.4690 24.04 395.9 3.8
740 16.13 35.16 0.0080 0.0121 10.94 89.7 0.0153 31.54 503.6 3.5
780 18.60 34.69 0.0153 0.0103 9.30 91.1 0.0290 31.58 504.1 3.3
820 23.08 34.12 0.0105 0.0076 16.84 93.3 0.0200 31.84 507.7 1.9
850 28.57 37.80 0.0047 0.0052 20.64 95.8 0.0090 36.23 567.8 1.6
870 35.08 38.84 0.0273 0.0052 24.50 95.9 0.0518 37.25 581.4 3.2
890 40.79 39.82 0.0062 0.0033 21.50 97.5 0.0119 38.80 602.0 1.5
910 47.12 40.58 0.0059 0.0029 23.82 97.8 0.0112 39.70 613.8 2.7
940 56.86 41.49 0.0061 0.0019 36.66 98.5 0.0116 40.88 629.2 1.8
970 70.36 41.67 0.0050 0.0018 50.78 98.6 0.0095 41.08 631.8 1.8
1000 84.49 40.32 0.0028 0.0017 53.17 98.6 0.0054 39.77 614.7 1.8
1050 98.42 37.38 0.0016 0.0023 52.43 98 0.0031 36.65 573.4 1.5
1100 99.96 39.74 0.0168 0.0151 5.803 88.7 0.0319 35.24 554.4 3.1
1150 99.99 253.70 1.5573 0.6235 0.113 27.4 2.9600 69.67 969.2 350.3
1200 100.0 1136.78 56.5702 4.2273 0.024 -9.4 112.00 0.00 0.0 3296
Total 35.69 0.0286 0.0060 376.3 33.87 535.7 2.2
I) Errors are one sigma uncertainties and exclude uncertainties in the J-value.
ii) Data are corrected for mass spectrometer backgrounds, discrimination and radioactive decay.
iii) Interference corrections: (36
Ar/37
Ar)Ca = 3.49E-4; (39
Ar/37
Ar)Ca = 7.86E-4; (40
Ar/39
Ar)K = 0.042
iv) J-values are based on an age of 97.9 Ma for GA-1550 biotite.
Table 3: Data 40
Ar-39
Ar, sample NN75/26 biotite

189
d. Chambishi basin, sample RCB1/36, monazite
Borehole RCB1 is located 5 km west of RCB2 (Figure 2) and is 1686.2 m
deep. RCB1/36 was sampled at 1284 m and is stratigraphically located in the
Upper Roan Subgroup. This sample is metapelite including quartz, biotite
and K-feldspar. As seen previously in sample RCB272, monazites are green,
anhedral and clearly metamorphic. They were extracted and analysed with
the SHRIMP U-Pb technique. Results are reported in Table 4 and presented
in a Tera-Wasserburg concordia diagram in Figure 7. Plots are clustered
near the concordia and the weighted mean yields a 206Pb/238U age of 531 ±
12 Ma. This age is interpreted as the age of formation of the monazites.
Figure 7: Tera-Wasserburg diagram, sample RCB1/36

190
Grain. U Th Th/U Pb* f206208
Pb/206
Pb/208
Pb/206
Pb/
spot (ppm) (ppm) (ppm) %238
U ±238
U ±238
U ±238
U ±
1.1 651.24 4991.4 7.7 166 0.28 0.02647 0.00172 0.08659 0.0048 528 34 535 292.1 1002 1151 1.1 111 0.78 0.0275 0.0018 0.0916 0.0050 549 36 565 293.1 621 2939 4.7 116 0.76 0.0264 0.0024 0.0869 0.0068 527 48 537 414.1 716 5573 7.8 185 0.14 0.0263 0.0011 0.0891 0.0035 524 22 550 205.1 654 4382 6.7 151 0.56 0.0260 0.0012 0.0875 0.0037 519 25 541 226.1 633 4157 6.6 145 0.52 0.0263 0.0012 0.0874 0.0036 524 24 540 217.1 629 2991 4.8 110 0.40 0.0246 0.0013 0.0811 0.0038 491 25 503 228.1 763 4546 6.0 160 0.31 0.0256 0.0015 0.0848 0.0044 511 30 525 269.1 787 4481 5.7 159 0.31 0.0253 0.0013 0.0842 0.0039 505 26 521 2310.1 768 4393 5.7 159 0.19 0.0257 0.0011 0.0866 0.0034 514 22 536 2011.1 848 4629 5.5 172 0.15 0.0262 0.0012 0.0871 0.0035 523 23 538 2112.1 882 4129 4.7 155 0.39 0.0250 0.0017 0.0815 0.0047 498 33 505 2813.1 596 2549 4.3 100 0.79 0.0248 0.0017 0.0832 0.0048 495 33 515 2914.1 740 3777 5.1 134 0.35 0.0246 0.0015 0.0803 0.0043 490 29 498 2615.1 373 5291 14.2 151 0.65 0.0264 0.0016 0.0892 0.0045 527 31 551 27
Notes : (1) Uncertainties given at the one level; (2) f206 % denotes the percentage of 206
Pb that is common Pb.
Measured Ratios Apparent Ages (Ma)
Table 4: SHRIMP Th-U-Pb results from monazites, sample RCB1/36
e. Chambishi basin, sample RCB2/112, monazite
Sample RCB2/112 was taken at a depth of 528 m, in the borehole RCB2.
This sample is a marly dolomitic argillite from the Mwashya Subgroup.
Monazites were analysed with the U-Pb SHRIMP dating technique. Data are
reported in a Tera-Wasserburg concordia diagram (Fig. 8; Table 5). Analyses
plot in a cluster and yield and weighted mean 206Pb/238U at 512 ± 17 Ma. This
age is interpreted as the age of formation of these monazites.
Table 5: SHRIMP Th-U-Pb results from monazites, sample RCB2/112

191
Grain. U Th Th/U Pb* f206208
Pb/206
Pb/208
Pb/206
Pb/
spot (ppm) (ppm) (ppm) %238
U ±238
U ±238
U ±238
U ±
1.1 195 24945 127.9 531 0.53 0.0238 0.0019 0.0829 0.0057 476 37 513 342.1 140 12888 92.0 304 0.97 0.0262 0.0020 0.0877 0.0057 523 39 542 343.1 164 19244 117.1 423 0.38 0.0246 0.0021 0.0841 0.0061 491 41 520 374.1 169 20307 119.9 423 0.59 0.0233 0.0023 0.0781 0.0065 466 45 485 395.1 204 25790 126.4 531 0.58 0.0231 0.0016 0.0763 0.0046 462 31 474 276.1 193 18817 97.3 449 0.39 0.0266 0.0024 0.0898 0.0068 530 46 554 417.1 173 15684 90.7 359 1.25 0.0254 0.0020 0.0836 0.0058 508 40 518 348.1 177 22893 129.4 497 0.52 0.0244 0.0020 0.0824 0.0058 487 39 510 349.1 170 21718 127.7 493 0.73 0.0255 0.0019 0.0860 0.0055 508 37 532 3210.1 136 10044 73.7 224 0.91 0.0246 0.0019 0.0802 0.0055 491 38 497 3311.1 187 23817 127.5 511 0.80 0.0241 0.0017 0.0799 0.0049 481 34 496 2912.1 198 24235 122.2 538 0.63 0.0249 0.0016 0.0853 0.0046 497 31 528 2813.1 222 27096 122.3 554 0.30 0.0229 0.0027 0.0773 0.0080 457 54 480 4814.1 200 24376 122.0 559 0.53 0.0257 0.0019 0.0871 0.0057 513 38 538 3415.1 179 14724 82.3 325 0.66 0.0244 0.0016 0.0820 0.0047 488 32 508 28
Notes : (1) Uncertainties given at the one level; (2) f206 % denotes the percentage of 206
Pb that is common Pb.
Measured Ratios Apparent Ages (Ma)
Table 5: SHRIMP Th-U-Pb results from monazites, sample RCB2/112
f. Chambishi basin, sample RCB2/112, biotite
After obtaining the U-Pb SHRIMP age data on monazites (see above), a
population of biotite grains weighing 0.83 mg was separated. The biotite
grains were dated with the 40Ar-39Ar technique and the results are reported in
Table 6 and the age data plotted in Figure 9. The first step at 650ºC yields a
very young apparent age at 307.2 ± 2.6 Ma. The next two steps at 700ºC and
740ºC produce older ages of 458.3 ± 1.8 Ma and 486.1 ± 1.5 Ma. The next
seven steps, with temperatures between 760ºC and 940ºC, yield apparent
ages between 488.5 ± 1.5 Ma and 494.7 ±1.8 Ma. The extracted plateau age
of this section is of 491.5 ± 1.6 Ma, with a MSWD = 1.7, and corresponds to
66.4% of the 39Ar released. The last section of the spectrum yields two older
apparent ages (at 496.0 ± 1.2 Ma and 497.7 ± 1.4 Ma) and finally a much
younger apparent age at 456.3 ± 8.1 Ma.

192
Figure 9: Age vs. 39
Ar released diagram, sample RCB2/112
Temp Cum40
Ar/39
Ar37
Ar/39
Ar36
Ar/39
Ar Vol. 39
Ar %Rad. Ca/K40
Ar*/39
Ar Age ± 1 .d.
(C)%39
Ar x10-15
mol40
Ar (Ma) (Ma)
Mass = 0.83 mg
J-value = 0.010193 ± 0.000025
650 1.87 26.51 0.2602 0.0280 2.889 68.7 0.4950 18.21 307.2 2.6
700 5.97 33.45 0.1619 0.0170 6.355 84.8 0.3080 28.38 458.3 1.8
740 16.21 31.69 0.0158 0.0044 15.86 95.7 0.0300 30.34 486.1 1.5
760 28.05 31.17 0.0007 0.0015 1.833 98.4 0.0013 30.66 490.7 1.4
780 41.08 30.96 0.0001 0.0013 20.16 98.6 0.0002 30.51 488.5 1.5
800 53.44 31.07 0.0008 0.0011 19.14 98.8 0.0015 30.68 490.9 1.0
820 63.61 30.97 0.0000 0.0006 15.75 99.2 0.0000 30.74 491.7 1.9
840 69.84 31.29 0.0005 0.0017 9.641 98.2 0.0010 30.74 491.8 1.4
870 73.51 31.74 0.0022 0.0025 5.690 97.5 0.0041 30.95 494.7 1.8
940 82.64 31.39 0.0121 0.0016 14.13 98.3 0.0230 30.85 493.3 1.2
1020 95.33 31.54 0.0015 0.0015 19.66 98.4 0.0029 31.05 496.0 1.2
1060 99.65 32.08 0.0083 0.0028 6.678 97.2 0.0158 31.17 497.7 1.4
1300 100.0 45.48 0.1210 0.0582 0.549 62.1 0.2300 28.23 456.3 8.1
Total 31.36 0.0155 0.0031 154.80 30.39 486.8 1.5
I) Errors are one sigma uncertainties and exclude uncertainties in the J-value.
ii) Data are corrected for mass spectrometer backgrounds, discrimination and radioactive decay.
iii) Interference corrections: (36
Ar/37
Ar)Ca = 3.49E-4; (39
Ar/37
Ar)Ca = 7.86E-4; (40
Ar/39
Ar)K = 0.042
iv) J-values are based on an age of 97.9 Ma for GA-1550 biotite.
Table 6: Data 40
Ar-39
Ar, sample RCB2/112 biotite

193
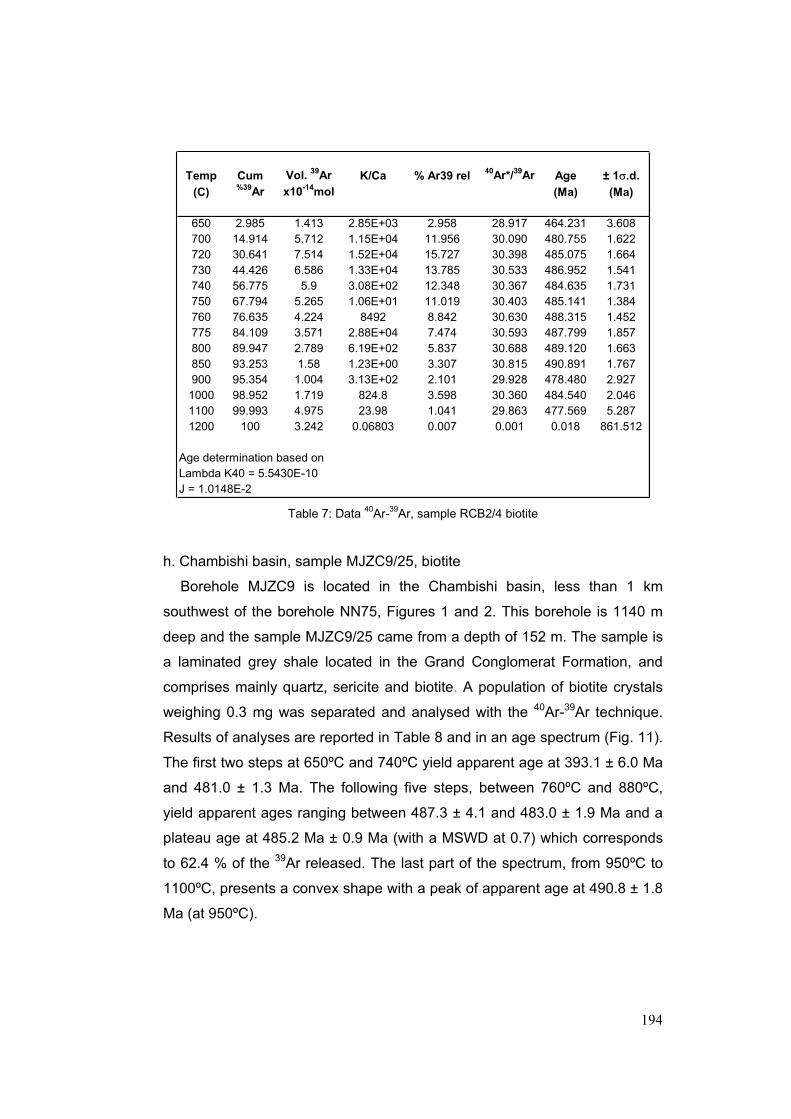
g. Chambishi basin, sample RCB2/4, biotite
This sample is from the Lower Roan Subgroup and was collected at a
depth of 1468 m from borehole RCB2. It is from a 0.5 m thick biotite-bearing
trough-crossbedded sandstone interbedded with conglomerates of the basal
Roan Group. A population of biotite grains from this sample was analysed
and the results are reported in Table 7, and plotted in Figure 10. The two first
steps, at 650 ºC and 700ºC, present apparent ages at 468.3 ± 3.6 Ma and
484.9 ± 1.6 Ma respectively. The following seven steps, for temperatures
between 720ºC and 800 ºC, yield apparent ages ranging from 488.8 ± 1.7 Ma
to 493.4 ± 1.7 Ma. These seven apparent ages yield a plateau age at 490.9 ±
0.6 Ma with a MSWD = 1.2 and with 75% of the 39Ar released. The following
step at 850ºC presents a peak in the apparent ages at 495.2 ± 1.8 Ma. The
last three steps at 900, 1000 and 1200ºC yield apparent ages at,
respectively, 482.6 ± 2.9 Ma, 488.7 ± 2.0 Ma and 481.7 ± 5.3 Ma.
Figure 10: Age vs. 39
Ar released diagram, sample RCB2/4
194
Temp Cum Vol. 39
Ar K/Ca % Ar39 rel40
Ar*/39
Ar Age ± 1 .d.
(C)%39
Ar x10-14
mol (Ma) (Ma)
650 2.985 1.413 2.85E+03 2.958 28.917 464.231 3.608
700 14.914 5.712 1.15E+04 11.956 30.090 480.755 1.622
720 30.641 7.514 1.52E+04 15.727 30.398 485.075 1.664
730 44.426 6.586 1.33E+04 13.785 30.533 486.952 1.541
740 56.775 5.9 3.08E+02 12.348 30.367 484.635 1.731
750 67.794 5.265 1.06E+01 11.019 30.403 485.141 1.384
760 76.635 4.224 8492 8.842 30.630 488.315 1.452
775 84.109 3.571 2.88E+04 7.474 30.593 487.799 1.857
800 89.947 2.789 6.19E+02 5.837 30.688 489.120 1.663
850 93.253 1.58 1.23E+00 3.307 30.815 490.891 1.767
900 95.354 1.004 3.13E+02 2.101 29.928 478.480 2.927
1000 98.952 1.719 824.8 3.598 30.360 484.540 2.046
1100 99.993 4.975 23.98 1.041 29.863 477.569 5.287
1200 100 3.242 0.06803 0.007 0.001 0.018 861.512
Age determination based on
Lambda K40 = 5.5430E-10
J = 1.0148E-2
Table 7: Data 40
Ar-39
Ar, sample RCB2/4 biotite
h. Chambishi basin, sample MJZC9/25, biotite
Borehole MJZC9 is located in the Chambishi basin, less than 1 km
southwest of the borehole NN75, Figures 1 and 2. This borehole is 1140 m
deep and the sample MJZC9/25 came from a depth of 152 m. The sample is
a laminated grey shale located in the Grand Conglomerat Formation, and
comprises mainly quartz, sericite and biotite. A population of biotite crystals
weighing 0.3 mg was separated and analysed with the 40Ar-39Ar technique.
Results of analyses are reported in Table 8 and in an age spectrum (Fig. 11).
The first two steps at 650ºC and 740ºC yield apparent age at 393.1 ± 6.0 Ma
and 481.0 ± 1.3 Ma. The following five steps, between 760ºC and 880ºC,
yield apparent ages ranging between 487.3 ± 4.1 and 483.0 ± 1.9 Ma and a
plateau age at 485.2 Ma ± 0.9 Ma (with a MSWD at 0.7) which corresponds
to 62.4 % of the 39Ar released. The last part of the spectrum, from 950ºC to
1100ºC, presents a convex shape with a peak of apparent age at 490.8 ± 1.8
Ma (at 950ºC).

195
Figure 11: Age vs. 39
Ar released diagram, sample MJZC9/25
Temp Cum40
Ar/39
Ar37
Ar/39
Ar36
Ar/39
Ar Vol. 39
Ar %Rad. Ca/K40
Ar*/39
Ar Age ± 1 .d.
(C)%39
Ar x10-15
mol40
Ar (Ma) (Ma)
Mass = 0.30 mg
J-value = 0.010213 ± 0.000025
650 1.59 37.07 0.2485 0.0447 0.700 64.3 0.4720 23.84 393.1 6.0
740 19.72 32.73 0.1104 0.0094 7.953 91.4 0.2100 29.92 481.0 1.3
760 37.57 30.95 0.0013 0.0023 7.831 97.6 0.0025 30.21 485.1 2.3
780 54.53 30.63 0.0001 0.0008 7.443 99.0 0.0002 30.34 486.9 1.8
800 67.96 30.65 0.0003 0.0018 5.892 98.1 0.0006 30.06 483.0 1.9
830 77.07 30.91 0.0014 0.0022 3.996 97.7 0.0027 30.20 485.0 1.9
880 82.11 31.83 0.0002 0.0047 2.209 95.4 0.0004 30.37 487.3 4.1
950 90.40 31.62 0.0026 0.0032 3.640 96.8 0.0050 30.61 490.8 1.8
1020 98.10 31.37 0.0013 0.0044 3.376 95.7 0.0024 30.03 482.6 2.0
1100 99.87 35.57 0.0219 0.0198 0.777 83.4 0.0417 29.68 477.6 4.2
1200 99.93 145.75 0.4444 0.5485 0.027 -11.2 0.8450 0.00 0.0 215
1350 100.0 366.26 0.4715 1.2328 0.031 0.5 0.8960 1.77 32.3 804
Total 31.80 0.0257 0.0058 43.87 30.04 482.7 2.8
I) Errors are one sigma uncertainties and exclude uncertainties in the J-value.
ii) Data are corrected for mass spectrometer backgrounds, discrimination and radioactive decay.
iii) Interference corrections: (36
Ar/37
Ar)Ca = 3.49E-4; (39
Ar/37
Ar)Ca = 7.86E-4; (40
Ar/39
Ar)K = 0.042
iv) J-values are based on an age of 97.9 Ma for GA-1550 biotite.
Table 8: Data 40
Ar-39
Ar, sample MJZC9/25 biotite

196
i. Chambishi basin, sample NN75/9, biotite
Sample NN75/9 was taken at a depth of 893.6 m in borehole NN75, in the
Chambishi Basin. It is located in the hangingwall of the orebody, in the Ore
Shale Formation of the Upper Roan Subgroup. This sample is a rippled white
dolarenite with specks of metamorphic biotite. A population of biotite crystals
weighing 0.44 mg was analysed. The results are reported in Table 9 and in
an age versus %39Ar released diagram (Fig. 12). The age spectrum presents
two young apparent ages (456.4 ± 13.1 and 459.8 ± 6.0 Ma) at the first two
temperature steps (600ºC and 680ºC). The following step at 720ºC yields an
apparent age at 480.8 ± 3.6 Ma. Apparent ages from step 4 (at 760ºC) to
step 12 (at 1300ºC) vary from 491.0 ± 1.6 Ma to 485.4 ± 1.9 Ma. These 9
steps yield, with 97.1% of 39Ar released, a plateau age at 488.0 ± 0.5 Ma with
a MSWD at 1.5.
Figure 12: Age vs. 39
Ar released diagram, sample NN75/9

197
Temp Cum40
Ar/39
Ar37
Ar/39
Ar36
Ar/39
Ar Vol. 39
Ar %Rad. Ca/K40
Ar*/39
Ar Age ± 1 .d.
(C)%39
Ar x10-15
mol40
Ar (Ma) (Ma)
Mass = 0.44 mg
J-value = 0.010238 ± 0.000036
600 0.17 51.98 0.2250 0.0806 0.175 54.1 0.4280 28.12 456.4 13.1
680 0.76 38.51 0.1877 0.0343 0.593 73.6 0.3570 28.35 459.8 6.0
720 2.94 32.85 0.0613 0.0100 2.215 90.8 0.1160 29.83 480.8 3.6
760 11.0 31.57 0.0013 0.0043 8.168 95.8 0.0025 30.26 486.8 1.3
780 20.7 31.42 0.0000 0.0027 9.893 97.3 0.0000 30.56 491.0 1.6
800 31.3 31.01 0.0000 0.0021 10.73 97.8 0.0000 30.31 487.5 2.2
830 42.4 30.69 0.0000 0.0014 11.26 98.5 0.0000 30.23 486.4 1.6
860 50.8 30.90 0.0000 0.0023 8.504 97.6 0.0001 30.16 485.4 1.9
900 57.1 31.21 0.0007 0.0029 6.422 97.1 0.0014 30.29 487.3 1.2
960 61.4 31.44 0.0004 0.0039 4.345 96.2 0.0007 30.24 486.5 1.7
1050 76.4 31.06 0.0000 0.0016 15.24 98.2 0.0000 30.51 490.4 1.2
1300 100.0 31.00 0.0000 0.0019 23.94 98.0 0.0000 30.38 488.5 2.0
Total 31.20 0.0030 0.0028 101.50 30.32 487.8 1.8
I) Errors are one sigma uncertainties and exclude uncertainties in the J-value.
ii) Data are corrected for mass spectrometer backgrounds, discrimination and radioactive decay.
iii) Interference corrections: (36
Ar/37
Ar)Ca = 3.49E-4; (39
Ar/37
Ar)Ca = 7.86E-4; (40
Ar/39
Ar)K = 0.042
iv) J-values are based on an age of 97.9 Ma for GA-1550 biotite.
Table 9: Data 40
Ar-39
Ar, sample NN75/9 biotite
j. Nchanga, sample NCH1, biotite
Sample NCH1ample comes from the lower orebody from Nchanga Mine,
in the so-called “Lower Banded Shale” or “LBS” unit, corresponding to the
Orebody Formation of the basal Upper Roan Subgroup. It is a graphitic
siltstone with quartz, K-feldspar, detrital muscovite and metamorphic biotite.
A population of biotite crystals weighing 0.81 mg was analysed with the
40Ar/39Ar technique. Results of analyses are reported in an age versus %39Ar
released, Figure 13 and in Table 10. The first step at 650ºC, yields a younger
apparent age at 435.3 ± 2.7 Ma. The steps at 1060ºC and at 1120ºC steps
were lost during manipulation. Steps before and after the loss are similar
within error at 487.7 ± 1.3 Ma and 489.3 ± 3.1 Ma.

198
Figure 13: Age vs. 39
Ar released diagram, sample NCH1
Temp Cum40
Ar/39
Ar37
Ar/39
Ar36
Ar/39
Ar Vol. 39
Ar %Rad. Ca/K40
Ar*/39
Ar Age ± 1 .d.
(C)%39
Ar x10-15
mol40
Ar (Ma) (Ma)
Mass = 0.81 mg
J-value = 0.010183 ± 0.000025
650 2.02 28.46 0.0002 0.0055 11.43 94.2 0.0003 26.80 435.3 2.7
720 4.81 32.48 0.0010 0.0035 15.75 96.6 0.0019 31.39 500.4 2.1
780 8.91 31.88 0.0001 0.0017 23.12 98.3 0.0002 31.35 499.8 2.5
820 12.99 31.52 0.0015 0.0017 23.06 98.2 0.0029 30.96 494.4 1.7
850 17.87 30.81 0.0009 0.0011 27.57 98.8 0.0018 30.44 487.1 1.2
880 22.83 30.56 0.0004 0.0010 28.03 98.9 0.0008 30.22 484.0 1.3
910 31.02 30.46 0.0000 0.0007 46.23 99.2 0.0001 30.21 483.9 1.3
940 37.85 30.91 0.0002 0.0010 38.56 98.9 0.0004 30.57 488.9 1.2
980 46.43 30.88 0.0000 0.0012 48.45 98.7 0.0001 30.48 487.7 1.3
1060 67.91 20.71 0.0000 0.0010 121.3 98.4 0.0000 20.38 340.3 1.0
1120 96.88 15.35 0.0000 0.0006 163.7 98.5 0.0000 15.11 258.2 1.5
1180 99.72 34.57 0.0001 0.0133 16.04 88.5 0.0002 30.60 489.3 3.1
1250 100.0 87.24 0.0256 0.1924 1.56 34.8 0.0486 30.36 485.9 20.1
Total 24.47 0.0003 0.0020 564.8 23.84 392.0 1.5
I) Errors are one sigma uncertainties and exclude uncertainties in the J-value.
ii) Data are corrected for mass spectrometer backgrounds, discrimination and radioactive decay.
iii) Interference corrections: (36
Ar/37
Ar)Ca = 3.49E-4; (39
Ar/37
Ar)Ca = 7.86E-4; (40
Ar/39
Ar)K = 0.042
iv) J-values are based on an age of 97.9 Ma for GA-1550 biotite.
Table 10: Data 40
Ar-39
Ar, sample NCH1 biotite

199
k. Konkola, sample KN1A, biotite and muscovite
Sample KN1A comes from the Konkola area, northern Zambia.
Stratigraphically, it is located in the Lower Roan Subgroup. The sample is a
greenish siltstone including mainly quartz, biotite and muscovite with minor
K-feldspar. Analyses of 39Ar-40Ar were done on a population of biotite grains,
as well as on a separate population of muscovite grains from the same
sample.
Biotite: Results of analyses of a biotite population weighing 0.38 mg
are reported in Figure 14 and Table 11. The first step at 600°C yielded
a young apparent age at 181.6 ± 5.2 Ma (corresponding to 1.57% of
39Ar released). The second apparent age, at 700°C, is older, at 483.7
± 1.7 Ma (corresponding to 12.68% of the 39Ar released). The five
following steps, for temperatures between 740°C and 850°C, give a
plateau age at 496.6 ± 0.6 Ma (MSWD = 0.45, 61.5% of 39Ar released)
and apparent ages varying between 497.3 ± 1.3 Ma and 494.0 ± 2.1
Ma. The two next steps at temperatures of 920°C and 1100°C yield
older apparent ages at 503.2 ± 3.2 Ma and 515.1 ± 2.1 Ma
respectively (for a total of 24.0% of 39Ar released). Finally the last step,
at 1300°C, yielded a younger apparent age at 342.7 ± 47.7 Ma but
corresponds to only 0.22% of the 39Ar released.

200
Figure 14: Age vs. 39
Ar released diagram, sample KN1A biotite
Temp Cum40
Ar/39
Ar37
Ar/39
Ar36
Ar/39
Ar Vol. 39
Ar %Rad. Ca/K40
Ar*/39
Ar Age ± 1 .d.
(C)%39
Ar x10-15
mol40
Ar (Ma) (Ma)
Mass = 0.38mg
J-value = 0.010256 ± 0.000025
600 1.57 19.85 0.0513 0.0320 1.197 52.0 0.0975 10.33 181.6 5.2
700 14.25 33.18 0.0763 0.0107 9.701 90.3 0.1450 29.98 483.7 1.7
740 31.52 31.43 0.0027 0.0016 13.21 98.3 0.0052 30.90 496.6 1.4
760 46.29 31.31 0.0000 0.0012 11.29 98.6 0.0000 30.88 496.3 1.4
780 58.84 31.40 0.0000 0.0014 9.595 98.4 0.0001 30.92 496.9 1.3
810 70.22 31.37 0.0007 0.0012 8.709 98.7 0.0013 30.95 497.3 1.3
850 75.76 31.60 0.0023 0.0028 4.231 97.2 0.0044 30.72 494.0 2.1
920 82.26 32.46 0.0042 0.0035 4.972 96.7 0.0080 31.37 503.2 3.2
1100 99.78 33.05 0.0033 0.0026 13.40 97.5 0.0064 32.22 515.1 2.1
1300 100.0 85.75 0.1986 0.2210 0.168 23.8 0.3770 20.40 342.7 47.7
Total 31.92 0.0125 0.0040 76.48 30.69 493.7 1.9
I) Errors are one sigma uncertainties and exclude uncertainties in the J-value.
ii) Data are corrected for mass spectrometer backgrounds, discrimination and radioactive decay.
iii) Interference corrections: (36
Ar/37
Ar)Ca = 3.49E-4; (39
Ar/37
Ar)Ca = 7.86E-4; (40
Ar/39
Ar)K = 0.042
iv) J-values are based on an age of 97.9 Ma for GA-1550 biotite.
Table 11: Data 40
Ar-39
Ar, sample KN1A biotite
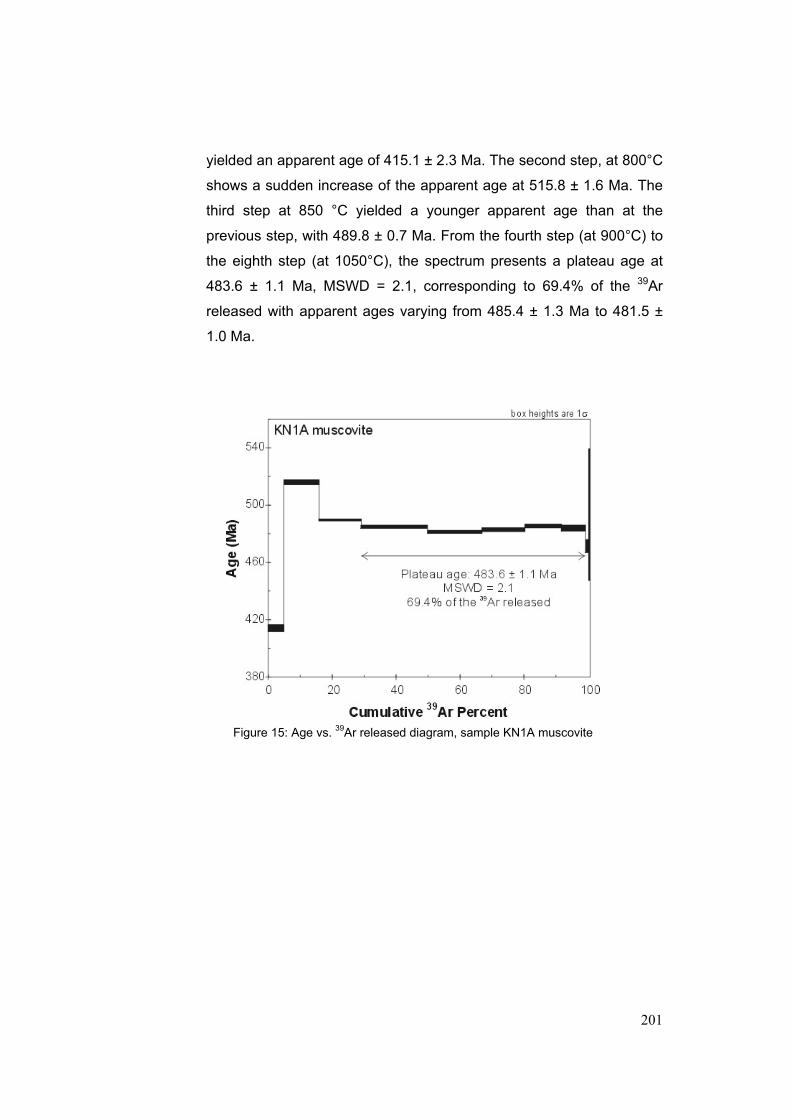
Muscovite: A population of muscovite crystals weighing 0.58 mg was
analysed. Results are reported in an age spectrum diagram, Figure 15
and Table 12. The first step at 700°C, with 5.45% of 39Ar released,
201
yielded an apparent age of 415.1 ± 2.3 Ma. The second step, at 800°C
shows a sudden increase of the apparent age at 515.8 ± 1.6 Ma. The
third step at 850 °C yielded a younger apparent age than at the
previous step, with 489.8 ± 0.7 Ma. From the fourth step (at 900°C) to
the eighth step (at 1050°C), the spectrum presents a plateau age at
483.6 ± 1.1 Ma, MSWD = 2.1, corresponding to 69.4% of the 39Ar
released with apparent ages varying from 485.4 ± 1.3 Ma to 481.5 ±
1.0 Ma.
Figure 15: Age vs. 39
Ar released diagram, sample KN1A muscovite
202
Temp Cum40
Ar/39
Ar37
Ar/39
Ar36
Ar/39
Ar Vol. 39
Ar %Rad. Ca/K40
Ar*/39
Ar Age ± 1 .d.
(C)%39
Ar x10-15
mol40
Ar (Ma) (Ma)
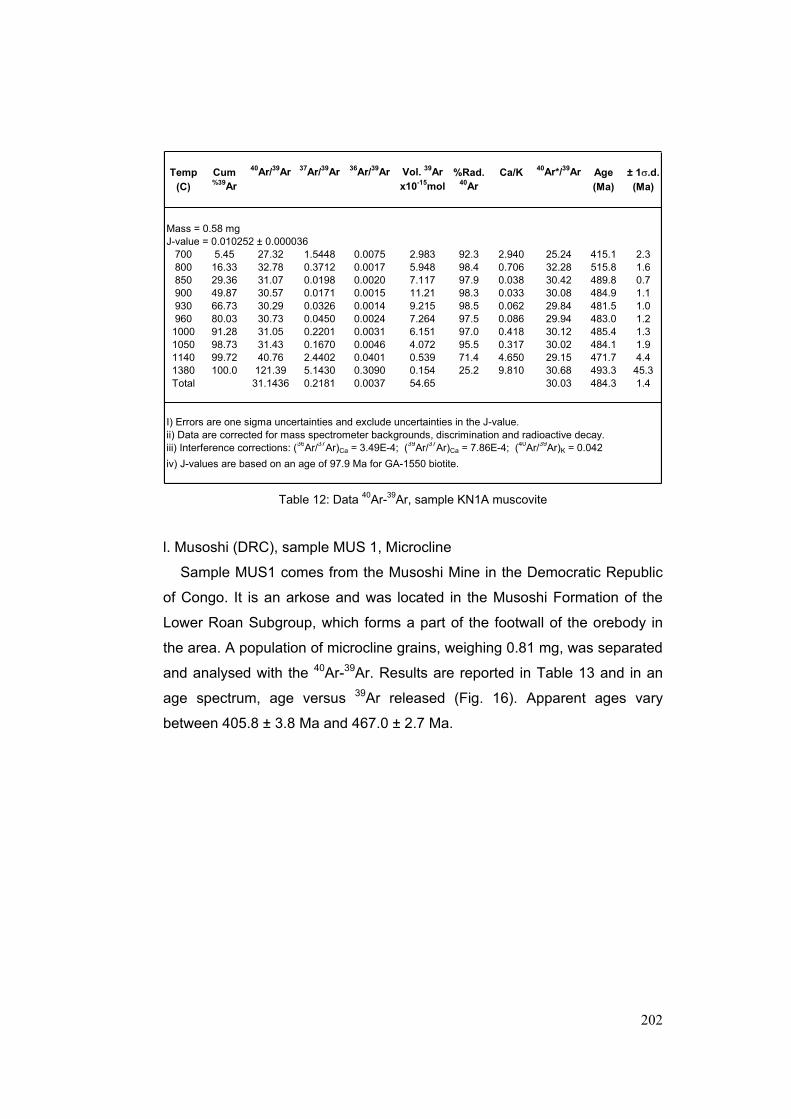
Mass = 0.58 mg
J-value = 0.010252 ± 0.000036
700 5.45 27.32 1.5448 0.0075 2.983 92.3 2.940 25.24 415.1 2.3
800 16.33 32.78 0.3712 0.0017 5.948 98.4 0.706 32.28 515.8 1.6
850 29.36 31.07 0.0198 0.0020 7.117 97.9 0.038 30.42 489.8 0.7
900 49.87 30.57 0.0171 0.0015 11.21 98.3 0.033 30.08 484.9 1.1
930 66.73 30.29 0.0326 0.0014 9.215 98.5 0.062 29.84 481.5 1.0
960 80.03 30.73 0.0450 0.0024 7.264 97.5 0.086 29.94 483.0 1.2
1000 91.28 31.05 0.2201 0.0031 6.151 97.0 0.418 30.12 485.4 1.3
1050 98.73 31.43 0.1670 0.0046 4.072 95.5 0.317 30.02 484.1 1.9
1140 99.72 40.76 2.4402 0.0401 0.539 71.4 4.650 29.15 471.7 4.4
1380 100.0 121.39 5.1430 0.3090 0.154 25.2 9.810 30.68 493.3 45.3
Total 31.1436 0.2181 0.0037 54.65 30.03 484.3 1.4
I) Errors are one sigma uncertainties and exclude uncertainties in the J-value.
ii) Data are corrected for mass spectrometer backgrounds, discrimination and radioactive decay.
iii) Interference corrections: (36
Ar/37
Ar)Ca = 3.49E-4; (39
Ar/37
Ar)Ca = 7.86E-4; (40
Ar/39
Ar)K = 0.042
iv) J-values are based on an age of 97.9 Ma for GA-1550 biotite.
Table 12: Data 40
Ar-39
Ar, sample KN1A muscovite
l. Musoshi (DRC), sample MUS 1, Microcline
Sample MUS1 comes from the Musoshi Mine in the Democratic Republic
of Congo. It is an arkose and was located in the Musoshi Formation of the
Lower Roan Subgroup, which forms a part of the footwall of the orebody in
the area. A population of microcline grains, weighing 0.81 mg, was separated
and analysed with the 40Ar-39Ar. Results are reported in Table 13 and in an
age spectrum, age versus 39Ar released (Fig. 16). Apparent ages vary
between 405.8 ± 3.8 Ma and 467.0 ± 2.7 Ma.

203
Figure 16: Age vs. 39
Ar released diagram, sample MUS1
Temp Cum40
Ar/39
Ar37
Ar/39
Ar36
Ar/39
Ar Vol. 39
Ar %Rad. Ca/K40
Ar*/39
Ar Age ± 1 .d.
(C)%39
Ar x10-15
mol40
Ar (Ma) (Ma)
Mass = 0.30 mg
J-value = 0.010188 ± 0.000025
650 1.66 30.33 0.0063 0.0187 1.287 81.6 0.0119 24.76 405.8 3.8
750 6.68 27.93 0.0001 0.0055 3.878 93.9 0.0001 26.23 427.3 2.8
840 12.79 28.28 0.0000 0.0035 4.728 96.2 0.0001 27.19 441.1 2.2
900 17.46 28.92 0.0009 0.0036 3.606 96.1 0.0016 27.79 449.8 2.4
950 21.65 28.64 0.0010 0.0043 3.243 95.4 0.0019 27.32 442.9 1.5
1000 26.78 28.73 0.0001 0.0040 3.964 95.7 0.0001 27.50 445.6 1.8
1050 33.42 28.34 0.0004 0.0034 5.137 96.3 0.0007 27.29 442.6 2.2
1100 41.94 28.55 0.0000 0.0031 6.589 96.6 0.0001 27.58 446.8 1.8
1150 56.54 28.48 0.0002 0.0024 11.29 97.3 0.0003 27.72 448.8 2.4
1175 69.76 28.54 0.0000 0.0024 10.22 97.3 0.0001 27.75 449.2 1.3
1200 83.91 28.67 0.0000 0.0014 10.95 98.3 0.0000 28.21 455.7 1.3
1225 93.35 29.32 0.0004 0.0027 7.303 97.1 0.0007 28.47 459.4 1.9
1260 97.14 30.45 0.0001 0.0059 2.927 94.1 0.0002 28.66 462.2 2.3
1300 98.90 33.81 0.0014 0.0161 1.358 85.8 0.0026 29.00 467.0 2.7
1350 99.60 45.54 0.0045 0.0590 0.547 61.6 0.0086 28.05 453.5 7.4
1400 100.0 60.90 0.0127 0.1179 0.306 42.7 0.0242 26.03 424.3 8.6
Total 29.05 0.0004 0.0043 77.32 27.70 448.4 2.0
I) Errors are one sigma uncertainties and exclude uncertainties in the J-value.
ii) Data are corrected for mass spectrometer backgrounds, discrimination and radioactive decay.
iii) Interference corrections: (36
Ar/37
Ar)Ca = 3.49E-4; (39
Ar/37
Ar)Ca = 7.86E-4; (40
Ar/39
Ar)K = 0.042
iv) J-values are based on an age of 97.9 Ma for GA-1550 biotite.
Table 13: Data 40
Ar-39
Ar, sample MUS1 microcline

204
6. Discussion
The deposition of the Katangan sequence started somewhere after 877
Ma (Armstrong et al., 2004) and finished sometime after 572 Ma (Master et
al., 2004). Following deposition, the Katangan sedimentary sequence
underwent several episodes of metamorphism during the Lufilian Orogeny
which gave the Copperbelt its arcuate shape.
a. Geochronology
40Ar-39Ar analyses of all biotite, muscovite and microcline samples yielded
degassing patterns with well-known features. All the samples showed very
young apparent ages associated with low temperatures of degassing. These
young apparent ages can be related to the release of the argon located in the
external least retentive sites of the minerals. The energy necessary to
release the argon in these sites is minimal and the slightest thermal
disturbance could produce a loss of argon (Hanes, 1991). A common feature
in biotite degassing patterns is the presence of two peaks in the apparent
ages at 680°C and 850°C. The first peak at around 650°C represents
released argon related to a stage of dehydroxylation of the biotite, while the
second peak at 850°C can be related to one phase of dehydroxylation of
chlorite (Lo and Onstott, 1989).
The interest of using two methods of analyses lies in the difference of their
closure temperatures. For the biotite and muscovite and in the case of 40Ar-
39Ar analyses, closure temperatures are between 300-400°C. For monazite in
U-Pb analyses, Parrish (1990) evaluated the closure temperature at 725 ± 25
°C, while more recent studies (Cherniak et al., 2002) estimate it at more than
900 °C. Hence, ages obtained for analyses on monazite give the age of
crystallisation of these minerals or the age of a metamorphic event in the
case of overgrowths. As seen in the samples analysed, monazites commonly
do not lie on the Concordia curve. This behaviour is attributed to the
presence of excess 206Pb formed by the initial incorporation of 230Th
(Heaman and Parrish, 1991). Ages obtained using the 39Ar-40Ar technique

205
are not as straightforward to interpret. While a plateau age gives the age of a
metamorphic event, in general, ages produced with the 39Ar-40Ar technique
commonly generate problems of interpretation.
In this study, ten populations of of biotite, muscovite and microcline grains
were analysed using the 39Ar-40Ar technique. Out of these ten samples, three
(NN75/26, NCH1 and MUS1) do not yield plateau ages as defined by
MacDougall (1999). In this section we discuss the provisos related to the
interpretation of these three samples. Sample NN75/26, which was collected
from an iron formation located 2 m below a tuffaceous layer, yielded a hump-
shaped curve on an age vs %39Ar released diagram, with apparent ages
ranging from 53.7 ± 1.0 Ma to 631.8 ± 1.8 Ma, which implies a thermal
disturbance of the system (Lo and Onstott, 1989; Di Vicenzo et al., 2003).
The maximum apparent ages of this sample are significantly older than ages
yielded by other samples from this area and from this drill hole. The 631.8 ±
1.8 Ma apparent age is the highest recorded during this study but is difficult
to interpret because it occurs without the presence of a plateau age. Still, this
age can be found elsewhere in the Lufilian arc (Cosi et al., 1992). One
plausible explanation for the disturbed age spectrum yielded by the sample
NN75/26 is the incorporation of an excess of argon in the biotite. It is difficult
to pin-point the cause of this excess. The emplacement of the tuffaceous
layer below which the sample was extracted cannot explain this argon
excess. The temperatures involved were too low and the thermal effects on
the surrounding rocks were minimal. Although the biotite was separated with
extreme care in order to obtain pristine biotite, it is possible that some
chloritised biotite may have been included in the analysed population of
grains. The excess of argon may then have been associated with the chlorite
(Lo and Onstott, 1989). Problems with the sample NCH1 from Nchanga Mine
were purely technical and induced a partial loss of argon. It should be noted
that the apparent age before the loss, 487.7 ± 1.3 Ma, is similar within error,
to the apparent age following the lost step due to the technical problem, at
489.3 ± 3.1 Ma. Finally, microclines (from sample MUS1) were also analysed
206
with the 39Ar-40Ar technique. This sample does not yield a plateau age but
rather some gradually increasing apparent ages between 405.8 ± 3.8 Ma and
467.0 ± 2.7 Ma. It is not uncommon to find these age spectra for potassium
feldspars. These minerals do not have one closure temperature but a range
of closure temperatures ranging from 350°C to 125°C (Foland, 1974; Purdy
and Jäger, 1976; Harrison and McDougall, 1982; Lovera et al., 1989). A
spectrum without a plateau ages may imply a slow cooling but it is difficult to
quantify the rate at which it occurs without a complete 40Ar-39Ar study of K-
feldspars from the area.
b. Regional implications
In the present study, Ar-Ar and U-Pb SHRIMP analyses were performed
on several samples collected from a stratigraphic succession extending from
the Lower Roan Formation to the Grand Conglomerat Formation. A summary
of the ages obtained in this study is given in Table 14. The ages obtained do
not represent a continuum but rather several distinct groupings. Three
samples yielded ages between 631.8 ± 1.8 and 592 ± 22 Ma. This age span
is recorded in other parts of the Central African Copperbelt and in the Irumide
belt. In central Zambia, a Sm-Nd age of 595 ± 10 Ma on garnet and whole
rock, dated a phase of eclogite facies metamorphism (John et al., 2003). In
the Zambian Copperbelt, Re-Os analyses on rocks from the Nkana,
Chibuluma and Nchanga deposits yielded an isochron at 583 ± 24 Ma (Barra
et al., 2004). U-Th-Pb analyses on monazites from the Luiswishi Cu-Co-U
deposits in the Democratic of Congo showed ages comprised between 603 ±
31 Ma and 556 ± 29 Ma (Lerouge et al., 2004). Finally, a date of 582 ± 40 Ma
was obtained for the Kafue Rhyolite with the Rb-Sr technique (Cahen, 1984).
The age at 531 ± 12 Ma obtained in this study with the U-Pb technique on
metamorphic monazites from the Chambishi basin is similar to others found
elsewhere in the Lufilian arc and the Zambezi belt. Monazite from a biotite-
kyanite-garnet gneiss showed U-Pb age of 529 ± 2 Ma while the same
minerals from some whiteschists yielded 207Pb/235U ages of 531 to 532 ± 2

207
Ma (John et al., 2004). Molybdenite from the Nkana deposit yielded an age of
525.7 ± 3.4 Ma with the Re-Os technique (Barra et al., 2004). In central
U-Pb technique
Sample name Mineral Plateau age Age (Ma)
RCB2/72 monazite N/A 592 ± 22
RCB1/36 monazite N/A 531 ± 12
RCB2/112 monazite N/A 512 ± 17
40Ar-
39Ar technique
Sample name
BH89/3 biotite yes 586.1 ± 1.7
NN75/26 biotite no between 53.7 ± 1.0 and 631.8 ± 1.8
RCB2/112 biotite yes 491.5 ± 1.6
RCB2/4 biotite yes 490.9 ± 0.6
MJZC9/25 biotite yes 485.2 ± 0.9
NN75/9 biotite yes 488.0 ± 0.5
NCH1 biotite no between 435.3 ± 2.7 and 499.8 ± 2.5
KN1A biotite yes 496.6 ± 0.6
KN1A muscovite yes 483.6 ± 1.1
MUS1 microcline no between 405.8 ± 3.8 and 467.0 ± 2.7
Table 14: Summary of the ages obtained
Zambia, an unfolded rhyolite in the Katangan sedimentary sequence was
dated with the U-Pb zircon leaching technique at 538.0 ± 1.5 Ma (Hanson et
al., 1993). Recent U-Th-Pb analyses on monazites of sediments from the
Luiswishi deposit yielded an age of 556 ± 29 Ma (Lerouge et al., 2004).
Finally, analyses on monazites and rutiles from the Kalumbila deposit in
northwest Zambia yielded U-Pb ages of 548.6 ± 7.6 Ma and 531 ± 21 Ma
respectively (Steven et Armstrong, 2003). The age of 512 ± 17 Ma, obtained
from the last set of analysed monazites (RCB1/36), was also found
elsewhere in the Copperbelt. Richards et al. (1988a and b) analysed rutiles
and uraninites associated with veining crosscutting the ore body of the
Musoshi deposit. The ages for rutile and uraninite are identical with 514 ± 2
Ma and 514 ± 3 Ma. More recently, Re-Os and U-Pb analyses of respectively
molybdenite and monazite yielded ages of 511.8 ± 1.7 Ma (molybdenite),
512.9 ± 1.7 Ma (molybdenite) and 509 ± 11 Ma (monazite) (Torrealday et al.,
2000).

208
Finally, the last and largest set of samples yielded the youngest age
range, between 467.0 ± 2.7 Ma and 496.6 ± 0.6 Ma. Similar ages are widely
recorded in the Copperbelt and adjacent areas. In the Domes area, west of
the Zambian Copperbelt, Cosi et al. (1992) obtained a large set of K-Ar and
Rb-Sr ages ranging from 475 ± 6 Ma to 492 ± 6 Ma. Furthermore, Cahen et
Snelling (1971) obtained a K-Ar age of 483 ± 15 Ma for lavas located in the
Kibambale area as well as K-Ar biotite ages from Nkana, Nchanga and
Kinsenda ranging between 495 and 422 Ma.
During the Neoproterozoic, at c. 750-730 Ma, the southern part of the
Congo Craton underwent rifting during the opening of the Khomas ocean
(Hoffman, 1994). Damaran and Katangan sedimentary rocks were deposited
in the resulting passive margin (Porada and Berhorst, 2000). During the Pan-
African Damaran-Lufilian orogeny, the Khomas ocean closed with subduction
of oceanic lithosphere underneath the Congo craton margin, leading to the
formation of an Andean-type magmatic arc, and ultimately to the Himalayan-
type collision between the Congo and Kalahari cratons at about 550-510 Ma
(Miller, 1983; Porada and Berhorst, 2000). Eclogite facies metamorphism
from the Zambezi belt, dated at 595 ± 10 Ma, and comprising associated
gabbros, metagabbros and eclogite, records the timing of the subduction
which took place in an oceanic environment (John et al., 2003). The ages of
c. 590 Ma recorded by both the U-Pb system in monazite, and the 39Ar-40Ar
system in biotite in the present study show that there was some tectonic
activity with attendant metamorphism in the Chambishi Basin that was coeval
with the eclogite facies metamorphism recorded in the Zambezi belt. Talc-
kyanite whiteschists in the Lufilian arc dated at c. 530 Ma represent the final
stage of collision between the Congo and the Kalahari cratons (John et al.,
2004). Our monazite age of 531 ± 12 Ma is probably related to this event.
The ages at c. 512 Ma recorded in the Katangan basin are clearly related to
a widespread mineralising phase (molybdenite, uraninite) due to circulation of
fluids. Finally the youngest range of ages at c. 492-406 Ma may be related to

209
post-orogenic regional uplift and cooling which affected the whole Katangan
basin.
ACKNOWLEDGEMENTS
We thank Claus Schlegel (Avmin Zambia), Tumba Tshiauka (Musoshi Mine,
DRC), and the staff of Mufulira, Nchanga and Muliashi South mines and the
Kalulushi core yard for access to the samples. We are grateful to Dr. Steve
Prevec for his insightful and timeous review of this paper.
7. References
Armstrong, R.A., Master, S., Robb, L.J., Lobo-Guerrero, A., 2004.
Geochronology of the Nchanga granite and constraints on the maximum
age of the Katangan Supergroup, Zambian Copperbelt. Journal of African
Earth Sciences, this issue.
Armstrong, R.A., 2000. Ion microprobe (SHRIMP) dating of zircons from
granites, granulites and volcanic samples from Zambia. Unpubl. Rep.,
ANU, PRISE Job No. A99-160, Canberra.
Barra, F., Broughton, D., Ruiz, J., Hitzman, M., 2004. Multi-stage
mineralization in the Zambian Copperbelt based on Re-Os isotope
constraints. Denver Annual Meeting, November 7-10, Geological Society
of America Abstract with Programs, 36 (5).
Cahen, L., Francois, A., Ledent, D., 1971. Sur l'âge des uraninites de
Kambove ouest et de Kamoto Principal et révisions des connaissances
aux minéralisations uranifères du Katanga et du Copperbelt de Zambia.
Ann. Soc. geol. Belg., 94, 185-198.
Cahen, L., Snelling, N.J., 1971. Données radiométriques nouvelles par la
méthode potassium-argon. Existence d'une importante élévation post-

210
tectonique de la température dans les couches katangiennes du Sud du
Katanga et du Copperbelt de la Zambie. Annales de la Société
Géologique de Belgique, 94, 199-209.
Cailteux, J.L.H., Kampunzu, A.B., Ngoie Bwanga, F., 2003. Lithostratigraphy
of the Mwashya Subgroup in Congo (Central African Copperbelt), with
special reference to the Luiswishi area. In: Contributions presented at the
3rd IGCP-450 Conference, Proterozoic Sediment-hosted Base Metal
Deposits of Western Gondwana; Conference and Field Workshop
Lubumbashi 2003, Lubumbashi, D.R. Congo, 83-87.
Cherniak, D. J., Watson, E. B., Grove, M., Harrison, T. M., 2002. Pb diffusion
in monazite. Abstract volume, The Geological Society of America Annual
Meeting, Denver 2002, October 27-30.
Claoué-Long, J.C., Compston, W., Roberts, J., Fanning, C.M., 1995. Two
carboniferous ages: a comparison of SHRIMP zircon dating with
conventional zircon ages and 40Ar/39Ar analysis. Geochronology Time
Scales and Global Stratigraphic Correlation, SEPM Special Publication No
54, 1-21.
Cosi, M., DeBonis, A., Gosso, G., Hunziker, J., Martinotti, G., Moratto, S.,
Robert, J.P., Ruhlman, F., 1992. Late Proterozoic thrust tectonics, high-
pressure metamorphism and uranium mineralization in the Domes area,
Lufilian arc, northwestern Zambia. Precambrian Research, 58, 215-240.
Di Vincenzo, G., Viti, C., Rocchi, S., 2003. The effect of chlorite interlayering
on 40Ar-39Ar biotite dating: an 40Ar-39Ar laser-probe and TEM
investigations of variably chloritised biotites. Contrib. Mineral Petrol., 145,
643-658.
211
Foland, K.A., 1974. 40Ar diffusion in homogenous orthoclase and an
interpretation of Ar diffusion in K-feldspar. Geochemica and Cosmochimica
Acta, 38, 151-166.
François, A., 1974. Les minéralisations du Shaba méridional et leur
environement lithologique et tectonique. In Gisements stratiformes et
Provinces cuprifères, Société géologique de Belgique, Liège.
Hanes, J. A., 1991. K-Ar and 40Ar-39Ar geochronology: methods and
applications. In Short course handbook on applications of radiogenic
isotope systems to problems in geology. Eds. Heaman, L., Ludden, J.N.,
Mineralogical Association of Canada, 19, 27-57.
Hanson, R.E., Wardlaw, M.S., Wilson, T.J., Mwale, G., 1993. U-Pb zircon
ages from the Hook granite massif and Mwembeshi dislocation:
constraints on Pan-African deformation, plutonism, and transcurrent
shearing in central Zambia. Precambrian Research, 63, 189-209.
Harrison, T.M., McDougall, I., 1982. The thermal significance of potassium
feldspar K-Ar ages spectrum results. Geochemica et Cosmochimica Acta,
46, 1811-1820.
Heaman, L., Parrish, R., 1991. U-Pb geochronology of accessory minerals. In
Short course handbook on applications of radiogenic isotope systems to
problems in geology. Eds. Heaman, L., Ludden, J.N., Mineralogical
Association of Canada, 19, 59-102.
Hoffman, K.-H., 1994. New constraints on the timing of continental breakup
and collision in the Damara Belt. Conference on Proterozoic Crustal and
Metallogenic Evolution, 29 August- 1 September, 1994, Windhoek,
Namibia, p. 30.

212
JICA/MMAJ, 1996. Report on the cooperative mineral exploration in the
Chambishi Southeast Area, the Republic of Zambia. Consolidated Report,
February 1996, 157 pp + Appendices
John, T., Schenk, V., Haase, K., Scherer, R., Tembo, F., 2003. Evidence for
a Neoproterozoic ocean in south-central Africa from mid-oceanic-ridge-
type geochemical signatures and pressure-temperature estimates of
Zambian eclogites. Geology, 31, 3, 243-246.
John, T., Schenk, V., Mezger, K., Tembo, F., 2004. Timing and PT evolution
of whiteschist metamorphism in the Lufilian arc-Zambezi belt orogen
(Zambia): implications for the assembly of Gondwana. The Journal of
Geology, 112, 71-90
Kampunzu, A.B., Wendorff, M., Kruger, F.J., Intiomale, M.M., 1998. Pb
isotopic ages of sediment-hosted Pb-Zn mineralisation in the
Neoproterozoic Copperbelt of Zambia and Democratic Republic of Congo
(ex-Zaire): re-evaluation and implications. Chron. Rech. Min., 530, 55-61
Key, R.M., Liyungu, A.K., Njamu, F.M., Somwe, V., Banda, J., Mosley, P.N.,
Armstrong, R.A., 2001. The Western arm of the Lufilian Arc, NW Zambia
and its potential for copper mineralization. J. Afr. Earth Sci., 33 (3-4), 503-
528.
Lerouge, C., Cocherie, A., Cailteux, J., Kampunzu, A.B., Breton, J., Gilles,
C., Milési, J.-P., 2004. Preliminary U-Th-U electron microprobe dating of
monazite: chronological constraints on the genesis of the Luiswishi Cu-Co-
U ore deposit, D. R. Congo. Geosciences Africa 2004, Abstract Volume 1,
University of the Witwatersrand, Johannesburg, South Africa, 382-383.
Liyungu, A.K., Mosley, P.N., Njamu, F.M., Banda, J., 2001. Geology of the
Mwinilunga area. Rep. Geol. Surv. Zambia, 110, 36 pp.
213
Lo, C.-H., Onstott, T.C., 1989. 39Ar recoil artefact in chloritized biotite.
Geochimica et Cosmochimica Acta, 53, 2697-2711.
Lovera, O.M., Richter, F.M., Harrison, T.M., 1989. The 40Ar/39Ar
thermochronometry for slowly cooled samples having a distribution of
diffusion domain sizes. J. Geophys. Res., 94B, 17917-17935.
Ludwig, K.R., 2000. Users Manual for Isoplot/Ex version 2.3, a
geochronological toolkit for Microsoft Excel. Berkeley Geochronology
Center, Special Publications, 1a.
MacDougall, I., Harrison, T.M., 1999. Geochronology and thermochronology
by the 40Ar/39Ar method. Second Edition. Oxford Univ. Press. New York
Master, S., Rainaud, C., Armstrong, R. A., Phillips, D., Robb, L. J., 2004.
Provenance ages for key units in the Katanga Supergroup (Central African
Copperbelt), with implications for regional and global correlations. Journal
of African Earth Sciences, this issue.
Mbendi, Information for Africa, 2002. Zambia – Mining: Copper Mining –
Overview. Internet Web site:
www.mbendi.co.za/indy/ming/cppr/af/za/p0005.html
Porada, H., Berhorst, V., 2000. Towards a new understanding of the
Neoproterozoic-Early Palaeoproterozoic Lufilian and northern Zambezi
Belts in Zambia and the Democratic Republic of Congo. Journal of African
Earth Sciences, 30, 727-771.
Purdy, J.W., Jäger, E., 1976. K-Ar ages on rock-forming minerals from the
Central Alps. Report Institute of Geology and Mineralogy, University of
Padova, 30, 1-31

214
Rainaud, C., Master, S., Armstrong, R.A., Robb, L.J., 2003. A cryptic
Mesoarchaean terrane in the basement to the central African Copperbelt.
Journal of the Geological Society, London, 160, 11-14.
Rainaud, C. Master, S., Armstrong, R.A., Robb, L.J., 2004. Geochronology
and nature of the Palaeoproterozoic Basement to the Central African
Copperbelt (Zambia and Democratic Republic of Congo), with regional
implications. Journal of African Earth Sciences, this issue.
Richards, J.P., Cummings, G.L., Krstic, D., Wagner, P.A., Spooner, E.T.C.
1988a. Pb isotope constraints on the age of sulfide ore deposition and U-
Pb age of late uraninite veining at the Musoshi stratiform copper deposit,
Central African Copperbelt, Zaire. Economic Geology, 83, 724-741.
Richard, J.P., Krogh, T.E., Spooner, E.T.C., 1988b. Fluid inclusion
characteristics and U-Pb rutile age of late hydrothermal alteration and
veining at the Musoshi stratiform copper deposit, Central African
Copperbelt, Zaire. Economic Geology, 83, 118-139.
Spell, T.L., McDougall, I., 2003. Characterization and calibration of 40Ar/39Ar
dating standards. Chem. Geol., 198, 189 - 211.
Steiger, R.H., Jäger, E., 1977. Subcommission on geochronology:
convention on the use of decay constants in geo- and cosmoschronology.
Earth and Planetary Science Letters, 36, 359-362.
Steven, N., Armstrong, R.A., 2003. A metamorphosed Proterozoic
carbonaceous shale-hosted Co-Ni-Cu deposit at Kalumbila, Kabompo
Dome: the Copperbelt ore shale in northwest Zambia. Economic Geology,
98, 893-909.
215
Tetley, N., MacDougall, I., Heydegger, H.R., 1980. Thermal neutron
interferences in the 40Ar/39Ar dating technique. Journal of Geophysical
Research, 85, 7201-7205.
Torrealday, H.I., Hitzman, M.W., Stein, H.J., Markey, R.J., Armstrong, R.,
Broughton, D., 2000. Re-Os and U-Pb dating of the vein-hosted
mineralization at the Kansanshi copper deposit, northern Zambia.
Economic Geology, 95, 1165-1170
Walraven, F., Chabu, M., 1994. Pb-isotope constraints on base-metal
mineralisation at Kipushi (Southeastern Zaïre). Journal of African Earth
Sciences, 18, 1, 73-82.
Wendorff, M., 2001a. New exploration criteria for ‘megabreccia’-hosted Cu-
Co deposits in the Katangan belt, central Africa. In: Piestrzynski, A. et al.
(Eds.), Mineral Deposits at the Beginning of the 21st Century. Swets &
Zeitlinger Publishers, Lisse, Netherlands, 19-22.
Wendorff, M., 2001b. Evolution of the Katangan belt foreland basins:
Neoproterozoic-Lower Palaeozoic of Zambia and the Democratic Republic
of Congo. Abstract, 21st IAS-Meeting of Sedimentology, 3 - 5 September
2001, Davos, Switzerland.
Wendorff, M., 2002a. Megabreccias of the Katangan orogen (Neoprotero-
zoic-Lower Palaeozoic of Central Africa): criteria for re-interpretation as
synorogenic conglomerates. 16th International Sedimentological Congress,
Abstracts Volume, Rand Afrikaans University, Johannesburg, South
Africa, 395-396.
Wendorff, W., 2002b. Synorogenic conglomerates and evolution of foreland
basins in the external fold-thrust belt of the Katangan orogen,
Neoproterozoic-L. Palaeozoic of Zambia and the Democratic Republic of
216
Congo. 16th International Sedimentological Congress, Abstracts Volume,
Rand Afrikaans University, Johannesburg, South Africa, 397-398.
Wendorff, M., 2003a. Stratigraphy of the Fungurume Group- evolving
foreland basin succession in the Lufilian fold-thrust belt, Neoproterozoic-
Lower Palaeozoic, Democratic Republic of Congo. South African Journal
of Geology, 106, 47-64.
Wendorff, M., 2003b. Conglomerates and sedimentary megabreccia (olisto-
strome) in Roan-Mwashya succession in Mufulira, Copperbelt of Zambia.
In: Contributions presented at the 3rd IGCP-450 Conference, Proterozoic
Sediment-hosted Base Metal Deposits of Western Gondwana; Conference
and Field Workshop Lubumbashi 2003, Lubumbashi, D.R. Congo, 94-97.