characterisation and behaviour of recycled concrete and …shura.shu.ac.uk/19456/1/10694337.pdf ·...
TRANSCRIPT

Characterisation and behaviour of recycled concrete and bricks as engineered fill.
CHIDIROGLOU, Iordanis.
Available from Sheffield Hallam University Research Archive (SHURA) at:
http://shura.shu.ac.uk/19456/
This document is the author deposited version. You are advised to consult the publisher's version if you wish to cite from it.
Published version
CHIDIROGLOU, Iordanis. (2007). Characterisation and behaviour of recycled concrete and bricks as engineered fill. Doctoral, Sheffield Hallam University (United Kingdom)..
Copyright and re-use policy
See http://shura.shu.ac.uk/information.html
Sheffield Hallam University Research Archivehttp://shura.shu.ac.uk

Sheffield 31 1WB
1 0 1 8 9 5 4 9 4 5
f Sheffield Hallam t.iniversity Lean ;?̂ g and IT Sendees
j Adsetti Cerwe City Campus Sheffield 31 1WB
REFERENCE

ProQuest Number: 10694337
All rights reserved
INFORMATION TO ALL USERS The quality of this reproduction is dependent upon the quality of the copy submitted.
In the unlikely event that the author did not send a com ple te manuscript and there are missing pages, these will be noted. Also, if material had to be removed,
a note will indicate the deletion.
uestProQuest 10694337
Published by ProQuest LLC(2017). Copyright of the Dissertation is held by the Author.
All rights reserved.This work is protected against unauthorized copying under Title 17, United States C ode
Microform Edition © ProQuest LLC.
ProQuest LLC.789 East Eisenhower Parkway
P.O. Box 1346 Ann Arbor, Ml 48106- 1346

Characterisation and Behaviour of Recycled Concrete and Bricks as Engineered Fill
Iordanis Chidiroglou
A thesis submitted in partial fulfilment of the requirements of Sheffield Hallam University
for the degree o f Doctor of Philosophy
— — — — * ** ■**
August 2007

Abstract
Demolition waste materials mainly consist of concrete and bricks and arise from the
demolition of existing structures and buildings. Environmental and economical reasons
make their recycling necessary but up to date little research has been undertaken to what is
perceived as low level reuse of these materials.
This project tries to understand the behavioural characteristics of three types of recycled
materials to determine their potential for engineering fill applications. For this purpose
their physical and mechanical characteristics have been extensively investigated. Two
types of crushed concrete, one obtained straight after demolition and the other further
processed to industry specifications, and one type of crushed bricks were tested.
Due to the variable nature of recycled materials large quantities were tested and their
grading, particle shape and aggregate crushing and impact values established. In addition,
large scale equipment was developed for the determination of their compaction and
permeability characteristics.
An extensive large scale shear box test regime was used to determine the shear strength
behaviour of the materials. Two different densities and maximum particle sizes were used,
and their influence on the shear strength established. The degree of particle breakage was
also quantified by sieving the shear box specimens before and after testing.
The comparison of the behaviour of the materials during shearing has shown that the two
crushed concrete based materials behave similarly despite the different degrees of
processing, but there is difference between them and the crushed brick material. The
friction angles of the materials decrease with decreasing density and maximum particle
size, with the reduction of the latter affecting the friction angles values more.
The results show that the friction angles reduce with increasing normal stress, the shear-
normal stress envelopes exhibit curvature at low normal stresses and the materials exhibit
dilatancy at low normal stresses that decreases with increasing normal stress. This
behaviour during shearing is similar to the behaviour exhibited by natural granular
materials from literature. For all the three types of materials tested, the friction angles fall
above the lower limits of strength for rockfill set by Leps (1970), which indicates their
suitability for use as engineered fill.

Acknowledgements
The author is indebted to Dr Andy Goodwin, Professor Pritpal Mangat and Dr Liz Laycock
for their guidance throughout this research and would also like to thank Dr Finbarr
O’Flaherty for his assistance.
Thanks must also be presented to Controlled Demolition Group Ltd for providing
Materials A and to Sam Allon (Contracts) Ltd for providing Materials B and C for this
research.
The author wishes to thank Stephen, Bob, Geoff, Steven, Paul, John and Les, technical
staff o f Sheffield Hallam University, for their valuable help in completing the testing for
this investigation.
Friends that have been a rock for me since I have arrived in Sheffield and have helped
immensely with this research one way or the other includes Belen, Fin, James, Helen,
Howard, Mark, Esref, Margaret, Nikos G., George, Mimis and Nikos K. Your love and
support will never be forgotten.
Special thanks go to Elena, Aleka, Ilia, Aristidi, Fotula, Antoni, Stella and Petro.
The author is extremely grateful to his grandfather Ilia and grandmother Athanasia for their
love, support and encouragement in the past 29 years.
Wish there were words to thank my Family. Forever in your debt.

Candidate’s declaration
I hereby declare that no portion of the work referred to in this thesis has been submitted in
support o f an application for another degree or qualification of this or any other university
or other institution of learning. All sources of information have been duly acknowledged.
Candidate
Iordanis Chidiroglou - August 2007
Director of studies
Pritpal Mangat - August 2007

I. Chidiroglou
CONTENTS
List of Figures__________________________________________________________ I
List of Tables__________________________________________________________ V
CHAPTER 1 - INTRODUCTION
1.1 Background to Research_______________________________________________1
1.2 Need and Scope of Research ______________________________________ 4
1.3 Thesis Structure______________________________________________________5
CHAPTER 2 - LITERATURE REVIEW
2.1 Introduction_________________________________________________________ 7
2.2 Crushing and Processing of Demolition Waste____________________________7
2.3 Particle Shape Classification___________________________________________ 10
2.4 Effects of Material Characteristics on Shear Strength______________________ 11
2.4.1 Particle shape________________________________________________11
2.4.2 Sample Gradation and Maximum Particle Size___________________ 13
2.4.3 Confining Pressure___________________________________________ 16
2.4.4 Density_____________________________________________________ 18
2.4.5 Particle Crushing_____________________________________________18
2.4.5.1 Factors affecting Particle Crushing______________________19
2.4.5.2 Particle crushing quantification_________________________20
2.4.6 Relation between permeability and particle crushing_______________21
2.4.7 Summary___________________________________________________ 22
2.5 Compaction_________________________________________________________ 22
2.6 Compressibility
2.6.1 Introduction_________________________________________________ 23
2.6.2 Effect of Particle Shape_______________________________________ 24
2.6.3 Effect of Individual Particle Strength____________________________ 25
2.6.4 Effect of Material Void Ratio (dry density)_______________________25
2.6.5 Effect of Material Grading_____________________________________25
2.6.6 Effect of time________________________________________________26
2.6.7 Effect of Water______________________________________________ 26
2.7 Leachate
I. Chidiroglou
27
2.8 Recycled aggregates research__________________________________________ 28
2.9 Concluding Remarks_________________________________________________ 29
CHAPTER 3 - RATIONALE FOR EXPERIMENTAL PROGRAMME
3.1 Fundamental Aspects of Experimental Programme________________________ 32
3.1.1 Selection of Maximum Particle Size____________________________ 32
3.1.2. Testing Programme__________________________________________ 33
3.1.3 Number of Tests____________________________________________ 34
3.2 Physical Properties Testing Series______________________________________ 34
3.2.1 Shape______________________________________________________ 35
3.2.2 Grading_____________________________________________________35
3.2.3 Compaction_________________________________________________ 36
3.2.4 Aggregate Impact Value (AIV) and
Aggregate Crushing Value (ACV)___________________________________ 36
3.2.5 Freezing and Thawing ___________________________________ 36
3.3 Main Series Testing (MST)____________________________________________ 36
3.3.1 Specimens Moisture Content and Dry Density____________________ 37
3.3.2 Permeability_________________________________________________38
3.3.3 Shear Strength Testing________________________________________ 39
3.3.4 Particle Crushing_____________________________________________41
CHAPTER 4 - DESCRIPTION OF TEST EQUIPMENT
4.1 British Standard Tests_________________________________________________42
4.2 Compaction Tests____________________________________________________ 42
4.3 Climatic Chamber____________________________________________________ 43
4.4 Permeability_________________________________________________________ 44
4.5 Shear Box___________________________________________________________ 48
CHAPTER 5 - TEST PROCEDURES
5.1 Introduction_________________________________________________________ 50
5.2 Physical Properties Testing Series
5.2.1 Materials Grading____________________________________________ 50
5.2.2 Particle Shape_______________________________________________ 51

I. Chidiroglou
5.2.3 Compaction_________________________________________________ 52
5.2.4 Resistance to Freezing and Thawing____________________________ 54
5.3 Main Series testing
5.3.1 Permeability________________________________________________ 55
5.3.2 Particle Crushing_____________________________________________58
5.3.3 Shear Box Testing____________________________________________58
CHAPTER 6 - TEST MATERIALS
6.1 Introduction_________________________________________________________ 62
6.2 Principles of Acquisition, Transportation, Handling and Storage____________ 62
6.3 Source and Description of Materials____________________________________ 64
6.4 Water absorption and particle density___________________________________ 69
6.5 Particle Shape
6.5.1 Angularity__________________________________________________ 69
6.5.2 Flakiness and Elongation Index________________________________ 71
6.5.3 Angularity Values____________________________________________72
6.5.4 Complete Shape Description___________________________________ 72
6.6 Compaction_________________________________________________________ 73
6.7 Aggregate Impact and Aggregate Crushing Values________________________ 80
6.8 Resistance to Freezing and Thawing____________________________________ 81
CHAPTER 7 - MAIN SERIES TEST RESULTS
7.1 Introduction_________________________________________________________ 83
7.2 Permeability_________________________________________________________ 83
7.3 Shear Box Testing____________________________________________________85
7.3.1 Stress-Strain Behaviour_______________________________________ 86
7.3.2 Shear Stress Values___________________________________________91
7.3.3 Volume Change Behaviour____________________________________ 92
7.3.4 Repeatability of Results_______________________________________ 96
7.4 Particle Crushing_____________________________________________________ 97
CHAPTER 8 - DISCUSSION OF RESULTS
8.1 Introduction________________________________________________________ 100
8.2 Particle shape 100

I. Chidiroglou
8.3 Aggregate Impact and Aggregate Crushing Value Tests
8.3.1 Comparison between Material A, B and C_______________________ 101
8.3.2 Comparison with Industry Products_____________________________ 102
8.4 Freezing and thawing tests_____________________________________________104
8.5 Permeability_________________________________________________________105
8.6 Test Parameters Investigated in Shear Box and Particle Crushing Tests_______106
8.7 Particle Crushing_____________________________________________________107
8.8 Introduction to Shear Box Testing______________________________________ 109
8.9 Initial Observations on Behaviour during Shearing________________________ 110
8.10 Influence of Specimen Density on Behaviour during Shearing
8.10.1 Influence on stress-strain behaviour____________________________ 113
8.10.2 Influence on volume change behaviour_________________________ 114
8.10.3 Influence on shear strength___________________________________ 115
8.10.4 Summary of conclusions_____________________________________ 117
8.11 Influence of Maximum Particle Size on Behaviour under Shearing
8.11.1 Influence on stress-strain behaviour____________________________ 117
8.11.2 Influence on volume change behaviour_________________________ 119
8.11.3 Influence on shear strength___________________________________ 120
8.11.4 Summary of conclusions_____________________________________ 121
8.12 Influence of Normal Stress on Behaviour under Shearing
8.12.1 Influence on stress-strain behaviour____________________________ 122
8.12.2 Influence on volume change behaviour_________________________ 123
8.12.3 Influence on shear strength___________________________________ 127
8.12.4 Summary of conclusions_____________________________________ 129
8.13 Comparison of Friction Angles with AIV and ACV Tests_________________ 129
8.14 Comparison with Natural Granular Materials____________________________ 130
8.15 Engineering Fill Applications_________________________________________ 134
8.16 Comparison with other Recycled Aggregates____________________________ 135
CHAPTER 9 - CONCLUSIONS AND RECOMMENTATIQNS
9.1 Introduction_________________________________________________________ 139
9.2 Main Conclusions____________________________________________________139
9.3 Secondary Conclusions________________________________________________140
9.4 Recommendations____________________________________________________ 142

References
I. Chidiroglou
143
Appendices_____________________________________________________________ 159
Appendix A______________________________________________________ 1
Appendix B______________________________________________________ 2
Appendix C______________________________________________________ 7
Appendix D______________________________________________________ 11
Appendix E______________________________________________________ 14
Appendix F______________________________________________________ 29
Publications

LIST OF FIGURES
Chapter 1
Figure 1.1: Construction and Demolition Waste Management in England
and Wales: 1999, 2001 and 2003 (Office of the Deputy Prime Minister, 2004)___ 1
Figure 1.2: Aggregates consumption in Great Britain (British Geological
Survey, 2005)__________________________________________________________ 2
Chapter 2
Figure 2.1: Diagram of Possible routes for Demolition Waste to
Re-use/ Recycling_______________________________________________________ 8
Figure 2.2: Photographs o f (a) Jaw Crusher (courtesy o f www.metsominerals.com)
and (b) Impact Crusher (courtesy ofwww.sanger.net)________________________ 9
Figure 2.3: Three dimensional shape categories determined by the
elongation and flatness ratios (after Rosslein, 1941)__________________________ 10
Figure 2.4: Chart for determining visually the degree of angularity
(after Lees, 1964)_______________________________________________________ 11
Figure 2.5: The effect of particle shape on friction angles (after Cho et al, 2006) 12
Figure 2.6: Effect of grading on shear strength_______________________________13
Figure 2.7: Influence of material gradation of friction angles
(after Becker et al, 1972)_________________________________________________ 14
Figure 2.8: Influence of maximum particle size on friction angle of
alluvial rockfill (after Varadarajan et al, 2003)_______________________________15
Figure 2.9: Influence of maximum particle size on friction angle of
quarried rockfill (after Varadarajan et al, 2003)_____________________________ 15
Figure 2.10: Effect of normal stress on friction angles (after Leps, 1970)________ 17
Figure 2.11: Effect of normal stress on shear stress o f granular material_________ 17
Figure 2.12: The effect of relative density on friction angles (after Zeller
and Wulliman, 1957)____________________________________________________ 18
Figure 2.13: Angle of internal friction against breakage factor
(after Marachi et al, 1969)________________________________________________19
Figure 2.14: Breakage Factors (Lade, Yamamuro & Bopp, 1996)______________ 21
Figure 2.15: Compression and decompression indices against particle shape
(after Cho et al, 2006)___________________________________________________ 24

Figure 2.16: Displacement against time for sand (After Houlsby and
Psomas, 2001)__________________________________________________________ 26
Figure 2.17: Volume change behaviour of saturated and unsaturated materials
(after Sun et al, 2004)____________________________________________________ 27
Chapter 4
Figure 4.1: The large scale compaction mould_______________________________ 42
Figure 4.2: The climatic chamber and computer control system_________________43
Figure 4.3: Recorded profile of Temperature against Time for the Freezing cycle_44
Figure 4.4: Schematic of the large scale permeability cell______________________45
Figure 4.5: Schematic of the Permeability Cell (Plan View)____________________46
Figure 4.6: Permeability Cell______________________________________________46
Figure 4.7: The shear box, displacement transducers and computer logging
system_________________________________________________________________ 4 8
Chapter 5
Figure 5.1: Behaviour of Materials A, B and C when compacted with 8 %
moisture content_________________________________________________________54
Figure 5.2: The containers (with material A) in the thawing tank after the
freezing cycle___________________________________________________________ 55
Figure 5.3: The permeability cell with the compaction plate___________________ 56
Figure 5.4: The shear box apparatus________________________________________ 59
Figure 5.5: The shear box on the floor with Material C compacted in it__________ 60
Chapter 6
Figure 6.1: Material B and C in the laboratory storage bays____________________ 63
Figure 6.2: Grading curve for Material A____________________________________64
Figure 6.3: Grading curves for Material B and C_____________________________ 65
Figure 6.4: Average grading curves for Material A, B and C___________________ 66
Figure 6.5: Wet and dry grading curves_____________________________________ 67
Figure 6.6: Shape categories for all the size fractions for Materials A
(after Rosslein, 1941)___________________________________________________ 70
Figure 6.7: Shape categories for all the size fractions for Materials B
(after Rosslein, 1941)___________________________________________________ 70
II

Figure 6.8: Shape categories for all the size fractions for Materials C
(after Rosslein, 1941)____________________________________________________ 71
Figure 6.9: Compaction Curves for all the types of compaction for Material A 74
Figure 6.10: Variability of compaction results for Material A__________________ 75
Figure 6.11: Large scale compaction curves for Material A (1st layer)__________ 76
Figure 6.12: Large scale compaction curves for Material A (2nd layer)_________ 76
Figure 6.13: Large scale compaction curves for Material B (1st layer)__________ 77
Figure 6.14: Large scale compaction curves for Material B (2nd layer)_________ 77
Figure 6.15: Large scale compaction curves for Material C____________________ 78
Figure 6.16: Compaction curves for all Materials - 1st Layer__________________ 78
Figure 6.17: Compaction curves for all Materials - 2nd Layer__________________79
Chapter 7
Figure 7.1: Water flow through permeability specimens_______________________ 83
Figure 7.2: Manometer differences for permeability tests______________________ 84
Figure 7.3: Shear Stress against Horizontal Displacement for Material B________ 86
Figure 7.4: Shear Stress against Horizontal Displacement for Material C________ 87
Figure 7.5: Stress-Strain behaviour of Material A for SBT1___________________ 88
Figure 7.6: Stress-Strain behaviour of Material A for SBT2___________________ 88
Figure 7.7: Stress-Strain behaviour of Material A for SBT3___________________ 88
Figure 7.8: Stress-Strain behaviour of Material B for SBT1___________________ 89
Figure 7.9: Stress-Strain behaviour of Material B for SBT2___________________ 89
Figure 7.10: Stress-Strain behaviour of Material B for SBT3___________________ 89
Figure 7.11: Stress-Strain behaviour of Material C for SBT1___________________ 90
Figure 7.12: Stress-Strain behaviour of Material C for SBT2___________________ 90
Figure 7.13: Stress-Strain behaviour of Material C for SBT3___________________ 90
Figure 7.14: Volume Behaviour for Material A, SBT1 at 95 kPa_______________ 92
Figure 7.15: Volume Change behaviour for Material A, SBT1__________________93
Figure 7.16: Volume Change behaviour for Material A, SBT2__________________93
Figure 7.17: Volume Change behaviour for Material A, SBT3__________________93
Figure 7.18: Volume Change behaviour for Material B, SBT1__________________94
Figure 7.19: Volume Change behaviour for Material B, SBT2__________________94
Figure 7.20: Volume Change behaviour for Material B, SBT3__________________94
Figure 7.21: Volume Change behaviour for Material C, SBT1__________________95
III

Figure 7.22: Volume Change behaviour for Material C, SBT2_________________ 95
Figure 7.23: Volume Change behaviour for Material C, SBT3_________________ 95
Figure 7.24: Grading curves for all the Materials after SBT1___________________ 98
Figure 7.25: Grading curves for all the Materials after SBT2___________________ 99
Figure 7.26: Grading curves for all the Materials after SBT3___________________ 99
Chapter 8
Figure 8.1: Mean stress-strain behaviour curves at 95 kPa normal stress_________ 110
Figure 8.2: Volumetric behaviour for SBT1, 190 and 317 kPa
normal stress levels______________________________________________________ 112
Figure 8.3: Normal against shear strength for SBT1___________________________112
Figure 8.4: Axial strain values at failure for SBT1 and SBT2___________________113
Figure 8.5: Volumetric strain values at failure for SBT1 and SBT2______________114
Figure 8.6: Shear-normal stress curves for SBT1 and SBT2____________________ 115
Figure 8.7: Axial strain values at failure for SBT1 and SBT3___________________118
Figure 8.8: Volumetric strain values at failure for SBT1 and SBT3______________119
Figure 8.9: Shear-normal stress curves for SBT1 and SBT3____________________ 120
Figure 8.10: Influence of normal stress on axial strain at failure________________ 122
Figure 8.11: Influence of normal stress on volumetric strain at failure___________ 123
Figure 8.12: Possible continuations of the best fit graphs for
Materials A, B and C_____________________________________________________ 124
Figure 8.13: Changes in £v between SBT1 and SBT2 and SBT1 and SBT3_______ 125
Figure 8.14: Friction angle values in relation to normal stress levels_____________127
Figure 8.15: Shear-normal stress envelopes__________________________________ 130
Figure 8.16: Shear-normal stress envelopes comparison_______________________ 132
Figure 8.17: Influence of normal stress on friction angles______________________ 133
Figure 8.18: Friction angles of Materials and rockfill strength limits
(after Leps, 1970)________________________________________________________134
IV
LIST OF TABLES
Chapter 2
Table 2.1: Effect of maximum particle size on friction angles
(after Marsal, 1973)______________________________________________________16
Table 2.2: Summary of parameters affecting shear strength____________________ 22
Chapter 3
Table 3.1: Tests included in the Physical Properties Series____________________ 34
Table 3.2: Tests included in the Main Series________________________________ 37
Table 3.3: Types of shear box tests and variables investigated_________________ 40
Table 3.4: Number of tests for each of the materials for all different types of tests
for all five different normal stresses________________________________________ 40
Chapter 4
Table 4.1: Calibration factors and 95% confidence limits______________________ 49
Chapter 5
Table 5.1: Mass and particle numbers tested for each of the size fractions for
Material A, B and C_____________________________________________________ 51
Chapter 6
Table 6.1: Initial similarities and relations between the three types of materials 62
Table 6.2: Summary of Grain Size characteristics of test materials______________ 66
Table 6.3: Comparison between wet and dry sieving results____________________67
Table 6.4: Variability of grading results for all materials_______________________68
Table 6.5: Particle density and water absorption values________________________69
Table 6.6: Values of all the Flakiness and Elongation Indices for all
the Materials____________________________________________________________71
Table 6.7: Summary of Fj and Ej values for all the materials___________________ 72
Table 6.8: Angularity values for all materials (after Lees, 1964)________________ 72
Table 6.9: Maximum dry density and corresponding moisture content values_____ 73
Table 6.10: Variability of dry density results for Material A and B_____________79
Table 6.11: Variability of dry density results for Material C____________________80
V

Table 6.12: Dry and soaked AIV and SD values for all the materials 81
Table 6.13: Dry and soaked ACV and SD values for all the materials 81
Table 6.14: Results of the particle percentage passing the 5 mm sieve
after the weathering process 81
Table 6.15: ACV and AIV for all the materials after the freezing - thawing
process 82
Chapter 7
Table 7.1: Values of the Coefficient of Permeability (k) for all the Materials 84
Table 7.2: Specimen parameters for shear box tests 85
Table 7.3: Particle shape for maximum particle size of 37.5 and 28 mm 85
Table 7.4: Mean peak Shear Stress values for all the materials 91
Table 7.5: Mean peak shear stress Standard Deviation values (kPa) for all the
types of shear box tests for all the materials 91
Table 7.6: Standard deviation as a percentage of mean peak shear stress values 96
Table 7.7: Upper and lower limits of the envelopes of the volumetric-axial
strain curves 97
Table 7.8: Breakage Index, BI? for SBT1, SBT2 and SBT3 98
Chapter 8
Table 8.1: Flakiness and Elongation Indexes 100
Table 8.2: AIV and ACV results 101
Table 8.3: AIV over ACV ratios 102
Table 8.4: Values for ACV, AIV, Fj and water absorption for Material
A, B and C and industry products 102
Table 8.5: Freezing thawing results 104
Table 8.6: ACV and AIV for all the materials before and after the freeze-thaw 104
Table 8.7: Flakiness and Elongation Indexes values for SBT1 and SBT3 107
Table 8.8: Breakage Indices 107
Table 8.9: Reduction in values of Bj between SBT1 and SBT2 108
Table 8.10: Comparison of AIV and ACV tests with particle crushing results 109
Table 8.11: Friction angle values for SBT1 and SBT2 116
Table 8.12: Friction angle values for SBT1 and SBT3 121
VI
Table 8.13: Point o f zero Sv change between SBT1 and SBT2
and SBT1 and SBT3_____________________________________________________ 126
Table 8.14: Comparison of ACV and AIV tests with SBT1 and SBT2___________ 129
Table 8.15: Comparison of ACV and AIV tests with SBT3____________________ 130
Table 8.16: Characteristics of the tests compared in Figure 8.15________________ 131
Table 8.17: Characteristics of the Materials compared in Figure 8.16____________ 133
Table 8.18: Comparison of Material A, B, C, DG2 and OG2___________________ 136
VII

^napier i - introduction
CHAPTER 1
INTRODUCTION
1.1 Background to Research
Construction and demolition waste arises from the construction, repair, maintenance and
demolition of buildings and structures. It includes brick, concrete, topsoil and subsoil and
generally contains small quantities of timber, metal and plastics. The annual amount of
construction waste was almost 95 million tonnes in 2003 and accounted for about 30% of
all the waste produced in England and Wales (Office of the Deputy Prime Minister, 2004).
The same research showed that 47% of the construction and demolition waste was recycled
either by re-use on site or, after processing, was sold off-site. Reportedly, almost 20% was
used for landfill engineering and another 5% was landfilled in 2003 according to the same
data (Figure 1.1).
Construction and Demolition Waste Management, 1999, 2001 and 2003
1999 2001 2003
Spread on Exempt Sites ■ Used or Disposed in Landfill ■ Recycled by Crushers/Screeners |
Source: Office o f the Deputy Prime Minister: Survey of Arisings and Use o f Construction, Demolition and
Excavation Waste as Aggregate
Figure 1.1: Construction and Demolition Waste Management in England and Wales:
1999, 2001 and 2003 (Office of the Deputy Prime Minister, 2004)
1

^napicr i - liiiruuucuuii
The UK goveminent faces stringent European targets to reduce the amount of waste
landfilled and the European Union, with the co-operation of the national governments, has
established a waste strategy (Department of the Environment, Transport & the Regions,
2000) to implement the necessary changes (Office of the Deputy Prime Minister, 2002).
In the year 2003 the UK consumed about 226 million tonnes of aggregates per year (Figure
1.2) to cover its construction needs and it was estimated that the amount of crushed rock
aggregates needed in the UK will rise further (by an estimated 20 million tonnes per year)
especially with the Olympic Games in London in 2012 and their subsequent construction
needs (British Geological Survey, 2005). It was estimated that about 60 of these 226
million tonnes were recycled or secondary aggregates. There are some localised recycling
schemes in the UK construction industry based on individual company initiatives but by no
means have all the companies across the UK adopted a policy of reusing construction and
demolition waste. The environmental problems that arise from the consequential extensive
quarrying activities are not just restricted to the quarry areas, as the transportation of the
materials causes noise and air pollution problems too.
Consumption of Natural Aggregates
400
350
300
250
I - 200
S 150
100
— Consumption of Natural Aggregates
Figure 1.2: Aggregates consumption in Great Britain (British Geological Survey, 2005)
2

s im p le r 1 - liiu u u u c iiu ii
A future increase in the re-use of demolition waste will benefit the environment as well as
industry. It is considered that the introduction o f the landfill tax (which increased to £15
from £1 /tonne/year between 1999 and 2004, HM Treasury, 2004) has led to an annual
increase in the cost of disposing of construction and demolition waste to landfill o f
approximately £15 million per annum. This cost to the industry was compounded by the
introduction of the aggregates levy in 2002, the increase in costs of both the haulage of
primary aggregates to site and the removal of waste materials to the disposal sites. Given
the cost of over-ordering construction materials, it would appear that the reuse of waste
materials makes both environmental and economic sense. Construction companies would
have to provide a more environmental approach to their projects especially when
governments recommend that in construction projects at least 10% of the construction value
of the materials used should be dedicated to recycled, re-used and reclaimed materials
(Waste & Resources Action Programme, 2005).
Despite the apparent attractions offered by recycling of construction waste, the re-use of
these materials has some restraints and disadvantages that have to be taken into
consideration in order for their application to construction projects to be effective. The
main restraints are the possible unsuitability of the materials for recycling, the distance
between the construction site and the recycling plant, the available storage space on site for
these materials, noise and dust pollution from crushing equipment, and the cost o f cleaning
and sorting of the possible contaminants (e.g. wood, plastic, steel reinforcement and
electricity and plumbing installations).
On the other hand, the advantage that the re-use or recycling of demolition materials,
particularly concrete and bricks, has in comparison with the other types of waste is that
there is not a great need to identify and establish a market for the materials since the
construction industry is already a major receptor for these materials. The industry also has
the full support of the government in developing new technology for recycling and in
researching potential uses for these materials. The Department of Trade and Industry
established a Sustainable Construction Unit in 2002, and in 2003 the Sustainable Buildings
Task Group was set up. The roles o f both of these two groups are to encourage more
corporate social responsibility and push a sustainable construction initiative.
3

vam pici i - luuuuuw uuii
1.2 Need and Scope of Research
Despite the will and initiatives for recycling and reusing these types of materials, their use
can not be accurate and widespread before many technical issues have been addressed:
1. Understanding the behavioural characteristics of recycled concrete and bricks
2. Establishing testing procedures and appropriate engineering specifications
3. Use of combinations of materials (e.g. concrete and bricks)
4. Developing possible new ways of re-using the materials
This research project relates to the first issue. Typical uses of recycled concrete and bricks
as fill include filter gravel, sub base for roads and car parks, hardcore and general site
cover, and backfill to quarries. It has generally been assumed in practice that the behaviour
of such fills would be similar to that of natural aggregates, and therefore accumulated data
on the properties of such aggregates has been extrapolated and applied to recycled materials
used in industry. There are two areas o f concern with this approach though:
• Little research has been undertaken into what is perceived as the low level,
non-structural re-use of the materials as bulk fills, though some recent work
(Sivakumar et al, 2004, Brampton et al, 2004, Forth et al, 2006, Ghataora et
al, 2006) indicates that there is increasing interest in this aspect.
• The 1st of June 2004 saw the introduction of the New European Standards
for aggregates that are applicable to 'aggregates from natural, recycled and
manufactured materials'. Even though these standards address the possible
specified use of recycled materials, the main problem is that they do not
tackle the non homogeneous nature of some of the materials. In some tests
(e.g. Freeze Thaw - EN 1367-1, Particle shape - EN-933-3 and Impact Test
Value - EN-1097-2) it is possible to test particles that are not representative
of the overall composition of the materials (e.g. small particles in crushed
concrete mainly consist of the original aggregates used for the
manufacturing of concrete and not of composite concrete based particles).
The fundamental driver behind this research was a desire to confirm or refute these
assumptions/problems. Thus the overall aim of the project was to investigate the physical
and mechanical properties of crushed bricks and concrete. The limited research on the
4

^iiapici i - iniiuuu^uuii
subject and the lack of information on the strength and physical properties of recycled
materials makes this investigation necessary from the academic point of view, not only for
increasing the knowledge on the materials but also for providing a platform for future
research.
As it has been mentioned in the previous section of this chapter, the industry is under
pressure to recycle more of its waste and use more recycled aggregates for its construction
purposes. This investigation aims to provide the industry with the data it needs to safely,
and under the guidelines of the existing standards, utilise materials such as crushed concrete
and/or bricks in present and future projects.
With these in mind, the specific objectives of this investigation are as follows:
1. To provide a base for future research by investigating the physical and mechanical
characteristics of crushed recycled aggregates
2. Provide data on the strength of recycled aggregates so they can be utilised by the
industry.
3. Compare the properties of recycled materials with other research on recycled and
primary aggregates.
4. Compare the characteristics and performance of different types of recycled materials.
1.3 Thesis Structure
The thesis structure following this introduction is as follows:
• Chapter 2 presents a literature review concentrating on the testing, properties and
behaviour of coarse granular materials. The economics and management aspects of
the recycling processes fall outside the scope of this research.
• Chapter 3 presents the rationale behind the tests performed in this investigation and
describes the aspirations of the testing programme.
• Chapter 4 reports on the test equipment used and the calibration procedures
adopted.
• Chapter 5 describes the test procedures followed in this investigation.
• Chapter 6 describes the three material types used in this project, some o f their
physical characteristics and their transportation to and storage in the laboratory.
5

^napier i - iiiiruuuciiun
• Chapters 7 and 8 respectively present and analyse the factual results of the main
testing series.
• Finally, Chapter 9 presents the conclusions from this investigation and provides
recommendations for further work.
6

CHAPTER 2
LITERATURE REVIEW
2.1 Introduction
Past research into the properties of demolition waste for geotechnical engineering
purposes has been limited, compared with other areas of geotechnics. In order to devise
a testing programme that would produce a valid description of their properties and
behaviour, a comprehensive review of the research literature was undertaken. In
summary the review presented in this thesis examines:
• The crushing and processing of demolition waste, in order to identify the types
of materials that need to be investigated in this project.
• The methods for classifying particle shape
• The effect of different material parameters on shear strength of granular material
• Quantification methods for particle crushing.
• The compaction and compressibility behaviour of coarse granular materials and
how they are affected by variations in the material parameters.
• The potential for leachate generation from recycled materials.
2.2 Crushing and Processing of Demolition Waste
In order to be able to identify the types of recycled materials (both concrete and/or
bricks) for laboratory testing that are representative of the materials used by industry, it
is necessary to investigate:
1. The types of crushing procedures used
2. The amount of processing they might undergo after demolition.
Crushing of demolition waste can take place on site by temporary mobile units, or the
materials can be removed from the demolition site, crushed and processed in a fixed site
constructed for this purpose.
Due to the nature of the majority of the structures demolished, the material produced
typically contains some architectural components other than concrete, so it is necessary
to remove them mainly before the crushing takes place. Generally fixtures and fittings
such as carpets, windows, doors etc are removed before the demolition takes place, with
the large pieces of the utilities components such as cables and pipes removed manually
7

after crushing. Structures containing reinforced concrete allow simple separation as the
steel is easily removed from the concrete since its bond with the concrete is weak after
the individual components (columns, beams, and floors) are demolished. Usually a
small vibration or sudden movement of the steel rods is enough to “free” the steel from
the concrete.
MaterialsRoute
Off Site Storage Processing Site
Haulage required
Haulage not required
Used on Site
Demolition Waste
Used on Different Site/s
Crushed on Site with Crusher Not Crushed on Site
Figure 2.1: Diagram of Possible routes for Demolition Waste to Re-use/ Recycling
The procedures used for the processing of demolition waste vary depending on the
intended use and the processing equipment available. Most methods include
transportation of the materials from the production area to the reuse site. Depending on
the routes followed this can be costly in economic and environmental terms due to
charges and air and noise pollution caused by haulage. Figure 2.1 summarises the
possible routes for reusing and/or recycling of materials. The reduction of the number or
distance of the routes marked with grey lines will benefit the industry and the
environment as they will reduce the transportation needs for the utilisation of these
materials.
Reducing the distances the materials have to be transported between the points of
demolition and the crusher reduces the cost of the whole procedure of crushing and

Reducing the distances the materials have to be transported between the points of
demolition and the crusher reduces the cost of the whole procedure of crushing and
processing. This has resulted in the development of mobile crushers. The types of
mobile crushers vary and the main types used are jaw crushers (Figure 2.2.a), impact
crushers (Figure 2.2 b), hammer mills and cone crushers.
Figure 2.2: Photographs of (a) Jaw Crusher (courtesy of www.metsominerals.com) and
(b) Impact Crusher (courtesy of www.sanger.net)
Depending on the intended use of the materials the screens used on the processing sites
have different size and shape of aperture, and different types of screens such as
vibrating, inclined or horizontal are used depending on different parameters existing on
site (headroom, operational area required grading etc.). Screening and sorting devices
can also be useful for purposes other than only establishing maximum particle sizes.
They are most of the time used for removing undesirable impurities such as plastics,
roof and wall hardboards and any other types of wood. In some sites when secondary
crushers are employed, screening is used to provide materials with particle size that can
be crushed by that specific crusher.
It is therefore clear that there are mainly two types of demolition waste reused by the
industry:
1. Materials that have not been processed further than the original demolition and
crushing
2. Materials that have been processed further by crushing to particular
specifications
9

2.3 Particle Shape Classification
Particle shape can be classified by the Elongation and Flakiness ratios (after BS 812-
105) but numerous other methods also exist for characterising the particle shape of
materials.
Bowman et cil (2001) have used Fourier description analysis and scanning electron
microscope photographs to analyse the shape of sands, and his technique would have
been quite useful in determining the shape of the smaller particles of the materials.
Since, though, the BS methods used do not examine particles below 6.3 mm, it was
decided that its use was outside the purpose of this research, since only particles larger
than 6.3 mm were tested.. The 3D characterization of coarse particles proposed by
Lanaro and Tolppanen (2002) falls within the scope of this investigation and produces
accurate shape descriptions but it would have been a time consuming process if a large
number of particles were to be studied. In addition to the above, the methods used by
O’Fannery and O’Mahony (1999) were reviewed but they were not used for the same
reason.
For a more complete description, than the one given by the British Standards, can be
given if the methods by Rosslein (1941) and by Lees (1964) are employed. Using a
combination of the three dimensional shape categories (Figure 2.3, after Rosslein, 1941)
and the chart for visually determining the degree of angularity (Figure 2.4, after Lees,
1964) a complete description of the particles' shape can be presented.
The elongation ratio (q) is the
ratio of the intermediate length of
the particle over the greater length
and the flatness ratio (p), the ratio
of the shortest length over the
intermediate length.
0.5 1.00 Flatness Ratio
Figure 2.3: Three dimensional shape categories determined by the elongation and
flatness ratios (after Rosslein, 1941)
0.66
ElongationRatio
DiscsEqui-dimensional
Blades Rods
10

The categories given in Figure 2.3 can also be described as:
• Discs are the particles that are flaky but not elongated
• Equidimensional the particles that are neither flaky nor elongate
• Rods are the particles that are elongate but not flaky
• Elongate and flaky particles are described as blades (Lees, 1964).
0-99
ooOO (00 OO (
100-199
oo0.0ooDo
2 0 0 -2 9 9
<0QdQOOO
300-399
GO^0QoOo
400-499a a c>oDO)o a o o
500-599
ooOAQOooOo
600-699QQ
0>[)Do
700-799
Q<Cd ep Q Oo<=>L0
600-999 900-999 1000-1099 . 1100-1199 1200-1299 130CH399 1400—1499 1500-1599pO5oO,§3.CXN>
oGoooc?Off
ddOd>vO
o a O
Note: The numbers indicate the degree of sharp edges appearing on the particles, with the most rounded being zero and most angular being 1599
Figure 2.4: Chart for determining visually the degree of angularity (after Lees, 1964)
2.4 Effects of Material Characteristics on Shear Strength
Various researchers have conducted experiments to investigate the effects of different
properties of materials, like shape size and gradation, on their shear strength. The most
important characteristics affecting the shear strength are particle shape, gradation,
particle size, confining pressure, density and particle crushing. The literature on each is
reviewed separately below, as far as possible.
2.4.1. Particle shape
Chen (1948) conducted a series of triaxial tests on various sands and gravels, with
density varying from loose to compact, where strength was measured by loading to
failure. Fie found that for all the densities investigated, the strength of the materials
increased with increased angularity. Holtz and Gibbs (1956) conducted triaxial tests on
two types of materials (quarried rock fragments and rounded river pebbles) with the
11

same gradation but varying the angularity of the particles. Their work indicated that the
angular material had a higher shear strength than the sub-rounded and sub-angular
materials. A series of shear box tests were conducted by Pike (1973) on 17 different
aggregate samples ranging from fine sand to coarse gravel. Increased angularity
generally resulted in increased strength. The conclusions of these tests were also
verified by Thom and Brown (1989) who found that increasing angularity increased the
shear strength of 18 different materials including crushed rock, sand and gravel, all
tested in a dry condition.
Eerola and Ylosjoki (1970) found that the shear strength of materials increased in
proportion to the ratio of particle length to thickness (i.e. flakiness). Dunn and Bora
(1972) conducted triaxial tests on limestone with particles up to 38 mm, and also found
that when flaky particles were present, especially in the range of 25-75% of the sample,
the shear strength of the materials increased.
Cho et al (2006) found, by examining large amounts of research data, that the critical
state friction angle of natural and/or crushed sand reduces as the roundness of particles
increases (Figure 2.5). However, Gur et al (1978) showed that flaky particles increase
the level of deformation of samples at failure.
45
40
30
6 25
200.2 0.3 0.4 0.50 0.1 0.6 0.7 0.8 10.9
Roundness, R
Figure 2.5: The effect o f particle shape on friction angles (after Cho et al, 2006)
12

2.4.2. Sample Gradation and Maximum Particle Size
Rico et al (1977) tested materials with different gradations, but with the same maximum
particle size of 35 mm, and found that a more broadly-graded material gave a higher
strength than a narrowly-graded specimen. Marsal (1967) changed the gradation of
rockfill material, while keeping the maximum particle size the same, and found that
shear strength in triaxial shear increased as the gradation became broader. During
testing of Latite Basalt but with two different gradations, Indraratna et al (1998), found
that the existence of smaller sized particles within the sample increased the shear
strength of the material compared with the same material without the presence of these
smaller particles. Kirkpatrick (1965) conducted triaxial tests on sand, in which the top
and bottom sizes were kept the same and at the same time the mean size was varied. In
most of the results the shear strength increased with decreasing mean size. Leslie (1963)
increased the mean size of the material and broadened its gradation by keeping the
minimum size stable but changing the maximum size of the particles. The results of the
triaxial tests showed that the shear strength decreased as the mean size increased.
A graphic representation of approximate grading curves (not utilising their actual results)
of these conclusions is given in Figure 2.6. The arrows point in the direction of strength
increase. The positions of the curves are independent from maximum particle size
values. The x-axis does indicate values of maximum particle sizes.
Marsal, 1967Rico et al, 1977Indraratna et al, 1998 /
Kirkpatrick, 1965
Leslie, 19634—»c<L>o<D
O h
Particle size
Figure 2.6: Effect o f grading on shear strength
13

Becker et al (1972) also found that higher Coefficients of Uniformity produced higher
friction angles for a range of normal stresses for similar materials when they were tested
in a triaxial cell (Figure 2.7). Klugar (1978) also found that reduced deformation and
degradation is related to a broader gradation.
48
Relative Density at Placement, 85%
« 44
Oroviile Gradation, Cu 35
40
Pyramid Gradation, Cu 7 x
200 300 400
C onfin ing P ressure, psi
100 500 70C600
48
Relative Density at Placement, 50%
XsOroville Gradation, Cu 35
° 40 X____■ramid Gradation, Cu 7
~ — X
300
C o nfin ing P ressure, psi
100 200 700400 500 600
Figure 2.7: Influence of material gradation of friction angles (after Becker et al, 1972)
Dunn and Bora (1972) showed that shear strength increases with increased particle size.
Tombs (1969) and Charles (1973) found that the shearing resistance angle was not
significantly affected by the particle size as it was about 2° bigger for materials of Dmax
75 mm than for samples of Dmax of 10mm.
Varadarajan et al (2003) tested two different materials by using three different
maximum particle sizes (25, 50 and 80 mm) and found that the friction angle of
materials increased (Figure 2.8) or decreased (Figure 2.9) depending on the type of
material with maximum particle size.
14

50
S 46l.cnoQofu>c< 42co
38
34
Alluvial Rockfill- Gravel, Cu 133
□□ □
TT
O
A Dmax 3.2 in
□ Dmax 2 in
O Dmax 1 in
10
l o g (03 /pa )
100
Figure 2.8: Influence o f maximum particle size on friction angle of alluvial rockfill
(after Varadarajan et al, 2003)
A□
Quarried Rockfill-Gravel, Cu 18
OO
n0 O Dmax 1in
A □
A□ Dmax 2 in
A Dmax 3.2 in
50
46raoO
42
38
34
10
lo g (0 3 /p a )
100
Figure 2.9: Influence o f maximum particle size on friction angle of quarried rockfill
(after Varadarajan et al, 2003)
The results of a series o f triaxial tests on sand by Koemer (1970) showed that the
strength of the material increased as particle size decreased. Another example is the
15

tests performed by Marachi et al (1969), where he found that samples with maximum
particles (Dmax) of 150 mm had an angle of shear resistance of about 4° smaller than
samples with a maximum particle size of 12 mm. Marsal (1973) performed tests on
basalt at which he varied the maximum particle size but kept the specimen diameter the
same. Table 2.1 shows the effect of this change on friction angle. The influence of
maximum particle size on the friction angle appears to be minimal at high confining
pressures
Table 2.1: Effect of maximum particle size on friction angles (after Marsal, 1973)
on, MPa dm axl/D dmax2/ D ( 9 1 -9 2 ) / 9 2 , %
0.8 0.07 0.18 3
1.6 0.07 0.18 4
3.9 0.07 0.18 0.3
dmaxi, dmax2 is the maximum particle sizes, D the diameter of the
specimen ( 1 1 3 0 mm) and cpi, cp2 the friction angles for dmaxi, dmax2
Roner (1985) concluded that there are no direct relationships between shear strength and
particle size that can be generalised in all types of soils. Other researchers (Holtz &
Gibbs, 1956; Vallerga et al, 1957) also showed that little relation exists between the
particle size and the shear strength of a specific material.
It is therefore quite difficult to rate the influence of maximum particle size and
gradation on the shear strength of the materials, since these two parameters are inter
related and are affected by any changes, unless tests are performed when one is kept
stable when the other is changed (simpler to perform by keeping the maximum particle
size the same)
2.4.3 Confining Pressure
In 1966 Bishop conducted a series of triaxial compression tests under drained
conditions on sand and found that the internal friction angle decreased as the confining
pressure increased. The same was observed by Leps (1970) as is shown in Figure 2.10,
when conducting shear box tests.
16

cn
^ 20-3
10.3
10 100 1,030
Normal stress on slip surface (psi)
Figure 2.10: Effect of normal stress on friction angles (after Leps, 1970)
Pike (1973) conducted shear box tests on a number of materials with maximum particle
size of 40 mm and found that shear stress at failure increases with normal stress (Figure
2.11). It has also been found that the principal effective stress ratio at failure was much
greater for tests with low confining pressure than the tests carried out with higher values
of confining pressure (Marsal, 1973). Others (Bishop, 1966, Marsal, 1967, Vesic and
Clough, 1968, Charles and Watts, 1980 and Indraratna et al, 1993), have shown that the
shear strength values increase with confining pressures but the friction angles reduce.
600
500
400
i 300 C /5
200
100
M ii,
XffC C : ' . . . . .
+
«•/.'* Vi
X. •
X8
•. X.
X.s'X; ...wm • ♦ '♦
•
'h'C- A B -
f
♦ - • ,
v f t . ■
Vr‘-=i
♦181 ■; .
f - ’ •vy • ' ’ ' • ’ ■ vC :'. f e e ?
♦ Flint-P ike
■ Q uartzite-P ike
G ritston e-P ike
X L im esto n e-P ik e
X S Ia g -P ik e
• S a n d sto n e-C & W
+ S late-1-C & W
-S la te -2 -C & W
— B asalt-C & W
0 50 100 150 200 250 300 350
N o rm al S tress , kPa
400 4 5 0
Figure 2.11: Effect o f normal stress on shear stress o f granular m aterial
17

2.4.4 Density
Zeller and Wulliman (1957) observed that the friction angles increase with relative
density for granular materials of Dmax of 10 , 3 0 and 1 0 0 mm (Figure 2 . 1 2 ) .
55
50
45
Dmax 10mm
Dmax 30 mm
Dmax 100mm
CD
40
35
30
0 10 20 30 40 50 60 70 80 90 100
Relative Density - Percent
Figure 2.12: The effect of relative density on friction angles (after Zeller and Wulliman,
1957)
Marsal (1973) reported that the variations in friction angles between different densities
was in the range of 3° to 4° for material tested at normal stress of 65 kPa. In their paper,
Indraratna et al (1993) note that the degree of compaction and hence the initial porosity
of rockfill has a major effect on shear strength.
2.4.5 Particle Crushing
The crushing of particles can influence the behaviour of granular materials in terms of
strength, volume change characteristics, permeability, stress-strain behaviour and pore-
pressure distributions (Lee and Farhoomand, 1967 and Lade et al, 1996). Permeability
is of particular importance if the material is going to be used as engineering fill where it
can affect the pore-pressure distributions and seepage quantities (Lade et al, 1996).
Marachi et al (1969) conducted tests on three different granular materials and found that
there is a relationship between the breakage of the particles and the specimens' friction
18

angles (Figure 2.13) for materials with three different maximum particle sizes (2.8, 12
and 36 inches).
Pyramid Dam Material Crushed Basalt Oroville Dam Material
50 —
46
c 42 424 2 • -
■ 36 Inches
+ 1 2 Inches
• 2.8 Inches
■ 36 Inches
+ 12 Inches
• 2 .8 Inches
■ 36 Inches j
+ 12 Inches ;
• 2 .8 Inches
10 20 30 40 50 o 10 20 30 40 50 0
______________ Particle Breakage Factor, B. % (see Section 2.4.5.2)
10 2q
Figure 2.13: Angle of internal friction against breakage factor (after Marachi et al, 1969)
2.4.5.1 Factors affecting Particle Crushing
The factors affecting particle breakage have been investigated extensively and the
findings may be summarised as follows:
1. The amount of breakage is affected by many factors, such as the stress level and
the stress path applied to them (Lee and Farhoomand, 1967, Lade et al, 1996).
2. Yamamuro and Lade (1993) established that the crushing of particles depends
on the types of materials tested and continues with time, even when the material
is under constant stress.
3. Particle size is also a factor that affects the degree of breakage of a material.
Larger particles are thought to be more prone to breakage than the smaller ones
due to the fact that they contain more defects and/or micro-cracking (Flardin,
1985). This is probably a result of the smaller particles being created from the
larger ones fracturing along these defects, and therefore as the process continues
fewer and fewer defects exist within the smaller particles (Hardin, 1985).
19

4. Increased angularity increases particle breakage, as the stresses can concentrate
along their smaller dimension and fracture it more easily (Lade et al, 1996).The
concentration of stresses at angular points of contact causes fractures at those
points (Yamamuro and Lade, 1993). The same researchers also found that well-
graded soils do not break as easily as uniform soils, probably because when
more particles surround each particle, the average contact stress tends to
decrease.
5. It has been noticed that the addition of water in materials increases the particle
breakage (Hardin, 1985; Lade et al, 1996), probably due to the softening of
particles
6. Extensive coverage of particle crushing has been conducted by Nakata et al
(1999). They performed individual particle strength testing, and triaxial tests in
which marked (painted) particles of the same composition, size and shape as the
individual tests were placed within the triaxial test sample. This was done to
identify the behaviour of the particles individually and as part of granular
specimens. The results were inconclusive as to if the crushing behaviour of the
particles changed when they were part of a triaxial specimen.
2.4.5.2 Particle crushing quantification
Almost all the investigations concerning testing o f granular materials have noted
particle breakage (e.g. Barden et al, 1969; Murphy, 1971; Hagerty, 1993), even at
relatively low pressures. Many attempts have been made to quantify and measure this
problem with the use of breakage factors, most of them based on the changes of grain
size distribution of the materials before and after testing.
The most widely used breakage factors are the ones developed by Marsal (1967) and
Lee and Farhoomand (1967):
• Marsal noticed significant amounts of breakage of particles while performing
large-scale triaxial tests on rockfill materials. His breakage factor, Bh uses the
sum of the percentage differences, for each sieve, between the initial and final
gradation curves.
• The breakage factor of Lee and Farhoomand (1967) is based on the change
before and after testing, of a single particle diameter namely the 15% finer on
the grain distribution curve. Their factor (D 15(lnitiaI) / D 15(Finai)) was ^ e ratio
between the initial and final grain size corresponding to 15% fines line. The
20

relations of this breakage factors to the grading curves of the materials are given
in Figure 2.14.
toe
Initial Gradation Hardin s
Breakage i Potential
L Bp
Gradation
[ Lee &I Farhoomand 1 D(15i)/D(15f)
Hardin's total Breakage BtMarsal's B
2 % as bJt a, t amGRAIN SIZE * MILOMETERS
o o c 0.01
Figure 2.14: Breakage Factors (Lade, Yamamuro & Bopp, 1996)
Particle breakage quantification is based on the grading curves before and after shearing.
Despite this though, it is almost impossible to obtain a direct relationship between
particle breakage (and the properties affecting it), and shear strength since the amount of
breakage depends on other factors. For example different materials with identical
gradations, undergoing the same shear testing, will exhibit different amounts of
crushing if other properties like particle shape and individual particle strength are
different.
2.4.6 Relation between permeability and particle crushing
Duncan et al (1972) and Lade et al (1996) have also investigated the relationships
between particle gradation and size with permeability. Hazen (1911) developed a
formula relating the grain size with permeability:
k = 100 x (D10)2
where k is the permeability coefficient (cm/s)
D l0 is the effective grain size.
21

Taking this formula into consideration, Lade et al (1996), developed an alternative
breakage factor B10 based on D 10 particle size and on the effective grain size before the
test (D10l) and after the test (D10f):
B io =1 ~ O W B ioi)
The minimum value of the factor is zero, where no breakage occurs and the upper value
is one, where infinite breakage occurs.
2.4.7 Summary
Table 2.2 presents a summary of the parameters and their possible effect on shear
strength/friction angle according to literature.
Table 2.2: Summary of parameters affecting shear strength
Parameter Comment
Particle Shape Shear strength increases with particle angularity
Sample Gradation and
Maximum Particle Size
Broader gradation increases strength but parameters and
their effect too interlinked to be able to safely conclude
which has the biggest effect
Confining Pressure Shear strength increases with confining pressure but the
friction angle appears to reduce
Density Shear strength and friction angle increase with density.
Particle Crushing Friction angle tends to reduce with increasing particle
crushing
2.5 Compaction
For natural coarse granular materials, the density is generally is understood to be related
to the moisture content and the compactive effort. At low moisture contents the soil has
low workability and is therefore difficult to compress. By adding water the material is
provided with the lubricant that it needs to move more freely (Watson, 1989). The
introduction of excessive water leads to higher saturation levels which keep the particles
apart during compaction, which reduces the density of the material. The control of
moisture during compaction therefore becomes one of the most important factors to
consider in earthworks control (Wignall et al, 1999). Optimum moisture content is
defined as the moisture level at which maximum dry density of the material is achieved.
22
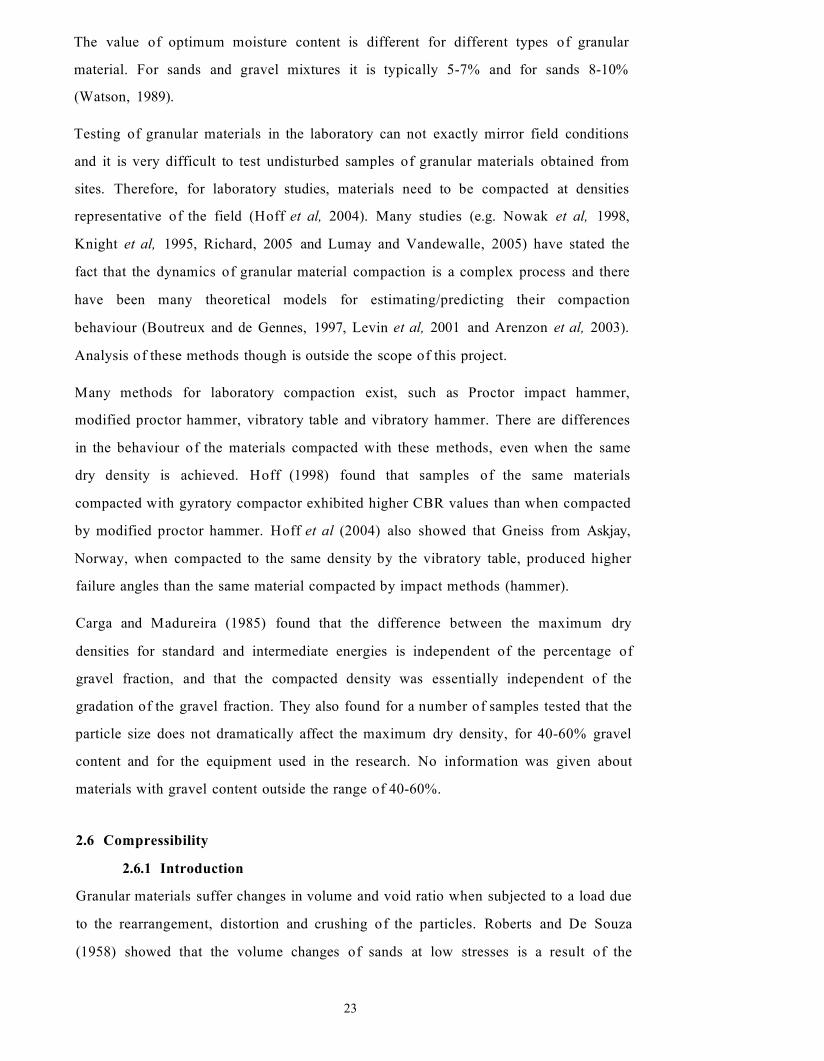
The value of optimum moisture content is different for different types of granular
material. For sands and gravel mixtures it is typically 5-7% and for sands 8-10%
(Watson, 1989).
Testing of granular materials in the laboratory can not exactly mirror field conditions
and it is very difficult to test undisturbed samples of granular materials obtained from
sites. Therefore, for laboratory studies, materials need to be compacted at densities
representative of the field (Hoff et al, 2004). Many studies (e.g. Nowak et al, 1998,
Knight et al, 1995, Richard, 2005 and Lumay and Vandewalle, 2005) have stated the
fact that the dynamics of granular material compaction is a complex process and there
have been many theoretical models for estimating/predicting their compaction
behaviour (Boutreux and de Gennes, 1997, Levin et al, 2001 and Arenzon et al, 2003).
Analysis of these methods though is outside the scope of this project.
Many methods for laboratory compaction exist, such as Proctor impact hammer,
modified proctor hammer, vibratory table and vibratory hammer. There are differences
in the behaviour of the materials compacted with these methods, even when the same
dry density is achieved. Hoff (1998) found that samples of the same materials
compacted with gyratory compactor exhibited higher CBR values than when compacted
by modified proctor hammer. Hoff et al (2004) also showed that Gneiss from Askjay,
Norway, when compacted to the same density by the vibratory table, produced higher
failure angles than the same material compacted by impact methods (hammer).
Carga and Madureira (1985) found that the difference between the maximum dry
densities for standard and intermediate energies is independent of the percentage of
gravel fraction, and that the compacted density was essentially independent of the
gradation of the gravel fraction. They also found for a number of samples tested that the
particle size does not dramatically affect the maximum dry density, for 40-60% gravel
content and for the equipment used in the research. No information was given about
materials with gravel content outside the range of 40-60%.
2.6 Compressibility
2.6.1 Introduction
Granular materials suffer changes in volume and void ratio when subjected to a load due
to the rearrangement, distortion and crushing of the particles. Roberts and De Souza
(1958) showed that the volume changes of sands at low stresses is a result of the
23

compression of the soil skeleton and particle rearrangement. Even though at low
stresses there is some crushing on sands, it becomes the dominating factor of the
compressibility of sands at higher stresses (Lee and Farhoomand, 1967, Hardin, 1985
and Hagerty et al, 1993). Similar behaviour has been observed for larger granular
materials, and their compressibility has been attributed to the rearrangement o f particles
during loading and the breakage of highly stressed points (Marsal, 1967, Lade et al,
1996, Yamamuro and Lade 1993). The compressibility of granular materials, as a whole
and not on the individual particle level, depends on many factors such as gradation,
particle size and shape (Rowe, 1955, Roberts and De Souza, 1958, Schultze and Moussa,
1961), and the literature on the influence of each factor is reviewed separately below.
2.6.2 Effect of Particle Shape
Hagerty et al (1993) found that material that contained angular particles showed a
greater degree of compressibility than material with the same median grain size and
composition that contained spherical particles. These results are in agreement with the
findings of Pestana and Whittle (1995) and Pigeon (1996). They attributed the
behaviour to the fact that angular particles crush more easily than rounded, and
therefore it is easier to fill the air voids with crushed material and to have re
arrangement of the particles within the material. Cho et al, (2006) also found that the
compression and decompression indices reduce with increased regularity calculated as
(Sphericity + Roundness)/2, and it is shown in Figure 2.15.
Figure 2.15: Compression and decompression indices against particle shape (after Cho
et al, 2006)
(c) O C onpressbn index
• Deconpression index
eC c = 0 .0032 p '‘ 5
(r2 - 0 .52) o ' ' . ° 0
C s“ 0.0028 p‘° 4
(r2 = 0.82)
T3amao
o° 0.001
0 0.2 0.4 0.6
Regularity, p“(/f +5 )/2
0.8
24

Note: The compression index is calculated by drawing a curve along the compression
line against different loading (1 kPa and 10 kPa or 2 kPa and 20 kPa) and at different
void ratios. The index is calculated by subtracting the two void ratios. The opposite
gives the decompression index.
2.6.3 Effect of Individual Particle Strength
Tests performed by Pestana and Whittle (1995) on two types of sands found that Ottawa
sand was more difficult to compress than Quiou sand. This was a result o f the fact that
the main constituent of Ottawa sand is quartz and the main constituent of Quiou sand is
calcitic shell fragments. Quartz is stronger and therefore more difficult to crush than
calcitic shell fragments. Similarly Yamamuro et al (1996) found that that material with
relatively weaker, in terms of strength, particles showed a “faster” compression
response to stresses, which was attributed by the researchers to the fact that soft grains
allowed the material to flow plastically and fill the voids easier and faster.
2.6.4 Effect of Material Void Ratio (dry density)
Roberts and de Souza (1958) observed that void ratio is one of the main factors that
affects the compressibility of sand and ground quartz. Tests performed by Hite (1989)
on loose and dense samples of sand showed that the compressibility of the materials
decreased with increased density. However when the stresses reach a level when
particle breakage occurs, then the degree of influence of the initial void ratio decreases
and becomes minimal (Hendron, 1963, Vesic and Clough, 1968 and Hagerty et al,
1993). This was also noticed by Yamamuro et al (1996), who observed that the effect of
the initial void ratio was eliminated at high pressures. Pestana and Whittle (1995) also
reached the same conclusion, but noted that cementation might play a role in the
behaviour but did not proceed to a more detailed investigation of the subject.
2.6.5 Effect of Material Grading
In tests triaxial tests by El-Sohby (1964) and Pigeon (1969) it was found that the
material compressibility decreases as their grading broadens. The same behaviour was
observed during an investigation of the effects of the grading and density on the
mechanical properties of crushed dolomite by Thom and Brown (1988). On the other
hand Marsal (1966) performed drained triaxial tests on coarse gravel and broken rock
and observed that the coarser materials compressed more as grading broadens. The
25

apparent contradiction of the effect of grading on the compressibility of the materials
possibly indicates that other factors, especially listed in this paragraph, play a more
important part than grading in the behaviour of the materials.
2.6.6 Effect of time
Special attention has also been given to the compression with time relation. De Souza
(1958), Roberts and De Souza (1958) and Pestana and Whittle (1995), all found in their
research, that included triaxial and one dimensional compression testing, that the
compression of granular materials starts almost from the time, the load is applied to
them and continues with time but at a decreasing rate, as long as the load is applied
continuously. This is similar to the phenomenon of secondary compression or creep
effects, observed with clay soils (Lee and Farhoomand, 1967). This continuous
compression is attributed to the continuous deformation, re-arrangement and breakage
of the particles under load (Roberts and De Souza, 1958 and Pestana and Whittle, 1995).
The exact response of the materials depends on their particles’ properties, the magnitude
of the load and the stress path(s). This was observed by Houlsby and Psomas (2001)
when they tested sand in a one dimensional compression tests at load increments of 28.3
kPa (Figure 2.16)
time [si
1850 1500 1950 2000 2050 2100 2150
-5.75
undrained stage drained stage
c -6.25
-6.75
■7 CO
Figure 2.16: Displacement against time for sand (After Houlsby and Psomas, 2001)
2.6.7 Effect of Water
Holestol et al (1965) determined by field and laboratory tests that the compressibility of
mixes of unweathered granitic gneiss and amphibolite increase with the addition of
26

water. The same phenomenon was observed by Sowers et al (1965) on their tests on
broken rock. Miura and Yamanouchi (1975) showed that the introduction of water can
affect the compressibility of cohesionless soils by increasing particle breakage (through
weakening the individual particles), a phenomenon that is more intense in materials
with larger particles (Leslie, 1975). Clements (1981) observed that flooding particle
contacts caused additional displacements to the materials tested. Sun et al (2004) also
found that for identical materials, the saturated specimens exhibit more volumetric
strain(dilation) in comparison to the unsaturated specimens for three different normal
stresses (Figure 2.17).
to
G r = 3 9 2 kPa8
to'
6
1 9 6 kPa4
2
00 5 10 1 5
e a ( %)
Figure 2.17: Volume change behaviour of saturated and unsaturated materials (after Sun
et al, 2004)
2.7 Leachate
Leachate is the liquid that drains or 'leaches' from a landfill site or in this project's case
from the materials when they are compacted and left to be permeated by precipitation
that can groundwater, rain, frost and/or melted snow. It varies widely in composition
regarding the type of the landfill or in this case the type of the materials. The production
of leachate has the potential to interfere with the mechanical properties of the material.
Further more there is a possibility that contamination of the land, and the underground
and the surface water systems could result. Little research into the leachate generation
characteristics of recycled concrete and bricks has been undertaken. Due to the granular
nature of the materials, conceptually it may be assumed that particle size may have an
27

effect on the amount of produced leachate. Hill (2001) did indeed find that the larger the
particles the less likely they are to leach.
Dawson (2001) found that the existence of Ca2+ (Calcium ions) in concrete is the most
likely chemical to produce leachate, and found also that a high pH reduces the
production of leachate. The same research also indicates that of the chemically
untreated recycled materials used in road construction, concrete is one of the most
unlikely to produce leachate. Dawson showed, using in-situ tests, that the use of
recycled materials including crushed concrete does produce a small amount of leachate
but its chemical components not only do not exceed the pollution limits but they exist in
very small concentrations.
2.8 Recycled aggregates research
This section of the thesis presents some recent research on the use of recycled materials
as aggregates and provides information of the types of tests conducted and the results
obtained.
McKelvey et al (2002) investigated the behaviour o f two types of recycled aggregates
under repeated load on a series of shear box tests and vertical stresses varying from 60
kPa to 300 kPa. The first type of material (named SI for this discussion) was crushed
concrete obtained from crushing concrete tubes. The second type of materials (named
S2) was crushed brickwork containing bricks (of at least 95%) and mortar.
Sivakumar et al (2004), also investigated the behaviour of two recycled materials,
similar to SI and S2, during large shear box tests named S3 and S4 for the purpose of
this discussion. S3 was crushed concrete obtained from crushing concrete tubes and S4
was crushed brickwork containing bricks (of at least 95%) and mortar. All materials
were sieved and had particles between 20 and 40 mm.
The fiction angles, determined from a straight line from the origins to the value of shear
stress for 300 kPa, wrere and 39° for SI and 37° for S2 and 43° for both S3 an S4.
McKelvey et al (2002) and Sivakumar, et al (2004) state that the particle crushing of the
materials was high but do not give specific values.
Aurstad et al (2005) have tested crushed concrete with particles ranging from 0-63 mm
(DG2) and from 20-63 mm (OG2) in a large triaxial apparatus (diameter 300 mm and
28

height 600 mm). They found that the friction angle of DG2 was always higher than 48°
and for material OG2 higher than 60°.
Aurstad et al (2005) have also observed that the crushing of particles is low for the
grading of the materials from 0-63, but quite significant for the materials when they
contain particles from 20-63 mm. Taking into consideration the results of this
investigation together with the results presented by Aurstad et al (2005), McKelvey et
al (2002) and Sivakumar et al (2004), it appears that recycled materials with minimum
particle sizes of 20 mm crush more than the same type of materials containing finer
particles. This may be a result of the “ability” of broader gradation to fill more voids
and restrict the movement of larger particles. Further testing will be needed though to
verify this.
Rathje et al (2006) conducted comparative tests on crushed concrete and limestone in
respect to utilising them as backfill for mechanically stabilized earth walls. They
determined the permeability and friction angle of the materials. The friction angle of
both materials was 46° and the coefficient of permeability of the crushed concrete
varied from 1x10⁻³ m/s to 8.5x10⁻⁵ m/s. The crushed limestone exhibited a coefficient
of permeability of 1x10⁻² m/s. They concluded that the friction angle of the crushed
concrete is acceptable for the specific backfill engineering applications but the
permeability is a concern.
Huurman and Molenaar (2006) have conducted a series of large scale triaxial tests on
materials containing 65% of crushed concrete and 35% of crushed masonry with
maximum particle size of 40 mm. They used six different gradations but kept the
maximum particle size the same. The found that the he friction angles of the materials
varied from 42° to 46°.
2.9 Concluding Remarks
The literature review on recycled materials has shown that they exhibit significant
friction angle values an can be utilised by the industry for field applications. Their
behaviour is also similar to natural aggregates and tests used for them can be applied in
testing recycled aggregates. It is clear though that there are many types of recycled
aggregates in existence and their properties depend on factors such as the type and age
of buildings demolished, the amount of processing they have undergone, if more than
29

one types of materials is used to provide the testing samples and their grading curves.
The literature review has also shown that the investigation of the shear strength of the
materials should include testing the materials under different "conditions" and
"parameters" such as sample density, maximum particle size, particle shape, moisture
content.
All these different "conditions" and "parameters" and their effect on the shear strength is
have been analysed in this chapter and are summarised below:
• The shear strength, compressibility and crushing of granular materials increases
with angularity. In addition to determining the shape of particles with the use of
British Standards (BS 812-105), a more complete description can be given by
the methods described and used by Rosslein (1941) and Lees (1964).
• The reviewed research has proven inconclusive on the exact effect of the grading
on the shear strength and compressibility of granular materials.
• The reviewed research has proven inconclusive on the exact effect of the
maximum particle size on shear strength. It has shown though that particle
crushing tends to reduce with maximum particle size due to less defects existing
in smaller particles.
• The shear strength of granular materials increases with confining pressure but
the opposite occurs in their friction angles.
• The increase in the specimens' density results in the increase of shear strength
but in the decrease of the compressibility. The effect on the compressibility
appear to reduce though when high confining pressures are reached.
• The addition of water appears to increase the compressibility and the crushing
properties of the materials.
• When sustained long term stress is applied to granular materials, then particle
crushing and compression continues to occur.
• Almost all research on granular materials has shown particle crushing due to
loading and the most widely used methods for quantification are the breakage
factors after Marsal (1967) and Lee and Farhoomand (1967).
• It is very difficult to produce laboratory specimens representative of site
conditions, and therefore great attention should be given to specimen
compaction and preparation.
30

• Crushed concrete creates small amounts of leachate, but the chemical
components leached are significantly lower than the permitted limits.
It can be seen therefore that the behaviour of engineering fill is a complicated subject
affected by many variables.
Therefore a comprehensive large scale testing schedule that includes the investigation of
these different "conditions'* and "parameters" together with the shear strength of the
materials is needed which will also include the development of large scale testing
equipment.
31

CHAPTER 3
RATIONALE FOR EXPERIMENTAL PROGRAMME
3.1 Fundamental Aspects of Experimental Programme
The objectives of the project were defined in Chapter 1 to be:
1. To provide a base for future research by investigating the physical and mechanical
characteristics of crushed recycled aggregates
2. Provide data on the strength of recycled aggregates so they can be utilised by the
industry.
3. Compare the properties of recycled materials with other research on recycled and
primary aggregates.
4. Compare the characteristics and performance of different types of recycled materials.
The testing programme for this investigation has been derived according to these
objectives and the information collected from the literature review. At the outset, it was
apparent that fundamental choices had to be made with regard to the maximum particle
size to be tested, the focus of the testing work and the number of tests. Each aspect is
discussed below in turn. The equipment and procedures used for determining the
Physical Properties and the Main Series testing procedures are presented in detail in
Chapters 4 and 5 respectively. Chapter 6 presents the three types of materials chosen as
representative of crushed concrete and bricks utilised by the industry.
Three types of materials were going to be tested in this investigation. Two types of
crushed concrete, one (Material A) removed from a demolition site with no further
processing and one (Material B) was furthered processed at a crushing site. The
brickwork rubble (Material C) has also been processed in the same crushing site as
Material B. A complete description of the materials used and the processes involved in
the acquisition of the materials is given in Chapter 6.
3.1.1 Selection of Maximum Particle Size
A significant problem resulting from the large size of the materials is the inability to
perform all the necessary tests with existing standardised equipment. Two possible
solutions to this obstacle were identified early in the research project:
1. Scale down the materials maximum particle size, or
2. Develop new large scale equipment that can accommodate particle sizes up to 50 mm.
32

The latter of these was chosen in order to test representative materials of in situ fills,
and due to the fact that similarly large particle sizes were used by many researchers
(Charles and Watts, 1980, Indraratna et al, 1993 and Indraratna et al, 1998) for the
investigation of the properties of engineered fills. By testing similar maximum particle
size materials, the effect of the particle size variable is removed from any comparisons,
making them more relevant.
A further consideration in defining the test programme and the maximum particle size
of the specimens is the non-uniformity of the materials proposed to be investigated in
this project. Observations of crushed concrete indicate that particles larger than about
20mm were made up mainly of concrete whilst the smaller particles were a mixture of:
• The gravel used for the manufacturing of the original concrete
• Composite concrete particles (containing cement and gravel particles )
• Fragments of cement
This non-uniformity would make the scaling down of the materials for testing a
procedure that would probably lead to inaccurate results, as it would significantly alter
the samples' properties due to, for example, alterations in particle shape and particle
strength. It was therefore considered necessary to develop equipment that can
accommodate materials with particle sizes up to 50 mm, despite the difficulties that this
would present
3.1.2. Testing Programme
Having determined the maximum particle size, it was necessary to define the testing
programme. It was necessary to develop a testing programme that would:
1. Be able to describe and classify the materials, and
2. Establish their suitability for their use as engineering fill
In order to achieve these, a testing programme was devised that included two main
series. The first, Physical Properties Series (PPS) included tests to determine the
physical properties of the materials (see Section 3.2). The second, Main Series Testing
(MST), included large scale testing for the determination of the shear strength, particle
crushing and permeability (see Section 3.3). It was decided not to investigate the
compressibility of the materials due to time and material restrictions.
33

3.1.3 Number of Tests
Due to the challenges of testing these types of materials, specifically the potential
variability of the samples obtained and the reliability of the results from newly
established equipment and testing procedures, it was decided to undertake a
significantly large number of tests in order to identify any possible effects of sample
variability on the results and more fully understand the repeatability of the test data.
3.2 Physical Properties Testing Series
The Physical Properties Series (PPS) was undertaken to identify fundamental material
characteristics, using standard methodologies where possible. Table 3.1 summarises the
tests included in the PPS programme, together with the aim of each test and the standard
used for performing it. The tests were targeted to identify the main characteristics of the
materials that may possibly affect properties such as the shear strength and permeability,
as has been discussed in the literature review.
Table 3.1: Tests included in the Physical Properties Series
Test Method Used Aim of Test
Grading Mechanical Sieving Determine the Grading Properties
Particle Shape BS 812-105.1, 1989 Determine the Flakiness Index
Particle Shape BS 812-105.2,1990 Determine the Elongation Index
Particle Shape Rosslein (1941) and
Lees (1964)
Determine three dimensional shape
of the particles
Water Absorption BS 812-2, 1995 Determine the water absorption
Particle Density BS 812-2, 1995 Determine the particle density
AIV BS 812-112, 1990 Determine Aggregate Impact Value
ACV BS 812-110, 1990 Determine Aggregate Crushing Value
Freezing-Thawing BS EN 1367-1, 1999 Resistance to freeze-thaw cycles and
affect on materials' strength
Compaction BS 1377-4, 1990 Determine compaction characteristics
according to BS
Compaction Large scale dynamic
compaction
Determine compaction characteristics
for maximum particle size of 50 mm
34

3.2.1 Shape
The literature available on the effect of particle shape on shear strength of granular
materials is somewhat confusing. Even though some researchers (Marsal, 1967;
Kirkpatrick, 1965; Leslie, 1963) indicate that the particle shape affects the strength (see
Chapter 2), others (Holtz & Gibbs, 1956; Vallerga et al, 1957) have shown that there is
a negligible effect of particle shape on the behaviour of granular material. As the effect
is uncertain, it was decided to determine particle shape as analytically as possible,
within the context of this project, using the following methods:
• Flakiness and Elongation Index.
• Description of three dimensional shape according to Rosslein (1941), Zingg
(1935) and Lees (1964).
As the materials tested are not homogeneous it was considered necessary to produce
results not only for the whole of the materials but also for each of the individual particle
sizes fractions in order to establish the effect the size has on the shape of the materials.
3.2.2 Grading
The grading curves of the materials were determined by using the dry sieving method
according to BS 812-103, instead of the wet sieving methods. The reasons for this
decision were:
• The need to perform sieving tests with large quantities of materials to achieve
repeatability given the variability of recycled materials. It was considered
impractical due to time and quantity of materials restrictions to proceed with wet
sieving for the whole programme. However, a small quantity of each of the three
types of the materials was wet sieved at the same stages of the project in order to
verify the results of the dry sieving process.
• BS 812-103.1:1985 states that if the materials that are going to be tested do not
contain any significant amount of clay materials then the dry sieving method can
be applied. This is the case for all three types of materials tested in this project.
It was decided to perform sieving tests on a large quantity of the original materials at
different stages of the testing programme in order to verify the effectiveness of the
preparation procedure. These tests were carried out at five different points during this
project: Before the compaction tests, before the permeability test and before, after half
the shear box tests have been completed, and at the end of the shear box testing series.
35

3.2.3 Compaction
The British Standard 1377-4 test method may only be applied to the crushed concrete
materials that have not been furthered processed (Material A, see Chapter 5) according
to paragraph 3, note 2. As a result, a non British Standard test method was adopted
using a 300 mm diameter mould with the materials compacted using a Kango K900
vibrating hammer. Material A was also tested according to BS 1377-4, 1990 in order to
provide data for comparing the two methods.
3.2.4 Aggregate Impact Value (AIV) and Aggregate Crushing Value (ACV)
The AIV and ACV tests give the relative strength of aggregates against impact and
crushing loading by determining the ability of an aggregate to resist crushing. The lower
the figure the stronger the aggregate, i.e. the greater its ability to resist crushing. The
AIV and ACV tests were performed in this investigation for two main reasons:
1. Initial indication of material strength
2. Initial comparison between the recycled materials and industry products
The materials tested according to these standards (BS 812-112:1990 and BS 812-
110:1990) should pass through the 14 mm sieve and be retained on the 10 mm sieve. It
was appreciated that due to the non-uniform nature of the materials (see paragraph 3.1)
it is quite possible, within this particle fraction requirement (14 to 10 mm), to test
samples that are not representative of the materials as a whole. Despite the risk of not
obtaining results representative of the materials as a whole, it was decided to proceed
with the tests according to the standards so the values could be compared with natural
materials.
3.2.5 Freezing and Thawing
The materials were tested for their resistance to freezing and thawing by:
1. Conducting freezing and thawing cycles according to BS EN 1367-1
2. Determining the effect it has on their strength by conducting AIV and ACV tests after
the freezing and thawing process.
3.3 Main Series Testing (MST)
This paragraph describes the rationale behind the Main Series Testing (MST)
programme. This series included large-scale, non-British standard tests in respect of:
• Permeability
36

• Particle Crushing
• Shear Strength Testing, in a Large Shear Box
This section does not include the description of the equipment and the exact procedures
followed in these tests, as these will be given in Chapters 4 and 5 respectively. A
summary of the tests performed is given in Table 3.2.
It was intended originally to test the materials for their compressibility and leachate
properties. Due to a combination of budget, time and material restrictions this proved to
be impossible.
Table 3.2: Tests included in the Main Series
Test Description of Test Variables Investigated
Permeability Constant Head Method on a Large scale
permeability cell
N/A
Particle Determine the particle crushing of the Dry density and
Crushing materials due to shear box testing maximum particle size
Shear Box Determine the shear strength of the
materials using a large scale shear box
Dry density and
maximum particle size
3.3.1 Specimen Moisture Content and Dry Density
All three types of materials were to be removed from the storage bays, transported to the
laboratory, compacted and tested immediately at their natural moisture content. The
moisture content of all the materials was in the range of 2.0 +/- 0.2 % (see Chapter 6).
By testing the materials at the same moisture content the intention was to:
• Eliminate the influence of moisture on the results of the different tests and
materials and therefore establish more clearly the effects of other parameters
such as maximum particle size and dry density.
• Minimise the extra cost, time and work required to make changes to the
moisture content which would not be undertaken in industry due to the
significant negative impact on cost of such processing.
Before proceeding with the MST it was necessary to undertake initial compaction trials
in order to establish a suitable dry density for testing because of the variability and the
37

limited information existing on the testing of these types of materials. The trials took
place in the shear box (316 mm square by 160 mm deep) and a 300 mm diameter
circular mould that was used for the compaction tests (See Chapter 4 for details of the
equipment).
The compaction trials procedure was different from the compaction test procedure that
was used in this project. The trials were carried out on the materials with moisture
content of 2 % (standard deviation of 0.24) and with layer depths of 50 mm. The
samples were continuously compacted for a period of 3 minutes, with the use of a
Kango K900 vibrating hammer, and it was determined that the dry density achieved
under these conditions was 1.83 (+/- 0.13) and 1.84 (+/- 0.19) Mg/m3 (average of 3
trials) for the crushed concrete materials for the circular and shear box moulds
respectively. For the crushed brick materials the dry density values were 1.81 (+/- 0.06)
and 1.79 (+/- 0.11) Mg/m3. It was therefore decided to proceed with testing of the
samples with a dry density of 1.8 Mg/m3, as this value can be achieved with the specific
compaction process and compares well with published data from other research (e.g.
Indraratna et al, 1993 and Varadarajan et al, 2003)
3.3.2 Permeability
For the determination of the permeability parameters, the constant head method
described in BS 1377-5:1990 was used, but with the cell replaced with one of 300 mm
diameter and 600 mm height. The complete specifications and the design of the large
permeability cell are given in Section 4.4. Its design and development was based on two
requirements:
• BS 1377-5:1990 states that the minimum ratio o f height to diameter of the cell
should be two.
• Marachi et al (1972) and Indraratna et al (1993) have suggested that the ratio o f
the diameter to the maximum particle size be at least 6 to render particle size
effects negligible. For the proposed maximum particle size of 50 mm this gives
a minimum diameter of 300 mm.
The effect of variation in dry density and maximum particle size were not investigated
in the permeability tests due to:
• Time required to design and manufacture the equipment.
• Lengthy sample preparation procedures required and extended duration of work.
38

3.3.3 Shear Strength Testing
The principal methods of testing granular materials for their shear strength are the shear
box and the triaxial test. Originally it was intended to conduct both types of testing by
utilising a large shear box apparatus already available and developing a large triaxial
cell able to accommodate particles up to 50 mm. This would have provided:
1. A large amount of data from the shear box tests that would have helped in
eliminating any possible effects of the variability of the materials on the results
2. A mechanism for checking the accuracy of the newly developed triaxial cell
3. Means for comparing the two methods.
Due to factors outside the control of this research though the development of the triaxial
test equipment proved to be impractical. Therefore the investigation of the shear
strength of the materials occurred with the use of shear box testing alone.
The shear box already available for this investigation could only accommodate samples
with maximum particle size up to 37.5 mm (Bishop and Henkel, 1962). The
development o f a larger shear box was considered but was impracticable due to the time
available for this research. Therefore the maximum particle size of the specimens in the
shear strength and particle crushing investigations is restricted to 37.5 mm. The
majority of the other tests in this investigation were performed on materials with 50 mm
maximum particle size (due to the fact that they had already been performed before the
inability to perform large scale triaxial tests became evident).
The different types of shear box tests performed are summarised in Table 3.3. By
conducting these tests it was intended to determine any possible effects the dry density
and maximum particle size might have on shear strength. The use of the second testing
dry density of 1.6 Mg/m3 was selected because:
• It was not practical to achieve any higher specimen density than 1.8 Mg/m3 (see
Section 3.3.1)
• It was considered that reducing the density to values higher than 1.6 Mg/m3
would not have been enough to produce clear results on its effect on shear
strength
• There has been published data on the properties o f granular materials where
similar density values have been used (Indraratna et al, 1998), and therefore
comparisons will be possible.
39

Table 3.3: Types of shear box tests and variables investigated
Test Type Dry Density (Mg/m3) Maximum Particle Size (mm)
SBT1 1.8 37.5
SBT2 1.6 37.5
SBT3 1.8 28
The materials were tested at five different normal stresses (95, 143, 190, 238 and 317
kPa), the first four chosen to simulate the self load of the materials at depths of 5, 7.5,
10 and 12.5 meters and the fifth being the largest that can be obtained from the
equipment used without causing any damage to it (value simulating approximately the
self load at 16 meters). This represents typical industry practices where it is unusual to
meet fills with depths larger than 15 meters (Goodwin, personal communication).
Table 3.4: Number of tests for each of the materials for all different types of tests for all
five different normal stresses
Type and Number of testsMaterial Density of 1.8 Mg/m3,
Max Particle Size of 37.5 mm (SBT1)
Density of 1.6 Mg/m3, Max Particle Size of
37.5 mm (SBT2)
Density of 1.8 Mg/m3, Max Particle Size of 28
mm (SBT3)A 50 25 15B 25 25 15C 25 25 15
The number of tests performed for each of the materials and for each of the different
types of tests is given in Table 3.4. There was a minimum number of three tests
performed for each normal stress for all the materials for each of the individual tests.
This amount (three) of tests was chosen because is the minimum number of tests the
majority of the British Standards suggest in order to obtain representative results for the
tests they describe.
The repeatability and accuracy of the test preparation and execution was verified by
initially performing a large number of tests for material A and for SBT1, for which
there were ten tests performed for each normal load. When good repeatability was
achieved the number of repetitions for each of the remaining type of test was reduced.
40

3.3.4 Particle Crushing
Particle crushing is known to occur under stress (Lee & Farhoomand, 1967, Marsal,
1967, Lade et al, 1996) and due to the nature of the materials being tested it was
decided that the breakage was needed to be quantified as part of this research.
Based on the literature review and its general acceptance it was decided to use the
breakage index (Bj) by Marsal (1967) to quantify crushing.
Particle crushing was measured as part of the shear box work in order to compare the
crushability of the materials at different density and maximum particle size values.
The total mass of the all the shear box tests performed for each type of material was
sieved at the end to obtain their crushing values. It was considered to sieve the materials
tested for each individual normal stress but it was decided that this would not produce
robust and representative results due to the relative small mass used for each test. This
provided crushing values for Materials A, B and C for two different dry densities and
two different maximum particle sizes.
41

CHAPTER 4
DESCRIPTION OF THE TEST EQUIPMENT
4.1 British Standard Tests
The equipment used in this project for performing the BS tests fell within the
specifications stated within the corresponding standard. All the dimensions were
measured with a vernier caliper, which in turn was calibrated with the use of a
calibration rig with a micrometer head readable to 0.01 mm (+/- 0.01 mm). The basic
types of equipment used for sample preparation were all within their required
calibration period. A list of the basic equipment used in this investigation is presented in
Appendix A.
4.2 Compaction Tests
The compaction mould used for the large scale compaction trials was manufactured
from mild steel (Figure 4.1) with stiffening flanges at 1/3 and 2/3 of its height.
Stiffeners
Figure 4.1: The large scale compaction mould
The dimensions of the compaction mould (300 +/- 1 mm diameter and 400 +/- 2 mm
depth) was measured before and after each set of tests for the individual moisture
contents and it was found that they were not affected by the compaction force applied.
From the literature review, it has been established that the best methods for compacting
granular materials are the vibratory table or the vibratory hammer (Section 2.6). The
42

large scale of the equipment used for the shear and permeability tests though makes the
use of the vibratory table impractical and therefore the vibratory hammer method was
used.
The vibrating hammer used for the mould compaction was a Kango 900K with an
output of 1050 W. The force applied to the vibrating hammer (with the tamper attached
to it) was in the magnitude of 350 ±10 N and was calibrated against an Avery
Birmingham, type 3205 CLE scale by determining the pressure required to be applied
by the user to achieve the necessary compaction force.
4.3 Climatic Chamber
Figure 4.2 shows the chamber system used for the freezing-thawing process of this test.
Figure 4.2: The climatic chamber and computer control system
Testing for the resistance of the materials to freezing and thawing took place in
accordance with the European Standard EN 1367-1:1999. The climatic chamber used
for this test was designed and constructed according to the Ceram research (formerly
known as BCRA or the British Ceramics Research Association Ltd) chamber
specifications and it is described in more detail in Peake and Ford (1984). In brief, the
43

accelerator has dimensions of 1.9 m by 2.0 m in the base and it is 1.2m high (external
dimensions) with the outer skin having 80mm of insulation between external (ambient)
and internal conditions. The specific chamber used in this test was modified by
Sheffield Hallam University to facilitate computer control of the cycle such that any
period of freezing or thawing could easily be run, with finer control over the number of
cycles per day and the maximum and minimum temperatures.
The chamber is mounted in a steel frame which also provides the platform for the
refrigeration and the computer control system. The computer display duplicates the
display of time and temperature within the chamber, with the use of thermocouple
sensors, and is capable of varying the inside temperature profile against time in order to
be able to comply with the standards used. Figure 4.3 shows the recorded temperature
against time profile for each of the freezing cycles used for the test, which complies
with the specifications of EN 1367-1:1999. The temperature profile produced by the
logging system was checked by the use of calibrated thermocouples and data loggers
with the use of PicoLog software.
Temperature v Time Profile
20
15
10
5
0120 180 240 300 360 420 540 600 660 720
■5
-10
-15
-20Time (mins)
Figure 4.3: Recorded profile of Temperature against Time for the Freezing cycle
4.4 Permeability
The procedure and the equipment incorporate many characteristics of the permeability
testing procedure that is described in BS 1377-5:1990 (calculations, constant head
44

method, dimension specifications), which was modified mainly only in size to
accommodate materials with maximum particle size of 50 mm.
The large scale permeability cell used (Figures 4.4, 4.5 and 4.6) was a cylinder of 300
+/- 2 mm drain section pipe made of hardened plastic of a height of 615 mm to
accommodate the sealing groove, the permeable mat and the steel mesh and still allow
for a specimen of 600 mm height. The wall thickness was 10 mm.
Copper Manometer Tubes - Restricted at the ends
Inlets/outletsSealing Groove & Seals
▼A
Sealing glands
A
Sealing glands
Cell Walls
Connection Steel Bars
Sealing Groove & Seals
Inlets/outlets Cell Legs
: Permeable mat
: Steel mesh Not t0 Scale
Figure 4.4: Schematic of the large scale permeability cell
45

Hardened Plastic Cell
Stainless Steel base
Manometer Copper Tubes
SealingglandsInlet/Outlet
Connection Steel Bars: © View A-A - Not to Scale
Compaction Top Plate
Hardened Plastic Tube
Manometer Copper Tubes
Cell Bottom Plate
Cell Legs
Figure 4.5: Schematic of the Permeability Cell (Plan View)
Connection Steel Bars
Figure 4.6: Permeability Cell
46
The key features of the equipment, as shown in the schematic of Figures 4.4 and 4.5
(View A-A) and photo of Figure 4.6, are as follows:
• Stainless steel base plate of 600 mm diameter and 200 mm thickness
• Two top plates: one with a 275 mm hole to allow for compaction and one for
performing the actual permeability test.
• Top and bottom plates have a groove of 4 mm width in which a seal is placed
• Both plates also have two valves, as water inlets/outlets
• The bottom and top plates were connected with 8 steel bars
• Copper tubes and cell connections were sealed with modified sealing glands
The large size of the bottom plate was designed to withstand the dynamic compaction
force. The base plate was placed on three steel legs to allow space for two bottom
valves.
The load applied by the pipe's weight and the force of fixing the connection steel bars
restrains the elastic seals and helps to form an airtight seal between the plastic pipe and
the end plates. This was checked by filling the empty cell with water and observing that
there were no leaks and verified during the testing where no leaks were observed too.
The constant head tank was placed at a height of 2 meters above the cell's point of water
insertion. The manometer tubes were connected with copper tubes, which were
restricted at the ends by compressing the ends and leaving only a small gap that allowed
the flow of water but retained fine particles, in order to minimise migration of fines
through them and their effect on the accurate representation of the head. Six tubes were
used, at each of two levels, 200 mm apart, three tubes were inserted through the outer
wall. The connections of the tubes with the plastic wall were sealed by the use of
modified compression glands.
Appendix B presents more details of the equipment used for the large scale permeability
tests.
Due to the lack of previous usage of these equipment parts for this type of testing it was
necessary to measure and check their dimensions and usage regularly. The checks
showed that they did not exhibit any signs of deformation (plastic pipe, sealing grooves
and bottom and top plates) or blockage (inlets, outlets, copper and plastic tubes and
pump used). The equipment parts therefore did not have to be replaced during the four
47

tests performed, with the exception of the replacement of the permeable mats and the
copper tubes that were damaged by the removal of the materials at the end of each test.
4.5 Shear Box
The shear box equipment used in the test programme is shown in Figure 4.7. The
apparatus is free-standing, and consists of a rigid base frame supporting a central
horizontal loading jack. The thrust from the jack is applied to the lower half of the ball
track mounted 316 ± 2 mm square by 160 ± 3 mm high shear box. The upper half of the
shear box is attached to a yoke, which is connected in turn to a 50 kN capacity load cell.
The horizontal loading jack is driven via a multi-speed gear box mounted within the
base of the machine. Vertical load is applied to each specimen through a rigid loading
plate and a vertical loading frame. The lower crosshead of the loading frame passes
beneath a horizontal loading beam, which transfers dead load from the end of the beam
at a ratio of 20:1. The rate was calibrated by applying dead load (10, 20, 30, 40 and 50
kg) to the loading plate and measuring the force at the other end with the use of the
calibrated 50 kN load cell. It was found to be 20.3 (±0.1): 1.
stem
Shear box
Figure 4.7: The shear box, displacement transducers and computer logging system.
48

Measurements of the load applied (measured through the load cell) and the vertical and
horizontal displacements (measured through transducers) were logged by the computer
every minute (Figure 4.7) with the help of a custom made analogue interface box
(supply of 250 V). It provides the power needed for the transducers to operate and
provides the software with the readings of the voltage changes that are then converted to
engineering units. The vertical and horizontal displacements were logged using
calibrated transducers. The detailed logging procedure is presented in Appendix C.
The transducers were manufactured by RDP Electronics (type D2/1000A) with a
capacity of measuring ± 25 mm when zeroed at the middle (capability of recording to
0.01 mm) and it was calibrated with the use of a calibration rig that was fitted with a
micrometer manufactured by Moore & Wright with a capacity of measurements up to
25 mm (readable to 0.01 ± 0.01 mm).
The load cell was a N.C.B./M.R.E. load cell of a capacity of 50 kN manufactured by
W.H. Mayes & Son (Windsor) Ltd. It was calibrated in the structures laboratory of
Sheffield Hallam University with the use of the concrete tube crushing machine by
Avery-Denison Limited to one hundredth of a kN .
Table 4.1: Calibration factors and 95% confidence limits
Equipment Calibrated Calibration Factor 95 % Confidence Limits
Upper Lower
Load Cell 0.9799 0.9833 0.9751
Vertical Displacement Transducer 0.9841 0.9897 0.9794
Horizontal Displacement Transducer 0.9896 0.9926 0.9842
The calibration procedures took place at three different points of the test series. Before
the shear box tests started, at the mid point, and at the end of the shear testing
programme. In each of the calibration procedures there were three runs of displacement
and load applied. In the load cell calibration the load applied was up to 50 kN and back
to zero again, and for the transducers the run went up to 25 mm and back to zero again.
Table 4.1 shows the calibration factors and 95% confidence limits for the two
transducers and load cell used in the shear box testing.
49

CHAPTER 5
TEST PROCEDURES
5.1 Introduction
This chapter presents the procedures followed in the individual tests performed in this
investigation. For each test, with the exception of the investigation for particle crushing
after the shear box tests, fresh materials were used.
Standard tests were undertaken in accordance with the relevant British Standard as
follows:
• Water Absorption and Particle Density (BS 812-2:1995)
• Flakiness and Elongation Index (BS 812-105.1:1989 and 812-105:2 1990
respectively)
• Aggregate Impact and Crushing Value (BS 812-112:1990 and BS 812-110:1990
respectively)
Only non-standard, research specific large scale tests are concisely described in this
chapter. The results of the physical characteristic tests are presented in Chapter 6 and
the results for the main series testing in Chapter 7.
5.2 Physical Properties Testing Series
5.2.1 Material Grading
In each of the grading tests a mass of not less of 500 kg was sieved by the use of a
mechanical shaker. To establish the exact sieving procedure, it was necessary to
perform some initial trials to check the time required for the materials to pass the
apertures and to be retained by the right sieve. Different sieving duration sessions were
performed with test times varying from 2.5 minutes to 17.5 minutes in increments of 2.5
minutes. From this, it was determined that a 15 minute duration was satisfactory.
Sieving for 17.5 minutes showed that the results were the same as with 15 minutes
sieving.
The procedure was further verified by sieving the individual fractions (from the
mechanical sieving and for a single test from all three materials) by hand and
establishing that no more particles passed through the apertures. Dry sieving was used
50

to sieve the large quantities of the materials and determine their grading. Smaller
quantities of the materials (50 kg) were wet sieved to verify the accuracy of the dry
sieving results, as discussed in Chapter 3 above.
5.2.2 Particle Shape
The materials were sieved with the use of a mechanical shaker, following the same
process established for the grading tests, and the individual size portions were stored in
plastic bags. The Flakiness Index (Fr) and Elongation Index (Ej) were determined
according to BS 812-105.1 (BSI, 1989) and BS 812-105:2 (BSI, 1990) respectively. A
vernier caliper was used for measuring the dimensions of the particles for the
determination of their elongation (q) and flatness (p) ratios. Angularity measurements
were undertaken using the chart after Lees, 1964, (Figure 2.4).
Table 5.1: Mass and particle numbers tested for each of the size fractions for Material
A, B and C
Material A Material B Material CSieve
Size, mm%
RetainedMass
Tested(kg) and No of Particles
Measured
%Retained
Mass Tested(kg) and No of Particles
Measured
%Retained
Mass Tested(kg) and No of Particles
Measured37.5 7.3 21 14.4 42 14.4 4328 8.5 25 17 50 16.9 5020 10.2 30 15.1 44 15.1 4514 12.4 36 11.2 33 11.2 3310 11 32 9 27 8.9 266.3 17.1 50 12 35 12 36
Due to the difficulty of measuring the dimensions of small particles (with the use of the
vernier caliper), the fractions were tested down to materials retained on the 6.3 mm
sieve. It was decided to produce the specimens for each size fraction to be tested
according to their percentage of mass of the original sample. This way the particle shape
of the materials as a whole will be more representative of the type and percentage of the
particles existing in each size fraction of the materials. The size fraction with the largest
mass percentage retained in the grading tests had a mass of 50 kg tested for the Fj and E{
values, and 50 particles for the measurement of their dimensions for the determination
of the three dimensional shape. The mass and number of particles was then reduced
depending on the percentage of materials retained on the other size fractions. For
51

example for Material A, 50 kg and 50 particles were tested for the size fraction of 6.3
mm. For the size fraction of 10 mm, the mass and number of particles was calculated as
(11% /17.1% ) x 50. Table 5.1 summarises the mass and particle number tested for each
of the size fractions. Both of the Indices were determined by testing the same mass of
materials, so that the results of both tests will relate to the same particles.
For the visual determination of the degree of angularity, for all size fractions, 10 particle
were placed on a clear surface in an arrangement similar to the ones shown in Figure 2.1
were tested. All the particles selected for testing were washed to remove any fines and
left to dry naturally in trays in the laboratory for a period of one week, and then stored
in clearly labelled plastic bags until testing. The average moisture content of the
materials (established immediately after the actual testing) was found to be 2.1 %
(standard deviation of 0.2). Each group of 10 particles were placed on a white clear
surface, arranged according to Figure 2.1, and photographed from 2 different angles for
better accuracy.
The Fj and Ej were investigated three times for each of the materials during the duration
of this project, at the beginning, after half the shear box tests have been completed and
at the end of the investigation, in order to minimise any possible negative effects of the
sampling process on the accuracy of the results.
In summary, the procedures established and followed in this project tried to minimise
any influence different properties may have on the particle shape results. By using a
large number of particles, and utilising the same particles for the Fj and Ej tests, the
influence of sampling and material variability was minimised. Repeating the tests three
times at different points of this research also minimized any possible errors due to
sampling procedures and the results show that a great degree of consistency has been
achieved (see Chapter 6).
5.2.3 Compaction
As described in Chapter Four, the compaction cell had dimensions of 300 mm diameter
and 400 mm depth. This was to accommodate the materials with maximum particle size
of 50 mm, for the reasons explained in Section 3.3.1.
For the compaction tests the specimen was formed in the cell in two layers each about
200 mm thick. The second layer was compacted after the maximum (possible) dry
52

density was achieved for the first layer. Then both layers were compacted until the total
mass of the two layers reached the maximum possible dry density. Water was measured
and added to dry fresh material to achieve the required moisture contents (eight
different moisture contents varying from 0 to 11%). After both layers had been
compacted, the specimen occupied about three-quarters of the cell depth of about 300
mm. Every single specimen was sampled after compaction and tested for its moisture
content.
The vibrating hammer was equipped with a tamper of a diameter of 290± 2 mm and the
force applied to each layer during compaction was 350 ±10 N. Each layer was
compacted for a number of periods of 30 (± 1) seconds. Between each time period of
compaction the depth of the sample from the top of the compaction cell was measured
at five different points (centre and four points on the sample's edges, forming a cross) so
that its volume and therefore its dry density could be determined. The compaction
testing procedure was designed in this way that there would be an opportunity to
determine:
• The effect of moisture content on compaction behaviour.
• The dry density behaviour of the materials against time of compacting effort.
• Any possible differences between the two layers of compaction.
Figure 5.1 shows a typical result. The dry density against time graph for all material
types and moisture content are similar with the dry density increasing steadily with time
for about the first three minutes of the procedure (Figure 5.1). Thereafter any additional
compactive effort had little or no effect on the dry density achieved. The values used in
the moisture content against dry density graphs (Section 6.6, Chapter 6) are those
achieved for the individual moisture contents after compacting the specimens for 8
periods of 30 seconds each, since compacting the materials for more than a total time of
4 minutes did not increase their dry density to a higher value than the one achieved for
compaction time of 4 minutes.
53

Dry Density vs Time of Compacting Effort for 8% Moisture Content for Single Layer Compaction of Material A, B and C
1.9Material B
1.8
Material A1.7
1.6
1.5
1.4 Material C
1.3
1.2
1.130 90 1200 60 150 180 210 24 0 300270
EO)
£Q
Time (s) ■Material A Material B -A-Material C
Figure 5.1: Behaviour of Materials A, B and C when compacted with 8 % moisture
content
5.2.4 Resistance to Freezing and Thawing
Particles passing the 50 mm sieve and retained on the 10 mm sieve were used for the
test, which was undertaken in accordance with EN 1367-1, 2000. After ten cycles of the
freezing - thawing process the materials were passed through the 5 mm sieve. The
resistance of materials to freezing and thawing is calculated as a percentage of materials
passing a sieve size half the size of the minimum particle size tested. In this project the
resistance of the three materials to freezing and thawing was established as a percentage
of materials passing the 5 mm sieve.
Following the freezing process in the climatic chamber the containers with the frozen
materials (Figure 5.2) were transferred to a tank containing water at a temperature of 20
°C. The containers were placed at distances of at least 50 mm from each other and the
walls of the tank and the water temperature was tested every 15 minutes at six points in
the tank. Water temperature was adjusted to maintain the precise levels (20 °C)
throughout the specified thawing time.
The AIV and ACV of the materials after freezing and thawing were also determined by
testing them after they have undergone the freezing and thawing process. After the
54

materials went through the freezing-thawing process, they were dried and the AIV and
ACV were performed.
Figure 5.2: The containers (with material A) in the thawing tank after the freezing cycle
5.3 Main Series testing
5.3.1 Permeability
This section summarises the permeability test procedure. A detailed description of the
equipment was presented in Chapter 4. The detailed testing procedure accompanied by
photos and schematics is presented in Appendix B.
The permeability of the test materials, as discussed in the literature review, depends on
their compaction level. The compaction level of all the three types of materials used for
the purposes of this specific test was the same as that used in the majority of the other
tests of the research programme (1.8 Mg/m3). The materials were compacted to the
required density dynamically in the cell with the use of the vibrating hammer. For the
compaction purposes the cell was fitted with the compaction top plate (Figure 5.3). This
way access to the Kango Hammer for sample compaction purposes was allowed
55

Before compaction began, a high flow permeable mat (>10 1/hr) was placed on the
bottom of the cell to restrict the migration of fines and was protected by the use of a 3
mm thick steel mesh. Both the permeable mat and steel mesh had a diameter of 300 mm.
ipaction
C'onne*
Figure 5.3: The permeability cell with the compaction plate
The materials were compacted in 6 layers, each up to a specific depth to achieve a
uniform density of 1.8 Mg/m3 throughout the specimen. The copper tubes were inserted
into the cell when the materials reached the tube placement level on the cell, in order to
avoid any possible damage to them, and the compaction continued to the next layer. At
the end of the compaction process the compaction plate was removed carefully in order
to avoid any disturbance to the sample and replaced by the top plate. A permeable mat
and a steel mesh, both of the same specification as the ones used at the bottom, were
56

also used between the materials and the top plate. The copper tubes were then connected
with the manometer pipes that lead to a bank of manometers, which had been numbered
according to their position in the cell. The permeability testing arrangement also
included a constant head and a supply tank.
The saturation process of the materials was undertaken using clean tap-water in
accordance with BS 1377-5:1990, paragraph 5.2.4. Water was inserted to the cell from
the bottom valve and once water started coming out from the top valve suction with the
use of a suction pump was applied to the sample to speed up the process. The saturation
procedure lasted for four weeks for all three material types tested, after which period
there were no signs of air trapped in the sample. This was verified by the fact that
during the last week of saturation the application of continuous suction did not yield any
trapped air from the outlet pipes.
After the flow and the manometer readings were stable for a period of one week 10
measurements were obtained for all the materials. Five were taken by measuring the
volume of water passing through in a period of ten minutes and five by measuring the
time it takes to obtain 500 (± 5) ml of water.
The coefficient of permeability (k) is calculated by equation 5.1 ( after BS 1377-5:1990,
Section 5.6.2)
where
k is the coefficient of permeability in m/s
q is the flow of water through the specimen in 1/s
i is the hydraulic gradient
Rt is the temperature correction factor for the viscosity of water and can be derived from
BS 1377-5: 1990, Figure 4.
A is the cross sectional area of the specimen in m2
The hydraulic gradient is calculated from equation 5.2
eq 5.1
57

. = Jh
1 ~ Y
eq 5.2
where
h is the difference between the two manometer levels in m
y is the difference between the height of the corresponding monitoring points in m
5.3.2 Particle Crushing
The procedure followed for the determination of the crushability of the materials was
essentially the same as the one followed during the grading tests. After each shear box
test, the materials were removed from the box and placed in labelled plastic bags. After
the individual shear box series (SBT1, SBT2 and SBT3) was completed for each of the
materials, they were sieved following the process established for the grading tests. The
individual sieve fractions were then weighed and the after-shear grading curves were
established.
5.3.3 Shear Box Testing
A detailed description of the shear box equipment (Figure 5.4) is presented in Chapter 4,
and the exact testing procedure accompanied by photos and schematics in Appendix C.
This section presents a summary of the shear box testing undertaken in this project in
order to provide an initial picture to the reader of the processes followed.
The complete testing programme required a very large quantity (about 2500 kg) of each
material to be prepared, but due to storage limitations it was not feasible to obtain
sufficient amount of the material from the suppliers to allow quartering of the samples
strictly in accordance with British Standards requirements. Rather, the entire mass of
each material required for the shear box tests was placed on a clean concrete floor. The
materials were passed through a 37.5 mm sieve and the fraction coarser than 37.5mm
was then removed to reduce the ratio between the minimum dimension of the test
specimen and the maximum particle size to within acceptable limits. The remainder was
then mixed thoroughly on a clean concrete floor. The mixed material was sub-divided to
prepare each sub-sample in turn via a process of quartering, with the remaining sample
being retained each time for further re-mixing and quartering for the preparation of the
next samples. The same process was followed for all the different types of shear box
58

tests, with materials larger than 28 mm removed for the investigation of the effect of
maximum particle size on shear strength (SBT3).
Figure 5.4: The shear box apparatus
To ease specimen preparation and avoid damage to the shear box frame, compaction of
the materials in the shear box was undertaken with the shear box removed from its
frame and placed on the concrete floor. Figure 5.5 shows the shear box on the floor after
Material C had been compacted to specimen specifications for SBT1.
Both halves of the shear box were secured together with the locating screws, and a
vibrating hammer used to compact a mass of 8.6 kg of the material at their natural
moisture content into the box for each of the three layers to achieve the target dry
density for each test specimen of 1.8 Mg/m3. A mass of 7.6 kg was used for each layer
to achieve the target dry density of 1.6 Mg/m3. A rubber pad of 5 mm thickness was
placed between the compaction plate and the materials to minimise the risk of breakage
of the materials' sharp edges. Three layers were adopted to avoid coexistence of the
shear plane with layer interfaces, and to promote a uniform density throughout the
specimens. After the required density was achieved the top plate was placed in position
and the whole box placed within the test frame. The locating screws and four clamps
59

placed on each size of the shear box ensured that the disturbance of the sample during
its placement in the test frame was kept to as minimum levels as possible.
Figure 5.5: The shear box on the floor with Material C compacted in it
The displacement rate used for the shear box tests was determined based on two
parameters:
1. Time restrictions
2. The necessity to perform a large number of shear box tests
It was estimated that it would be necessary to perform three tests per day to complete
the testing schedule and a rate of displacement of 0.125 mm/minute made this possible.
It was important to conform with BS1377-7:1990, and for this reason a total of five
trials (two for Material A and C and one for Material B) were performed. It was
established that this displacement rate falls within the specifications of the displacement
rate according to BS 1377-7:1990. The displacement rate specifications were also
verified from the displacement rates that were measured during the shear box tests and
their results.
The tests were carried out until the real time graph showed that the ratio of shear
strength to horizontal displacement was reducing (BS 1377-7: 1990, Paragraph 7.2.4.9).
60

This did not allow for analytical observations of the post peak behaviour of the
materials but did allow for the large number of tests necessary to minimise the effects of
the materials’ variability.
61

CHAPTER 6
TEST MATERIALS
6.1 Introduction
This chapter describes the types of materials tested in this project and their physical
characteristics. The three material types (Table 6.1) tested in this investigation were
purposefully selected as being representative of commercial operational and crushing
processes, in preference to the crushing of the materials in the laboratory using artificial
procedures. The first type of crushed concrete (Material A) was removed from a
demolition site with no further processing and the second (Material B) was obtained
from a crushing site. The brickwork rubble (Material C) has also been processed in the
same crushing site as Material B. A description of the materials used and the processes
involved in the acquisition of the materials is given in this chapter.
Table 6.1: Initial similarities and relations between the three types of materials
Material Concrete Brick Furthered
Based Based Processed
A S X X
B V X
C X V
6.2 Principles of Acquisition, Transportation, Handling and Storage
The handling of the materials on site made the acquisition of samples according to all
the British Standards (BS 812-101:1984, BS 812-102:1984 and BS 5930:1999) controls
impracticable. This was due to the constant movement of the materials within the site,
and the fact that large quantities of materials were required for testing.
Nevertheless every effort was made to obtain as representative a sample as possible by:
1. Mixing the stockpiled materials on site several times with the use of heavy site plant
available at the processing site, before any sampling from stockpiles was undertaken
2. Obtaining approximately equal proportions of each sample from the top, middle and
bottom of the mixed stockpiles.
The ideal situation, from a repeatability perspective, may have been to obtain materials
that did not contain any other materials rather than the desired crushed concrete and
62

bricks. However such materials would not be typical of the industrial wastes produced
by demolition and crushing of concrete and brick structures. The removal of all the
impurities (sizes from 40 mm to fine particles) would be a lengthy and costly procedure
for industry. Typically only large particles such as timber and metals are removed in
practice, the latter via the use of magnets. It was therefore decided to similarly test the
materials without removing any impurities other than metal components and large
pieces of timber. The quantity of the impurities after the sieving tests (100 kg of each
material were sampled) was found to be less than 1 % (range 0.2 - 0.8 %).
Material B Material C
Figure 6.1: Material B and C in the laboratory storage bays
After the materials were transported to the laboratory they were placed in storage bays
(indoor storage, Figure 6.1) that kept them protected from adverse weather conditions
such as extreme temperatures, rain, snow and wind.
63

6.3 Source and Description of Materials
The materials produced by the demolition of concrete and brick structures can be used
and processed in various ways, on or off site. The industrial processes employed are
generally similar to the ones used in quarries for the extraction of primary aggregates. A
more detailed description of the procedures commonly used is presented in Section 2.2.
Examination of these procedures had led this investigation into choosing the following
three types of materials, to represent in part the range of processing methods:
Material A: Produced at a Sheffield city centre location from the demolition of a late
20th century concrete building in 2001. The grading curve (format based on BS EN 933-
1:1997 and determined by mechanical sieving) of Material A is presented in Figure 6.2.
The demolition waste was crushed on site using heavy demolition plant, and in excess
of four tonnes of the material were transported directly to the university laboratories.
The material mainly comprised crushed concrete, as the demolition and processing
method adopted on site had led to the removal of the vast majority of other structural
components. Laboratory inspection procedures revealed that impurities such as steel
reinforcement accounted for less than 1% by mass of the sample delivered. All
remaining metallic materials, such as electricity cables, were manually removed in the
laboratory prior to testing.
100
90 -
80 -
70 -MassPassing 60 ' (%)
50 - Max/Min Envelope from 5 Grading Tests
40 -
\ Mean30 -
0 0.1 5 0 .3 0 .4 2 5 0 .6 1.18 6 .32 20 28 37 .510 14 50
Sieve Size (mm)
Figure 6.2: Grading curve for Material A
64

Materials B and C: These materials were of crushed concrete and crushed brick
respectively, and were both obtained from a demolition waste processing site in Hull
operated by Sam Allon (Contracts) Ltd. Both the concrete and brick had been sourced
originally from unknown developments, and subsequently transported to and processed
at the crushing site. Their grading curves are presented in Figure 6.3 (format based on
BS EN 933-1:199). A range of commercial products are prepared at the site, and the
products used in this research project were selected as being compliant with industry
standard specifications. Material B was selected as meeting the grading requirements of
RCA (Recycled Aggregates) (ii) of Table 1 of Digest 433 B.R.E (Building Research
Establishment, 1998), whilst Material C was chosen to meet the grading requirements of
RCA (i) of Digest 433 B.R.E. (Building Research Establishment, 1998).
100.0
90.0
80.0
Mass 70.0 Passing
<*> 60.0
50.0
40.0
30.0
20.0
10.0
0.0
Figure 6.3: Grading curves for Material B and C
The minimum and maximum envelopes of the grading curves, of all the sampled
materials, indicate that the materials collected were consistent.
The average grading curves of all the materials are shown in Figure 6.4 and their grain
size characteristics are summarised in Table 6.2.
Max/Min Envelope from 5 Grading Tests
Sieve Size (mm) M aterial B | M aterial C 0
65

100
90 -
80 -
7 0 -
6 0 -MassPassing 5 0 -
(%) 4 0 -
30 -
20 -
10 -
0 0.15 0.3 0.425 0.6 1.18 2 10 14 20 28 37.5 505
Sieve Size (mm)
- A - Material A Material B Material C
Figure 6.4: Average grading curves for Material A, B and C
Table 6.2: Summary of Grain Size characteristics of test materials.
Characteristics (Mean values)Material m̂ax dio 3̂0 5̂0 6̂0 cu cz
A 50 mm 0.47 mm 4.6 mm 10.1 mm 13.5 mm 32.9 0.7B 50 mm 0.62 mm 8.5 mm 17.9 mm 23.6 mm 33.3 2.1C 50 mm 0.29 mm 1.8 mm 12.9 mm 18.3 mm 46.6 1.0
The results show that even though there is a difference in the effective sizes of the
particles in Materials A and B, their Uniformity Coefficient (Cu) values are almost
identical. There is a larger range of particle sizes in Material C, and a larger Cu.
Materials B and C, that had been crushed further to the specifications of Digest 433
B.R.E. (1998), are well graded according to their Cz value . This is also verified by their
Coefficient of Curvature (Cz), as they both are within the limits of 1 - 3 for well-graded
soils. Material A has a value of Cz of 0.7, and may be described as poorly to well
graded. The difference in Materials A and B may be explained by the further crushing
Material B would have undergone during processing, or through artificial selection at
the site.
66

As stated in section 5.2.1, it was necessary to perform wet sieving in a smaller quantity
of all the materials in order to verily the validity of the dry sieving results. A mass of
100 kg of each of the materials was wet sieved according to BS 1377-2:1990 and the
results are presented in Table 6.3. From this data it can be seen that the differences
between the percentages passing between the wet and dry sieving tests are small.
Therefore the grading curves of Figure 6.4 can be considered accurate representation of
the materials’ particle distribution.
Table 6.3: Comparison between wet and dry sieving results
Percentage of Mass passing for Dry and Wet Sieving TestsMaterial A Material B Material C
Sieve Size (mm) Dry Wet Dry Wet Dry Wet0 0 0 0.0 0 0.0 0
0.15 2.8 2.2 2.0 2.7 4.7 4.30.3 5.4 4.2 4.6 3.7 11.2 11.2
0.425 8.7 6.9 5.9 5.1 14.5 13.60.6 12.1 11.5 9.5 8.9 18.5 18.21.18 16.8 16.5 11.5 11.4 24.8 24.6
2 22.2 22.7 15.7 15.5 31.5 32.05 33.5 33.4 21.5 21.9 39.2 38.910 50.6 51.6 33.5 34.1 43.5 43.814 61.6 63.2 42.4 43.6 52.7 52.620 74.0 75.2 53.6 54.2 63.1 62.728 84.2 85.1 68.7 70.1 74.7 73.5
37.5 92.7 93.6 85.6 87.7 87.5 87.350 100 100 100 100 100 100
Material A-Dry Material A-W et Material B-Dry
-x Material B-W et
Material C-Dry Material C-W et
0 0 .15 0 .3 0 .425 0 .6 1.18 2 5 10 14 20 2 8 37 .5 50
Sieve Size (mm)
Figure 6.5: Wet and dry grading curves
90
80
70
60
50
40
30
2010
67

Table 6.4 shows that there is a degree of variability in the grading curves of the
materials, especially for Material A. The variability, as expressed with values of
maximum differences (i.e. range of results for each fraction), shows that the Material B
and C are more consistent materials, with maximum differences reaching 2.7 %. This is
probably a result of them have been processed further and crushed to precise
specifications. On the other hand Material A, that was obtained straight from a
demolition site, exhibits a greater variability and the maximum differences reach a value
of 5.6 % (for sieve size of 10 mm). This is a variation of ± 2.8 %, which as a percentage
of the total percentage passing (2.8 / 50.6) is 5.5 % variation. This is double the
maximum difference presented for Materials B and C.
Table 6.4: Variability of grading results for all materials
Average Percentage (of 5 tests) Passing and Maximum Difference between the
Minimum and Maximum Values of all Grading Tests for each Individual Sieve
Size
Material A Material B Material C
Sieve Size
(mm)
Mean
(%)
Max
Difference
Average
(%)
Max
Difference
Average
(%)
Max
Difference
0.15 2.8 0.9 2.0 0.6 4.7 1.6
0.3 5.4 0.9 4.6 0.7 11.2 2.5
0.425 8.7 2.3 5.9 0.7 14.5 2.1
0.6 12.1 1.6 9.5 1.5 18.5 1.7
1.18 16.8 2.9 11.5 0.7 24.8 2.1
2 22.2 3.3 15.7 1.4 31.5 1.8
5 33.5 3.3 21.5 1.5 39.2 2.0
10 50.6 5.6 33.5 1.3 43.5 0.7
14 61.6 3.7 42.4 2.7 52.7 2.4
20 74.0 5.5 53.6 0.3 63.1 3.0
28 84.2 2.3 68.7 2.1 74.7 1.8
37.5 92.7 1.9 85.6 1.5 87.5 1.2
50 100 0.0 100 0.0 100 0.0
Max Difference means the difference between the maximum and minimum value
of the materials passing the specific sieve
68

6.4 Water absorption and particle density
The water absorption and particle density results (established according to BS 812-
2:1995) for each material are summarised in Table 6.5. The results for the concrete
based materials, A and B, are identical, except for their degree of variation, which is
very low and can be considered negligible. The value of water absorption is higher and
particle density is lower for the brick based material (Material C). The differences in
consistency may be attributed to the nature of the materials since the procedures
established in this project should minimise the effects of differences in sample
preparation and variability.
Table 6.5: Particle density and water absorption values
Material Water
Absorption (%)
Particle Density
(Mg/m3)
Value SD Value SD
A 5.5 0.068 2.2 0.04
B 5.5 0.091 2.2 0.03
C 13.2 0.212 1.9 0.06
Note: SD means Standard Deviation
6.5 Particle Shape
6.5.1 Flatness and Elongation Ratios
The results from the calculations of the particles’ flatness and elongation ratios are
presented in graphical form in Figures 6.6, 6.7 and 6.8 for Material A, B and C
respectively (graphs with their averages are presented in Appendix D). The elongation q
and flatness p ratios are given by:
q = b/a
p = c/b
where a, b and c are the longest, intermediate and shortest lengths of a particle,
respectively.
69

♦ 3 7 . 5 m m
■ 2 8 m m
a 2 0 m m
X 1 4 m m
4 - 1 0 m m
• 6 . 3 m m
0 0 . 5 1P
Figure 6.6: Shape categories for all the size fractions for Materials A(after Rosslein,
1941)
♦ 3 7 . 5 m m
■ 2 8 m m
A 2 0 m m
X 1 4 m m
+ 1 0 m m
• 6 . 3 m m
0 P 0 5 1
Figure 6.7: Shape categories for all the size fractions for Materials B(afiter Rosslein,
1941)
# X 1
* A

♦ 37.5mm■ 28 mm a.20 mm x 14 mm + 1 0 mm■ 6.3 mm
0 0.5 1P
Figure 6.8: Shape categories for all the size fractions for Materials C (after Rosslein,
1941)
6.5.2 Flakiness and Elongation Index
Table 6.6 presents the values of all the types of and E! for materials A, B and C. The
number of particles measured for each of the individual sieve size fractions were given
in table 5.1.
Table 6.6: Values of all the Flakiness and Elongation Indices for all the Materials
Material A Material B Material C
Sieve Size, mm
Fu Eu Fu EU Fu EU
37.5 20.2 20.9 11.1 6.3 17.2 15.5
28 11.3 26.9 6.3 (50) 16.4 11.1 28.3
20 8.9 23.4 5.1 (44) 16.2 13.5 27
14 12.6 24.2 7.7 (33) 13.7 10.3 27
10 13.1 24.2 8.6 (27) 16.3 7.3 17.5
6.3 11.6 23.4 4.9 (35) 9.9 6.2 9.7
Total Fj =12.9 Ej =23.9 II Ej =13.1 Fj =10.9 ^ =20.8
71

To allow for different intended uses of the data, the results are presented in two ways:
• The total Elongation (Ej) and Flakiness (Fj) index of the materials, and
• The values of each individual size fraction (Fj l and Ej j).
Table 6.7 presents the average values and the difference between the maximum and
minimum values of the Fj and Ej for all the materials.
Table 6.7: Summary of Fr and Ej values for all the materials
Flakiness Index (Fj) Elongation Index (E:)
Material Mean Range Mean Range
A 12.9 1.7 23.9 0.8
B 7.3 1.8 13.1 2.6
C 10.9 2.5 20.8 1.3
6.5.3 Angularity Values
Table 6.8 summarises the angularity values for Material A, B and C for all the sieve
fractions that were investigated.
Table 6.8: Angularity values for all materials (after Lees, 1964)
Angularity Values, after Lees (1964)
Sieve Size, mm Material A Material B Material C
37.5 500-599 600-699 600-699
28 600-699 500-599 700-799
20 600-699 500-599 700-799
14 600-699 500-599 700-799
10 600-699 400-499 600-699
6.3 500-599 400-499 500-599
Average 600-699 500-599 700-799
6.5.4 Complete Shape Description
Taking all the information and results of the particle shape tests under consideration, the
complete descriptions of the particle shape for Materials A, B and C are:
72

1. Materials A: Equi-dimensional with low angularity (600-699) according to
Rosslein (1941), and equi-dimensional to discs with low angularity (600-699)
according to Zingg (1935), with 12.9 and Ej 23.9.
2. Materials B: Equi-dimensional with low angularity (500-599) according to
Rosslein (1941) and Zingg (1935), with Fj 7.3 and Et 13.1.
3. Materials C: Equi-dimensional with low angularity (700-799) according to
Rosslein (1941), and discs to equi-dimensional with low angularity (700-799)
according to Zingg (1935), with F{ 10.9 and E: 20.8.
In some of the particle shape descriptions two categories are named. That means that the
largest percentage of particles fall within the first-mentioned category but it is not the
overall majority (>50 %). In this case the second most populated category is included
in the description (e.g. for Material C, description according to Zingg, 1935, discs
account for 43 % of the particles and equi-dimensional particles for 39 %).
6.6 Compaction
For the test methods described in Section 5.2.3 the measured values of the maximum
dry density (average of five tests) and the moisture content are summarised in Table 6.9.
Material A was also tested in a California Bearing Ratio mould, which complies with
the specifications of Figures 12 and 13 of BS 1377-4:1990. All three tests, using a 2.5,
4.5 kg and a vibrating hammer, were performed in order to allow for comparison with
the results from the large scale mould testing and establish any differences in the
materials' behaviour. Five of each of the BS tests were performed in order to obtain
more representative results.
Table 6.9: Maximum dry density and corresponding moisture content values
Material TypeA B C
Type of Test m/c Pd m/c Pd m/c Pd
Mould Compaction 5 1.84 5 1.84 7.5 1.79
2.5 kg Hammer 6 1.77 N/A N/A N/A N/A
4.5 Kg Hammer 6 1.80 N/A N/A N/A N/A
Vibration Compaction 6 1.83 N/A N/A N/A N/A
Dry Density Values (pd) in (Mg/m3), and Moisture Content (m/c) in %
73

The dry density (pd) values of the different air and moisture contents are calculated by:
pd = Gsx (1 -A ) x Pw eq. 6.1
(1+w x Gs)
where:
Gs is the Specific Gravity of the soil particles
A is the air content (%)
Pw is the density of water (Mg/m3)
w is the water content (%)
The Specific Gravity (Gs) is given by:
Gs = ps / pw eq. 6.2
Where ps is the particle density (Mg/m3)
For the particle densities the calculated values of Section 6.4 were used.
The results are presented graphically in Figure 6.9.
Compaction Curves for Different Compaction Methods for Material A
2.07 MouldCompaction
2.5 Kg hammer
4.5 Kg Hammer
1.97
O ) 1.87
VibrationCompaction
0% Air Voids1.77
5% Air Voids1.67
— 10% Air Voids
1.57
15% Air Voids
1.470 2 4 6 8 10 12 14
Moisture Content (°/
Figure 6.9: Compaction Curves for all the types of compaction for Material A
74

Figure 6.10 presents the range of results for each of the moisture content for all points
for all the tests. The variation of any of the values was not larger than 0.11 Mg/m3
indicating good consistency.
Moisture Content v Dry Density for Different Compaction Types for Material A
MouldC om paction
1.852 .5 Kg h am m er
4 .5 Kg H a m m er
05
- - • - V ib r a t io nC om paction
1.75
0% A ir Vo ids
5% A ir Vo ids1.65
10% A irVo ids
o 2 4
Moisture Content (%)6 8 10 12 15% A ir
Voids
Figure 6.10: Variability of compaction results for Material A
The results of the BS compaction tests performed for Material A show reasonable
consistency (Figure 6.10), with the mould compaction tests of Material A indicating a
larger variability from the BS compaction tests, with the larger variation reaching 0.11
Mg/m3 for 4 % moisture content, which is a very low value (of about 6 %) variation that
can be considered negligible.
Figures 6.11 and 6.12 show the compaction results for Material A for one and two layer
compaction respectively. As explained before the compacting took place in two stages.
One layer of the material was compacted to the maximum possible density and then a
second identical layer was used, on top of the first one and also compacted to the
maximum possible density, this was done in order to check if the compaction of the
second layer on top of the first layer affected the total dry density achieved. The
corresponding results for Material B are given in Figures 6.13 and 6.14.
75

Moisture Content v Dry Density2.2
M aterial A- 1 st Layer2.1
0% AirVoids2
5% AirVoids
o> 1.9
10% Air Voids
1.715% Air Voids
1.6
1.5
1.4
0 2 4 6 8 10 12 14Moisture content (%)
Figure 6.11: Large scale compaction curves for Material A (1st layer)
Moisture Content v Dry Density2.2
M aterial A - 2nd Layer
0% AirVoids
Eo>S
5% AirVoids
<0c0)o£o
10% Air Voids
15% Air Voids
0 2 4 6 8 10 12 14Moisture content (%)
Figure 6.12: Large scale compaction curves for Material A (2nd layer)
76

2.20Moisture Content v Dry Density
Material B-1st Layer2.10
0% AirVoids2.00
5% AirVoids
o> 1.90
= 1.80 10% Air Voids
1.7015% Air Voids
1.60
1.50
1.400 2 64 8 10 12 14
Moisture content (%)
Figure 6.13: Large scale compaction curves for Material B (1st layer)
Moisture Content v Dry Density2.20
Material B- 2nd Layer2.10
0% AirVoids2.00
— 5% Air Voids
"B) 1.90
§ 1.80 10% Air Voids
1.7015% Air Voids
1.60
1.50
1.400 2 64 8 10 12 14
Moisture content (%)
Figure 6.14: Large scale compaction curves for Material B (2nd layer)
The compaction graphs show that the behaviour of Material A and B appear to be
similar, and that the brick based materials achieve a lower maximum dry density.
77

Figure 6.15 shows the compaction curves for Material C for both layers o f compaction.
Moisture Content v Dry Density2.1
Material C- 1st Layer
- • “ Material C- 2nd Layer
0% AirVoids
2
1.9
O) 5% AirVoids1.8
10% Air Voids1.7
15% Air Voids1.6
1.5
1.40 2 4 6 8 10 12 14
Moisture content (%)
Figure 6.15: Large scale compaction curves for Material C
Figures 6.16 and 6.17 show the average compaction curves for all the materials for one
layer and two layer compaction respectively.
Moisture Content v Dry Density1.9
Material A- 1st Layer1.8
E
I 1'7£inq 1.6
Q
Material B- 1st Layer
Material C- 1 st Layer
1.5
1.4
0 4 62 8 10 12Moisture content (%)
Figure 6.16: Compaction curves for all Materials - 1st Layer
78

Moisture Content v Dry Density1.9
Material A- 2nd Layer
1.8
Material B- 2nd Layero> 1.7
1.6 ♦ “ Material C- 2nd Layer
1.5
1.40 2 64 8 10 12
Moisture content (%)
Figure 6.17: Compaction curves for all Materials - 2nd Layer
Table 6.10 presents the variability of the mould compaction results for Material A and B.
The results for Material C are given in Table 6.11.
Table 6.10: Variability of dry density results for Material A and B
Dry Density Values and their variations for Materials A and B (in Mg/m3)
Moisture Content (%) Material A Material B
Dry Density Differences Dry Density Differences
0 1.72 -0.05/+0.04 1.73 -0.06/+0.07
3 1.79 -0.03/+0.10 1.79 -0.05/+0.05
4 1.82 -0.08/+0.11 1.82 -0.06/+0.02
5 1.84 -0.08/+0.08 1.84 -0.03/+0.01
6 1.81 -0.05/+0.06 1.84 -0.06/+0.03
7 1.79 -0.09/+0.08 1.80 -0.04/+0.12
8 1.74 -0.08/+0.07 1.76 -0.02/+0.06
9 1.72 -0.08/+0.10 1.74 -0.07/+0.05
11 1.66 -0.09/+0.06 1.69 -0.08/+0.04
79

Table 6.11: Variability o f dry density results for Material C
Dry Density Values and their variations for Material C (in Mg/m3)
Moisture Content (%) Dry Density Differences
0 1.51 -0.02/+0.03
2.5 1.64 -0.01/+0.03
3 1.65 -0.06/+0.09
4.8 1.71 -0.11/+0.08
5.4 1.73 -0.3/+0.04
7.3 1.79 -0.05/+0.05
8.2 1.64 -0.02/+0.04
10.2 1.51 -0.06/+0.02
Summarising it can be said:
• The variability of the results (Tables 6.10 and 6.11) for the mould compaction of
all the materials shows that there is a good degree of repeatability
• The BS compaction tests appear to be slightly more consistent than the mould
compaction tests for Material A.
• Material C had a smaller degree of variability than the concrete based materials,
probably due to their more homogeneous nature.
6.7 Aggregate Impact and Aggregate Crushing Values
The average values for the AIV and ACV tests, together with the standard deviation
values (SD), for the three types of materials are presented in Tables 6.12 and 6.13
respectively. They include the values of the dry ( d ) and soaked (s) tests and the
reductions of the AIV and ACV values of the materials when they are soaked compared
to being dry.
The percentage reductions are calculated by the following formula:
AIV or ACV under soaked conditions - AIV or ACV under dry conditions
AIV or ACV under dry conditions
80

Table 6.12: Dry and soaked AIV and their Standard Deviation (SD) values for all the
materials
AIVd (%) AIVs (%) Reduction in Strength between Dry and Soaked Testing Values (%)
Material Results SD Results SDA 17.7 0.8 18.9 0.7 6.2B 29.5 0.6 31.1 0.7 5.4C 27.8 0.5 29.2 0.5 5.0
Table 6.13: Dry and soaked ACV and their Standard Deviation (SD) values for all the
materials
A C V d (% ) AC Vs (%) Reduction in Strength between Dry and Soaked Testing Values (%)
Material Results SD Results SD
A 25 0.8 26.8 0.7 7.3
B 28.6 0.7 30.3 0.8 0.9
C 33.3 0.5 35.3 0.5 5.5
6.8 Resistance to Freezing and Thawing
Table 6.14 shows the percentage of the materials tested that passed the 5 mm sieve after
ten freezing/thawing cycles. It includes the results for:
• The actual freezing/thawing tests, with particle size ranging from 50 to 10 mm
and
• the results for the materials, with particle size of 14 to 10 mm, that were used for
determining the affect of the freezing/thawing process in their strength (through
AIV and ACV tests).
Table 6.14: Results of the particle percentage passing the 5 mm sieve after the
weathering process
BS EN 1367-1,2000 test
(Particle size 50-10 mm)
Preparation for AIV and ACV
tests (Particle size 14-10 mm)
Materials Results SD Results SD
Material A 2% 0.2 1.2% 0.2
Material B 2.4 % 0.3 1.6% 0.2
Material C 2.1 % 0.2 1.1 % 0.1
81

Table 6.15 shows the values of the ACVW and AIVW ( w indicates AIV and ACV tests
after freezing-thawing and both tests conducted on dry materials) together with their
standard deviation after the freezing - thawing process of all the materials.
Table 6.15: ACV and AIV for all the materials after the freezing - thawing process
AIVW(%) ACVW (%)
Materials Results SD Results SD
Material A 19.5 0.698 27.6 0.786
Material B 33.9 0.598 32 0.657
Material C 30.9 0.532 35.9 0.476
82

CHAPTER 7
MAIN SERIES TEST RESULTS
7.1 Introduction
This chapter presents the factual results of the Main Series Testing. These are presented
in the following order:
1. Section 7.2 - Large scale permeability testing
2. Section 7.3 - Shear box testing to investigate the effects of maximum particle size
and specimen dry density in a 305 mm square shear box
3. Section 7.4 - Particle crushing during shear
7.2 Permeability
The large scale permeability tests, under steady state conditions, were performed in
specimens of 1.8 Mg/m3 dry density and dimensions of 600 mm height and 300 mm
diameter. This gave a cross sectional area of 70685.8 mm2. As discussed previously
(Section 5.3.1) the readings of the manometer tube differences (between points 200 mm
apart) and flow through the samples were taken after they have been stabilised for a
period of about a week. The values of flow and manometer differences are presented in
Figures 7.1 and 7.2 respectively.
2.5 t---------------------------Water Flow through Samples
♦ ♦ ♦ ♦ ♦ ♦ ♦ ♦
1.5
■ w ■
▲ A
■ ■
▲ A A A A
X X X X X x
♦ M at A -Test 1
■ M at A -Test 2
A M at B
X M at C
0.5
0 f-0 1 2 3 4 5 6 7
Days
9 10 11
Figure 7.1: W ater flow through perm eability specim ens

350Manometer Differences
300
EE 250
U)<uoc<D 200<Di tQL_a> 1500)Eocro 1005
A----------- A
Xt :
♦ Mat A-Test 1 : ■ Mat A-Test 2 A Mat BX Mat C !
50
10 11Days
Figure 7.2: Manometer differences for permeability tests
The results of the water flow through the samples, together with the calculated
Coefficient of Permeability (Jc) values and their standard deviation (SD) are presented in
Table 7.1 for all four tests. The temperature of the laboratory, measured twice daily,
throughout the four permeability tests performed was 20-22 °C degrees. The mean
temperature was 21 °C, with a standard deviation of 0.8. This gave a temperature
correction factor (Rt) for the viscosity of water (derived from BS 1377-5: 1990, Figure
4) of 0.96 for all tests (The value of 21 °C was used for calculating the R t).
Table 7.1: Values of the Coefficient of Permeability (k) for all the Materials
Flow Coefficient of Permeability and SDMaterial Values (1/h) k (m/s) SDMaterial A (Test 1) 2.16 2.5xl0-5 5.4xl0-6
Material A (Test 2) 1.98 2.2x10⁻⁵ 8.2xl0-6
Material B 1.65 1.5 x 10⁻⁵ 1.1x10⁻⁵
Material C 0.84 8.5x10⁻⁶ 1.9x10⁻⁵
The restricted number of tests performed for the determination of the permeability of
the materials does not allow for safe observations, but the values of flow, manometer
84

differences, coefficient of permeability and standard deviation show the good
repeatability of the procedures used.
7.3 Shear Box Testing
This paragraph presents the results from the shear box tests. Table 7.2 summarises the
parameters of the specimens tested, which were applied for all three materials. Table 7.3
presents the particle shape characteristics for SBT1 and SBT3. SBT1 and SBT2 have
identical particle shape parameters.
Table 7.2: Specimen parameters for shear box tests, for all Materials
Test Type Max Particle
Size, mm
Density,
Mg/m3
Moisture
Content, %
Square Sample
Dimensions
SBT1 37.5 1.8 2 ±0.2 305x305
SBT2 37.5 1.6 2 ±0.2 305x305
SBT3 28 1.8 2 ±0.2 305x305
Table 7.3: Particle shape for maximum particle size of 37.5 and 28 mm
Material A Material B Material C
Maximum Particle Size Fl El Fl El El Fl
37.5 mm (SBT1, SBT2) 11.5 23.8 6.5 14 20.3 9.7
28 mm (SBT3) 11.6 24.4 6.6 14.5 21.9 9.3
.The results are presented in terms of:
1. Shear Stress against longitudinal displacement and axial strain (Section 7.3.1)
2. Shear Stress - Normal Stress Values (Section 7.3.2)
3. Volume Change Behaviour - volumetric (ev) against average axial (ea) strain
(Section 7.3.2)
The three different materials, the large number of tests and the two different parameters
(density and maximum particle size) investigated in these tests have resulted in huge
amounts of data. There were two choices of presenting this data. Place indicative graphs
in this paragraph and the rest in Appendices or present all the graphs for all three
materials for SBT1, SBT2 and SBT3. The second was chosen because it was felt that
85

this will give the reader a complete initial idea of the behaviour of the materials under
different conditions of testing. These results show the average values of the tests. All
the graphs for every single test performed in this project are presented in Appendices E
and F.
7.3.1 Stress-Strain Behaviour
The shear stress values are calculated for each measurement point by constantly
compensating for the reduction in cross sectional area of the specimens due to the
horizontal displacements. For example, the shear stress of Material B, for 95 kPa
normal stress after 30 minutes (30 reading) after the beginning of the test is calculated:
Shear stress (o) = load (kN) / cross sectional area (m2)
Foad at 30 minutes is 11.26 kN
Horizontal Displacement at 30 minutes is 3.04 mm
Cross sectional area at 30 minutes is 0.305x(0.305-0.00304)
The shear stress at 30 minutes is 122.26 kN/m2 (kPa)
Figures 7.3 and 7.4 present the shear stress against horizontal displacement for Material
B and C respectively, for SBT1, at 143 kPa normal stress. The graphs for all the shear
box tests performed in this project are presented in Appendix E
S h ear S tress ag a in s t H o rizonta l D is p la c e m e n t, M a te ria l B , S B T 1 , 143 kPa
500
450
40 0
350
300
250
150
100
50
00 5 1510 20 25 30
H or izonta l D isp la c e m e n t , m m
Figure 7.3: Shear Stress against Horizontal D isplacem ent for M aterial B
8 6

Shear Stress against Horizontal Displacement, Material C, SBT1, 143 kPa
5C0
4 50
4 0 0
35 0
£. 3 00
2 50
200
150
100
50 10 15 20
■Test 1 •T e s t 2 ■Test 3 ■Test 4 ■ Test 5
H orizonta l D isp la c em e n t , mm
Figure 7.4: Shear Stress against Horizontal Displacement for Material C
The axial strain value at each recording time point is calculated as the percentage of the
horizontal displacement at that point over the whole length of the specimen.
The average shear stress values at specific axial strains are obtained by identifying the
shear stress values at similar axial strains and then obtaining the average shear stress
values. For example, for Material B and normal stress 143 kPa. For axial strain of 2%
the shear stress values are 249, 238, 245, 247 and 243 kPa. This gives an average of
shear stress of 244.4 kPa.
The results in the form of graphs of shear stress against axial strain for each of the
materials tested, for SBT1, SBT2 and SBT3 and for all the normal stresses (95, 143, 190,
238, and 317 kPa) are presented in the following Figures:
• Figures 7.5, 7.6 and 7.7 present the graphs for Materials A for SBT1, SBT2 and
SBT3 respectively
• Figures 7.8, 7.9 and 7.10 present the graphs for Materials B for SBT1, SBT2 and
SBT3 respectively
• Figures 7.11, 7.12 and 7.13 present the graphs for Materials C for SBT1, SBT2
and SBT3 respectively
87

Stress-Strain Behaviour for M aterial A,SBT1
<D 250
238 kPa ■ 317 kPa ;
50 1 2 3 4 6 7 8 9 10
Axial Strain,&(%)
Figure 7.5: Stress-Strain behaviour of Material A for SBT1
Stress-Strain Behaviour for Material A,SBT2
55 250
(0 200
(/) 150 ------
30 1 2 4 5 6 7 8 9 10
A x ia l S tra in ,£ a(% )
Figure 7.6: Stress-Strain behaviour of Material A for SBT2
Stress-Strain Behaviour for Material A,SBT3
500
450
400
350
300*95 kPa
52 250190 kPa !
100
50
00 2 3 51 6 74 8 9 10
A x ia l S t ra in ,£ *(% )
Figure 7.7: Stress-Strain behaviour o f M aterial A for SBT3
88
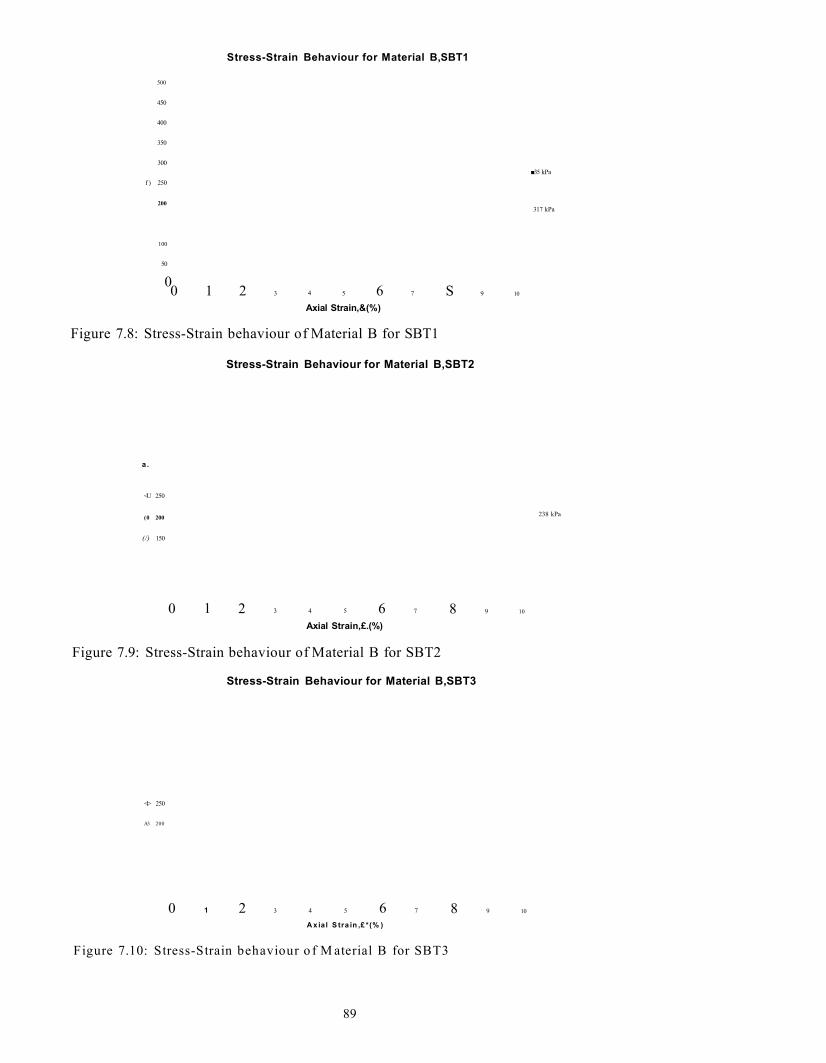
Stress-Strain Behaviour for Material B,SBT1
500
450
400
350
300■35 kPa
f ) 250
200317 kPa
100
50
050 2 3 6 74 S 91 10
Axial Strain,&(%)
Figure 7.8: Stress-Strain behaviour of Material B for SBT1
Stress-Strain Behaviour for Material B,SBT2
a .
<U 250
238 kPa(0 200
(/) 150
2 3 4 5 6 70 1 8 9 10
Axial Strain,£.(%)
Figure 7.9: Stress-Strain behaviour of Material B for SBT2
Stress-Strain Behaviour for Material B,SBT3
<1> 250
A3 200
0 2 3 4 5 76 8 91 10
A xial S tra in ,£ *(% )
Figure 7.10: Stress-Strain behaviour o f M aterial B for SBT3
89

Stress-Strain Behaviour for Material C,SBT1
250 —
0 2 51 3 4 6 7 8 9 10
A x ia l S tra in ,£ ,(% )
Figure 7.11: Stress-Strain behaviour of Material C for SBT1
Stress-Strain Behaviour for Material C,SBT2
® 250
(0 200317 kPa !
0 1 2 3 5 6 74 8 9 10
A x ia l S t ra in ,e. (% )
Figure 7.12: Stress-Strain behaviour of Material C for SBT2
Stress-Strain Behaviour for Material C,SBT3
450 --------
400
350
® 250 —
317 kPa
C/3 150
100
0 2 3 54 6 7 8 9 10
A x ia l S t r a in ,£ .(% )
Figure 7.13: Stress-Strain behaviour o f M aterial C for SBT3
90

7.3.2 Shear Stress Values
Table 7.4 summarises the mean peak values of the calculated shear stress at failure ,of,
(kPa) for all of the materials for tests SBT1, SBT2 and SBT3 for all the normal stresses
investigated. Their Standard Deviation values are shown in Table 7.5.
Table 7.4: Mean peak Shear Stress values (in kPa) for all the materials
Normal Stresses (an), kPaMaterials Type of Test 95.0 143.0 190.0 238.0 317.0A SBT1 176.1 246.7 343.2 441.8 454.7
A SBT2 116.7 187.6 236.4 289.6 388.2
A SBT3 123.9 202.1 268.9 338.1 434.3
B SBT1 164.9 248.1 324.9 394.1 481.9
B SBT2 103.1 165.1 231.1 298.5 378.4
B SBT3 122.8 187.9 269.3 317.2 422.1
C SBT1 209.9 309.1 384.8 409.9 486.0
C SBT2 167.0 249.6 301.6 352.9 363.5
C SBT3 137.8 203.6 254.1 308.2 404.1
Table 7.5: Mean peak shear stress Standard Deviation values (kPa) for all the types of
shear box tests for all the materials
Material A Material B Material C
Standard Deviation Standard Deviation Standard Deviation
cn (kPa) SBT1 SBT2 SBT3 SBT1 SBT2 SBT3 SBT1 SBT2 SBT3
95 8.1 4.4 6 4.6 2.7 9.3 11.6 10.3 7
143 15.3 5.6 5.5 5.3 12.3 10.5 8.3 18.8 11.2
190 19.5 11.7 10.1 4.7 16.8 5.5 33.5 10.4 8.5
238 23.6 15.9 7 5.4 16.8 4.9 27.9 13.7 8
317 26.1 25.4 12.9 33.9 12.2 30.6 29.8 33.5 21.1
The shear box results indicate that the variations in the results of the mean peak shear
stress are not of significantly high level and taking into account the difficulties involved
initially in obtaining the materials from site, in taking representative samples and in the
large scale of the tests, the results can be characterised as being representative.
91

7.3.3 Volume Change Behaviour
Figure 7.14 presents the volumetric against axial strain for Material A, SBT1 and 95
kPa normal stress. Appendix F, presents the volumetric (sv) against axial (sa) strain for
every single test performed in this investigation.
V o lu m e B e h a v io u r . M ateria l A, S B T 1 , 95 kP a
3.5 -
2.5
>
c2« 1 . 5 -------
EO>
0.5
-0.5
Axial S tra in ,aa (%)
Figure 7.14: Volume Behaviour for Material A, SBT1 at 95 kPa
The average volumetric strain values at specific axial strains are obtained by identifying
the volumetric strain values at similar axial strains and then obtaining the average
volumetric strain. For example Material A and normal stress 95 kPa. For axial strain of
3% the volumetric strain values are 2.05, 1.74, 1.76, 1.62, 1.97, 1.64, 1.63 and 2%. This
gives an average shear stress of 1.81 %.
The results are presented as follows:
• Figures 7.15, 7.16 and 7.17 present the graphs for Materials A for SBT1, SBT2
and SBT3 respectively
• Figures 7.18, 7.19 and 7.20 present the graphs for Materials B for SBT1, SBT2
and SBT3 respectively
• Figures 7.21, 7.22 and 7.23 present the graphs for Materials C for SBT1, SBT2
and SBT3 respectively
In the figures of this paragraph the positive values of volumetric strain indicate sample
expansion and the negative ones compression.
92

Volume Change Behaviour, Material A, SBT14
3.5
3
2.5
2
1.5
1
0.5
0-0.5
Axial Strain,£a (%)
l 9 5 k P a 143 kPa 190 k P a _____ 238 kPa -— - 3 1 7 k P a j
Figure 7.15: Volume Change behaviour for Material A, SBT1
Volume Change Behaviour, Material A, SBT24
3.5
3
2.5
2
1.5
1
0.5
0-0.5
■ 1Axial S t r a i n , (%)
|------- 9 5 k P a --------143 k P a -------190 kPa ~ 238 kPa — 3 17 kPa i
Figure 7.16: Volume Change behaviour for Material A, SBT2Volume Change Behaviour, Material A, SBT3
3.5
T 25ct5
W 1.5o•caE 13O> 0.5
■0.5
Axial Stra inf£a (%)
f 95 kPa — ^ 143 kPa 190 kPa 23 8 kPa — 3 1 7 k P a]
Figure 7.17: Volume Change behaviour for Material A, SBT3
93

Volume Change Behaviour, Material B, SBT14
3.5
3
2.5
2
1.5
10.5
0-0.5
-1
Axial S tra in ,£. (%)
,------- 95 k P a --------143 kPa - ' - 1 9 0 kPa ....... 238 kPa — 3 1 7 k P a i
Figure 7.18: Volume Change behaviour for Material B, SBT1
Volume Change Behaviour, Material B, SBT2
2.5
c
<noOJE3O>
Axial S t r a in s (%)
;------- 95 k P a --------143 kPa ........ 190 l<Pa 23 8 kPa — 317 kPa"
Figure 7.19: Volume Change behaviour for Material B, SBT2
Volume Change Behaviour, Material B, SBT3
2.5
C
C/5o<DE3O>
Axial Strain,£a (%)
[ 95 k P a 143 kPa _ - 1 9 0 k P a 2 3 3 kPa — 3 1 7 kPa]
Figure 7.20: Volum e Change behaviour for M aterial B, SBT3
94

Volume Change Behaviour, Material C, SBT14
3.5
3
2.5
2
1.5
1
0.5
0-0.5
■1
Axial Strain,£a (%)
j 95 kPa — - 143 kPa -■ -1 9 0 k P a 238_kPa -------3 1 7 kP a]
Figure 7.21: Volume Change behaviour for Material C, SBT1
Volume Change Behaviour, Material C, SBT24
3.5
3
2.5
2
1.5
1
0.5
0-0.5
Axial S tra in ,t. (%)
? 5 k P a 143 kPa ----- 190 kPa 2 38 k P a 3 1 7 k P a]
Figure 7.22: Volume Change behaviour for Material C, SBT2
Volume Change Behaviour, Material C, SBT34
3.5
3
2.5
2
1.5
1
0.5
0-0.5
Axial Strain,£a (%)
[ ?.5_^ Pa ~ ~ 14? *?? 190 kPa 238 kPa — 3 1 7 k P a i
Figure 7.23: Volum e Change behaviour for M aterial C, SBT3
95

7.3.4 Repeatability of Results
The results of the shear box tests, as presented with the values of shear stress,
volumetric against axial strain and shear stress against axial strain show great
repeatability. Table 7.6 presents the standard deviation values as a percentage of the
shear stress values for every normal stress investigated.
Table 7.6: Standard deviation as a percentage of mean peak shear stress values
Standard Deviation as a percentage of the Mean Peak Shear Stress Value for each Test
Normal Stress, kPaMaterials Test Type 95 143 190 238 317A SBT1 5 6 6 5 6A SBT2 4 3 5 5 7A SBT3 5 3 4 2 3B SBT1 3 2 1 1 7B SBT2 3 7 7 6 3B SBT3 8 6 2 2 7C SBT1 6 3 9 7 6C SBT2 6 8 3 4 9C SBT3 5 6 3 3 5
From the Table 7.6 it can be seen that the repetability of the results is good. All the
values fall below 10 %, which proves that the specimen preparation procedure used
managed to minimise any possible effect of the variability of materials. The largest
values of standard deviation (in percentage terms) are met by Material C and reach 9%.
It can be observed that:
• There is different behaviour between differently based crushed materials
(concrete and bricks)
• The different degree of processing between Material A and B has not altered
their behaviour to a significant degree.
Further analysis is needed, though, in order to verify these statements. It would be very
useful to test more than one crushed brick based material and more types of processed
and unprocessed crushed concrete based materials, in order to identify any possible
behavioural trends.
96
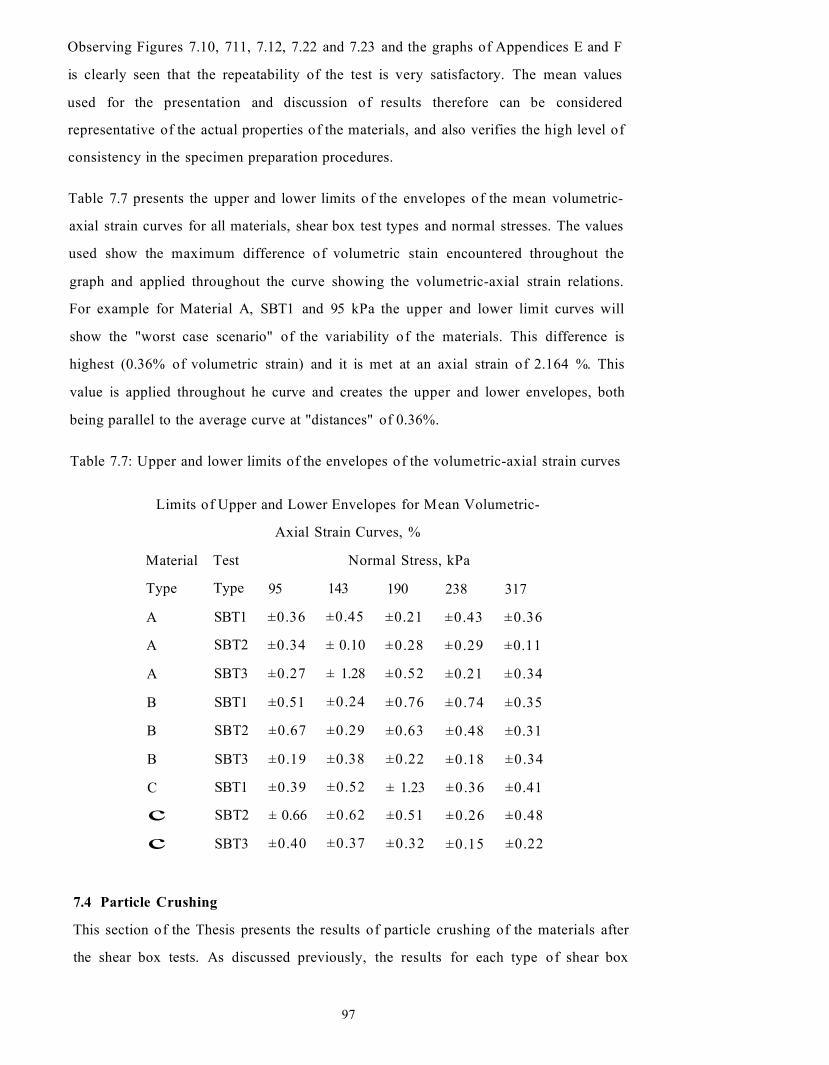
Observing Figures 7.10, 711, 7.12, 7.22 and 7.23 and the graphs of Appendices E and F
is clearly seen that the repeatability of the test is very satisfactory. The mean values
used for the presentation and discussion of results therefore can be considered
representative of the actual properties of the materials, and also verifies the high level of
consistency in the specimen preparation procedures.
Table 7.7 presents the upper and lower limits of the envelopes of the mean volumetric-
axial strain curves for all materials, shear box test types and normal stresses. The values
used show the maximum difference of volumetric stain encountered throughout the
graph and applied throughout the curve showing the volumetric-axial strain relations.
For example for Material A, SBT1 and 95 kPa the upper and lower limit curves will
show the "worst case scenario" of the variability of the materials. This difference is
highest (0.36% of volumetric strain) and it is met at an axial strain of 2.164 %. This
value is applied throughout he curve and creates the upper and lower envelopes, both
being parallel to the average curve at "distances" of 0.36%.
Table 7.7: Upper and lower limits of the envelopes of the volumetric-axial strain curves
Limits of Upper and Lower Envelopes for Mean Volumetric-
Axial Strain Curves, %
Material Test Normal Stress, kPa
Type Type 95 143 190 238 317
A SBT1 ±0.36 ±0.45 ±0.21 ±0.43 ±0.36
A SBT2 ±0.34 ± 0.10 ±0.28 ±0.29 ±0.11
A SBT3 ±0.27 ± 1.28 ±0.52 ±0.21 ±0.34
B SBT1 ±0.51 ±0.24 ±0.76 ±0.74 ±0.35
B SBT2 ±0.67 ±0.29 ±0.63 ±0.48 ±0.31
B SBT3 ±0.19 ±0.38 ±0.22 ±0.18 ±0.34
C SBT1 ±0.39 ±0.52 ± 1.23 ±0.36 ±0.41
c SBT2 ± 0.66 ±0.62 ±0.51 ±0.26 ±0.48
c SBT3 ±0.40 ±0.37 ±0.32 ±0.15 ±0.22
7.4 Particle Crushing
This section of the Thesis presents the results of particle crushing of the materials after
the shear box tests. As discussed previously, the results for each type of shear box
97

(SBT1, SBT2 and SBT3) are plotted and calculated by sieving the whole quantity of the
materials tested for the five normal stresses and do not include any tests on individual
normal stresses. Figures 7.24, 7.25, and 7.26 present the grading curves of all the
materials before and after the shear box tests.
From these three Figures and the differences in percentages passing, between before and
after shear box testing, the Br value according to Marsal (1967) can be calculated by
adding the differences of these percentages from the individual sieves. The values are
presented in Table 7.8.
The values of BT for SBT1, SBT2 and SBT3 for all the materials are shown in Table 7.8.
Table 7.8: Breakage Index, Br, for SBT1, SBT2 and SBT3
Breakage Index, Br (%)Material SBT1 SBT2 SBT3A 8.8 4 4.4B 12.1 7.1 5.5C 4.3 2.5 2.1
Comparison between Grading Curves before and after SBT1100.0
90.0
80.0
70.0
c 60.0 '53« 50.0 Q.v® 40.0 0 s
30.0
20.0
10.0
0.00 0.15 0.3 0.425 0.6 1.18 2 5 10 14 20 28 37.5 50_________________________ Sieve Size (m m )__________________________
Grading Curve (A) Grading after Crushing (A) -•-Grading Curve (B)-*-Gading after Crushing (B) -♦-Grading Curve (C) -•-Grading after Crushing (C)
Figure 7.24: Grading curves for all the Materials after SBT1
98

C om parison betw een Grading Curves before and after SBT2100.0
90.0 -
80.0 -
70.0 -
c 60.0 -
£ 5 0 .0 -
40.0 -
30.0 -
20.0 -
10.0 -
0.00 0.15 0.3 0.43 0.6 1.18 2 5 10 14 20 28 37.5 50
Sieve Size (mm)- • - Grading Curve A Grading After Crushing(A) -•-Grading Cun/e B
Grading After Crushing (B) -•-Grading Curve C Grading After Crushing(C)
Figure 7.25: Grading curves for all the Materials after SBT2
Comparison between Grading Curves before and after SBT3100.0
90.0 -
80.0 -
70.0 -
? 60.0 -
52 50.0 -I
^ 40.0 -
30.0 -
20.0 -
10.0 -
0.00 0.15 0.3 0.425 0.6 1.18 2 5 10 14 20 28
Sieve Size (mm)-•-Grading Curve (A) Grading after Crushing(A) - * - Grading Curve (B)- * - Grading after Crushing(B) -•-Grading Curve (C) -•-Grading after Crushing(C)
Figure 7.26: Grading curves for all the Materials after SBT3
99

CHAPTER 8 DISCUSSION OF RESULTS
8.1 Introduction
The test programme discussed in Chapter 5 was designed to investigate the physical and
mechanical characteristics of the demolition waste materials. Chapter 6 and 7 in turn
have presented the physical and mechanical properties of the materials as they were
determined by the test programme. This Chapter analyses and discusses the results of
the test programme in the following order:
• Particle shape
• Aggregate Impact and Aggregate Crushing Value Tests
• Freezing and thawing tests
• Permeability
• Particle crushing
• Shear strength
8.2 Particle Shape
Table 8.1 summarises the Fi and Ei values for Materials A, B and C.
Table 8.1: Flakiness and Elongation Indexes
Material A Material B Material C
Fi Ei Fi Ei F, Ei12.9 23.9 7.3 13.1 10.9 20.8
The flatness and elongation ratios plotted in Figures 6.6, 6.7 and 6.8 show that a large
population of particles, 64% of Material A, 74% of Material B and 55% for Material C,
fall within the equidimensional category.
From the results it can be observed:
1. Between Materials A and B, Fj decreased by 5.6 percentage points and Ei
decreased by 10.8 percentage points.
2. There is a 10 percentage point increase in equidimensional particles in Material
B compared to Material A is probably caused by the additional processing and
therefore crushing of the materials into more rounded particles.
1 0 0

3. There are almost no blades (particles described as being elongated and flaky) in
Material A, B or C.
The most likely explanation for these observations is the manner in which the materials
fracture when subjected to mechanical crushing. Lade et al (1996) found that particles
fracture easier along their smaller dimensions, and Yamamuro and Lade (1993)
observed that the concentration of stresses at the angular points of particles causes
fracture more easily than at non-angular points. It is therefore possible to infer although
further testing is required, that angular and flaky particles will tend to break into
particles with more equidimensional shapes during crushing.
The Fi and Et values for Material C fall between those for Material A and B. The most
possible explanations for this are the way the materials crush and the degree of
processing.
• The particles are less flaky and elongated compared with Material A due to
greater processing and therefore crushing of the particles into more rounded
ones
• The particles are more flaky and elongated than Material B. Though both
materials have undergone similar processing, Material B probably crushes more
easily and therefore produces "more rounded" and/or "more cubic" particles.
8.3 Aggregate Impact and Aggregate Crushing Value Tests
8.3.1 Comparison between Material A, B and C
Table 8.2 presents the results for the AIV and ACV tests for both dry and soaked state
and Table 8.3 the ratios of AIV to ACV tests.
Table 8.2: AIV and ACV results
AIVd (%) ACVd (%) AIVs (%) AC Vs (%)
Material Results Results Results Results
A 17.7 25.0 18.9 26.8
B 29.5 28.6 31.1 30.3
C 27.8 33.3 29.2 35.3
1 0 1

Table 8.3: AIV over ACV ratios
Material AIVd/ACVd (%) AIVs/ACVs (%)
A 70.8 70.5
B 103.1 102.6
C 83.5 82.7
The results show:
• Material A appears to be the strongest with Material B the weakest for the AIV
test. For the ACV tests though, Material A are still the strongest with Material C
the weakest. The age of the original structures that were demolished to produce
Material A and B is unknown and therefore this factor can not e tae into
consideration.
• Material A and C behave similarly as their AIV is higher than the ACV and their
AIV/ACV is similar, but Material B exhibit a slightly higher ACV than AIV.
These two findings might be a result of the particle properties of the materials
that either break easily under crushing or impacting load.
• The strength of all three materials decreases when they are soaked.
The AIV and ACV tests have been widely used as characterising the strength of natural
homogeneous materials. Schouenborg, et al, (2007) have found that the abrasion of
alternative (recycled) aggregates is best described when the material is tested as a unit
(the entire grading) and that tests such as LA-Test, AIV and ACV tests are less relevant
for heterogeneous materials. Since the three types of materials investigated in this
project are not homogeneous it is possible that the AIV and ACV results presented are
not representative of the materials as a whole. Tests that can provide information about
the strength of the materials as a unit are the shear box tests and the Breakage Index. As
the results of these two tests are analysed there would be a comparison with the AIV
and ACV results in an effort to verify or refute the applicability of the AIV and ACV
tests for recycled materials testing.
8.3.2 Comparison with Industry Products
It would be impossible to investigate all the properties of all the industry materials
available, so the values of Table 8.4 are just a representative of some of the main
granular materials used in construction.
1 0 2

Table 8.4: Values for ACV, AIV, Fr and water absorption for Material A, B and C and
industry products
Properties
Materials ACV (%) AIV (%) Water Absorption (%)
A 25 17.7 5.5
B 28.6 29.5 5.5
C 33.3 27.8 13.2
Limestone1 25 20 0.3
Granite1 27 N/A 0.33
Micro tonalite1 13 15 2.1
Limestone2 N/A <30 <2
Gabbro2 N/A 8-10 0.2-0.7
Limestone3 23 N/A 0.18
1 values obtained from CMS Quarries Sdn Bhd we 3site from 3 different quarries in
Malaysia
2 values obtained from Stevin Rock website from 2 different quarries in United Arab
Emirates
3 values obtained from S. Morris Ltd website from their quarry at
Comparing the ACV and AIV values of all the materials it can be seen that Material B
and C appear to be weaker. On the other hand Material A seem to be of the same
strength as far as their behaviour under the specific tests is concerned. This is probably a
result of the crushing process the materials undergo. As it has been explained in
previous sections, Material B and C have been further processed, comparing to A, and
therefore is possible that they have micro-cracking on their particles which might cause
the extra crushing under the ACV and AIV tests.
From the three types of materials investigated in this project, these specific tests are
more applicable to Material C, which have a more homogeneous composition (Material
A and B are composed by concrete particles, cement particles and virgin aggregates
particles, while C from crushed brick particles). Therefore, taking into consideration the
values of Limestone1, for which both values of ACV and AIV are available and
103

comparing them with Material C it is noticeable that both materials behave similarly,
crushing less under the AIV tests (impacting load in comparison with crushing load).
The difference between the two tests for both materials is also similar (5.5 % for
Material C and 5 % for Limestone1). Obviously, the values of a single industry product
is not enough to form a complete behavioural picture of material C but it appears that
they behave similarly to natural aggregates (as far as the differences of their ACV and
AIV values are concerned).
8.4 Freezing and Thawing Tests
Table 8.5 summarises the results of the freeze-thaw tests for all materials and Table 8.6
shows the values of the ACVW and AIVW before and after the freeze-thaw process of all
the Materials, together with their percentage reductions.
Table 8.5: Freezing thawing results
Freezing Thawing values (% passing)
Materials Results SD
Material A 2% 0.2
Material B 2.4 % 0.3
Material C 2.1 % 0.2
Table 8.6: ACV and AIV for all the materials before and after the freeze-thaw
Before Freeze-Thaw After Freeze-Thaw Reduction (%)
Material Type AIV (%) ACV (%) AIVW (%) ACVW (%) AIV ACV
Material A 17.7 25.0 19.5 27.6 10.2 10.4
Material B 29.5 28.6 33.9 32 14.9 11.9
Material C 27.8 33.3 30.9 35.9 11.2 7.8
The values indicate that the materials are marginally affected by the freezing and
thawing process but the alterations in their particle size distribution is not significant.
For example, for Material A, the difference caused by freezing and thawing will be that
the percentage of material passing through the 5 mm sieve would be 35.6 instead of
33.6 (average values from 5 tests).
104

The main conclusions of these tests are:
• All three types of Materials change their grading, but not considerably, when
subjected to freezing and thawing process.
• All materials show a reduction in the strength of their particles based on AIV
and ACV tests.
• Materials B are affected more than Material A. This might be a result of the
extra process they underwent that might have caused micro-cracks in their
particles which when filled with water and frozen and thawed can crack further.
Microscopic analysis of the materials in order to investigate this suggestion was
not feasible due to the time frame of this investigation
• Material C which have also been further processed do not present such a large
reduction in particle strength compared to Materials A and B and for the ACV
results. When the AIV results are compared then Material C are affected more
than Material A but less than Material B. These results might be due to their
individual properties. There can not be a direct comparison though since
Material C are brick based and the original sources of all the materials are
unknown.
It is important to note though that the age of the structures that were demolished for the
production of the three types of Materials is unknown, and therefore this factor can not
be taken into consideration when comparing the materials. The type of cement and
aggregates used in the manufacturing of the original concrete (that was crushed to
produce materials A and B) is also unknown and therefore this factor can not also be
taken into consideration.
8.5 Permeability
The measured permeability of the materials is 2.4x1 O'5 (average of two tests), 1.5x1 O'5
and 8.5x1 O'6 m/s for Material A, B and C respectively.
Due to the limited number of tests (only two tests for Material A and one for Material B
and C were performed) the results may not be regarded to be representative of recycled
materials generally. However the two tests performed for Material A show that the
procedure for the preparation, saturation and testing of the sample are reproducible. The
small difference in the k values (0.3x1 O'5 m/s, which is 13% of the mean k value
105

measured) may be a result of the variability of the materials and therefore can not be
confidently attributed to shortfalls in the sample preparation process.
The permeability of the Materials is considered to be quite small. Values of 1X10 5 m/s
have been observed though by other researchers for limestone (Brown, 1988;
Mackenzie and McDonald, 1985), but for coarser materials of particles sizes 100 mm.
In conclusion it can be said that:
• The equipment and the procedure followed for the compaction, saturation and
flow stabilisation for the permeability can be easily reproduced
• The permeability of all the Materials is quite low
• There is a difference of about 60% between the permeability of Material A and
B, that can be result of the differences in gradings.
• More tests are required to determining the range of permeability values for the
materials, including varying parameters such as density of specimens
8.6 Test Parameters Investigated in the Shear Box and Particle Crushing Tests
The literature review has identified that the following factors may affect the shear
strength and particle breakage behaviour of granular materials:
• Moisture content
• Freeze Thaw
• Maximum particle size
• Particle shape
• Specimen density
It would have been impossible to investigate the effect of every parameter. The
parameters varied and kept stable are as follows:
1. Moisture content - As all the materials in this investigation were tested with the
same moisture content for the reasons mentioned previously (Section 3.4.1), it is
not possible to comment on the influence of moisture content.
2. Weathering - Weathering is thought to induce greater particle breakage (and
lower strength) due to weakening of individual particles (Chrismer, 1985). The
results from the freeze-thaw tests (2, 2.4 and 2.1 % for Material A, B and C
respectively) have shown that the materials exhibit very similar degradation
under freeze-thaw conditions and no samples were tested in the shear box after
106

being subjected to any weathering effects. Therefore it is not possible to
comment on the effect of weathering on particle crushing and material strength
in this investigation. Also the degree of weathering of the materials' source(s) is
unknown and therefore is impossible to comment on that effect on the strength
of the crushed materials.
3. Maximum particle size - The materials were tested for two maximum particle
sizes, 37.5 mm (SBT1) and 28 mm (SBT3), both with the same specimen
density of 1.8 Mg/m3.
4. Particle shape - As the reduction of the maximum particle size caused minimal
change to the flakiness and elongation Indices of the materials (Table 8.7) it is
not possible to comment on the effect of this parameter.
Table 8.7: Flakiness and Elongation Indexes values for SBT1 and SBT3
Material A Material B Material C
Maximum Particle Size Fi Ei Fi Ei Ei Fi
37.5 mm (SBT1) 11.5 23.8 6.5 14 20.3 9.7
28 mm (SBT3) 11.6 24.4 6.6 14.5 21.9 9.3
5. Specimen density - The effect of dry density on shear strength and particle
crushing was investigated by testing at densities of 1.8 Mg/m3 (SBT1) and 1.6
Mg/m3 (SBT2), but keeping the maximum particle size at 37.5 mm. On these
tests the specimens' moisture content, maximum particle size, particle shape and
grading were kept identical for both SBT1 and SBT2.
8.7 Particle Crushing
Table 8.8 summarises the breakage index values for all Materials for SBT1, SBT2 and
SBT3.
Table 8.8: Breakage Indices
Breakage Index, Bt (%)Material SBT1 SBT2 SBT3A 8.8 4.0 4.4B 12.1 7.1 5.5C 4.3 2.5 2.1
107

Comparing the values from Table 8.8 it is evident that Material B crushes the most and
Material C the least, for all types of shear box testing. This is thought to be a result of:
• Concrete based particles (Material A and B) crushing more than brick based
particles (Material C) due to the weaker nature of their cement to cement and /
or cement to aggregate bonds.
• The further processed concrete based material (B) having more micro-cracking
on their particles, which may lead to greater crushing in Material B during shear.
Angular particles crush more during shear tests, but there is no obvious correlation
between the results of the Flakiness and Elongation ratios with the amount of particle
breakage of the materials. Therefore the differences in ease of breakage do not appear to
be an effect of particle shape.
As discussed in Section 8.6, the two parameters varied during the shear box tests were
the maximum particle size and specimen density. Their effect on particle crushing is
discussed below:
1. Maximum particle size - From Table 8.7 it can be seen that there is
approximately 50% less crushing occurring in SBT3 compared to SBT1, for all
three materials. This increase in the degree of crushing with increasing particle
size has been previously reported for natural aggregates (Hardin, 1985,
MacDowell and Bolton, 1998 and Indraratna et al 1998).
2. Specimen density - The decreases in Breakage Index between SBT1 and SBT2
are given in Table 8.9.
Table 8.9: Reduction in values of B: between SBT1 and SBT2
Material Type SBT1 SBT2 Reduction of Bt
Material A 8.8 4.0 4.8 (54%)
Material B 12.1 7.1 5.0 (41%)
Material C 4.3 2.5 1.8(41%)
Particle crushing reduces with reducing density. This has been observed by
others (De Souza, 1958, Hendron 1963 and Hagerty et al, 1993) and is mainly
attributed to the fact, that since the materials are not compacted so densely then
they have the ability to rearrange during shear rather than to crush.
108

Table 8.10 compares the AIV and ACV tests and breakage factors. The numbers 1, 2
and 3 rank the amount of particle crushing with 1 showing the materials that crush the
least and 3 the most.
Table 8.10: Comparison of AIV and ACV tests with particle crushing results
Particle CrushingMat AIV ACV SBT1 SBT2 SBT3A 1 1 2 2 2
B 3 2 3 3 3
C 2 3 1 1 1
The comparison shows that there is no direct connection between the amount the
materials crush as a whole and on the AIV and ACD tests. It is believed that for the
specific three types of materials investigated the AIV and ACV tests do not provide
reliable information on the strength of the particles.
Demolition waste materials crush under stress application, with the amount of crushing
reducing with maximum particle size and specimen density. This behaviour has also
been observed for natural granular materials. Material C crushed less than Material A
and B and this was attributed to individual particle strength due to the existence of the
weaker cement to cement and cement to aggregate bond in the crushed concrete
particles. This might cause the composite particles (crushed concrete particles) to break
more than the homogeneous ones (crushed brick particles). Further testing, of the
strength of individual particles' strength, is needed though to verify this.
8.8 Introduction to Shear Box Testing
As discussed in Section 8.6 the parameters investigated in this project as for their effect
on shear behaviour are specimen density (SBT2), maximum particle size (SBT3) and
normal stress (SBT1, SBT2 and SBT3). The moisture content of the samples was kept
the same throughout the shear box test programme and the change in maximum particle
size was not associated with any changes in the particle shape of the materials.
The discussion of the behaviour of the materials under shear are presented as follows:
1. Initial Observations on Behaviour under Shearing - Section 8.9
2. Influence of Specimen Density - Section 8.10
3. Influence of Maximum Particle Size - Section 8.11
109
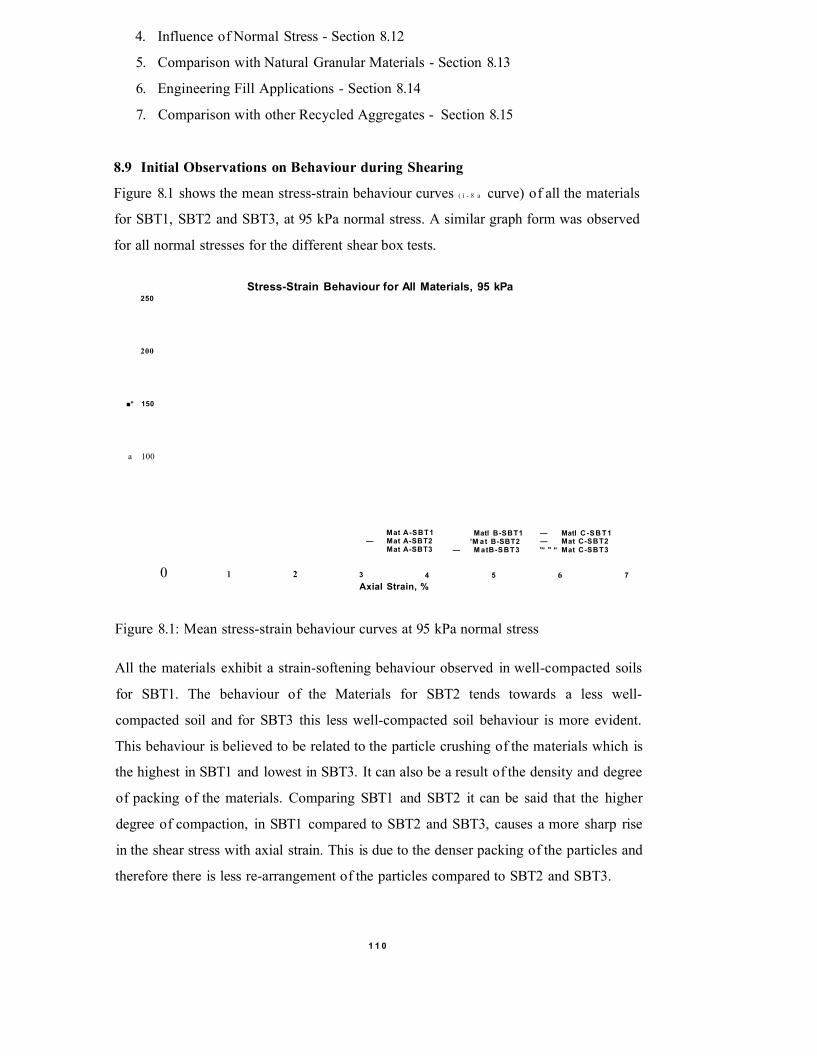
4. Influence of Normal Stress - Section 8.12
5. Comparison with Natural Granular Materials - Section 8.13
6. Engineering Fill Applications - Section 8.14
7. Comparison with other Recycled Aggregates - Section 8.15
8.9 Initial Observations on Behaviour during Shearing
Figure 8.1 shows the mean stress-strain behaviour curves ( i - 8 a curve) of all the materials
for SBT1, SBT2 and SBT3, at 95 kPa normal stress. A similar graph form was observed
for all normal stresses for the different shear box tests.
Stress-Strain Behaviour for All Materials, 95 kPa250
200
■* 150
a 100
Mat A-SBT1— Mat A-SBT2 Mat A-SBT3
Matl B-SBT1'M at B-SBT2
— M atB -SBT3
— Matl C -SB T1 — Mat C-SBT2 '“ " “ Mat C-SBT3
0 1 2 3 4 5 76Axial Strain, %
Figure 8.1: Mean stress-strain behaviour curves at 95 kPa normal stress
All the materials exhibit a strain-softening behaviour observed in well-compacted soils
for SBT1. The behaviour of the Materials for SBT2 tends towards a less well-
compacted soil and for SBT3 this less well-compacted soil behaviour is more evident.
This behaviour is believed to be related to the particle crushing of the materials which is
the highest in SBT1 and lowest in SBT3. It can also be a result of the density and degree
of packing of the materials. Comparing SBT1 and SBT2 it can be said that the higher
degree of compaction, in SBT1 compared to SBT2 and SBT3, causes a more sharp rise
in the shear stress with axial strain. This is due to the denser packing of the particles and
therefore there is less re-arrangement of the particles compared to SBT2 and SBT3.
1 1 0

In the majority of the results (apart from SBT1, 143 and 238 kPa and from SBT2, 143
kPa) the stress strain curves of Material A and B appear to be closely spaced despite the
differences in their properties (gradation, particle shape, crushing and AIV and ACV).
This demonstrates a similarity in the behaviour of the concrete based materials, as far as
their stress strain behaviour is concerned. This can be a result of:
1. The differences in parameters of these two specific materials may have minor
effect and other parameters such as normal stress may be the dominating factor
on their shear-strain behaviour
2. These parameters may be "cancelling out" the effect of each other. For example,
Material A crushes less and is more angular than Material B which, according to
Literature Review, would mean that Material A should have higher values of
shear strength. Material B though is more broadly graded and this would mean
that they have higher shear strength. The accumulative effect of these three
parameters, though, may cause Material A and B to exhibit similar stress-strain
behaviour.
The behaviour of Material C differs from Materials A and B something that was
expected since it has a different composition (brick based). It exhibits higher values of
shear stress and this is believed to be a result of its lower particle breakage and higher
Cu value (Indraratna et al, 1998). It is thought that the differences existing between the
Flakiness Indices of Material A and B and Material C (12.9, 7.3 and 10.1 for A, B and C
respectively) are quite low and they do not affect their differences in the shear strength
levels.
Figure 8.2 shows this trend for all three materials, SBT1 and two different normal
stresses.
In all the types of tests, for all the materials, the volumetric behaviour in the later stages
of the tests where failure (peak of x -£a graph) occurs is of volumetric expansion as has
been illustrated in Section 7.3.3. All graphs are not repeated in this section of the thesis
for ease of reading.
I l l

Volume Change Behaviour SBT1
3.5
2.5
wce55u
oE_3O> 0.5
-0.5
Axial Strain,ca (%)
— Mat A -190 kPa--------Mat B -190 kPa — Mat C -190 kpa Mat A -3 1 7 kPa Mat 8 -3 1 7 kPa "— Mat C - 3 1 7 kPa j
Figure 8.2: Volumetric behaviour for SBT1, 190 and 317 kPa normal stress levels
Figure 8.3 presents the average peak shear to normal stress behaviour of the three
materials for SBT1.
Shear Stress against Normal Stress for SBT1
500.0
400.0
350.0
300.0
O 250.0
* - 200.0
150.0
100.0
50.0
50.0 100.00.0 150.0 200.0 250.0 300.0 350.0
Normal Stress (kPa)
Figure 8.3: Normal against shear strength for SBTl
Figure 8.3 shows that the shear-normal stress graphs display curvature and probably
pass through the origin of the axes (zero cohesion). The curvature phenomenon has been
observed in shear strength investigations for natural granular materials by others
1 1 2

(Marachi et al, 1972, Charles and Watts, 1980, Indraratna et al, 1993, Indraratna et al,
1998). The curvature is more evident for Material C and less for Material B.
The friction angles (based on a straight line from the origin to the measured shear at 317
kPa) were calculated to be 55°, 57° and 57° for Material A, B and C respectively. The
values for Material A and C appear to be quite high compared to natural aggregates, but
values of about 60° have been observed by Charles and Watts (1980) for sandstone and
basalt of maximum particle size of 38 mm. Indraratna et al (1998) have found friction
angles of 66 and 67° for basalt at low normal stresses and attributed them to the
interparticle stresses being less that the crushing strength of the materials and the ability
of particles to dilate more. Further, Fannin et al (2005) have calculated friction angles
up to 71° for in situ tests in mountain soils at British Columbia. Concluding:
1. The materials behaviour is of well compacted materials for SBT1 and well to poorly
compacted materials for SBT2 and SBT3. This has been attributed to particle crushing
2. All materials exhibit volumetric expansion at failure, typical of densely packed
materials.
3. The shear-normal stress relation exhibits curvature and the values of friction angles
appear to be quite high when compared to natural aggregates.
8.10 Influence of Specimen Density on Behaviour during Shearing
8.10.1 Influence on stress-strain behaviour
Figure 8.4 shows the axial strain values at failure (peak of x -Sa graph) for Material A, B
and C for SBT1 and SBT2.
7 .5
6 .5
5 .5o2RS
u ; 4 .5
TO 4c
3 .5TO<0 3
to 2 .5
< 2
0 .5
9 5 1 4 3 1 9 0 2 3 8 3 1 7
N o rm a l S tre s s (k P a )“ ♦ “ Mat A-SBT1 “ * ” Mat A-SBT2 “ * “ Mat B-SBT1 - * - M a t B-SBT2 Mat C -SBT1 “ * “ Mat C -S8T 2
Figure 8.4: Axial strain values at failure for SBT1 and SBT2
113

From the results, it can be concluded that the axial strain at failure (peak of t -8a graph)
increases, quite significantly when the dry density reduces. This behaviour has been
observed by others for natural aggregates (Pike, 1973, Charles and Watts, 1980) and it
has been attributed to the more loose packing of the particles (Charles and Watts, 1980).
Particles undergo compression, rearrangement, compression and breakage stages under
shearing forces (Varadarajan et al, 2003). Looser packing allows for more
rearrangement of particles and therefore larger axial strain is required for failure.
8.10.2 Influence on volume change behaviour
Figure 8.5 presents the volumetric strain values at failure for SBT1 and SBT2 for all
three materials.
_______— '1 11 ^
C03u.
O0 U.oE1 0.6 >
0 .4
0.2
1 4 39 5 1 9 0 2 3 8 3 1 7
N o rm al S tress , kPa
| ~ * —Material A-SBT1 Material A-SBT2 ^ ^ M a t e r ia l 8-SBT1 '“♦ “ Material B -S8T 2 " ^ ^ M ateria l C-SBT1 Material C -SBT2 |
Figure 8.5: Volumetric strain values at failure for SBT1 an SBT2
The results present a mixed picture of the volumetric behaviour of the materials when
the specimen density changes. Particle breakage decreases with the reduction in dry
density and it was expected that, if that was the dominant factor, the volumetric
dilatancy would increase. This does not occur though and the volumetric dilation at
failure (between SBT1 and SBT2) increases at lower normal stresses but appears to
decrease as the normal stress increases. There is not therefore a specific pattern of
influence on the volumetric strain from the change in the specimen density. This may be
due to the fact that the change in dry density was not large enough to produce any
specific pattern on its influence on volumetric behaviour and at this level of change
114

normal stress is the dominant factor on the volumetric behaviour of the materials.
Further testing with higher range of densities is required to verify or refute this
conclusion.
8.10.3 Influence on shear strength
Figure 8.6 presents the shear-normal stress curves for SBT1 and SBT2 in the form of
best fit trendlines.
Shear Stress against Normal Stress for SBT1
500.0
450.0
400.0
350.0
'HT 300 0O 250.0
200.0
s z 150.0
100.0
50.0
0.050.00.0 100.0 150.0 200.0 250.0 350.0300.0
Normal Stress (kPa)
— Mat A-Best Fit — Mat B-Best Fit — Mat C-Best Fit
Shear Stress against Normal Stress for SBT2
300.0
© 250.0
JZ 150.0
50.0 100.00.0 150.0 200.0 250.0 350.0300.0
Normal Stress (kPa)
— Mat A-Best Fit — Mat B-Best Fit — - Mat C-Best Fit
Figure 8.6: Shear-normal stress curves for SBT1 and SBT2
Six different trendline types were applied in the graphs. All the best fit trendlines pass
through the axes origin point (0, 0). The best fit graphs presented in this discussion are
115

produced by the type of trendline that has a coefficient of determination (R2) closest to
one. The coefficient of determination indicates how closely the estimated values for the
trendline correspond to the data. A trendline is most reliable when its coefficient of
determination value is at or near 1.
The best fit graphs for SBT1 and for Material A, B and C had a coefficient of
determination of 0.98, 0.99 and 0.99 respectively. For SBT2 the coefficients of
determination were 0.99 for all three materials.
As discussed previously the shear to normal stress graphs display curvature and pass
through the origin of the axes for SBT1. For SBT2 though this behaviour is only
observed for Material C. There is no obvious reason for this and further testing with
more types of brick based materials is required to determine if this is a trend generally
met for brick-based materials or specifically for Material C. The further processed
concrete based material (B) and the concrete based material obtained straight from the
demolition site (A) exhibit an almost linear and identical relation in the SBT2 tests. The
possible reasons for this similarity have been discussed in Section 8.9.
Table 8.11 tabulates the values of friction angles, for all normal stresses for all three
materials together with their percentage reductions from SBT1 to SBT2. The friction
angles have been calculated as secant values from the origin to the normal stress level
indicated.
Table 8.11: Friction angle values for SBT1 and SBT2
Percentage reduction, % given by: (friction angle for SBT1-friction angle for
SBT2)/friction angle of SBT1
Normal Material A Material B Material C
Stress, kPa SBT1 SBT2 % SBT1 SBT2 % SBT1 SBT2 %
95.0 62 51 17 60 53 13 66 60 8
143.0 60 53 12 60 55 9 65 60 8
190.0 61 51 16 60 55 8 64 58 9
238.0 62 51 17 59 55 7 60 56 7
317.0 55 51 8 57 54 5 57 54 5
The results show that the friction angles decrease when the specimen density reduces as
expected due to the reduced packing of particles at lower densities. Particle breakage
116

also decreases with reduced density and this could cause an increase in the strength of
the materials (Varadarajan, et al, 2003). In this discussion, though, friction angles
increase with density and despite the reduced particle crushing. Particle breakage
appears therefore to:
1. Not affect the behaviour of the materials, or
2. is a secondary factor to specimen density and its effect may not be visible.
The largest reductions of friction angles are met for Material A. Material A, which is the
less processed from all three materials, has the least broad gradation. This results in
reduced capacity of filling the voids in the specimen during rearrangement of particles
under shearing. For the same materials, when the density reduces the amount of voids
increases. Material B and C with more broad gradation may be able to fill this increased
amount of voids faster and therefore exhibit smaller percentages of friction angle
reduction. This is a possible explanation and more testing with manufactured gradings
of the same type of materials is needed to verify it.
The reductions are more significant for lower normal stresses. At higher values of
normal stress the reduction percentages are smaller (5-8%), which may also be an
indication that the effects of dry density is minimised as the normal stress increases. A
more comprehensive discussion on the influence of normal stress on the behaviour of
the materials under shear is given in Section 8.12.
8.10.4 Summary of conclusions
The discussion on the influence of specimen density has shown:
• The axial strain at failure (peak of x -Sa graph) increases with reduced specimen
density
• The volumetric strain decreases or increases with reduced density and the
changes appear to be influenced by the levels of normal stress
• The friction angles reduce with reduced density
8.11 Influence of Maximum Particle Size on Behaviour under Shearing
8.11.1 Influence on stress-strain behaviour
Figure 8.7 shows the axial strain values at failure (peak of x -Sa graph) for Material A, B
and C for SBT1 and SBT3.
117

Axial Strain at Failure
5.5
S ' 4.5
0.5
95 143 190 238 317
N orm al Stress (kPa)-* - M a t A - S B T 1 Mat A-SBT3 - * - M a t B-SBT1 - ♦ - M a t B-SBT3 -4 ^ M a tC -S B T 1 - « - M a t C - S B T 3
Figure 8.7: Axial strain values at failure for SBT1 and SBT3
The results show that the reduction of maximum particle size used in this experimental
programme increases the axial strain at failure.
Particle crushing reduces with reduced maximum particle size, as also shown by
McDowell and Bolton (1998) and this could be a reason for the increased axial strain
values. On the other hand though, Varadarajan et al (2003) have shown that the axial
strain at failure increases with maximum particle size when they tested two materials (of
alluvial and metamorphic rock origin) with maximum particle sizes of 25, 50 and 80
mm. The difference in the behaviour between these natural and recycled materials can
be due to:
• Particle crushing being the dominant factor in the stress-strain behaviour of the
materials when maximum particle size reduces or
• The difference in maximum particle sizes is not large enough to show any clear,
similar to natural aggregates, trends.
Testing the materials with larger maximum particle size differences would be able to
determine which of the above explanations are true.
Another interesting observation is that the effect of maximum particle size become
small at higher normal stresses where differences of -0.1, 0.4 and 0.1% are met for
material A, B and C respectively at 317 kPa normal stress. This has also been
encountered by Indraratna et al (1993) for material with maximum particle sizes of 38.1
118

and 25.4 mm for normal stresses above 300 kPa. A more comprehensive discussion on
the influence of normal stress on the behaviour of the materials under shear is given in
Section 8.12.
8.11.2 Influence on volume change behaviour
Figure 8.8 presents the volumetric strain values at failure for SBT1 and SBT3 for
Material A (concrete based and obtained straight for a demolition site), B (concrete
based but furthered processed) and C (brick based and furthered processed) and for all
normal stresses investigated in this project.
c(0
55o«E3O> 0.6 -
0.4
0.2
95 143 190 317238
______________________________________________ N o rm al S tress , kPa______________________________________________|~ * " M a te r ia l A-S8T1 Material A -SB T 3*^**M ateria l B-SBT1 Material B-SBT3 * Material C-SBT1 ^ " M a t e r ia l C-SBT31
Figure 8.8: Volumetric strain values at failure for SBT1 an SBT3
The results on the effect of maximum particle size on volumetric behaviour present a
mixed picture, as in the discussion on the influence of specimen density on volumetric
behaviour of the materials (Section 8.10.2). The volumetric dilation at failure (between
SBT1 and SBT3) increases at lower normal stresses but appears to decrease as the
normal stress increases. This may be a result of the fact that the change in maximum
particle size was not large enough to produce any specific pattern on its influence on
volumetric behaviour as discussed for the stress-strain curves in Section 8.11.1. Further
testing with higher range of maximum particle sizes is required though to verify or
refute this conclusion.
The changes in volumetric strains at failure appear to depend on the normal stress levels
and that is discussed in Section 8.12.
119

8.11.3 Influence on shear strength
Figure 8.9 presents the shear-normal stress curves for SBT1 and SBT3 in the form of
best fit trendlines. The coefficients of determination were 0.99 for all three materials.
Shear Stress against Normal Stress for SBT1
T 300.0
© 250.0
s z 150.0
0.0 50.0 100.0 150.0 200.0 250.0 300.0 350.0
Normal Stress (kPa)
M at A -B e s t Fit — M at B -B e s t Fit — M at C -B e s t Fit
Shear Stress against Normal Stress for SBT3
~ 300.0
© 250.0
S I 150.0
0.0 50.0 100.0 150.0 200.0 250.0 300.0 350.0
Normal Stress (kPa)
“ ■ Mat A -B e st Fit “ Mat B -B est Fit — Mat C -B e st Fit
Figure 8.9: Shear-normal stress curves for SBT1 and SBT3
As discussed previously the shear to normal stress graphs display curvature and pass
through the origin of the axes for SBT1. For SBT3 though behaviour of all the materials
appear to be linear. This is believed to be a result of the significantly reduced particle
breakage of particles (by 50%, 55% and 51% for Material A, B and C respectively).
As established in the Literature Review, the effect of maximum particle size on the
friction angles of materials can not be generalised for all materials. Table 8.12 presents
1 2 0

the values of friction angles, all three materials together with their percentage reductions
from SBT1 to SBT3. The friction angles have been calculated by as secant values from
the origin to the normal stress level indicated, because the graphs curve and pass
through the origin of the axes, exhibit zero cohesion.
Table 8.12: Friction angle values for SBT1 and SBT3
Percentage reduction, % given by: (friction angle for SBT1-friction angle for
SBT2)/friction angle of SBT1
Normal Material A Material B Material C
Stress, kPa SBT1 SBT3 % SBT1 SBT3 % SBT1 SBT3 %
95.0 62 47 23 60 52 13 66 55 16
143.0 60 49 18 60 53 12 65 55 16
190.0 61 51 17 60 55 8 64 53 16
238.0 62 51 16 59 53 10 60 52 13
317.0 55 50 9 57 53 6 57 52 9
The values of Table 8.12 show that the friction angles of all the materials reduce when
the maximum particle size decreases from 37.5 mm to 28 mm. Particle breakage also
decreases with the reduced maximum particle size. As discussed in Section 8.10.3 this
could cause an increase in the strength of the materials (Varadarajan, et al, 2003). In this
discussion, though, friction angles increase with maximum particle size despite the
reduced particle crushing. Particle breakage appears therefore to:
1. Not affect the behaviour of the materials, or
2. is a secondary factor to maximum particle size and its effect may not be visible.
8.11.4 Summary of conclusions
The discussion on the influence of maximum particle has shown:
• The axial strain at failure increases with reduced maximum particle size
• The volumetric strain vary with reduced maximum particle size, with no clear
correlations, and the changes appear to be affected by the normal stress levels
• The friction angles reduce when maximum particle size is reduced
12 1

Comparing the discussions on both Sections 8.10 and 8.11 it is evident for the three
materials and two different maximum particle sizes (37.5 and 28 mm) and specimen
densities (1.8 and 1.6 Mg/m3) that:
• The stress-strain relations are affected more from the reduction in density than in
maximum particle size
• The influence on the volumetric behaviour of the materials is inconclusive for
both maximum particle sizes and densities
• The friction angles are affected more by the reduction in maximum particle size
than the reduction in specimen density
It has to be noted though that these observations are true for the specific materials and
values of maximum particle size and specimen density parameters. Larger changes in
these parameters may show different trends and this needs further investigation.
8.12 Influence of Normal Stress on Behaviour under Shearing
8.12.1 Influence on stress-strain behaviour
The graphs of Section 7.3.1 on the stress-strain relations of all the materials show that
the axial strain at failure (peak of x-Sa graph) increases with normal stress (graphs are
not repeated for ease of reading). The values of axial strain at failure are plotted against
normal stresses (as best fit trendlines) for Material A, B and C in Figure 8.10.
Axial Strain at Failure against Normal Strees
Mat A -SBT1
Mat A -SB T 2
Mat A -SB T 3
Mat B-SBT1
Mat B -S B T 2
Mat B -S B T 3
Mat C-SBT1
Mat C -SB T 2
Mat C -SB T 3
1 5 0 2 0 0
N o rm a l S tre s s (k P a )
Figure 8.10: Influence of normal stress on axial strain at failure
1 2 2

The results indicate that the amount of axial strain at failure (peak of x - S a graph)
increases with normal stress, something that has been observed by others (Marsal, 1967,
Charles and Watts, 1980, Indraratna et al, 1993, Indraratna et al 1998 and Varadarajan,
et al, 2003) when testing granular materials.
The best fit graphs appear to be of similar gradients for SBT1 and SBT3, but exhibit
completely different trends between SBT1 and SBT2. As discussed in Section 8.11.4
the changes in specimen density affect the stress-strain relations of the materials more
than the reductions in maximum particle size. The best fit trendlines of Figure 8.10
appear to verify these observations.
8.12.2 Influence on volume change behaviour
Figure 8.11 presents the influence of normal stress on mean volumetric strain at failure
(peak of i - 8 a graphs). It shows the actual value points for each material and test and the
linear best fit trendlines.
Volumetric Strain against Normal Stress♦ Material A-SBT1
■ Material A-SBT2
* Material A-SBT3
x Material B-SBT1
x Material B-SBT2
• Material B-SBT3
♦ Material C-SBT1
o Material C-SBT2
- Material C-SBT3
— Linear (Material A-SBT1)
Linear (Material A-SBT2)
Linear (Material A-SBT3)
Linear (Material B-SBT1)
—~ Linear (Material B-SBT2)
Linear (Material B-SBT3)
Linear (Material C-SBT1)
Linear (Material C-SBT2)
— - Linear (Material C-SBT3)150 200
Normal Stress, kPa
Figure 8.11: Influence of normal stress on volumetric strain at failure
The level of volumetric strain (dilatancy for all the tests performed in this investigation)
reduces with normal stress apart from SBT1 for Material A and C. Others (e.g. Marsal,
1967, Charles and Watts, 1980, Brown, 1988, Indraratna et al, 1993, Indraratna et al,
123

1998 and Varadarajan et al, 2003) have observed this for natural aggregates and shown
that at high normal stresses materials exhibit compression.
Varadarajan et al (2003) attributed the reduction of volumetric dilatancy to the
increased particle breakage and therefore increased compression behaviour at higher
normal stresses. Similar results were observed by Lade et al (1996). This can not be
verified for these results though because no particle crushing tests were performed for
individual normal stresses.
The materials exhibit the largest particle crushing when sheared with the largest density
(1.8 Mg/m3) and maximum particle size (37.5 mm) for SBT1. There is a possibility
therefore that their behaviour is heavily related to the crushing of particles for them to
exhibit any specific trend of volumetric diltancy reduction with increasing normal stress.
Figure 8.12 presents the best fit trendlines for all the materials for SBT2 and SBT3 and
their possible continuations after the normal stress of 317 kPa. These have been based
on their graphical form and assume that the rates will not change dramatically at higher
normal stresses. They show the level of normal stress at which it is estimated the
volumetric behaviour of the materials at failure (peak of i-Sa graphs) will change from
dilatancy to compression.
Limitation of Shear Box. normal stress 317 kPa
0 50 100 150 200 250 300 350 400 4 5 0 5 00 550Normal S tre ss , kPa
— Linear (Material A-SBT2) Linear (Material A-SBT3) Linear (Material B-SBT2)■ Linear (Material B-3BT3) Linear (Material C-S8T2) Linear (Material C-SBT3)
Figure 8.12: Possible continuations of the best fit graphs for Materials A, B and C
124
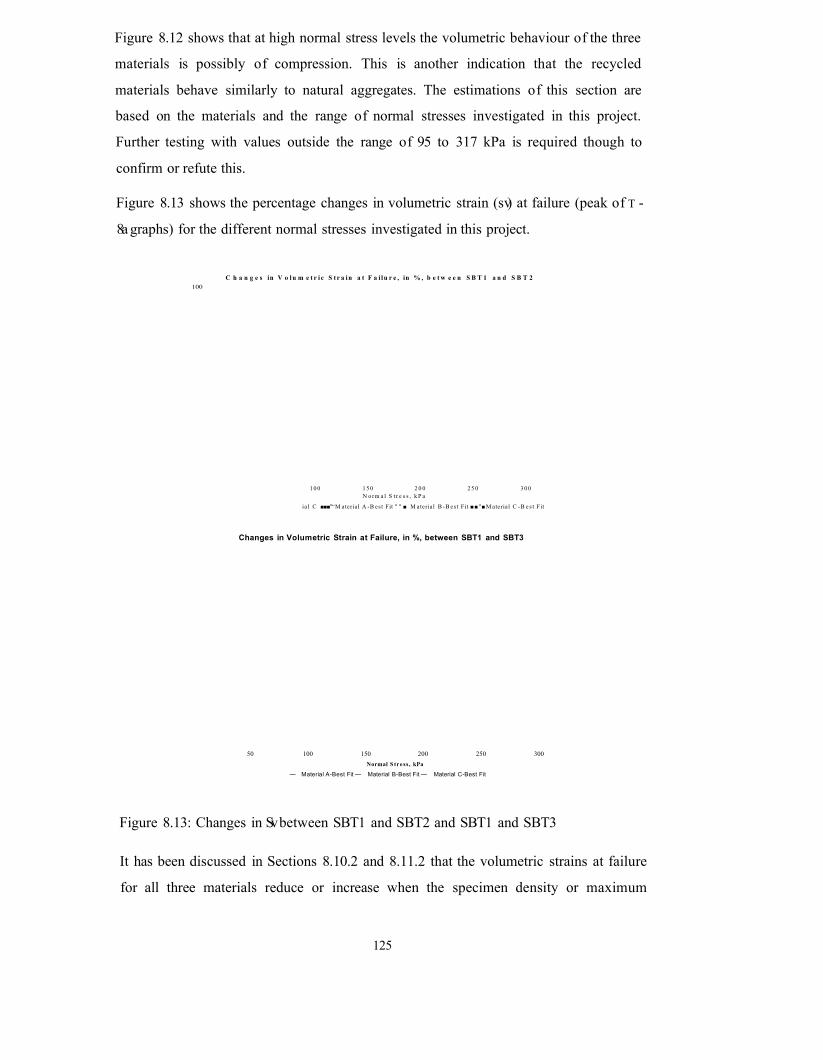
Figure 8.12 shows that at high normal stress levels the volumetric behaviour of the three
materials is possibly of compression. This is another indication that the recycled
materials behave similarly to natural aggregates. The estimations of this section are
based on the materials and the range of normal stresses investigated in this project.
Further testing with values outside the range of 95 to 317 kPa is required though to
confirm or refute this.
Figure 8.13 shows the percentage changes in volumetric strain (sv) at failure (peak of t -
8a graphs) for the different normal stresses investigated in this project.
C h a n g e s in V o l u m e t r i c S t r a in a t F a i lu r e , in % , b e t w e e n S B T 1 a n d S B T 2100
10 0 1 50 2 0 0 2 5 0 3 0 0N o rm a l S t r e s s , k P a
ia l C ■■■"“M ateria l A -B est Fit " " ■ M ateria l B -B est Fit ■■"■ M aterial C -B e s t Fit
Changes in Volumetric Strain at Failure, in %, between SBT1 and SBT3
50 100 150 200 250 300Normal S tress, kPa
— Material A-Best Fit — Material B-Best Fit — Material C-Best Fit
Figure 8.13: Changes in Sv between SBT1 and SBT2 and SBT1 and SBT3
It has been discussed in Sections 8.10.2 and 8.11.2 that the volumetric strains at failure
for all three materials reduce or increase when the specimen density or maximum
125

particle size decreases, i.e. there is no specific correlation on the effect of maximum
particle size. The lack of specific trends was attributed to the normal stress being the
dominant factor. The percentages are calculated by:
Sv at SBT1- Sv at SBT2 or SBT3
£v at SBT1.
Positive values indicate increase in £v and negative decrease.
At low normal stresses there is an increase in the £v, when the values of SBT2 and SBT3
are compared with the values of SBT1. As the normal stress increases though, this
increase in £v reduces and at specific normal stresses for each of the Materials becomes
a volumetric strain decrease.
This level of normal stress where the difference of volumetric dilatancy becomes zero
would be called "point of zero £v change" for the purposes of this discussion. Table 8.13
summarises the calculated normal stresses at the £v change inversion points.
Table 8.13: Point of zero £v change between SBT1 and SBT2 and SBT1 and SBT3
Normal stress, kPa
Materials SBT1 to SBT2 SBT1 to SBT3
A 195 220
B 145 165
C 230 270
The results of Table 8.13 show that Material B reaches the point of zero £v change at the
lowest normal stress and Material C at the highest. The particle crushing results show
that Material B crush the most and Material C the least. Varadarajan et al (2003) and
Lade et al (1996) have found that at higher normal stresses increased particle breakage
and therefore increased compression occurs. It is possible therefore that the materials
that crush the easiest reach the point at which dilatancy decreases at lower normal
stresses than stronger material.
As far as the volumetric behaviour of the materials is concerned it has been shown that:
1. The level of normal stress appear to be the dominant factor
2. There is a level of normal stress at which the effect on the volumetric strain of the
specific changes of maximum particle size and specimen density, of this investigation,
126

becomes zero. These points have been estimated graphically and testing at these specific
normal stresses is needed to establish these levels more accurately.
8.12.3 Influence on shear strength
Apart from affecting the shear stress, it has been well documented (Marsal, 1967, Leps,
1970, Marachi et al, 1972, Indraratna et al 1993 and Fannin, 2005) that an increase in
normal stress reduces the friction angle of the materials. Figures 8.14 shows the values
of friction angle in relation to normal stress in the form of polynomial best fit trendlines.
The friction angles are based on a straight line from the axes origin to the measured
shear stress at the investigated normal loads and are presented in the form of
comparison between SBT1 and SBT2 and SBT1 and SBT3.
Friction Angle values against Normal Stress, SBT1 and SBT270.0
65.0
60.0
< 55.0
50.0
45.0
Poly. (Mat A-SBT1) Poly. (Mat B-SBT2)
Poly. (Mat A-SBT2) ■Poly. (Mat C-SBT1)
Poly. (Mat B-SBT1) Poly. (Mat C-SBT2)
40.00.0 50.0 100.0 150.0 200.0 250.0 300.0 350.0
Normal Stress, kPa
Friction Angle values against Normal Stress, SBT1 and SBT370.0
65.0
60.0
< 55.0
50.0
45.0
Poly. (Mat A-SBT1)
Poly. (Mat B-SBT3)■Poly. (Mat A-SBT3) ■Poly. (Mat C-SBT1)
■Poly. (Mat B-SBT1)
Poly. (Mat C-SBT3)40.0
0.0 50.0 100.0 150.0 200 .0 250.0 300 .0 350 .0Normal Stress, kPa
Figure 8.14: Friction angle values in relation to normal stress levels
127

From figure 8.14 it is observed that:
• For SBT1: The friction angles of Material A and B remain almost stable at 50°
from 95 to 238 kPa and then drop by 7° and 3° respectively. The friction angles
of Material C reduce continuously and from 66° at 95 kPa reach 57° at 317 kPa.
This is close to reductions observed by Charles and Watts, 1980 (friction angle
of basalt from about 60° to 50° from 100 to 300 kPa). On the other hand though,
the reductions, though significant, appear to be less striking than the ones
observed by Indraratna et al (1998) who noticed drops of friction angles from
67° to 46.8° from 20 kPa to 250 kPa.
• For SBT2: There is almost no effect on the friction angles for Material A and B
from the values of 95 kPa to the values of 317 kPa. This indicates that under the
test conditions of SBT2, and for the range of normal stresses investigated their
friction angle is not affected. Material C exhibits a reduction on the friction
angles of about 6.5°.
• For SBT3: The friction angles of the crushed concrete based materials do not
appear to be affected by the increase in normal stresses. The friction angles of
Material C reduce by approximately 3.5°. This reduction is significantly lower
than the one observed for SBT2
Materials C appear to have the higher friction angles at low normal stresses. There is no
clear correlation of this with particle shape since Materials C are not the most angular
and therefore stronger materials. It is though possible that Material C exhibits the higher
friction angles due to:
1. Higher Cu value that provides better packing of particles (Indraratna et al, 1998)
2. Having the least particle crushing, and therefore higher stiffness.
The differences in the values of friction angle, between SBT1 and SBT2 and SBT1 and
SBT3, appear to reduce with increasing normal stress. Indraratna et al (1998) found that
at higher normal stresses (< 400 kPa) the effects of particle size on the friction angles of
the materials reduces. The same trend appears for the reduction in specimen density.
Further testing at higher normal stresses is desirable, though, to be able to verify this
conclusion.
The differences of the friction angles of Material C with those of the concrete based
materials reduce as the level of normal stress increases. It is believed, though further
128

testing is needed, that there may be a specific level of normal stress at which the friction
angles of the materials are similar despite their differences in individual properties. This
indicates that at high normal stresses the differences in the properties of the three types
of recycled materials (such as particle shape, grading and particle crushing) may not
play a significant role and the normal stress dominates their behaviour under shear.
8.12.4 Summary of conclusionsThe analysis of the results for the effect of normal stress on the behaviour of the
materials under shear has shown:
• The axial strain at failure (peak of x-Sa graph) increases with normal stress
• The level of volumetric strain (dilatancy) reduces with normal stress
• The friction angles of the materials appear to reduce with normal stress levels
8.13 Comparison of Friction Angles with AIV and ACV Tests
The validity of the AIV and ACV tests in showing the strength of materials as a unit has
been questioned for heterogeneous materials. This section compares these two tests with
the friction angles of the materials in order to verify or refute this for the specific
recycled aggregates investigated.
Table 8.14 and 8.15 present the values of AIV, ACV and friction angles for Materials A,
B and C for SBT1 and SBT2, and SBT3 respectively. The numbers 1, 2 and 3 indicate
the strength of the materials with 1 being the stronger, according to their friction angle
and shear strength values, in that specific test. Where there are two matching numbers
in a column, the results of those materials are too close and therefore considered
identical.
Table 8.14: Comparison of ACV and AIV tests with SBT1 and SBT2
SBT1 SBT2
Mat AIV ACV 95 143 190 238 317 95 143 190 238 317
A 1 1 2 2 2 1 2 3 3 3 3 2
B 3 2 3 2 3 3 1 2 2 2 2 1
C 2 3 1 1 1 2 1 1 1 1 1 1
129

Table 8.15: Comparison o f ACV and AIV tests with SBT3
SBT3
Mat AIV ACV 95 143 190 238 317
A 1 1 3 3 3 3 3
B 3 2 2 2 1 1 1
C 2 3 1 1 2 2 2
From the results it can be seen that there is no clear correlation between the values of
the friction angles and the AIV and ACV tests. There is only one result that correlates
between the different tests (For SBT1 at 238 kPa with the AIV). For the specific three
types of the materials investigated in this project, the AIV and ACV tests can not be
used to characterise their strength as a unit (i.e. their complete grading), and this is due
to the heterogeneous nature of the materials.
8.14 Comparison with Natural Granular Materials
Normal Stress against Shear Stress
Figure 8.15: Shear-normal stress envelopes
Indraratna et al, 1993-A Indraratna et al, 1993-8 Marsal, 1973 C&W, 1980-A C&W, 1980-B1 C&W, 1980-B2 -------C&W, 1980-C — Material A-SBT1 Material B-SBT1 Material C-SBT1
Indraratna et al, 1993-A: Greywacke-A, gradation A, Indraratna et al, 1993-B: Greywacke-B, gradation B, Marsal, 1973: El Granero
Slate, C&W (Charles and Watts), 1980-A:Sandstone, C&W (Charles and Watts), 1980-B1: Slate (High grade-HG), C&W (Charles
and Watts), 1980-B2: Slate(Low Grade-LG), C&W (Charles and Watts), 1980-C: Basalt
400
300 400 500
Normal Stress, kPa
130

Figure 8.15 presents the shear-normal stress envelopes for Materials A, B and C for
SBT1 together with the envelopes of other investigations. Table 8.16 summarises the
characteristics of all these Materials.
Table 8.16: Characteristics of the tests compared in Figure 8.15
Type of Material dmax (mm) Specimen Size Ratio Density
Greywacke-A 38 8 1.85 Mg/m3
Greywacke-B 25 12 1.85 Mg/m3
El Granero Slate 200 5.7 1.9 Mg/m3
A: Sandstone 38 6 2 Mg/ m3
Bl: Slate (HG) 38 6 2.1 Mg/ m3
B2: Slate (LG) 38 6 1.8 Mg/m3
C: Basalt 38 6 2.1 Mg/m3
Material A-SBT1 37.5 8.1 1.8 Mg/m3
Material B-SBT1 37.5 8.1 1.8 Mg/ m3
Material C-SBT1 37.5 8.1 1.8 Mg/m3
The specific natural materials were chosen because they have similar maximum particle
size and density to the parameters of SBT1. The natural granular materials compared
were tested in large triaxial equipment and the specimen size ratio is the ratio of the
maximum particle size over the diameter of the specimen. For the crushed demolition
waste materials the ratio of the maximum particle size over the size of the shear box
side was used.
The envelopes of Figure 8.15 show that the demolition waste materials exhibit the
steepest rise in shear stress with normal stress (i.e. greater stiffness). Not all data needed
(e.g. particle shape and breakage indices) for a direct comparison is available. The
graphs though, provide an indication on the strength and shear-normal stress behaviour
of natural and demolition waste material:
1. They show the curvature on the envelopes of natural granular materials, which is
another indication of the similarity of behaviour of natural aggregates with
Material A, B and C.
131

2. It is possible that, with the curvature exhibited by Materials A, B and C, at
higher normal stresses, the envelopes of demolition waste and natural materials
meet - Further investigation is needed thought to substantiate this.
3. The higher values of shear stress at any given strain exhibited by Materials A, B
and C might be a result of higher individual particle strength. Unfortunately no
such data is available for the materials compared and the results of the AIV and
ACV tests can not be used reliably as an indication of particle strength for
Material A, B and C.
Pike (1973) conducted shear box tests on 300 mm square specimens for number of
materials. Figure 8.16 presents the shear-normal stress envelopes for Materials A, B and
C for SBT1 together with the envelopes of five granular materials tested by Pike (1973).
Normal Stress against Shear Stress600.0 t
500.0
400.0<0
Q-
I 300 .0 CO
toS■CCO
200.0
100.0
0.00.0 50.0 100.0 150.0 200 .0 250 .0 300.0 350.0 400 .0
Normal Stress, kPa
Figure 8.16: Shear-normal stress envelopes comparison
The envelopes of Figure 8.16 show that the demolition waste materials exhibit the
similar rise in shear stress with normal stress compared to materials 1, 2 and 3.
Materials 4 and 5 appear to have greater stiffness than Material A, B and C.
Table 8.17 shows the types of materials presented in figure 8.16 and their testing
parameters.
'Material A-SBT1
Material B-SBT1
Material C-SBT1
Pike, 1973-1
Pike, 1973-2
Pike, 1973-3
Pike, 1973-4
P ike,1973-5
132

Table 8.17: Characteristics o f the Materials compared in Figure 8.16
Materials dm ax(m m ) Specimen Size Ratio DensityA 37.5 8.1 1.80 Mg/m3B 37.5 8.1 1.80 Mg/m3C 37.5 8.1 1.80 Mg/m3Pike, 1973-1, Bridport,Flint 40 7.5 1.83 Mg/m3Pike, 1973-2,Rugeley,Quartzite 40 7.5 1.82 Mg/m3Pike, 1973-3,Stanley Ferry,Gritstone 40 7.5 1.76 Mg/m3Pike, 1973-4, Holcombe,Limestone 40 7.5 1.82 Mg/m3Pike, 1973-5, Corby, Slag 40 7.5 1.75 Mg/m3
Since the densities investigated are similar between the five materials and Materials A,
B and C this can not be the reason for these differences. Also material 4 are
characterised as rounded and material 2 as mixed so there is no direct correlation
between size and strength. Pike (1973) tested the materials dry and Materials A, B and
C were tested with a moisture content of 2%. Due to this the moisture content could not
have had a significant effect on the strength properties of the materials in this
comparison. Adding to this the maximum particle size differences are very small to
have contributed significant to the differences in values exhibited. The most probable
reason for the differences between the five materials and Materials A, B and C is their
particle strength, but due to the lack of data for the five materials tested by Pike (1973)
and the unreliability of the AIV and ACV tests this can not be verified.
40
0 100 200 300 400 500 600 700 800 900 1000
Normals Stress, kPa
Influence of Normal Stress on Friction Angle
—•—caw, 1980-C
— Indraratna et al, 1993-A
Indraratna et al, 1993-B
- ♦ - M a r s a l , 1973
—t— Material A-SBT1
Material A-SBT2
—— Material A-SBT3
Material B-SBT1
Material B-SBT2
Material B-SBT3
Material C-SBT1
—* — Material C-SBT2
Material C-SBT3
Figure 8.17: Influence o f normal stress on friction angles
133

Figure 8.17 presents the influence of normal stress on the friction angle (average value)
for Material A, B and C, for all the types of shear box together with the data from three
natural aggregates obtained from the figures presented in the individual papers.
The more striking observations from Figure 8.17 are:
• The friction angles of Material A, B and C for SBT1 are higher than any of the
natural materials presented in the graph. Again this can be a result of the
individual particle strength and needs to be further investigated. After 238 kPa
they appear to follow the reduction patterns set by the natural aggregates.
• For the materials A and B the friction angles for SBT2 and SBT3 are below the
values for the natural aggregates for the lower normal stresses but after 238 kPa
they appear to follow the reduction patterns set by the natural aggregates
• Material C show the greatest consistency, since for all types of shear box they
follow similar reduction patterns as the natural granular materials
These observations of convergence are possibly a result of the minimisation of the
effects of particle properties (such as particle shape and maximum particle size) at
higher normal stresses (Indraratna et al, 1993).
8.15 Engineering Fill Applications
Strength of the Materials and Limits after Leps (1970)70
65Material A-SBT1
— Material A-SBT2
— Material A-SBT3
Material B-SBT1
a>O)c<
Material B-SBT2
Material B-SBT3co Material C-SBT1ouZ Material C-SBT2
Material C-SBT3
11 A verage
"""" Strong
40
50 100 150 200 250 300 350 400
Normals Stress, kPa
Figure 8.18: Friction angles o f Materials and rockfill strength limits (after Leps, 1970)
134

As far as the industrial application of granular materials for fill engineering is concerned,
Leps (1970) proposed limits of friction angles for low and high strength rockfill
materials. Figure 8.18 presents all the data from this investigation together with the
limits recommended by Leps.
Figure 8.18 shows that almost all the values (apart from Material A, SBT3, 95 kPa) fall
above the lower strength limit set by Leps (1970). It is noticeable that all the results for
SBT1 and the result for Material C SBT2 are above the higher strength limit which
again shows the high values of friction angle exhibited by the materials. This most
probably shows the high strength of the materials' particles and/or the high degree of
friction existing between them, but since there is no available data, this can not be
verified. In general though, it appears that the materials belong in the category of
average to high strength rockfill.
8.16 Comparison with other Recycled Aggregates
This paragraph presents a comparison of the results for Material A, B and C with the
results of the recycled materials research that has been mentioned in Section 2.8. Some
wording and analysis is repeated and this is done for ease of reading.
McKelvey et al (2002) investigated the behaviour of two types of recycled aggregates
under repeated load on a series of shear box tests and vertical stresses varying from 60
kPa to 300 kPa. The first type of material (named SI for this discussion) was crushed
concrete obtained from crushing concrete cubes. The second type of materials (named
S2) was crushed brickwork containing bricks (of at least 95%) and mortar.
Sivakumar et al (2004), also investigated the behaviour of two recycled materials,
similar to SI and S2, during large shear box tests named S3 and S4 for the purpose of
this discussion. S3 was crushed concrete obtained from crushing concrete cubes and S4
was crushed brickwork containing bricks (of at least 95%) and mortar. All materials
were sieved and had particles between 20 and 40 mm. The specific volumes of the
materials were 1.97 for SI and 2.04 for S2. The materials were sheared at a rate of 1.5
mm/min. All four materials were sieved and had particles between 20 and 40 mm. The
specific volumes of the materials were 1.97 for SI and 2.04 for S2, 2.08 for S3, 1.90 for
S4. The materials were sheared at a rate of 1.5 mm/min.
The shear rate used was about 10 times higher than the one utilised in this project,
which shows that the rate used in this investigation was quite low. This allowed this
135

research to determine more accurately the behaviour of the materials, since the failure
point was not missed and the rise in shear with axial strain was recorded in regular
points.
The friction angles, determined from a straight line from the origins to the value of
shear stress for 300 kPa, were and 39° for SI and 37° for S2 and 43° for both S3 an S4.
These values are significantly lower than the ones obtained for Material A, B and C at
317 kPa for all types of shear box. McKelvey et al (2002) and Sivakumar, et al (2004)
state that the particle crushing of the materials was high but do not give specific values.
The lower values of friction angles of SI, S2, S3 and S4 are most probably due to:
1. Their higher level of particle crushing and/or
2. The fact that Materials A, B and C have broader grading curves
Material SI and S2 (no data is presented for material S3 and S4) behave similarly
volumetrically with Material A, B and C since they exhibit dilatancy at low normal
stresses that reduces with increasing normal stress levels.
Aurstad et al (2005) have tested crushed concrete with particles ranging from 0-63 mm
(DG2) and from 20-63 mm (OG2) in a large triaxial apparatus (diameter 300 mm and
height 600 mm). Table 8.18 summarises the friction angle of Material A, B, C, DG2 and
OG2 together with the test characteristics.
Table 8.18: Comparison of Material A, B, C, DG2 and OG2
Material Particle size (mm) Density Friction
Type Max Min (Mg/m3) Angle, °
A 37.5 0 1.80 55
A 37.5 0 1.60 51
A 28 0 1.80 50
B 37.5 0 1.80 57
B 37.5 0 1.60 54
B 28 0 1.80 53
C 37.5 0 1.80 57
C 37.5 0 1.60 54
C 28 0 1.80 52
DG2 63 0 2.16 >48
OG2 63 20 1.82 >60
136

Table 8.18 shows that the values observed between DG2 and OG and the three materials
tested in this investigation are similar (the friction angles for OG2 are higher for all the
tests but lower for DG2). They conclude that materials with strength properties like the
ones exhibited by OG2 and DG2 “should perform excellently as unbound sub-base
layer in roads”. Even though larger in-situ testing is required, it appears that Material A,
B and C could be utilised in the construction of sub-base layers.
Aurstad et al (2005) have also observed that the crushing of particles is low for the
grading of the materials from 0-63mm, but quite significant for the materials when they
contain particles from 20-63 mm. Grading curves, for the materials with 0-63 mm
particle size range, of before and after shearing are presented in their paper and show
that they are almost similar, which shows that there is almost no particle crushing.
Taking into consideration the results of this investigation together with the results
presented by Aurstad et al (2005), McKelvey et al (2002) and Sivakumar et al (2004), it
appears that recycled materials with minimum particle sizes of 20 mm crush more than
the same type of materials containing finer particles. This may be a result of the
“ability” of broader gradation to fill more voids and restrict the movement of larger
particles and to provide better support. Further testing will be needed though to verify
this.
Rathje at al (2006) conducted comparative tests on crushed concrete and limestone in
respect to utilising them as backfill for mechanically stabilized earth walls. They
determined the permeability and friction angle of the materials. The friction angle of
both materials was 46° and the coefficient of permeability of the crushed concrete
varied from 1*10 3 m/s to 8.5*10‘5 m/s. The crushed limestone exhibited a coefficient of
permeability of 1*10‘2 m/s. They concluded that the friction angle of the crushed
concrete is acceptable for the specific backfill engineering applications but the
permeability is a concern. If the same specifications are applied to Material A, B and C
it is obvious that in regard to strength they are acceptable for backfill engineering. The
permeability of the materials needs further investigation though, since there was a
limited amount of tests performed.
Huurman and Molenaar (2006) have conducted a series of large scale triaxial tests on
materials containing 65% of crushed concrete and 35% of crushed masonry with
maximum particle size of 40 mm. They used six different gradations but kept the
137

maximum particle size the same. They found that the he friction angles of the materials
varied from 42° to 46°. The friction angles of Material A, B and C are higher than the
ones obtained by Huurman and Molenaar (2006). A complete comparison though can
not be done since information as the specimen density is not given.
The comparison of Material A, B and C with other investigations has shown that the
friction angles of all three materials appear to be higher apart from material OG2 tested
by Aurstad et al (2005). It is important to note though that in all the investigations there
are different parameters (such as the mixing of concrete and bricks and the crushing of
concrete in the laboratory) that affect the relevance of the comparison. It is very difficult
though to find two investigations that test the same type of recycled aggregates since
they are too variable and almost certainly are obtained from different sources. It is the
opinion of the authors that this remains the biggest problem into characterising the
properties and behaviour of demolition waste as a whole.
138

CHAPTER 9 CONCLUSIONS AND RE COMMENTATIONS
9.1 Introduction
In Section 1.2, the technical issues in need of investigation were stated, along with the
objectives of the project:
1. To provide a base for future research by investigating the physical and mechanical
characteristics of crushed recycled aggregates
2. Provide data on the strength of recycled aggregates so they can be utilised by the
industry.
3. Compare the properties of recycled materials with other research on recycled and
primary aggregates.
4. Compare the characteristics and performance of different types of recycled materials.
Extended experimental work was carried out to determine the physical and mechanical
characteristics of crushed demolition waste. It was necessary to test a large number of
samples to try and minimise the effects of material variability and large particle size.
This Chapter presents the main and secondary conclusions of this research.
9.2 Main Conclusions
Suitability for industrial applications: The shear strength of the recycled aggregates has
been compared with natural and other recycled aggregates and it has been shown that
they can be utilised by the industry for construction purposes since they are of
considerable strength. Adding to that, when the friction angles of materials A, B and C
and all shear box tests are plotted together with the limits of rockfill strength (after Leps,
1970), they are above the lower strength limits.
Similarity with natural aggregates: The behaviour of Material A, B and C exhibited a
number of similarities with natural aggregates:
1. The shear strength reduces with reducing specimen dry density.
2. The friction angle reduces with increasing normal stress.
3. The shear strength increases with axial strain and normal stress.
4. The shear-normal stress envelopes exhibit curvature at low normal stresses.
5. The materials exhibit dilatancy at low normal stresses that decreases with
increasing normal stress.
139

6. The friction angles and shear stress although a bit higher is of similar values
when compared with the specific natural aggregates given in Section 8.14.
Comparison between different types of recycled aggregates: This investigation tested
three different types of recycled aggregates to determine the differences between
concrete based, further processed (Material B) and not (Material A), and brick based
(Material C) materials. The main conclusion of this comparison are:
Physical Characteristics: Material A and B exhibit almost identical coefficients of
uniformity, water absorption and particle density values and dry density during the
compaction tests that is met at the same optimum moisture content. The only main
differences are their Flakiness and Elongation Indices, which as has been explained is
probably a result of the further processing. Material C on the other hand does not
exhibit any similar properties with the concrete based materials (with the exception of
the freezing thawing results).
Shear Behaviour: Material A and B exhibit numerous similarities as far as their
behaviour during shear box testing is concerned. The shear stress values at failure have
some small differences but taking into account their standard deviation and the almost
identical values of friction angles, then it can be concluded that their shear strength is
similar. The shear stress decreases more with dry density than with maximum particle
for both materials. The stress-strain and axial-volumetric strain relations also appear to
be similar enhancing the argument that the effect of further processing of crushed
concrete is minimal. Material C exhibit different results and behaviour to the concrete
based materials, something that was expected due to the difference in the nature of the
materials.
Concluding, it is apparent that the behaviour of similarly based recycled materials is
similar, despite the different degrees of processing, but this applies to the specific
materials tested in this investigation and generalising this for all demolition waste
aggregates would be unsafe before further research is undertaken.
9.3 Secondary Conclusions
Large Scale Testing Equipment: The large scale compaction mould and permeability
cell were designed to accommodate materials with particle sizes up to 50 mm. The
durability of the materials used and the design of both pieces of equipment have
allowed for performing numerous tests without the need of complicated procedures
140

and/or replacing of the large majority of parts used. It can be stated with confidence
therefore that the design of the equipment and the materials used for it, with maybe the
exception of replacing the mild with stainless steel for the compaction mould, are
acceptable for these types of large scale testing.
Result variability: The main conclusion drawn from all the tests is that despite the
possible effects of variability, non-homogeneous nature and large particle size the
results show great consistency and repeatability. The consistency of the results has also
been proved by the standard deviation values and graphs o f Appendices E, F and G.This
shows that the methods employed have minimised these effects.
Conclusions: This section presents the conclusions that do not fall in any of the other
categories of this chapter.
• Dry sieving is an acceptable method for determining the grading curves of the
materials.
• All materials' particle shape is classified as equi-dimensional with low angularity
but Material A are more flaky than B and C.
• All materials exhibit very good resistance to freezing and thawing
• The compaction tests have indicated that both concrete based materials behave
almost identically.
• The aggregate impact and crushing values tests are not considered by the authors as
a valid method for determining the strength of crushed concrete materials and/or
their particles because of the non-homogeneous nature of the materials.
• All materials exhibit crushing after shear box testing that reduces with maximum
particle size and dry density.
• The shear strength of the Materials A and B reduces more with reduced dry density
than maximum particle size, but the opposite occurs for Material C.
• The rate of reduction on shear stress with maximum particle size and dry density
depends and reduces with normal stress.
It has to be noted that these conclusions apply to the specific types of demolition waste
tested in this project and should not be generalised without further testing
141

9.4 Recommendations
The investigation conducted in this project has produced some interesting results on the
behaviour and characteristics of three demolition waste materials and should provide
valuable information for future research on the subject. Some of the aspects of the
investigation though require further examination:
1. More different types of concrete and brick based materials need to be tested to
establish if the results o f this investigation can be generalised.
2. It is important to investigate the composition of the materials at different size
fractions to determine how that affects properties o f the materials such as
aggregate impact and value tests and particle shape.
3. Further testing to confirm or refute the conclusions about the validity of the
aggregate crushing and impact value tests is recommended, since these tests are
used widely by the industry and it is important that valid results are produced.
4. More testing of the large scale permeability of the materials is required since the
number of tests performed in this investigation was restricted. Different
maximum particle and dry densities should also be investigated to provide
information on the effects of materials' properties on their permeability.
5. The shear box tests should be carried out at higher and lower normal stress
levels than the ones used in this project to determine the full effect o f normal
stress on the behaviour o f the materials.
6. At least another value of maximum particle size and dry density should be used
for testing, to determine if there are any relations between them and shear stress.
7. Investigation of the post peak behaviour of the materials is also suggested since
it can provide valuable information about the axial strain-stress and axial-
volumetric strain behaviour of the materials.
8. Particle crushing of the materials should be more analytically investigated, by
determining its values after compaction of the specimens and at different normal
stress levels.
9. It is highly recommended therefore to conduct tests for determining the particle
strength since it will enhance the analysis of the materials behaviour.
142

References
REFERENCES
Aurstad, J., Aksnes, J., Dahlhaug, J.E., Bemsten, G. and Uthus, N., 2005, “Unbound
Crushed Concrete in High Volume Roads - A Field and Laboratory Study”, 7th
International Conference on the Bearing Capacity of Roads, Railways and Airfields,
Trodheim, Norway
Barden, L., Ismail, H., and Tong, P., 1969, “Plain Strain Deformation of Granular Material
at Low and High Pressures”, Geotechnique, 19(4), 441-452
Becker, E., Chan, C.K. and Bolton Seed, H., “Strength and Deformation Characteristics of
Rockfill Materials in Plain Strain and Triaxial Compression Tests ”, Geotechnical
Engineering TE 72-3, University of California, Berkeley, U.S.A.
Bishop, A.W., 1966, “The Strength of Soils as Engineering Materials”, Geotechnique, 16
(2), 91-129
Bishop, A.W., and Henkel, D.J., 1962, “The Measurement of Soil Properties in the Triaxial
Test”, Edward Arnolds, London
Boutreux, T., Raphael, E. and de Gennes, P.G., 1997, “Propagation of a Pressure Step in a
Granular Material: The Role of Wall Friction”, Physical Revision, E 55, 5759 - 5773 Issue
5
Brampton, A., Wallis, M., and Holliday, E., 2004, “Potential Use of Alternatives to Primary
Aggregates in Coastal and River Engineering”, CIRLA, C590
British Standards Institution, “Code of practice for site investigations”, British Standard
5930, Milton Keynes, United Kingdom, 1999
143

References
British Standards Institution, “Methods of test for soils for civil engineering purposes-Part
2: Classification Tests”, British Standard 1377-2, Milton Keynes, United Kingdom, 1990
British Standards Institution, “Methods of test for soils for civil engineering purposes-Part
4: Compaction-Related Tests”, British Standard 1377-4, Milton Keynes, United Kingdom,
1990
British Standards Institution, “Methods of test for soils for civil engineering purposes-Part
5: Compressibility, Permeability and Durability Tests”, British Standard 1377-5, Milton
Keynes, United Kingdom, 1990
British Standards Institution, “Methods of test for soils for civil engineering purposes-Part
7: Shear Strength Tests (total stress), British Standard 1377-7, Milton Keynes, United
Kingdom, 1990
British Standards Institution, “Road aggregates - Part.l: Specification for single-sized
aggregate for general purposes”, British Standard 63-1:1987, Milton Keynes, United
Kingdom, 1987
British Standards Institution, “Specification for aggregates from natural sources for
concrete”, British Standard 882:1992, Milton Keynes, United Kingdom, 1992
British Standards Institution, “Testing aggregates. Method for determination of particle size
distribution. Sieve tests”, British Standard 812-103.1, Milton Keynes, United Kingdom,
1985
British Standards Institution, “Testing aggregates. Methods for determination of density”,
British Standard 812-2, Milton Keynes, United Kingdom, 1995
144
References
British Standards Institution, “Testing Aggregates: Guide to Sampling and Testing
Aggregates - Part 101”, British Standard 812-101, Milton Keynes, United Kingdom, 1984
British Standards Institution, “Testing Aggregates: Methods for Determination of
Aggregate Crushing Value (ACV) - Part 110”, British Standard 812-110, Milton Keynes,
United Kingdom, 1990
British Standards Institution, “Testing Aggregates: Methods for Determination of
Aggregate Impact Value (AIV) - Part 112”, British Standard 812-112, Milton Keynes,
United Kingdom, 1990
British Standards Institution, “Testing Aggregates: Methods for Determination of Moisture
Content - Part 109”, British Standard 812-109, Milton Keynes, United Kingdom, 1990
British Standards Institution, “Testing Aggregates: Methods for Determination of Particle
Shape - Section 105.1 Flakiness index”, British Standard 812-105.1, Milton Keynes,
United Kingdom, 1989
British Standards Institution, “Testing Aggregates: Methods for Determination of Particle
Shape - Section 105.2 Elongation index of coarse aggregate”, British Standard 812-105.2,
Milton Keynes, United Kingdom, 1990
British Standards Institution, “Testing Aggregates: Methods for Sampling - Part 102”,
British Standard 812-102, Milton Keanes, United Kingdom, 1989
British Standards Institution, “Tests for geometrical properties of aggregates. Determination
of particle shape. Flakiness index”, British Standard 933-3, Milton Keynes, United
Kingdom, 1997
145

References
British Standards Institution, “Tests for geometrical properties of aggregates. Determination
of particle size distribution. Sieving method”, British Standard 933-1, Milton Keynes,
United Kingdom, 1997
British Standards Institution, “Unbound and hydraulically bound mixtures”, British
Standard 13286-4, Milton Keynes, United Kingdom, 2003
Brown, A.J., 1988, “Use of Soft Rockfill at Evretou Dam, Cyprus”, Geotechnique, 38, 333-
354
Building Research Establishment, 1998, “Digest 433: Specifications for Recycled
Aggregates”, Watford, United Kingdom
Carga, V.K, and Madureira, C.J., 1985, “Compaction Characteristics of River Terrace
Gravel"” J. Geotech. Eng., Vol. I l l , 987-1007
Chang, C.S., Chang, Y., and Kabir, M.G., 1992, “Micromechanics Modeling for Stress
Strain Behaviour of Granular Soils. I: Theory”, J. Geotech. Eng., Vol. 118, No. 12, 1959-
1974
Charles, J.A., 1973, “Correlation between Laboratory Behaviour of Rockfill and Field
Performance with Particular Reference to Scammonden Dam ”, Ph.D Thesis, University of
London, London, UK
Charles, J.A., and Watts, K.S., 1980, “ The Influence of Confining Pressure on the Shear
Strength of Compacted Rockfill”, Geotechnique, 30(4), 353-367
Chen, L.S., 1948, “An Investigation of Stress-strain and Strength Characteristics of
Cohesionless Soil”, Proceedings of the Second International Conference on Soil Mechanics
and Foundation Engineering, Vol. 5, 35-43
146

References
Cho, G.C, Dodds, J. and Santamarina, J.C., 2006, “Particle Shape Effects on Packing
Density, Stiffness and Strength: Natural and Crushed Sands”, Journal of Geotechnical and
Geoenvironmental Engineering, Volume 132, Issue 5, 591-602
Chrismer, S.M., 1985, “Considerations of Factors Affecting Ballast Performance”, Bulletin
704 AREA - AAR Research and Test Department Report No. WP-110
Clemens, R.P., 1891, “The Deformation of Rockfill: Inter-particle Behaviour, Bulk
Properties and Behaviour in Dams”, PhD Thesis, Faculty of Engineering, King's College,
London University, London, UK
Dawson, A., 2001, Presentation on “The Utilisation of Recycled and Secondary Aggregates
in Road Construction: European and UK Developments”, Nottingham, United Kingdom
Department of the Environment, Transport & the Regions, 2000, “Waste Strategy 2000 for
England and Wales-Part 1”, DETR, London, May 2000
Department of the Environment, Transport & the Regions, 2000, “Waste Strategy 2000 for
England and Wales-Part 2”, DETR, London, May 2000
Department of the Environment, Transport & the Regions, 1994, “Guidelines for aggregates
provision in England”, DETR, London,, Minerals Planning Guidance MPG06
De Souza, R.J., 1958, “Compressibility of Quartz Sand at High Pressure”, M.Sc. Thesis,
Massachusetts Institute of Technology, Cambridge
Duncan, J.M., Witherspoon, P.A., Mitchell, J.K., Watkins, D.J., Hardcastle, J.H., and Chen,
J.C., 1972, “Seepage and Groundwater Effects Associated with Explosive Cratering”, Rep.
No. TE-72-2, University of California, Berkeley, California
147

References
Dunn, S., and Bora, P.K., 1972, “Shear Strength of Untreated Road Base Aggregates
Measured by Variable Lateral Pressure Triaxial Cell”, Journal of Mechanics, Vol. 7, 131-
142
Eerola, M., and Ylosjoki, M., 1970, “The Effect of particle Shape on the Friction Angle of
Coarse-grained Aggregates”, Proceedings of the 1st International Congress of the
International Association of Engineering Geology, Paris, France, Vol. 1, 445-456
El-Shohby, M., A., 1964, “The Behaviour of Particulate Materials under Stress”, PhD
Thesis, University of Manchester, Manchester, UK
European Standard, “Tests for Thermal and Weathering Properties of Aggregates - part 1:
Determination of Resistance to Freezing and Thawing”, European Standard EN 1367-1,
Brussels, Belgium, 1999
European Standard, “Tests for mechanical and physical properties of aggregates. Methods
for the determination of resistance to fragmentation”, European Standard EN 1097-2,
Brussels, Belgium, 1998
European Standard, “Tests for geometrical properties of aggregates. Determination of
particle shape. Flakiness index”, European Standard 933-3, Brussels, Belgium, 1997
Fannin, R.J., Eliadorani, A. and Wilkinson, J.M.T., 2005, “Shear Strength of Cohesionless
Soils at Low Stress ” Geotechnique 55, No.6, 267-478
Forth, J., P., Zoorob, S., E., and Thanaya, I., N., A., “Development of Bitumen-Bound
Waste Aggregate Building Blocks”, Construction Materials, 159, CMI, 23-32
Ghataora, G., S., Alobaidi, I., Faragher, E., Grant, S., 2006 “Use of Recycled Aggregates
for Cementitious Backfill”, Waste and Resource Management, 159, WRI, 23-28
148

References
Gur, Y., Shklarsky, E. and Livnech, M., 1978, “Effect of Coarse-fraction Flakiness on the
Strength of Graded Materials ” Proceedings of the Third Asian Regional Conference on
Soil Mechanics and Foundation Engineering, Haifa, Israel, Vol.l, 276-281
Hagerty, M.M., Hite, D.R., Ullrich, C.R., and Hagerty, D.J., 1993, “One-Dimensional High-
Pressure Compression of Granular Media”, J Geotech. Engineering, ASCE, 119(1)
Hardin, B.O., 1985, “Crushing of Soil Particles”, J. Geotech. Engineering, ASCE, 111(10),
1177-1192
Hazen, A., 1911, “Discussion of ‘Dams on Sand Foundations’, by A.C. Koenig”, Trans.,
ASCE, New York, N.Y., Volume 73
Hendron, A.J., 1963, “The Behavior of Sand in One-dimensional Compression, Ph.D
Dissertation, University of Illinois, U.S. A
Hill, A., 2001, “Environmental Assessment of Alternative Materials for Road
Construction”, Presentation Given on November 2001 at University of Nottingham
Hite, D.R., 1989, “High Pressure Consolidation Tests on Sand”, M.Engng. Thesis, Univ. of
Louisville, Louisville, U.S.A., 53-67
HM Treasury, 2004, “An Assessment of Options for Recycling Landfill Tax Revenue, Final
Report”, London, UK
Holestol, K., Kjaemsli, B. and Torblaa, I., 1965, “Compression of Tunnel Spoil at Venemo
Dam”, Proceedings of 6th International Conference of Soil Mechanics and Foundation
Engineering, Montreal, Canada
149

References
Holtz, W.G., and Gibbs, H.J., 1956, “Triaxial Shear Tests on Perviously Gravelly Soils”,
Journal of Soil Mechanics and Foundation Engineering Division, ASCE, Vol. 82, No. SMI,
Proceedings Paper 867, January, 1-22
Hoff, I. and Baklokk, L.J., 1998, “Materialegenskaper for Grus-ogpukkmaterialer ” SINTEF
Report STF22 A98459 (Delprosjektrapport KPG 18)
Hoff, I., Baklokk, L.J. and Aurstad, J., 2004, “Influence of Laboratory Compaction Method
on Unbound Granular Materials” Proceedings of 6th International Symposium on
Pavements Unbound !, Nottingham, UK
Houlsby, G.T. and Psomas, S., 2001, “Soil Conditioning for Pipejacking and Tunnelling:
Properties of Sand/Foam Mixtures”, Proc Underground Construction 2001 Int Exhibition
and Symp Oxford, UK, 128-138
Hurley, J.W., McGrath, C., Fletcher, .S.L. & Bowes, H.M., “Deconstruction and Reuse of
Construction Materials”, Building Research Establishment Ltd, 2001
Huurman, R. and Molenaar, A.A.A., 2006, “Permanent Deformation in Flexible Pavements
with Unbound Base Courses”, Transportation Research Board 2006 Annual Meeting CD-
ROM, Washington DC, U.S.A.
Indraratna, B., Wijewardena, L.S.S., and Balasubramaniam, A.S., 1993, “Large-Scale
Triaxial Testing of Greywacke Rockfill”, Geotechnique, 43, 37-51
Indraratna, B., Ionescu, D., and Christie, H., D., 1998, “Shear Behaviour of Railway Ballast
based on Large-Scale triaxial Tests”, Journal of Geotech. Eng., Vol. 124, 439-449
150

References
Klugar, K., 1975, “A contribution to Ballast Mechanics ”, Proceeding of Symposium of
Railroad Track Mechanics and Technology, Princeton University, New Jersey, U.S.A.,
Pergamon Press
Kirkpatrick, W.M., 1965, “Effects of Grain Size and Grading on the Shearing Behaviour of
Granular Materials”, Proceedings of the Sixth International Conference on Soil Mechanics
and Foundation Engineering, Montreal, Vol. 1, 273-276
Knight, J.B., Fandrich, C.G., Lau, C.N., Jaeger, H.M. and Nagel, S.R., 1995, “Density
Relaxation in a Vibrated Granular Material ”, Physical Review E, Volume 51, No. 5
Koemer, R.M., 1970, “Effects of Particle Characteristics on Soil Strength”, Journal of soil
Mechanics and Foundation Engineering Division, Vol. 96, Proceedings Paper 7393, 1221-
1234
Lade, P.V., Yamamuro, J.A., and Bopp, P.B., 1996, “Significance of Particle Crushing in
Granular Materials”, J. of Geotech. Eng., Vol. 122, 309-316
Lanaro, F., and Tolppanen, P., “3D Characterization of Coarse Aggregates,” Engineering
Geology, 65, 2002, pp. 17-30
Lee, K.L., and Farhoomand, I., 1967, “Compressibility and Crushing of Granular Soils in
Anisotropic Triaxial Compression”, Can. Geotech. J., 4(1), 68-86
Lee, Y.H., 1986, “ Strength and Deformation Characteristics of Rockfill”, PhD Thesis,
Asian Institute of Technology, Bangkok
Lees, G., “The measurement of Particle Shape and its Influence in Engineering Materials,”
Journal o f British Granite and Whinstore Federation, United Kingdom, 4, No. 2, 1964, pp.
17-38
151

References
Leps, T.M., 1970, “Review of Shearing Strength of Rockfill”, Journal of the Soil
Mechanics and Foundations Division, Proc. Of the American Society of Civil Engineers,
1159-1171
Leslie, D.D., 1963, “Large Scale Triaxial Tests on Gravelly Soils”, Proceedings of the
Second Pan American Conference on Soil Mechanics and Foundation Engineering, 181-202
Leslie, D.D., 1975, “Shear Strength of Rockfill”, Physical Properties Engineering Study No.
526, US Army Corps of Engineers, Sausalito, California, U.S. A
Levin, Y., Arenzon, J.J., and Sellitto, M., 2001, “Aging Dynamics and Density Relaxation
in Kinetic Lattice gases Under Gravity ”, Europhysics Letters, Volume 55, No. 6
Lumay, G., Ludewig, F. and Vendewalle, N., 2006, “Compaction of Granular Materials:
Experiments and Contact Dynamics Simulations ”, Journal of Physics Conference Series
40, 133-143
MacKenzie, P.R. and McDonald, L.A., 1985, “Mangrove Creek Dam - Use of Soft
Rockfill”, Proc. Symp. Concrete Face Rockfill Dams, Detroit, 208-230, New York: ASCE
Marachi, N.D., Chan, C.K., and Seed, H.B., 1972, “Evaluation of Properties of Rockfill
Materials”, Journal of Soil Mechanics and Foundation Engineering Division, ASCE, Vol.
98, Proceedings Paper 8672, 95-113
Marachi, N.D., Chan, C.K., Seed, H.B., and Duncan, J.M., 1969, “Strength and
Deformation Characteristics of Rockfill Materials”, Report TE-69-5, University of
California, Berkeley.
Marsal, R.J., 1967, “Large Scale Testing of Rockfill Materials”, Journal of the Mechanics
and Foundation Engineering Division, ASCE, Vol. 93, Paper 5, March, 27-43
152

References
Marsal, R.J., 1973, “Mechanical Properties of Rockfill”, Embankment Dam Engineering,
Casagrande Vol. Wileys, New York, 109-200
Marsal, RJ, 1976, “Mechanical Properties of Rockfill Soil Mixtures”, Douzieme Congres
Des Grands Barages, Mexico, 179-209
McDowell, G.R. and Bolton, M.D., 1998, “On the Micro Mechanics of Crushable
Aggregates”, Geotechnique 48, No. 5, 667-679
McKelvey, D., Sivakumar, V., Bell, A. and McLaverty, G., 2002, “Shear Strength of
Recycled Construction Materials Intended for Use in Vibro Ground Improvement”, Ground
Improvement, Vol. 6, No. 2, 59-68
Miura, N. and Yamanouchi, T. (1975). “Effect of Water on the Behavior of a Quartz-Rich
Sand under High Stressed.”, Soils and Foundations, Vol. 15, No. 4, 23-34.
Murphy, D.J., 1971, “High Pressure Experiments on Soil and Rocks”, Proceedings, 13th
Symposium of Rock Mechanics, 691-714
Nakata, Y, Hyde, A.F.L., Hyodo, M., and Murata, H., 1999, “A Probabilistic Approach to
Sand Particle Crushing in the Triaxial Test”, Geotechnique, 49(5), 567-583
Naylor, D.J., Maranha, J.R., Maranha das Neves, E., and Veiga Pinto, A., 1997, “ A Back
Analysis of Beliche Dam”, Geotechnique, 48(2), 221-233
Nowak, E.R., Knight, J.B., Ben-Naim, E., Jaeger, H.M., and Nagel, S.R., 1998, “Density
Fluctuations in Vibrated Granular Materials” Physical Review, Volume 57, No. 2
153

References
Office of the Deputy Prime Minister, 2004, “Survey of Arisings and Use of Construction,
Demolition and Excavation Waste as Aggregate in England in 2003”, HMSO, London
Office of the Deputy Prime Minister, 2002, “Strategic Planning for Sustainable Waste
Management: Guidance on Option Development and Appraisal”, HMSO, London
Peak, F. and Ford, R.W., 1984, “A Panel Freezing Test for Brickwork”, British Ceramics
Research Assosiation, Technical Note 358
Pestana, J.M., and Whittle, A.J., 1995, “Compression Model for Cohesionless Soils”,
Geotechnique, 45(4), 611-631
Pestana, J.M., and Whittle, A.J., 1998, “Time Effects in the Compression of Sands”,
Geotechnique, 48(5), 695-701
Pigeon, Y., 1969, “The Compressibility of Rockfill, PhD Thesis”, Imperial College of
Science and Technology, London, UK
Pike, D.C., 1973, “Shear-box Tests on Graded Aggregates”, Transport and Road Research
Laboratory, Department of the Environment, TRRL Report LR 584, Materials Division,
Highways Department, Crowthome, Berkshire, England
Rathje, E., Trejo, D., and Folliard, K., 2006, “Potential Use of Crushed Concrete and
Recycled Asphalt Pavement as Backfill for Mechanically Stabilizes Earth Walls”, Project
Summary Report 0-4177-S, Center for Transportation Research, The University of Texas at
Austin, U.S.A.
Richard, P., Nicodemi, M., Delannay, R., Ribiere, P. and Bideau, D., 2005, “Slow
Relaxation and Compaction of Granular Systems”, Nature Materials, Volume 4, No.2
154

References
Rico, A., Orozco, J.M., and Atzegui, T.T., 1977, “Crushed Stone Behaviour as Related to
Grading”, Proceedings of the Ninth International Conference on Soil Mechanics and
Foundation Engineering, Vol. 1, 263-265
Roberts, J.E., and De Souza, J.M., 1958, “The Compressibility of Sands”, Proc. Am. Soc.
Tes. Mater. 58,1269-1277
Roberts, J.E., 1964, “Sand Compression as a Factor in Oil Field Subsidence ”, Ph.D Thesis,
Massachusetts Institute of Technology, Cambridge, Massachusetts, U.S.A.
Roner, C.J., 1985, “Some Effects of Shape, Gradation and Size on the Performance of
Railroad Ballast”, M.S. Degree Project Report, Report No. AAR85-324P, Department of
Civil Engineering, University of Massachusetts, Amherst, June
Roscoe, K.H., Schofield, A.N., and Thurairajah, A., 1963, “An Evaluation of Test Data for
Selecting a Yield Criterion for Soils”, Laboratory Shear Testing of Soil, ASTM Special
Technical Publication 362, American Society for Testing and Materials, 111-128
Rosslein, D., 1941, “Steinbrecheruntersuchungen unter besonderer Berucksichtigung der
Komform” Forsch. a.d. Strassenwesen Band 32, Berlin, Germany. See also translation by
F.A. Shergold, Quarry Managers' Journal 30 (4),
Rothenburg, L., and Bathurst, R.J., 1989, “Analytical Study of Induced Anisotropy in
Idealized Granular Materials”, Geotechnique 39,No. 4, 601-614
Rothenburg, L., and Bathurst, R.J., 1992, “Micromechanical Features of Granular
Assemblies with Planar Elliptical Particles”, Geotechnique 42, N o.l, 79-95
Rowe, P.W., 1955, “A Stress Strain Theory for Cohesionless Soil with Applications to
Earth Pressures at Rest and Moving Walls”, Geotechnique, No.4, 70-88
155

References
Shultze, E. and Moussa, 1961, “Factors Affecting the Compressibility of Sand”, Proc. of
the Fifth International Conference on Soil Mechanics and Foundation Engineering, Paris,
France
Sivakumar, V., McKinley J. D. and Ferguson, D., 2004, “Reuse of construction waste:
performance under repeated loading”, Journal of Geotechnical Engineering, Proceedings of
the Institution of Civil Engineers, Vol 157, Issue GE2, pp91-96
Sowers, G.F., Williams, R.C., and Wallace, T.S., 1965, “Compressibility of Broken Rock
and Settlement of Rockfills”, Proc. 6th ICSMFE, Montreal, 2, 561-565
Sun, D.A, Matsuoaka, H., Muramatsu, D., Hara, T., Kudo, A., Yoshida, Z. and Takezawa,
S., 2004, “Deformation and Strength Characteristics of Weathered Soft Rock Using Triaxial
Tests” International Journal of Rock Mechanics and Mineral Science, Vol. 41, No.3
Thom, N.H., and Brown, S.F., 1988, “Effect of Grading and Density on the Mechanical
Properties of a Crushed Dolomitic Limestone”, 14th ARRB Conference, 7: 94-148
Thom, N.H., and Brown, S.F., 1989, “The Mechanical Properties of Unbound Aggregates
from Various Sources”, Unbound Aggregates in Roads, Jones and Dawson Editions,
Butterworth, London
Tombs, J.A., 1969, “Strength and Deformation Characteristics of Rockfil”, Ph.D Thesis,
University of London, London, UK
U.S Department of Transportation, 2000, “Recycled Materials in European Highway
Environments: Uses, Technologies, and Policies”, Research undertaken by Tumer-
Fairbank Highway Research Center, FHWA Publication Number: FHWA-PL-00-025
156

References
Vallerga, B.A., Seed, H.B., Monismith, C.L., and Cooper, R.S., 1957, “Effect of Shape,
Size and Surface Roughness of Aggregate Particles on the Strength of Granular Materials”,
ASTM STP212, 63-76
Varadarajan, A., Sharma, K.A., Venkatachalam, k., and Gupta, A.K., 2003, “Testing and
Modeling two Rockfill Materials”, Journal of Geotechnical and Geo environmental
Engineering, Vol 129, No. 3, 206-218
Vesic, A.S., and Clough, G.W., 1968, “Behavior of Granular Materials under High Stress”,
J. Soil Mech. and Found. Div., ASCE, 94(3), 661-688
Watson, J.P., 1989, “Highway Construction and Maintenance”, Longman Scientific &
Technical, John Wiley & Sons, New York
Wignall, A., Kendrick, P.S., Ancill, R., and Copson, M., 1999, “ Roadwork Theory &
Practice”, Butterworth Heinemann, 4th Edition
Waste & Resources Action Programme (WRAP), 2005, “Construction Update: Materials
Resource Efficiency in Construction”,
Yamamuro, J.A., and Lade, P.V., 1993, “Effects of Strain Rate on Instability of Granular
Soils”, Geotech. Testing J., 16(3), 304-313
Yamamuro, J.A., Bopp, P.A., and Lade, P.V., 1996, “One-Dimensional Compression of
Sands at High Pressures”, J. Geotech. Engng Div., ASCE, 122(2), 147-154
Zeller, J. and Wulliman, R., 1957, “The Shear Strength of the Shell Materials for the
Goschenenalp Dam (Switzerland)”, Proc. 4th International Conference on Soil Mechanic
and Foundation, Vol. 2,399-404, London, UK
157

References
Zingg, T., 1935, Beitrag zur Schotteranalyse”, Schweiz. Mineral. Petrog. Mitt., 15: 39-140
www.metsominerals.com
www.sanger.net
158

APPENDIX A
List of equipment used in the BS tests of this investigation
1. Laboratory test sieves, Endecotts Ltd
2. Mechanical sieve shaker, Pascall Engineering co Ltd
3. Scales, Precisa 30000D, with capacity of 30 kg and readable to 0.1 g and Precisa
300M, with capacity of 300 g and readable to 1 mg, both calibrated by Barry Platts,
precision Balance Engineer
4. Avery Birmingham, type 3205 CLE scale, 250 kg capacity scale, readable to 100 g.
Calibrated by Avery Berkel, maintenance and calibration
5. Ovens, by APEX Construction Ltd, type A140E and Gallenkamp, type 7B1810C,
both producing temperatures of 0-300 °C
6. For the ACV test the equipment used was a concrete tube crushing machine by
Avery-Denison Limited (i.d. 7226/D/T85248) with a capacity of 3000 kN and the
capability of following the procedures stated in BS 812-110:1990. It was calibrated by
the Denison Mayes Group
7. The equipment used for the BS compaction tests fell within the specifications stated
in the corresponding standard (BS 1377-4:1990). For the completion of the BS tests the
ELE International compaction equipment (product No. 24-9090/01) was used and fell
within the standard specifications.
8.The dimensions of the apertures of the sieves used for the establishment of the
flakiness and elongation ratios values were measured by the vernier calibre used for this
project and they were found to comply with the values set at BS 812-105.1:1989 and BS
812-105:2 1990 respectively.
1

APPENDIX B
Permeability Testing Procedure
1. The elastic seal is placed in the bottom plate groove (figure C.l)
Figure C.l: The seal in the groove of the bottom plate
2. The plastic cell is placed on the bottom cell and after the compaction top plate is in
position they are fixed together with the use of 8 steel bars, which seals the bottom plate
with the cell (figure C.2)
Figure C.2: The permeability cell with the top compaction plate
2

3. The permeable mat is placed at the bottom of the cell and on top of that a 3mm thick
steel mesh is positioned to protect it from the compaction forces
4. The materials are compacted in the cell in 6 layers
5. The copper tubes were restricted at the end to constrain the migration of fines (figure
C.3)
■ 7
Figure C.3: Restrained Copper pipe
6. After the 2nd layer of materials is compacted the lower level copper pipes were
inserted in the tube (figure C.4.a). They were water tightly fixed to the cell with
modified glances (figure C.4.b)
Figure C.4: The copper pipes placed in the cell after the compaction of the first layer (a)
and the water tight fixings of the pipes to the cell (b)
3

7. The compaction of the materials was continued for another two layers and then the
copper tube insertion procedure was repeated for the top level copper tubes. All the
copper tubes were replaced after every test.
*
Figure C.5: The compacted sample with the compaction plate removed (a) and the cell
with the top plate fixed in place (b)
8. After the compacted materials reached the top level of the tube the compaction plate
was carefully removed (C.5.a) and replaced with the top permeability test plate that had
a elastic seal in its groove (C.5.b). A permeable mat and a steel mesh, identical with the
ones positioned at the bottom of the cell, were placed between the materials and the top
plate
Figure C.6: The extra silicon seal
4

9. After the copper tubes, cell, top and bottom plates are fixed together, silicon is
applied to the contact points for further sealing (figure C.6)
Figure C.l: Connection of the copper pipes with manometer tubes
10. The copper tubes are water tightly connected with the manometer pipes (figure C.l),
which lead to a band of manometers (figure C.8), with restricting fixings. All the copper
tubes and manometers positions are numbered according to their position in the cell
Figure C.8: Band of Manometer tubes
5

11. The permeability testing arrangement also included a constant head tank with an
overflow and a supply tank fitted with a pump capable to supply the water to the
constant head tank and to circulate the water in the supply tank.
12. Once the assembly of the cell apparatus was completed the saturation process of the
materials started. Water was inserted to the cell from the bottom plate inlet valve (figure
C.9) and once water started coming out from the top valve (figure C.5.b) suction was
applied to the sample to speed the process.
Figure C.9: Bottom plate inlet/outlet
13. The saturation procedure lasted for four weeks for all three types of materials and
after this period there were no signs of air trapped in the sample. This was verified by
the fact that during the last week of saturation the application of continuous suction did
not yield any trapped air from the outlet pipes. It was impossible to provide de-aerated
water for the whole duration of the test, and therefore the water used was clean tap-
water which is acceptable according to the BS 1377-5:1990, paragraph 5.2.4.
14. The permeability cell is then connected to the constant head tank by the top plate
water inlet.
15. The flow (Volume/time) was measured from the water coming out from the bottom
plate outlet
16. The measurements and calculations of the permeability testing were done in
accordance to BS 1377-5:1990.
6

APPENDIX C
Shear Box Testing Procedure
This appendix describes the procedure followed in all the shear box tests. It includes
numbered references (Refl,Ref2 etc) to figure D.3. There are also some close up
photographs of some of the components of the shear box testing equipment arrangement
1. The shear box was removed from the shear box frame and placed on the floor for
compaction (figure D.l). The top and bottom halves were tightly secured together with
screws
Figure D.l: The shear box ready for compaction
2. The sample was compacted with the use of a Kango 900 K vibrating hammer in three
layers in order to avoid the coexistence of the shear plane and the layer interfaces figure
(D.2). The Kango hammer was fitted with a compaction plate and a rubber pad of 5
mm thickness was placed between the compaction plate and the materials to minimise
the risk of breakage of the materials' sharp edges
Ua. . /ft V■'Sf ■W -Figure D.2: The shear box with the sample (of material C) compacted
7

Figure D.3: The shear box frame
3. After the sample was compacted, the box was placed onto the shear box frame (figure
D.3).
4. The top plate was then placed onto the shear box (Ref 1), the screws removed and it
is connected to the horizontal loading jack by a steel frame (Ref 2)
5. The weights are then placed to the loading platform (Ref3) and the horizontal loading
jack (Ref 4) is then levelled by the use of a hydraulic pump system (Ref 5). The normal
stress is applied to the shear box via the steel frame (Ref 2) and the vertical loading jack
(Ref 6 and figure D.4).
Figure D.4: The vertical loading jack
8

6. A 50 kN load cell (Ref 7 and figure D.5.a) is connected to the to the horizontal
loading yoke (figure D.5.b) that connects to the top half of the shear box with the help
of a horizontal loading frame (Ref 8)
HgnzoiLoadin;*YQk#>;
»*
Figure D.5: The load cell (a) and the horizontal loading yoke (b)
7. All the frames and the yokes of the shear box apparatus were tied together with the
use of bolts (Ref 9)
8. The speed of movement of the horizontal yoke was then applied via a multi speed
gear box (Ref 10 and figure D.6)
Figure D.6: The control unit of the multi speed gear box
9. The horizontal and vertical transducers (Ref 11) were then fitted to the shear box with
the help of magnetic bases (Ref 12)
9

10. The measurements of the displacements and the load applied were recorded to the
computer with the help of those transducers and an analogue interface box (figure D.7)
D.7: The transducers and the interface box used for measuring the displacement and
load
11. The values of the horizontal and vertical displacements and the load applied were
zeroed in the computer logging system.
12. Finally the tests were initiated by the start/stop button (Ref 13) at the same time as
the logging process at the computer. All the measurements were recorded in the
computer system, which also produced a real time graph of the readings (figure D.8).
Runections with the logging equipment
Figure D.8: The computer logging system
10

APPENDIX D
Material A
♦ 37.5 mm
■ 28 mm
a 20 mm x 14 mm
+ 10 mm
• 6.3 mm
Shape categories for all the size fractions for Materials A (after Rosslein, 1941)
Materials A
0.66
♦■ V / ±Ax...... _.m
♦ 37 .5 mm
■ 28 mm
A 20 mm
X 1 4 mm
+ 1 0 mm
• 6 .3 mm
X Average
0.5P
Average values for all the size fractions for Materials A (after Rosslein, 1941)
11

Material B
0.66
q
o
+
# X 1L J1 jM?
sMSaSfife ♦ 37.5 mm‘ B28 mm
w S r *A 20 mm x 14 mm
* A + 1 0 mm • 6.3 mm
o 0.5
Shape categories for all the size fractions for and B (after Rosslein, 1941)
Materials B
0.66
♦
•
0.5P
♦ 37.5 mm
■ 28 mm
▲ 20 mm
X 14 mm
+ 1 0 mm
• 6.3 mm
X Average
Average values for all the size fractions for Materials B (after Rosslein, 1941)
1 2

Materials C
* v
■fc X & c
0.66
q
0 0.5 1
♦ 37.5rnm■ 28 mm
A 20 mmX 14 mm+ 10 mm
* 6.3 mm
P
Shape categories for all the size fractions for Materials C (by Rosslein, 1941)
Materials C
0.66
00 0.5 1
♦ 37.5 mm
■ 28 mm
A 20 mm
X 14 mm
+ 1 0 mm
• 6 .3 mm
X Average
Average values for all the size fractions for Materials B (after Rosslein, 1941)
13

Shea
r St
ress
, kPa
APPENDIX E
MATERIAL A
Shear S tr e ss ag a in st Horizontal D isp lacem ent, Material A, S B T 1 ,95 kPa
500
450
400
350
300
250
200
150
100
50
00 5 10 15 20 25 30
Horizontal Displacement, mm
Shear Stress against Horizontal Displacement, Material A, SBT1,143 kPa
Horizontal Displacement, mm
Shear Stress against Horizontal Displacement, Material A, SB T1,190 kPa
-T es t 1
-T es t 2
-T es t 3
-T e s t 4
-T e s t 5
-T e s t 6
-T e s t 7
“ Test 8
-T e s t 9
-T e s t 10
£ 250
0 5 1510 20 25 30
-T est 1
-T est 2
-T est 3
-T est 4
-T est 5
-T est 6
-T est 7
-T es t 8
-T est 9
2 250
0 5 10 15 20 25 30
-T est 1 -T est 2 -T est 3 -T est 4 -T est 5 -Series7 -SeriesS
Horizontal Displacement, mm
14

Shea
r S
tres
s, k
Pa
S h ear S tress against Horizontal D isp lacem ent, M ateria l A, S B T 1, 238 kPa
Horizontal D isplacem ent, mm
S h e a r S tr e s s a g a in s t H orizonta l D isp la c em e n t, M aterial A, SB T 1, 317 kPa
500
450
400
350
300
i 250
200
150
10050
05 10 150 20 25 30
— Test 1 T est 2
— Test 3 “ T est 4
S h e a r S t r e s s a g a in s t H orizon ta l D isp la c e m e n t , M ateria l A, S B T 2 , 9 5 kPa
500
450
400
350
300
250
200
150
10050
05 150 10 20 25 30
— Test 1 ’
Test 2 — Test 3
; 1" Test 4
— Test 5
Horizontal Displacement, mm
15

S h ear Stress against Horizontal D isp lacem en t, M ateria l A, S B T 2 ,143 kPa
500
450
400
350
300
250
200
150
100
50
00 5 10 15 20 25 30
Horizontal D isplacem ent, mm
S h e a r S tr e s s a g a in s t Horizonta l D isp la c em e n t, M aterial A, S B T 2 ,190 kPa
500
450
400
350
300
2 250
200
150
10050
00 5 10 15 20 25 30
H orizontal D isp lacem ent, mm
S h e a r S tr e s s a g a in s t H orizonta l D isp la c e m e n t , M aterial A, S B T 2, 2 3 8 kPa
450
350
2. 300
250
150
0 5 10 15 20 25 30
Horizontal Displacement, mm
16

S hear Stress against Horizontal D isplacem ent, M aterial A, SBT2, 317 kPa
500
450
400
350
300
250
200
150
10050
05 150 10 20 25 30
Horizontal Displacement, mm
S h e a r S t r e s s a g a in s t H orizon ta l D is p la c e m e n t , M ateria l A, S B T 3 , 95 kPa
500
450
400
350
300
250
200
150
10050
05 150 10 20 25 30
Horizontal D isplacem ent, mm
S h e a r S tr e s s a g a in s t H orizonta l D isp la c e m e n t , M aterial A, S B T 3, 143 kPa
500
a.
150
150 5 10 20 25 30
Horizontal Displacement, mm
17

She
ar
Str
ess,
kP
a
S hear Stress against Horizontal D isplacem ent, M aterial A, S B T 3 ,190 kPa
500
450
400
350
300
250
200
150
10050
0155 10 20 250 30
-Test 1 ; -Test 2 -Test 3
Horizontal Displacement, r
S h e a r S tr e s s a g a in st H orizontal D isp lacem ent, Material A, SBT3, 238 kPa
500
450
400
350
300
250
200
150
100
50
0 10 15 200 5 25 30Horizontal D isplacem ent, mm
— Test 1 Test 2 Test 3
Shear Stress against Horizontal Displacement, Material A, SBT3, 317 kPa
500
450
400
350
300
250
200
150
100
50
010 150 5 20 25 30
Horizontal Displacement, mm
“ Test 1 “ ■'“ Test 2 — Test 3 j
18

Shea
r St
ress
, kP
a sh
ear
stre
ss,
kPa
MATERIAL B
S hear S tress against Horizontal D isp lacem ent, Material B , S B T 1 ,9 5 kPa
500
450
400
350
300
250
200
150
10050
0 5 10 150 20 25 30
Horizontal Displacement, mm
Shear S tress against Horizontal D isplacem ent, Material B, S B T 1,143 kPa
450
350
0 5 1510 20 25 30
— es t 1
— es t 2
— es t 3
— e s t 4
— e st 5
Horizontal Displacement, mm
Shear S tress against Horizontal D isp lacem ent, Material B, SB T 1,190 kPa
500
250
150 20 255 10 30H orizontal D isp lacem en t, m m
19

She
ar
Str
ess,
kP
a
S h e a r S tress against H orizonta l D isp lacem en t, M ateria l B, S B T 1, 238 kPa
500
450
400
350
300
250
200
150
100
50
05 150 10 20 25 30
-Test 2
-Test 3
-Test 4
-Test 5
Horizontal D isplacem ent, mm
S h e a r S t r e s s a g a in s t H orizonta l D isp la c e m e n t , M ateria l B, S B T 1, 3 17 kPa
500
450
400
350
300
250
200
150
10050
05 10 15 200 25 30
Horizontal Displacement, mm
S h ea r S tr e s s a g a in st H orizonta l D isp la c em e n t, M aterial B, SB T 2, 95 kPa
500
450
400
350
300
250
200
150
10050
0150 5 10 20 25 30
•Test 1
-Test 2 j
-T est 3
Horizontal Displacement, mm
2 0

Shea
r S
tres
s, k
Pa
Shea
r S
tres
s, k
Pa
Shea
r S
tres
s, k
Pa
S h e a r S tress ag a in s t H orizonta l D isp lacem en t, M ateria l B, S B T 2 , 143 kPa
500
450
400
350
300
250
200
150
10050
010 150 5 20 25 30
Horizontal D isp lacem ent, mm
S h e a r S t r e s s a g a in s t H orizonta l D isp la c em e n t, M aterial B, S B T 2 ,190 kPa
Horizontal Displacement, mm
S h e a r S tr e s s a g a in s t H orizonta l D isp la c em e n t, M aterial B, S B T 2, 2 3 8 kPa
“ Test 1
“ Test 2
“ Test 3
“ Test 4
“ Test 5
500
*50
*00
350
300
250
200
150
10050
00 5 1510 20 25 30
500
450
400
350
300
250
200
150
10050
00 155 10 20 25 30
Horizontal Displacement, mm
21

She
ar
Str
ess,
kPa
Sh
ear
Str
ess,
kPa
Sh
ear
Str
ess,
kP
a
S h e a r S tress a g a in s t H o rizo n ta l D is p la c e m e n t, M ate ria l B, S B T 2 , 317 kPa
500
450
400
350
300
250
200
150
100
50
0155 10 200 25 30
H orizontal D isp lacem ent, mm
S h e a r S tr e s s a g a in s t H orizonta l D isp la c em e n t , M aterial B, S B T 3, 9 5 kPa
500
450
400
350
300
250
150
10050
00 5 15 2010 25 30Horizontal Displacement, mm
S h e a r S t r e s s a g a in s t H orizon ta l D isp la c e m e n t , M ateria l B, S B T 3 ,1 43 kPa
500
150
400
350
300
250
200
150
10050
05 15 200 10 25 30
Horizontal Displacement, mm
22

Shea
r S
tres
s, k
Pa
shea
r St
ress
kP
a
S h e a r S tre s s a g a in s t H o rizo n ta l D is p la c e m e n t, M ate ria l B, S B T 3 ,190 kPa
500
450
400
350
300
250
200
150
10050
050 1510 20 25 30
Horizontal D isp lacem ent, mm
S h e a r S t r e s s a g a in s t H orizonta l D isp la c e m e n t , M aterial B, S B T 3, 2 3 8 kPa
200
150 5 10 20 25 30
r~
Horizontal D isp lacem ent, mm
S h e a r S t r e s s a g a in s t H orizon ta l D isp la c e m e n t , M ateria l B, S B T 3 , 3 1 7 kPa
150
150 5 10 20 25 30
•Test 1
•Test 2!
Horizontal Displacement, mm
23

Shea
r St
ress
, kP
a
MATERIAL C
S hear Stress against H orizontal D isplacem ent, M ateria l C, S B T1, 95 kPa
500
450
400
350
300
250
200
150
100
50
015 200 5 10 25 30
"T est 1 : •T est 2 -T est 3 -T est 4 -T est 5
Horizontal Displacement, mm
Shear S tr e s s a g a in st Horizontal D isp lacem ent, Material C, S B T 1 ,143 kPa
500
450
400
350
300
250
200
150
100
50
0150 5 10 20 25 30
-T es t 1 ; -T es t 2 j -T e s t 3 ; -T e s t 4 I -T e s t 5 ;
Horizontal D isplacem ent, r
S hear S tr e ss a g a in st Horizontal D isp lacem ent, Material C, S B T 1 ,190 kPa
500
450
400
350
300
250
200
150
100
50
00 5 10 15 20 25 30
-T es t 1
-T es t 2
-T e s t 3
Horizontal Displacement, r
24

Shea
r S
tres
s, k
Pa
shea
r st
ress
, kP
a
S h e a r S tress a g a in s t H o rizo n ta l D is p la c e m e n t, M ate ria l C, S B T 1 , 238 kPa
2 250
0 15 205 10 25 30
-Test 1
-Test 2
-T est 3
Horizontal Displacement, mm
S h e a r S tr e s s a g a in s t H orizonta l D isp la c e m e n t , M ateria l C, S B T 1, 3 17 kPa
300
150 5 10 20 25 30
-T est 1
-T est 2
-T est 3
Horizontal Displacement, mm
S h e a r S tr e s s a g a in s t H orizon ta l D isp la c e m e n t , M ateria l C, S B T 2 , 9 5 kPa
400
250
200
150
0 5 10 15 20 25 30
-T est 1 -T est 2 -T est 3 -T est 4 -T est 5
Horizontal Displacement, mm
25

Shea
r S
tres
s, k
Pa
S h e a r S tre s s a g a in s t H o rizo n ta l D is p la c e m e n t, M ateria l C, S B T 2 , 143 kPa
£ 250
10 150 5 20 25 30
•Test 1 -Test 2 -Test 3 -T est 4
Horizontal Displacement, mm
S h e a r S tr e s s a g a in s t H orizonta l D isp la c em e n t, M aterial C, SB T 2, 190 kPa
500
450
400
350
300
250
200
150
10050
05 100 15 20 25 30
-T est 1 -T est 2 -T est 3 -T est 4 -T est 4
Horizontal Displacement, mm
S h e a r S t r e s s a g a in s t H orizon ta l D isp la c e m e n t , M ateria l C, S B T 2 , 2 3 8 kPa
500
450
200
1550 10 20 25 30
-T est 1 -T est 2 -T est 3 -T est 4 -T est 5
Horizontal Displacement, mm
26

S h e a r S tress a g a in s t H o rizo n ta l D is p la c e m e n t, M ate ria l C, S B T 2 , 3 17 kPa
500
450
400
350
250
200
150
10050
05 20 250 10 15 30 35
■Test 1
-Test 2
■Test 3
Horizontal Displacement, mm
S h e a r S tr e s s a g a in s t H orizonta l D isp la c e m e n t , M aterial C, S B T 3, 9 5 kPa
350
250
100
155 100 20 25 30
■Test 1
•T est 2
Horizontal Displacement, mm
S h e a r S t r e s s a g a in s t H orizonta l D isp la c e m e n t , M aterial C, S B T 3 ,1 4 3 kPa
sII
150 5 10 20 25 30
■Test 1
■Test 2
•T est 3
Horizontal Displacement, mm
27

Shea
r St
ress
, kP
a
S h ear S tress against H orizontal D isp lacem ent, M ateria l C , S B T 3 ,190 kPa
500
450
400
350
300
250
200
150
100
50
00 5 10 15 20 25 30Horizontal Displacement, mm
S h e a r S tr e s s a g a in s t Horizonta l D isp la c em e n t, Material C, SB T 3, 23 8 kPa
500
450
400
350
300
250
200
150
100
50
05 150 10 20 25 30
Horizontal Displacement, mm
S h e a r S tr e s s a g a in s t H orizonta l D isp la c e m e n t , M ateria l C, S B T 3, 3 17 kPa
500
450
400
350
300
250
200
150
100
50
05 150 10 20 25 30
Horizontal Displacement, mm
28

Volum
etric
Strai
n,cv
(%)
Volum
etric
Stra
in.tv
(%)
APPENDIX F
MATERIAL A
V olum e Behaviour, Material A, S B T 1 ,9 5 kPa
4
3.5
3
2.5
21.5
10.5
0■0.5
•1
Axial Strain,ca (%)
Volume Behaviour, Material A, SB T1,143 kPa
4
3.5
3
2.5
21.5
10.5
0-0.5
•1Axial Strain.ca (%)
Volume Behaviour, Material A, SBT1,190 kPa
4
3.5
3
2.5
21.5
10 5
0•0.5
•1
Axial Strain,ta (*/•)
29

Volum
etric
Stral
n.cv
{%)
Volum
etric
Strai
n,cv
(%)
Volum
etric
Strai
n,cv
(%)
V olum e Behaviour, Material A, S B T 1 ,238 kPa
4
3.5
3
2.5
21.5
10.5
0-0.5
■1Axial Strain̂ a (%)
Volume Behaviour, Material A, SBT1,317 kPa
4
3.5
3
2.5
2
10.5
0
-1Axial Strain,ca (•/•)
Test 1 Test 2 Test 3 Test 4
Volume Behaviour, Material A, SBT2,95 kPa
4
3.5
3
2.5
21.5
10.5
0-0.5
.1Axial Strain,ca (•/•)
30

Volu
met
ric
Stra
in,cv
(%
) Vo
lumet
ric
Stra
in,cv
(%
) Vo
lum
etric
St
rain,c
v (*/.
)
V olum e B ehaviour, Material A, S B T 2 ,14 3 kPa
2.5
T est 2 i Test 3 !
Axial Strain.ca (*/>)
Volume Behaviour, Material A, S B T 2 ,190 kPa
Test 1 Test 2 Test 3 Test 4 TestS
1.5
Axial Strain,ca (%)
Volume Behaviour, Material A, SBT2, 238 kPa
4
3.5
3
2.5
21.5
j T est 4 I T est 5 I1
0.5
0-0.5
•1Axial S train ,ca (%}
31

Volu
met
ric
Stra
in,tv
(%
) Vo
lum
etric
St
rain
,tv
(*/.)
Volum e Behaviour, Material A, S B T 2 ,238 kPa
4
3.5
3
2.5
2f------ Test 1 jI-------Test 2 i1.5
10.5
0-0.5
•1Axiat Strain,ca (%)
Volume Behaviour, Material A, SBT3, 95 kPa
Test 1 Test 2
0.5
Axial Strain,ta (%)
Volum e Behaviour, Material A, S B T 3 ,143 kPa
3.5
2.5
0.5
-0.5
Axial S tra in ,ca (•/.)
32

Volu
met
ric
Stra
in,cv
{•/.
) Vo
lum
etric
Stra
in,£V
(V
.)
Volum e B ehaviour, Material A, S B T 3 ,190 kPa
4
3 5
3
2.5
21.5
10 5
0-0.5
•1Axial Strain̂ a ('/.)
Volume Behaviour, Material A, SBT3, 238 kPa
3.5
2 .5
1.5
0.5
-0.5
Axial Strain,ca (%)
Volume Behaviour, Material A, SBT3, 317 kPa
3.5
2.5
0.5
-0.5
Axial S tra in ,ca (•/•)
33

Volum
etric
Strai
n.ev
(%)
Volum
etric
Strai
n,cv
{%)
Volum
etric
Strai
n,cv
(%)
MATERIAL B
Volum e Behaviour, Material B, S B T 1 ,95 kPa
4
3.5
3
2.5
2t.5
0.5
0-0.5
-1Axial Strain,ca {%}
Volume Behaviour, Material B, SB T1,143 kPa
4
3.5
3
2.5
21.5
10.5
0>0.5
.1
Axial Strain,ca ('/»)
Volume Behaviour, Material B, SB T 1,190 kPa
2.5
1.5
-0.5
34

Volu
met
ric
Stra
in,cv
(%
) Vo
lum
etric
St
rain,c
v (•/.
) Vo
lum
etric
St
rain,c
v (•/
•)
V olu m e B eh av iou r, M aterial B, SB T 1, 2 3 8 kPa
3.5
2.5
0.5
Axial Strain,ca (•/•)
Volume Behaviour, Material B, SBT1, 317 kPa
4
3.5
3
2.5
21.5
0.5
0-0.5
•1Axial Strain,ca ('/•)
Volume Behaviour, Material B, SBT2, 95 kPa
3.5
2.5
-0.5
Axial S tra in ,ca ('/•)
35

V o lu m e B eh av iou r, M aterial B , S B T 2 ,1 4 3 kPa
3.5
2.5
>c
•e
E3O>
0.5
-0.5
Axial S tra n ,c a (%)
-T e s t 1
-T e s t 2
- T e s t 3
-T e s t 4
- T e s t 5
Volume Behaviour, Material B, S B T 2 ,190 kPa
2.5
>e
40o•c
i35
Axial S train,ca (%)
-T e s t 1
-T e s t 2
-T e s t 3
-T e s t 4
-T e s t5
Volum e Behaviour, Material B, SBT2, 238 kPa
3.5
>c
i3O>
0.5
-0.5
Axial S tra in ,ta (*/.)
-T e s t 1
- T e s t 2
-T e s t 3
-T e s t 4
-T e s t 5
36

Vol
umet
ric
Stra
in.tv
<%
1 V
olum
etri
c St
rain
,tv
(V.)
Vol
umet
ric
Stra
in,tv
(V
.)
V olum e B ehaviour, Material B, S B T 2 ,317 kPa
2.5
Axial S t r a in ^ (*/•)
-T es t 1 j
-T e s t 2 !
-T e s t 3
Volume Behaviour, Material B, SBT3, 95 kPa
3.5
2.5
0.5
-0.5
Axial S tra in ,ta (%)
-T e s t 1 -T e s t 2 -T e s t 3
Volume Behaviour, Material B, S B T 3 ,143 kPa
3.5
Axial S tra in ,ta ('/,)
-T e s t 1
-T e s t 2 -T e s t 3
37

Volu
met
ric
Stra
in,tv
(•/
.) Vo
lum
etric
St
rain
,tv
(•/.)
Volu
met
ric S
train,
«v
(%)
V olu m e B eh av iou r, M aterial B , S B T 3 ,1 90 kPa
4
3.5
3
2.5
21.5
10.5
0-0.5
•1
Axial Strain ,ta ('/•)
Volum e Behaviour, Material B, SBT3, 238 kPa
3.5
2.5
— T est 1
T es t 2
0.5
-0.5
Axial Strain,ca (*/•)
Volum e Behaviour, Material B, SBT3, 317 kPa
2.5
0.5
-0.5
Axial S tra in ^ a (•/.)
38

Vol
umet
ric
Stra
in,c
v (%
) V
olum
etri
c St
rain
,cv
(%)
Vol
umet
ric
Stra
in,c
v (%
)
MATERIAL CV olu m e B ehaviour, M aterial C, SBT 1, 95 kPa
4
3.5
3
2.5
21.5
10.5
0■0.5
■1Axial S train ,ca (*/•)
Volume Behaviour, Material C, S B T 1 ,143 kPa
4
3.5
3
2.5
T es t 12■Test 2
1.5
1 •Test 4
T est 50.5
0-0.5
Axial S train ,ca (*A)
Volume Behaviour, Material C, S B T 1,190 kPa
0.5
Axial S train ,ca (•/•)
39

Vol
umet
ric
Stra
in,tv
(V
.) V
olum
etri
c St
rain
,tv
(%)
Vol
umet
ric
Stra
in,tv
(V
.)
V olu m e B eh aviou r, M aterial C, S B T 1 ,2 3 8 kPa
2.5
T est 2
T est 3
■Test 4
•Test 50.5
Axial S tra in ,ta (•/.)
Volume Behaviour, Material C, SBT1, 317 kPa
4
3.5
3
2.5
21.5
10.5
0-0.5
■1Axial S train , ta (•/•)
Volume Behaviour, Material C, S B T 2,95 kPa
3.5
2.5
1.5
0.5
-0.5
Axial S tra in ,ca (%)
40

Vol
umet
ric
Stra
in,c
v (%
) V
olum
etri
c St
rain
,cv
{%)
Vol
umet
ric
Stra
in,c
v (%
)
V olum e B ehaviour, M aterial C, S B T 2 ,1 4 3 kPa
4
3.5
3
2.5
2
1.5
10.5
0-0.5
■1
Axial S tra in ,ca ('/•)
Volume Behaviour, Material C, S B T 2,190 kPa
4
3.5
3
2.5
2
1.5
10.5
0-0.5
•1
Axial S tra in ,ca (*/»)
-T e s t 1
-T e s t 2
- T e s t3
-T e s t 4
-T e s t 5
Volume Behaviour, Material C, SB T 2,238 kPa
4
3.5
3
2.5
2
1.5
10.5
0•0.5
•1Axial S tra in ,ca (*/■)
41

Vol
umet
ric
Stra
in.c
v (%
)
V o lu m e B eh a v io u r, M aterial C, S B T 2 ,3 1 7 kPa
3.5
2 .5
-0.5
Axial S tra in .ca (%)
Volume Behaviour, Material C, SBT3, 95 kPa
4
3.5
3
2.5
2
1.5
10.5
0•0.5
Axial S train.ca (%)
Volume Behaviour, Material C, SB T 3,143 kPa
4
3.5
3
2.5
2
1.5
1
0.5
0•0.5
Axial S train ,ca (%)
42

Vol
umet
ric
Stra
in.c
v (%
)
V olum e B ehaviour, Material C, S B T 3 ,1 90 kPa
2.5
>c
V)o•c
E3
I0.5
Axial S train,ca (•/.)
Volume Behaviour, Material C, SBT3, 238 kPa
4
3.5
3
2.5
2
1.5
1
0.5
0•0.5
■1
Axial S train.ca (*/•)
Volum e Behaviour, Material C, SBT3, 317 kPa
3.5
2.5
1.5
Axial S tra n .c a (%)
43

r u u iiu a u u iib
Publications
I Chidiroglou, A K Goodwin, P S Mangat & E A Laycock, Properties o f Crushed Concrete
and Bricks to be used for Geotechnical Applications, Eighth Young Geotechnical
Engineering Symposium, Geotechnics Across Boundaries, 23 - 25 June 2004, Birmingham
I Chidiroglou, A K Goodwin, P S Mangat & E A Laycock, Shear Behaviour o f Crushed
Concrete and Bricks,Sustainable Waste Management and Recycling: Challenges and
Opportunities, International Conference, 14-15 September 2004, Kingston, UK
I Chidiroglou, A K Goodwin & E A Laycock, Particle Shape of Crushed Concrete,
Concrete International, Vol. 28 No 8, pp 50-55, August 2006
I Chidiroglou, A K Goodwin, E, Laycock & F, O’Flaherty, Physical Properties of
Demolition Waste Material, Institution of Civil Engineers Construction Materials Journal,
Paper accepted for publication