characterisation of catalysts at their working · pdf file ·...
TRANSCRIPT

1
Magnus Rønning, Summer School NTNU 2009
Characterisation of catalysts at their working conditions
Magnus RønningDepartment of Chemical Engineering
NTNU

2
Magnus Rønning, Summer School NTNU 2009
Outline
•
Why study catalysts in situ•
Choice of in situ techniques
•
Combining techniques•
Some in situ techniques:
–
Infrared spectroscopy–
Raman spectroscopy–
X-ray diffraction–
X-ray absorption spectroscopy
•
Examples

3
Magnus Rønning, Summer School NTNU 2009
Catalyst characterisation methods (not a complete list)
PhD course at Department of Chemical Engineering, NTNU:Characterisation of heterogeneous catalysts-Emphasis on in situ techniques
•
Temperature programmed techniques (TPX)•
X-ray diffraction (XRD)•
X-ray absorption (EXAFS)•
X-ray scattering (SAXS, WAXS)•
Vibrational spectroscopies (FTIR, EELS, Raman, UV-vis) •
Scanning probe microscopy (SPM)•
XPS and Auger spectroscopy (AES)•
Measurements of surface acidity•
Dispersion measurements (chemisorption) •
Electron microscopy/tomography (TEM/SEM) •
Nuclear Magnetic Resonance (NMR)•
Tapered element oscillating Microbalance (TEOM)•
Transient kinetic analysis (SSITKA)•
Thermal analysis (TGA-DSC)•
Mössbauer spectroscopy•
Ion spectroscopies (SIMS, RBS)
4
Magnus Rønning, Summer School NTNU 2009
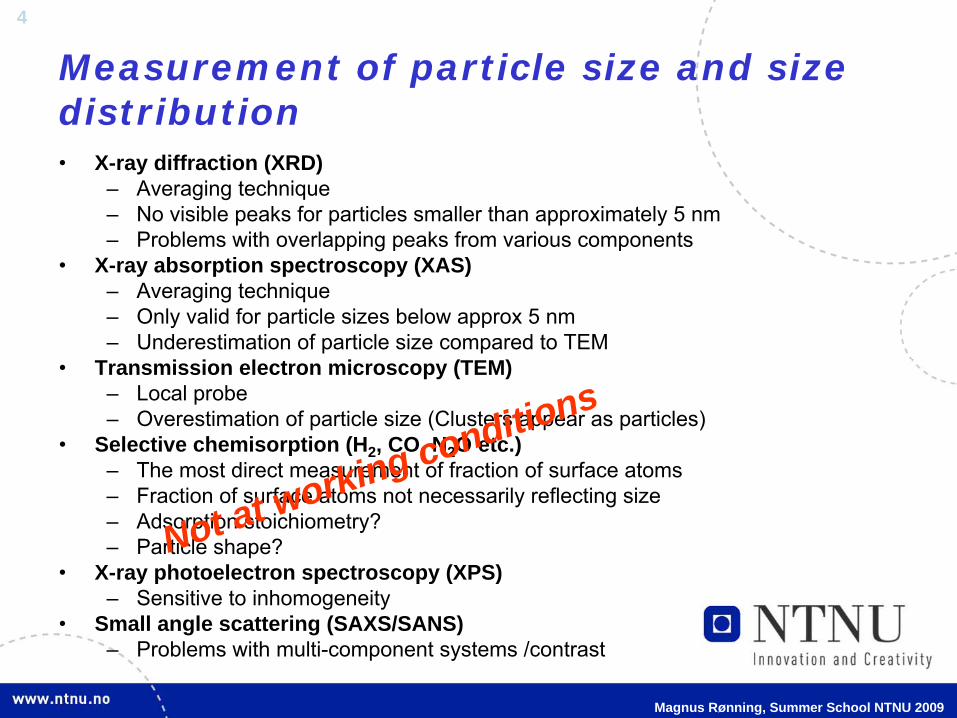
Measurement of particle size and size distribution•
X-ray diffraction (XRD)–
Averaging technique–
No visible peaks for particles smaller than approximately 5 nm–
Problems with overlapping peaks from various components•
X-ray absorption spectroscopy (XAS)–
Averaging technique–
Only valid for particle sizes below approx 5 nm–
Underestimation of particle size compared to TEM •
Transmission electron microscopy (TEM)–
Local probe–
Overestimation of particle size (Clusters appear as particles)•
Selective chemisorption (H2 , CO, N2 O etc.)–
The most direct measurement of fraction of surface atoms–
Fraction of surface atoms not necessarily reflecting size–
Adsorption stoichiometry?–
Particle shape?•
X-ray photoelectron spectroscopy (XPS)–
Sensitive to inhomogeneity•
Small angle scattering (SAXS/SANS)–
Problems with multi-component systems /contrast
Not at working conditions

5
Magnus Rønning, Summer School NTNU 2009
Small is better ?
Figures from Richardson, J. T. Richardson, "Principles of Catalyst Development," Plenum Press, NewYork NY, 1989, and E. McCash, “Surface Chemistry” Oxford Univ. Press 2001
•
Small particles expose a large fraction of the surface as edge and corner atoms•
Catalytic activity is often attributed to atoms with deficient coordination

6
Magnus Rønning, Summer School NTNU 2009
The catalytic activity of gold particles is highly dependent on particle size…
Are the Au corner atoms the active sites for CO oxidation?
N. Lopez, J. Nørskov et.al, Journal of Catalysis, 223 (2004) 232

7
Magnus Rønning, Summer School NTNU 2009
Coordination number7 8 9 10 11 12
Rea
ctio
n ra
te [
mol
/gca
t*s]
2,0
2,5
3,0
3,5
4,0
4,5
5,0
5wt%AuTiO2CNF
3wt%AuTiO2CNF
1.5wt%AuTiO2CNF
1.5wt%AuTiO2
5wt%AuTiO2
Sample Au dispersion [%] TOF [s-1] at 310oCAuTiO2 -Col 11.0 0.2AuTiO2 -DP 11.7 1.6
Deposition-precipitation gives a much more active catalyst for the water-gas shift reaction than colloid deposition (for comparable Au particle sizes)
…but certainly not on size alone
Au C.N. = 8
N. Hammer, I. Kvande, X. Xu, V. Gunnarsson, B. Tødal, D. Chen, M. Rønning; Catalysis Today 123 (2007) 245
N. Hammer, I. Kvande, W. van Beek, D. Chen, M. Rønning, Topics in Catalysis 45 (2007) 25

8
Magnus Rønning, Summer School NTNU 2009
Choice of technique…
-Identify the problem and the conditions, then choose the technique

9
Magnus Rønning, Summer School NTNU 2009
Why in situ characterisation?
Phenomena such as particle size, shape, oxidation state, adsorption, selectivity, deactivation etc. are highly depending on reaction conditions
Should be measured at the relevant conditions
In situ: Characterisation of catalysts at relevant working conditionsOperando: In situ studies with simultaneous activity measurements
Characterisation of real catalysts at real working conditions

10
Magnus Rønning, Summer School NTNU 2009
Reactants
Products
X-rays, -rays, light, electrons…
Absorption Vibration DiffractionReflectanceScatteringTomographyImagingetc.
What is in situ characterisation?
•
We build our reactor into the measuring unit
•
Measurements are being carried out while the catalyst is doing catalysis
•
Simultaneous monitoring of catalytic activity
11
Magnus Rønning, Summer School NTNU 2009
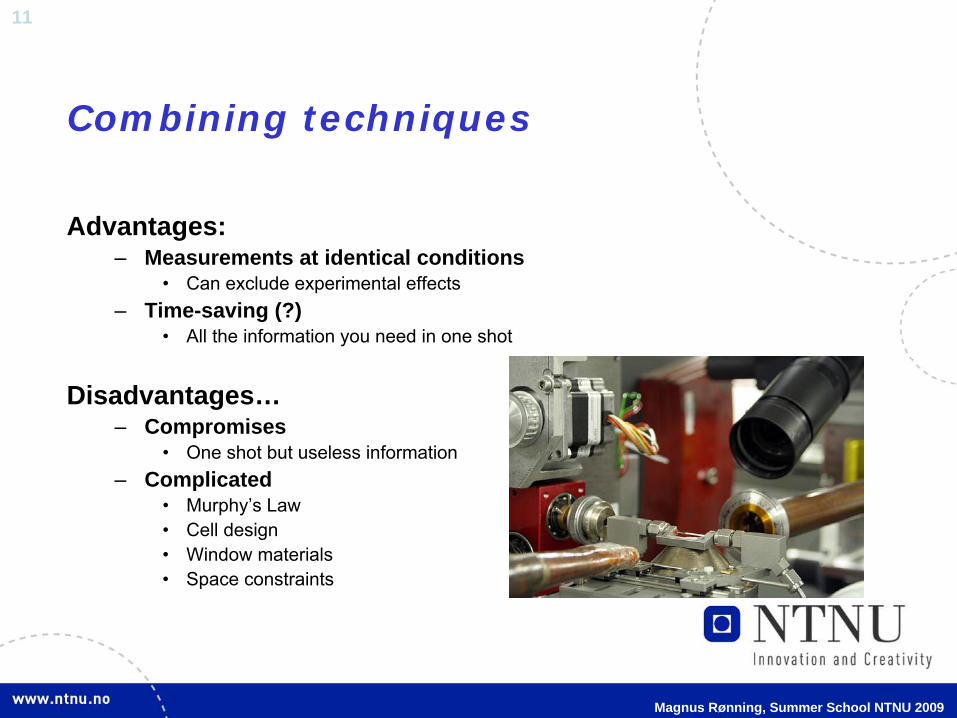
Combining techniques
Advantages:–
Measurements at identical conditions•
Can exclude experimental effects–
Time-saving (?)•
All the information you need in one shot
Disadvantages…–
Compromises•
One shot but useless information–
Complicated•
Murphy’s Law•
Cell design•
Window materials•
Space constraints

12
Magnus Rønning, Summer School NTNU 2009
Combining techniques
Compromises

13
Magnus Rønning, Summer School NTNU 2009
Combining techniques
Example:Combined XAS-XRD-Raman FT synthesis at ESRF:
–
Experimental conditions:•
20 bar pressure•
210ºC•
H2
/CO = 2.1•
MS for product analysis
In situ set-up at SNBL
XAS XRD Raman
Activity data
14
Magnus Rønning, Summer School NTNU 2009
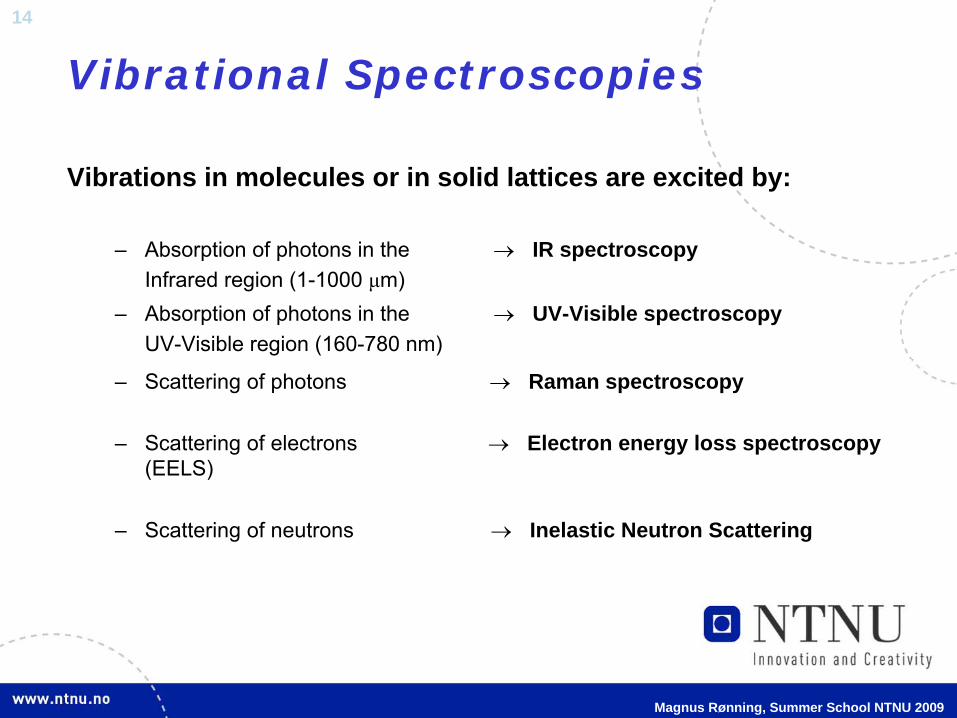
Vibrational Spectroscopies
Vibrations in molecules or in solid lattices are excited by:
–
Absorption of photons in the
IR spectroscopyInfrared region (1-1000 μm)
–
Absorption of photons in the
UV-Visible spectroscopyUV-Visible region (160-780 nm)
–
Scattering of photons
Raman spectroscopy
–
Scattering of electrons
Electron energy loss spectroscopy (EELS)
–
Scattering of neutrons
Inelastic Neutron Scattering

15
Magnus Rønning, Summer School NTNU 2009
Molecular Vibrations•
The potential energy V(r) can be approximated by the Harmonic oscillator:
V(r) = ½
k ( r-req
)2
V(r) = interatomic potentialr = distance between vibrating atomsreq
= equilibrium distance between atomsk = force constant of vibrating bond
•
The harmonic approximation only valid for small deviations from equilibrium, the Morse potential physically more realistic:
V(r) = D (1-ea(r-req))2
-D
D = dissociation energy of the vibrating bonda = parameter which controls the steepness of the potential well

16
Magnus Rønning, Summer School NTNU 2009
Molecular Vibrations and Infrared Spectroscopy
•
Molecules have discrete levels of rotational and vibrational energy•
Absorption of an IR photon causes transitions between vibrational levels•
A chemical functional group absorbs IR photons of a specific wavenumber. E.g. the C-O stretch appears at around 2143 cm-1
•
IR spectroscopy detects the vibration characteristics of chemical functional groups
•
For a molecule to be IR active the vibration must be associated with changes in the dipole moment (H2 , O2 , N2 are IR inactive)
Stretching BendingSymmetric Asymmetric Scissoring Rocking Wagging Twisting
Vibrations of -CH2
-groups Source: Wikipedia

17
Magnus Rønning, Summer School NTNU 2009
Modes of IR Spectroscopy
•
Transmission IR:–
catalyst powder pressed into a disk (diluted)
•
Diffusive reflectance IR (DRIFTS): –
catalyst powder
•
Reflection-absorption IR (RAIRS):–
adsorbates
on a flat metal surface
•
Attenuated total reflection (ATR):–
probes the media in contact with the probe crystal
•
Electron energy loss spectroscopy (EELS):
–
dipole scattering (1) or impact scattering (2) Spectroscopy in Catalysis by J. W. Niemantsverdriet
ATR. Alfons
Baiker
et al. ETH Zürich

18
Magnus Rønning, Summer School NTNU 2009
Monochromatic light (from a LASER) is scattered by a sample:• without loosing energy (Rayleigh)• by loosing energy (Stokes) • a vibrationally
excited mode in the sample is de-excited (anti-Stokes)
Raman spectroscopy
C.V. RamanNoble prize 1930
19
Magnus Rønning, Summer School NTNU 2009
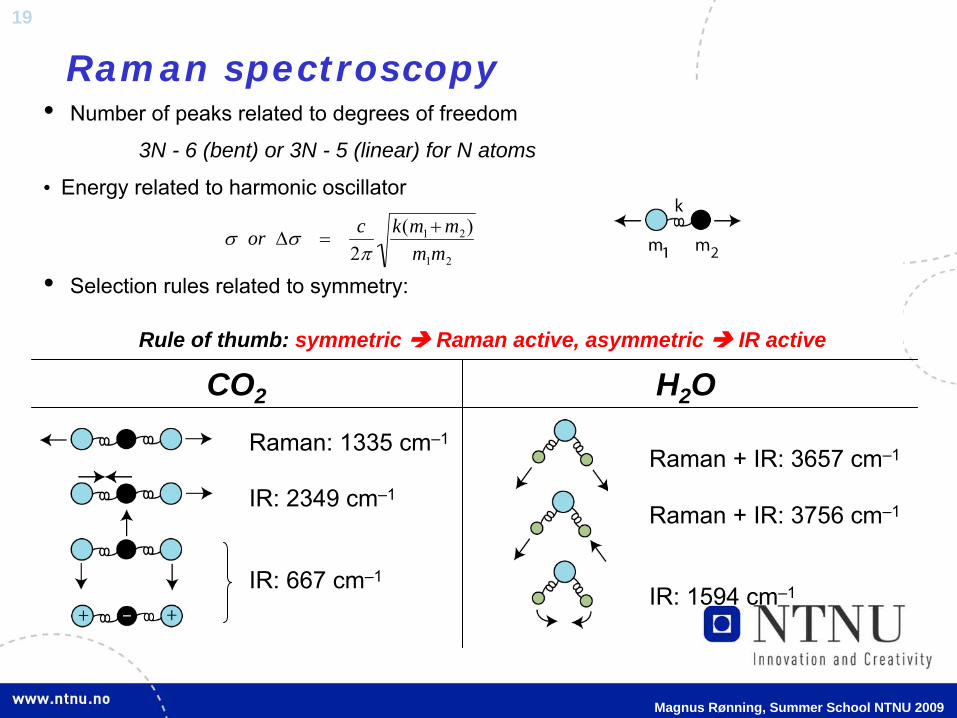
•
Number of peaks related to degrees of freedom
3N - 6 (bent) or 3N - 5 (linear) for N atoms
•
Energy related to harmonic oscillator
•
Selection rules related to symmetry:
Rule of thumb: symmetric Raman active, asymmetric IR active
Raman: 1335 cm–1
IR: 2349 cm–1
IR: 667 cm–1
CO2
or c
2k(m1m2)
m1m2
Raman + IR: 3657 cm–1
Raman + IR: 3756 cm–1
IR: 1594 cm–1
H2 O
Raman spectroscopy
20
Magnus Rønning, Summer School NTNU 2009
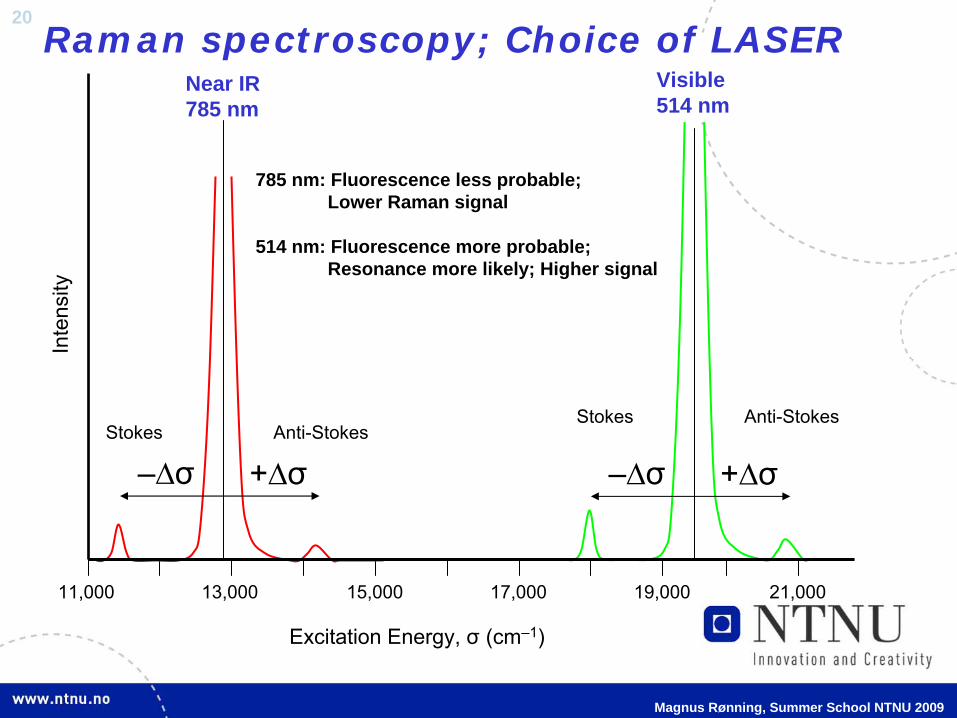
Excitation Energy, σ
(cm–1)
Inte
nsity
11,000 13,000 15,000 17,000 19,000 21,000
Near IR785 nm
Visible514 nm
–∆σ +∆σ –∆σ +∆σStokes Anti-Stokes
Stokes Anti-Stokes
785 nm: Fluorescence less probable;Lower Raman signal
514 nm: Fluorescence more probable;Resonance more likely; Higher signal
Raman spectroscopy; Choice of LASER

21
Magnus Rønning, Summer School NTNU 2009
X-ray Absorption Spectroscopy (XAS)XAS is a structure determination method
–
Is element-specific, i.e. determines the local environment of a chosen element in the sample, within a distance of 5-6 Å
–
Requires no long-range order–
Bulk method
Two modes:
EXAFS–
Extended X-ray Absorption Fine Structure–
Bond distances to neighbouring atoms–
Number of neighbouring atoms–
Type of neighbouring atoms
XANES–
X-ray Absorption Near Edge Spectroscopy–
Can be used as fingerprint–
Oxidation state of central atom–
Site symmetry–
Disorder

22
Magnus Rønning, Summer School NTNU 2009
EXAFS - Basic principle:
P.Behrens, Trends in Analytical Chemistry, 11(7) (1992) 237

23
Magnus Rønning, Summer School NTNU 2009
Measuring EXAFS
Ca. 1 metre
Optical benchMonochromator
Entrance slits Exit slitsI0 detector It detector
Sample
Beam
UHVchamber
sampleincoming beam
transmitted beam
Io
xI
o Il n xI
m=
where μ
is the absorption coefficient
Absorbing atom
Scattering atom
X-ray photon
Outgoing wave
Backscattered wave

24
Magnus Rønning, Summer School NTNU 2009
EXAFS data processing
2
)
R [Å]
4.0
6.0
8.0
10.0
10.5 10.75 11 11.25 11.5
abso
rptio
n [a
.u.]
photon energy [keV]
0.0
0.5
1.0
1.5
2.0
0.0
10.5 10.75 11 11.25 11.5
norm
. abs
orpt
ion
[a.u
.]
photon energy [keV]
0.0
2.0
0.0
-2.0
5 10 15
(k)
*k2
k [Å -1 ]
0.01
0.02
0.03
0.04
0 2 4 6 8
FT(
(k)*
k
a) b)
c) d)
The peaks in the Fourier transform represent the different backscattering shells

25
Magnus Rønning, Summer School NTNU 2009
X-ray diffraction
•
From Peak Position:Unit Cell Dimensions –
d-spacing
Qualitative phase identification
•
From Peak Intensity:Unit cell contents Quantitative phase fractions
•
From Peak Shapes and Widths:Crystallite size (2-200 nm)Non-uniform micro strainExtended defects
2 2 2
arcsin( )2
,
dad N h k lN
Scherrer equation
coshklL
2
exp 2 ( )hkl i i i ii
hkl hkl
F f i hx ky lz
I F

26
Magnus Rønning, Summer School NTNU 2009

27
Magnus Rønning, Summer School NTNU 2009

28
Magnus Rønning, Summer School NTNU 2009
Synchrotron radiation as a tool
Main assets: High flux and tunable source-The Swiss-Norwegian Beam Lines at ESRF
•
Multi-purpose beamline–
Crystallography–
Powder XRD–
XAS–
Raman spectroscopy•
Recently installed gas distribution system (and MS)
–
Up to 20 bar

29
Magnus Rønning, Summer School NTNU 2009
Example I: The Fischer-Tropsch synthesis
Finalproducts
Natural gas/steam
Synthesis gasproduction
Fischer-Tropschsynthesis
Productupgrading
H2COCO2
Oil and wax
Catalyst: Co, Fe, Ru og NiTemperature: 180-350°CPressure: 1-50 bar
•
Gas to liquids (GTL)•
Production of liquid fuels from natural gas

30
Magnus Rønning, Summer School NTNU 2009
Why in situ measurements at actual FT conditions?•
From the Anderson-Schultz-Flory product distribution:–
Only methane and wax (C20+ ) can be produced with high selectivity–
We need to be sure that we have high C5+ selectivity:•
Operation at 20 bar, 210ºC and H2 /CO = 2.1 –
High conversion (~50%) and wax production lead to relevant partial pressures of products (hydrocarbons, oxygenates, water)
C 1
C 2
C 3
C 4
C 5 - C 1 1
C 1 2 - C 2 0
C 2 0 +
0
0 , 2
0 , 4
0 , 6
0 , 8
0 0 , 2 0 , 4 0 , 6 0 , 8 1
P r o b a b i li ty o f c h a i n g r o w th ,
Wei
ght f
ract
ion
of p
rodu
ct, W
n
ASF product distribution:

31
Magnus Rønning, Summer School NTNU 2009
Proposed deactivation mechanisms for Cobalt FT catalysts
•
Sintering–
Particle growth/agglomeration
–
Loss of active surface
•
Reoxidation–
Less cobalt in the active state
–
More pronounced for small Co particles and at high PH2O
/PH2
ratios
•
Solid state reactions–
Formation of inactive cobalt phases (CoAl2
O4
)
•
Coke deposition–
Blocking of active sites by polymeric carbon deposits
A.M. Hilmen et al., Appl. Catal. A 186 (1999) 169G. Jacobs et al., Appl. Catal. A 233 (2002) 215J. van de Loosdrecht et al. Catal. Today,123 (2007) 293A.M. Saib, et al Appl. Catal. A 312 (2006) 12
G. Jacobs et al. Appl. Catal. A 233 (2002) 215T.K. Das et al. Fuel82 (2003) 805M.J. Overett et al. Prepr. Pap.-Am. Chem. Soc., Div. Petr. Chem. 53 (2008) 126
D.J. Moodley et al. Prepr. Pap.-Am. Chem. Soc., Div. Petr. Chem. 53 (2008) 122D.J. Moodley et al. Appl. Catal. A. (2008) doi:10.1016/j.apcata.2008.11.015
X.X Gao et al. Catal. Today 131 (2008) 211A. Moen et al. J. Mater. Chem., 1998, 8(11), 2533

32
Magnus Rønning, Summer School NTNU 2009
Deactivation mechanisms: -Sintering and reoxidation
0
2000
4000
6000
8000
10000
16 17 18 19 20 21 22
20
40
60
80
100
120
140
160
Inte
nsity
2è M
easu
rem
ent
Co3 O4CoO
Co0Co3 O4
CoO
Co0
XANES during reduction
0
2000
4000
6000
8000
1015
2025
100
120
140
160
180
200
Inte
nsity
2è
Mea
sure
men
t
Co0
XANES during FT reaction (210ºC, 18 bar) 6 hrs
XRD during reduction
XRD during FT reaction (210ºC, 10 bar) 4 hours
CoO
Co0

33
Magnus Rønning, Summer School NTNU 2009
Example II: Au/TiO2 catalysts on carbon nanofibres
Au/Oxide/CNFCNF Oxide/CNF
TiO2 Au
N. Hammer, I. Kvande, X. Xu, V. Gunnarsson, B. Tødal, D. Chen, M. Rønning, Catal. Today 123 (2007) 245
Need for different characterisation techniques for obtaining nanoscale structural information
–
(XRD), TEM, XAS
Looking at changes in particle sizes and morphology during reaction–
In situ XAS

34
Magnus Rønning, Summer School NTNU 2009
X-ray Absorption Spectroscopy, Ti K-edge XANES
Energy [keV]4,966 4,968 4,970 4,972 4,974 4,976 4,978 4,980
Nor
m. A
bs
0,0
0,1
0,2
0,3
0,4
0,5
0,6
0,7AsprepCAuTiO2AuCTiO2 CAuCTiO2 AnataseRutile
B
A3A2
A1
The intensity of the pre-edge transitions are sensitive to the symmetry of the surrounding atoms
N. Hammer, I. Kvande, X. Xu, V. Gunnarsson, B. Tødal, D. Chen, M. Rønning, Catal. Today 123 (2007) 245
•Four pre-edge peaks are present
•A1 and B sensitive to distortion and crystallinity
•A2, A3 sensitive to particle size
•Same particle size for unsupported and supported TiO2
•A more distorted environment for supported TiO2
•TiO2
is predominantly present as anatase
•The CNF stabilise the titania and hence the gold particles from sintering

35
Magnus Rønning, Summer School NTNU 2009
X-ray absorption spectroscopy
In situ XASData collected in fluorescence mode for the Au-L3 absorption edgeWGS conditions:Temperature range: 190 ºC – 310 ºC CO:H2 O ratio 1:1
aAu-Au coordination number
Sample Before WGS reaction After WGS reaction
Na dp (nm) Na dp (nm)AuCNF 10.2 3.2 10.8 4.3
1.5wt%AuTiO2 CNF 7.8 1.6 9.5 2.4
1.5wt%AuTiO2 9.2 2.1 11.4 8.4
5wt%AuTiO2 CNF 7.5 1.5 7.5 1.5
5wt%AuTiO2 6.7 1.1 8.3 1.8
Increased coordination number after reaction–
Particle size increases more without CNF
N. Hammer, I. Kvande, W. van Beek, D. Chen, M. Rønning, Topics in Catalysis 45 (2007) 25

36
Magnus Rønning, Summer School NTNU 2009
Example III:Dynamic behaviour of Cu/ZnO-based methanol catalysts
Top panel: Combined in situ EXAFS coordination numbers and on-line methanol synthesis activities for a Cu/ZnO catalyst exposed to different synthesis gases.Bottom panel: Illustration of the wetting/non-wetting changes occurring in different reaction environments.
• Simultaneous in situ EXAFS andon-line activity measurements
• State and activity of the catalystis sensitive to the reduction potential of the synthesis gas
changing morphology of Cu particles with changing reduction potential (= different conversion levels)
• In situ studies allowed formulationof dynamic micro kinetic modelsfor industrial performance
Reference: Halldor Topsøe AS

37
Magnus Rønning, Summer School NTNU 2009
armchair graphite surface zigzag
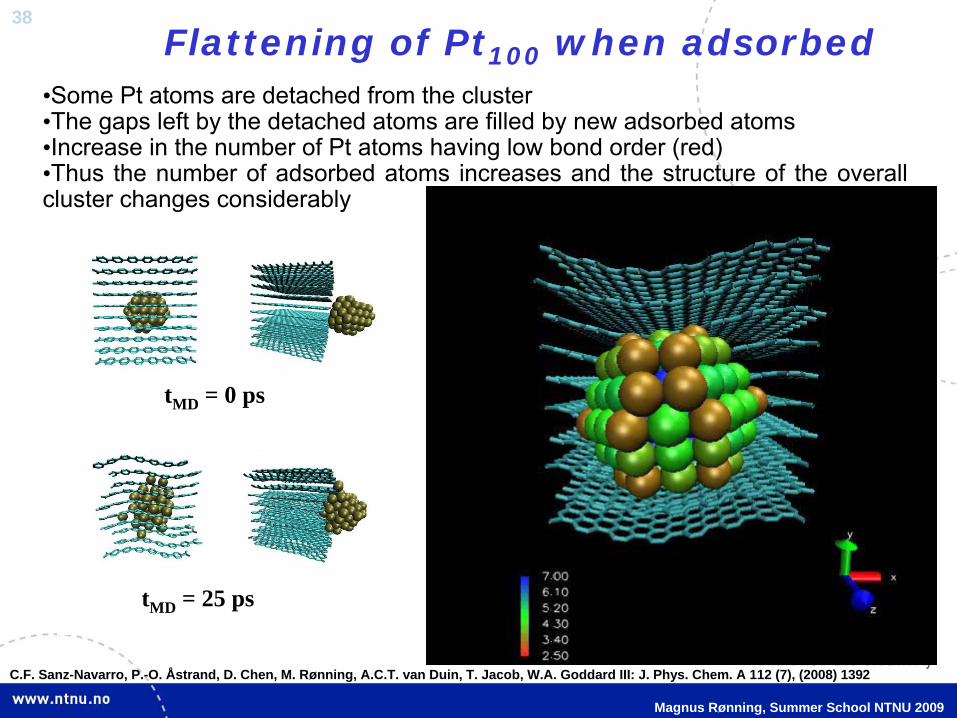
Example IV: Atomistic simulations of binding of Pt clusters to carbon nanostructures
isolated nanocone
C.F. Sanz-Navarro, P.-O. Åstrand, D. Chen, M. Rønning, A.C.T. van Duin, T. Jacob, W.A. Goddard III: J. Phys. Chem. A 112 (7), (2008) 1392
38
Magnus Rønning, Summer School NTNU 2009
Flattening of Pt100 when adsorbed•Some Pt atoms are detached from the cluster•The gaps left by the detached atoms are filled by new adsorbed atoms•Increase in the number of Pt atoms having low bond order (red)•Thus the number of adsorbed atoms increases and the structure of
the overall
cluster changes considerably
tMD = 25 ps
tMD = 0 ps
C.F. Sanz-Navarro, P.-O. Åstrand, D. Chen, M. Rønning, A.C.T. van Duin, T. Jacob, W.A. Goddard III: J. Phys. Chem. A 112 (7), (2008) 1392

39
Magnus Rønning, Summer School NTNU 2009
Flattening of Pt100 when adsorbed•Red atoms at Pt-C interface. Blue further away•Tendency towards longer Pt-C bonds
C.F. Sanz-Navarro, P.-O. Åstrand, D. Chen, M. Rønning, A.C.T. van Duin, T. Jacob, W.A. Goddard III: J. Phys. Chem. A 112 (7), (2008) 1392
40
Magnus Rønning, Summer School NTNU 2009
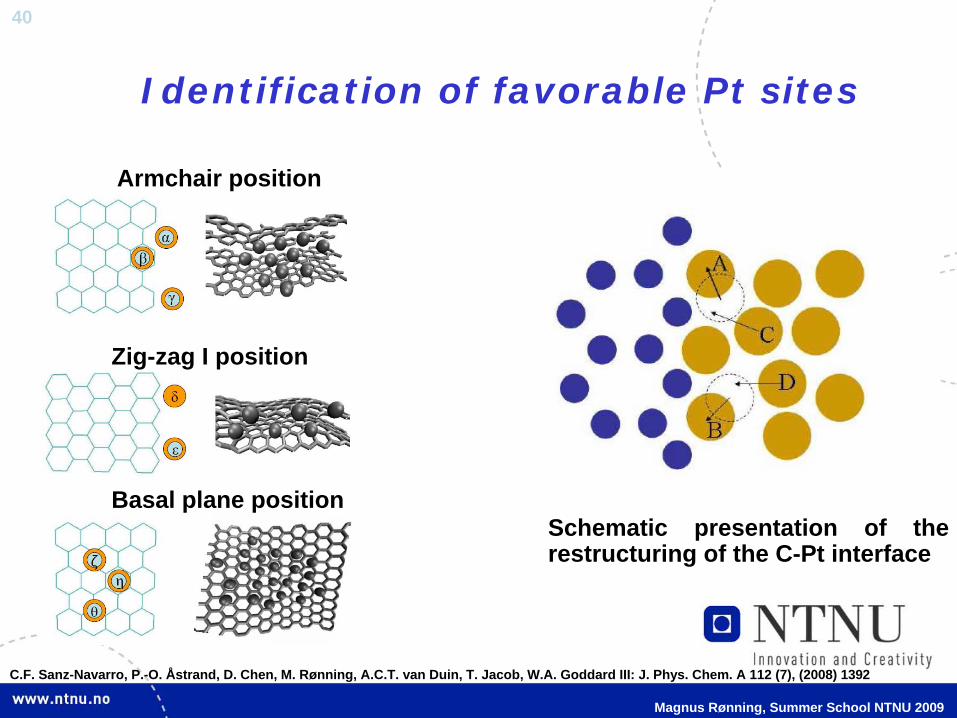
Identification of favorable Pt sites
Schematic presentation of the restructuring of the C-Pt interface
Armchair position
Zig-zag I position
Basal plane position
C.F. Sanz-Navarro, P.-O. Åstrand, D. Chen, M. Rønning, A.C.T. van Duin, T. Jacob, W.A. Goddard III: J. Phys. Chem. A 112 (7), (2008) 1392

41
Magnus Rønning, Summer School NTNU 2009
MD and experiments?
Sample NPt-O/C RPt-O/C NPt--Pt RPt-Pt
Pt foil - - 12 2.77
Pt/CNF 0.6 2.08 5.2 2.76
Molecular dynamics X-ray absorption spectroscopy

42
Magnus Rønning, Summer School NTNU 2009
Finally: Catalyst characterisation using chemical reactions -Reactions over Cu-Ni catalysts of various compositions
Ethane hydrogenolysis:-Structure sensitive (demanding)-Ni is the only active catalyst
Cyklohexane dehydrogenation:-Structure insensitive (facile)-Both Ni and Cu are active catalysts
Ammonia synthesis, Fe crystal planes:-Structure sensitive (demanding)
Reviews by:-G.A. Somorjai: Catal. Lett. 7 (1990) 169-R.A. van Santen: Acc. Chem. Res. 42 (2009) 57
G. Somorjai
et al. J.Catal. (1987)

43
Magnus Rønning, Summer School NTNU 2009
Acknowledgements•
Catalysis group, NTNU: Alexey Voronov, Nikolaos
Tsakoumis, Elisabeth Windstad, De Chen, Anders Holmen
•
SINTEF: Ingvar Kvande, John C. Walmsley (TEM), Pascal Dietzel
•
Dept of Chemistry, UiO: Poul
Norby, Rune E. Johnsen, David Wragg
•
Dept of Chemistry, NTNU: Carlos Sanz-Navarro, Per-Olof Åstrand
•
StatoilHydro: Øyvind Borg, Nina Hammer, Erling
Rytter
•
Swiss-Norwegian Beamlines: Olga Safonova, Wouter van Beek, Hermann Emerich
•
ELETTRA, Trieste: Luca Olivi
•
Funding: Statoilhydro, NFR, NTNU